44
Some advantages and disadvantages of “smart” water metering for single and multi- unit developments Dr Cara Beal IPIQ Seminar & Expo Urban Brisbane Hotel, Spring Hill, November 29 th , 2013

Some advantages and disadvantages of “smart” water metering for single and multi-
unit developments
Dr Cara Beal IPIQ Seminar & Expo
Urban Brisbane Hotel, Spring Hill, November 29th, 2013

Presentation outline
• Background on our research centre & why I am
here today
• What makes a meter “smart”?
• Sub-metering requirements in Qld
• Recent review of smart metering in Australia
Results from the Survey
Business Case Drivers, inc. sub-metering
Conclusions and Insights

Smart Water Research Centre
• Strategic partnership between industry and
universities
• Laboratory services, education & training,
research programs
• Water resource science & research team
- Smart metering and residential water
end-use projects (SEQ, FNQ, UAE)
- Nation-wide review of smart metering /
intelligent water networks

What’s smart about it?
Versus

What’s smart about it?
• Several definitions, e.g. WSAA states:
• Automated collection of meter reads:
• requiring meter reader to be
nearby (Automated Meter
Reading)
• Remote, wireless collection
(Advanced Metering Infrastructure)
• Some have two-way communications

What is an “Intelligent Water Network”?
• Again, several definitions/opinions but in
general:
“The integration of intelligent devices
including water meters, pressure sensors,
data into business process and using this
information to guide and improve strategy,
investment and customer service” – WSAA definition
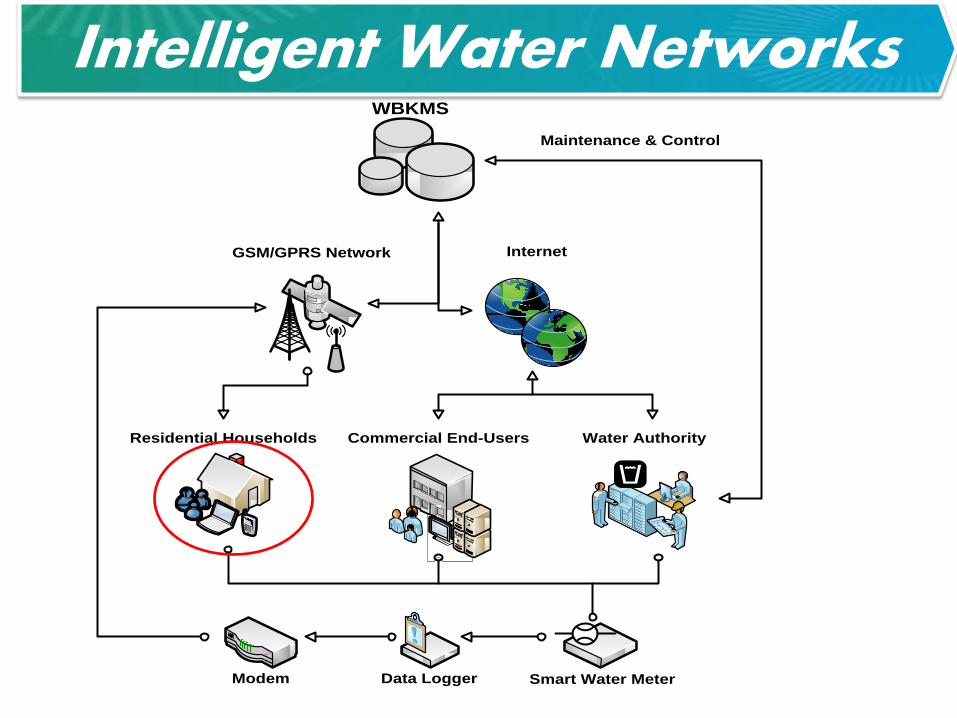
Intelligent Water Networks
Data Logger Smart Water Meter
Commercial End-UsersResidential Households Water Authority
WBKMS
GSM/GPRS Network Internet
Modem
Maintenance & Control

Intelligent Water Networks
Data Logger Smart Water Meter
Commercial End-UsersResidential Households Water Authority
WBKMS
GSM/GPRS Network Internet
Modem
Maintenance & Control
Please make a selection from the following:
News
My Usage and Budget
Water End Use Reports
Comparative Usage
Rebate Schemes
Reduce Your Consumption
View / Pay Bills
Leak alerts
Contacts
Fixture Category
Water Usage (L/hh/d)
Percent (%)
Leak 15.28 2.92
Toilet 83.08 15.87
Clothes washer
70.59 13.49
Shower 186.21 35.58
Dishwasher 12.20 2.33
Tap 77.52 14.81
Irrigation 78.54 15.01
Total 523.42 100
WATER BUSINESS X: INTELLIGENT METERING SYSTEM
Welcome: 5 Smith Street, Brisbane, Queensland Log out
Day - 19 October 2012, Water Consumption End Use Report
Quick Summary: My Usage
Target Usage Per Day: 480 L/hh/d Yesterdays Usage: 496 L/hh/d
Yesterdays Average Daily Household Consumption: 510 L/hh/d
Last Weeks Average Daily Household Consumption: 472 L/hh/d
Leak 2.92%
Toilet 15.87%
Tap 14.81%
Shower 35.58%
Clotheswasher
13.5%
Irrigation 15.87%
Dishwasher 2.33%

Sub-metering in multi-unit properties

Sub-metering
• Condition to sub-meter multi-unit properties
(MUP) introduced in 2007 for 2008 start
• Very narrow window (1 week!) for stakeholder
comment prior to introduction of policy
• Help track individual dwellings water
consumption, streamline water charges and
promote customer equity (pay for what you use)
• AMR or basic smart meter requirements
• Developer required to ensure master and sub-
meters are installed………

Sub-metering – challenges!
• Costs high - for developer and building owners &
for LGA’s to inspect, assess, approve
• Difficult to streamline the installation process as
requirements differ across LGA’s and water
service providers
• Ambiguity of sub-metering requirements on
existing buildings and extensions
• Often, water service provider does not read /
bill from sub-meter
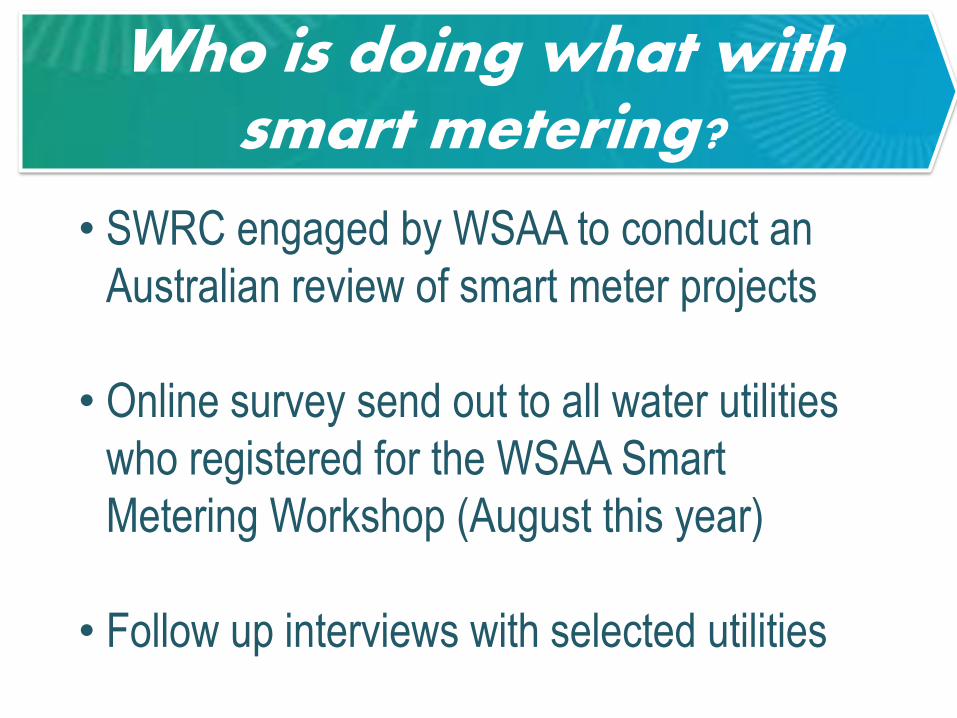
Who is doing what with smart metering?
• SWRC engaged by WSAA to conduct an
Australian review of smart meter projects
• Online survey send out to all water utilities
who registered for the WSAA Smart
Metering Workshop (August this year)
• Follow up interviews with selected utilities

On-line survey
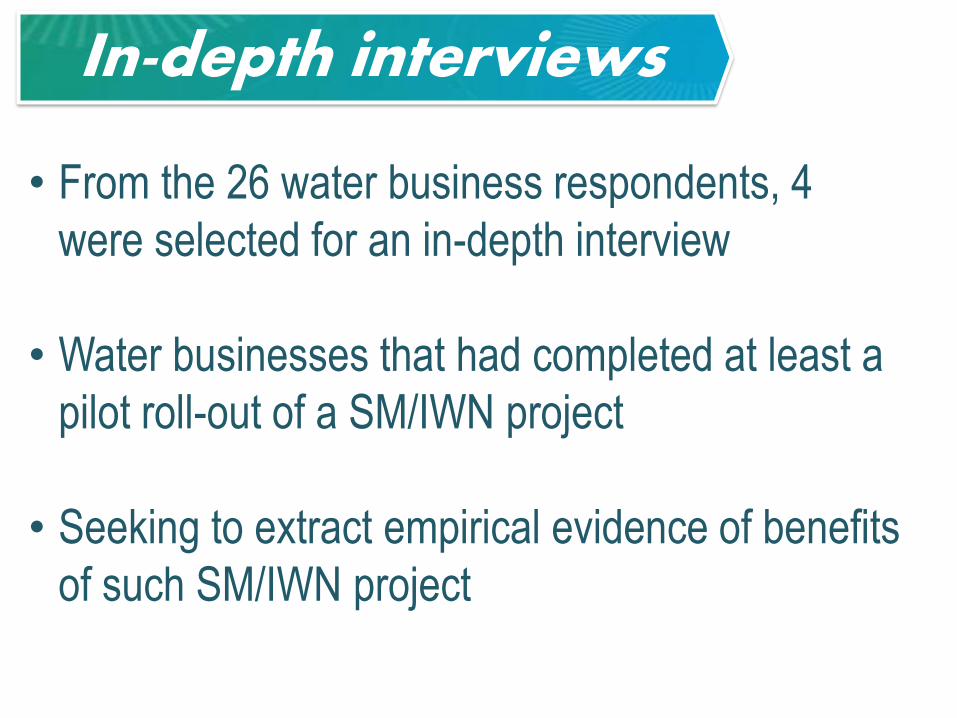
In-depth interviews
• From the 26 water business respondents, 4
were selected for an in-depth interview
• Water businesses that had completed at least a
pilot roll-out of a SM/IWN project
• Seeking to extract empirical evidence of benefits
of such SM/IWN project

Review of Smart Metering…

Project status
4 (14%)
4 (14%)
1 (4%)
6 (21%)
1 (4%)
2 (7%)
3 (11%)
1 (4%)
2 (7%)
4 (14%)
0 1 2 3 4 5 6 7
Initial discussions only
Currently developing business case
Trial phase being developed
Trial phase underway
Trial phase completed and no further work likely
Trial phase completed and developing business case forlarger roll-out
Operational roll-out currently underway
Operational roll-out completed and no further action
Operational roll-out completed and subject to ongoingevaluation and assessment
Other
Project status"Monitoring developments in
water industry application"
"Gathering involving usage
information from 150 smart
meters"
"None planned"
"Seeking funding"
96% were
actively
pursuing
SM/IWN
project
16 utilities
(58%) in
trial or
roll-out
phase
70%
current or
starting in
next year
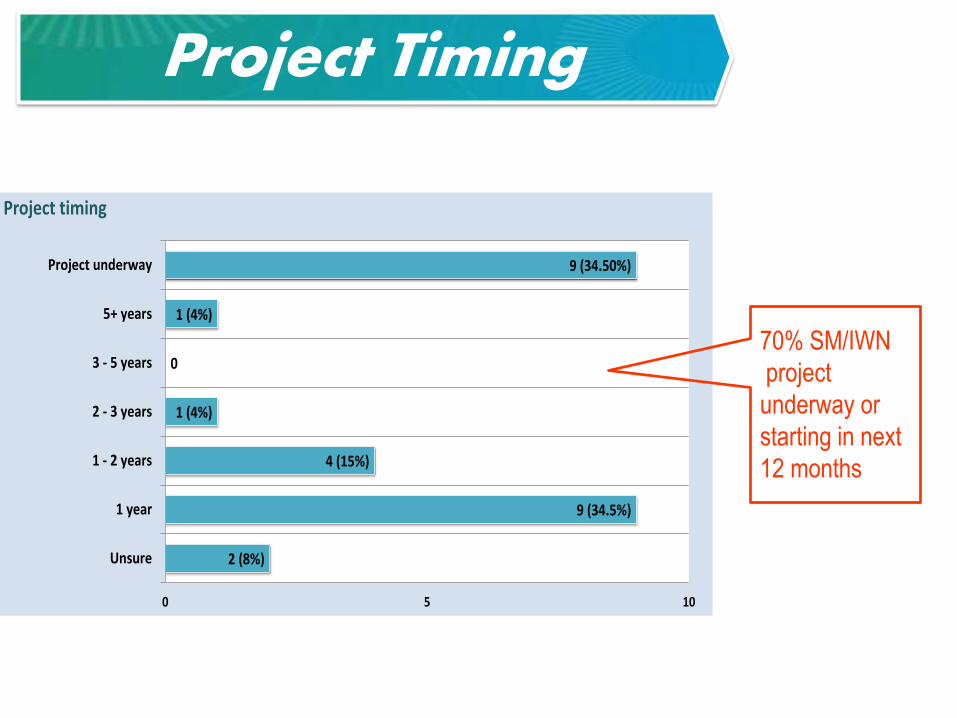
Project Timing
2 (8%)
9 (34.5%)
4 (15%)
1 (4%)
0
1 (4%)
9 (34.50%)
0 5 10
Unsure
1 year
1 - 2 years
2 - 3 years
3 - 5 years
5+ years
Project underway
Project timing
70% SM/IWN
project
underway or
starting in next
12 months

Applied Technology
6 (22%)
9 (33%)
5 (19%)
3 (11%)
4 (15%)
0 5 10
AMR
AMI
SWM
IWN
n/a
Applied technology
0ver 50% are
pursuing 2 way
communications
11% business
integration

Where are the meters?
9 (36%)
1 (4%)
1 (4%)
1 (4%)
1 (4%)
3 (12%)
1 (4%)
2 (8%)
6 (24%)
0 5 10
Residential - Single residential
Residential - Dual reticulated
Residential - Multi residential
Non-residential (unsure of…
Agricultural - Farm
Commercial - Other
Commercial - School
Industrial
Unsure / Not applicable
Customer type breakdown
Residential
properties
typically metered

How many meters?
57,920 36,000
21,000 13,800
12,700 5,0002,000 1,500 300 289 200 190150 150 100 15 8
0 10,000 20,000 30,000 40,000 50,000 60,000
TasWater, TASMackay, QLDAlbury, NSW
Water Corp, WAGM Water, VIC
City West Water, VICYarra Valley, VIC
South East Water, VICSydney Water, NSW
Townsville, QLDArmidale-Dumaresq
ACTEWGoulburn Valley, VIC
SA WaterBarwon
Hunter Valley, NSWUnitywater, QLD
Number of end points
Range of
trials and
full scale
roll-outs

Communicating… how?
1 (3%)
6 (18%)
3 (9%)
9 (28%)
5 (15%)
5 (15%)
4 (12%)
0 5 10
Power linecommunications (PLC)
Low-power radiofrequency (RF) mesh
Wireless wide-areanetwork (WAN)
Mobile phone network(3G)
Drive-by technology
Not applicable
Other
Communication system"Walk by"
"Microwave data communications"
"Low power radio but not mesh"
"SCADA"
46% using or plan
to use mobile
phone and radio
frequency comms

Communicating…when?
2 (8%)
2 (8%)
3 (11%)
8 (32%)
8 (32%)
2 (8%)
0 5 10
As per billing cycle
15 minute intervals
Hourly
Daily
Not applicable
Other
Communications frequency
"Selected by council"
"Variable, 3 times per day"
Over 50%
communicating at
least daily

Engaging the customer
Utility 1
Utility 2
Utility 3
Utility 4
Utility 5
Utility 6
Utility 7
Utility 8
Utility 9
Utility 10
Utility 11
Utility 12
Utility 13
Utility 14
Utility 15
Customer engagement / recruitment strategies
Letter mail out
Hand delivered brochure
1300 number
Community group consultation
Door knock/Direct phone call
Shopping centre kiosk
Website
Media -newspaper
Media - radio
SMS / email
Marketing company
Most utilities doing some form
of customer engagement

Popularity of strategies
9 (23%)
8 (21%)
5 (13%)
4 (10%)
4 (10%)
3 (8%)
2 (5%)
1 (3%)
1 (3%)
1 (3%)
1 (3%)
0 5 10
Letter mail out
Community group consultation
Door knock/Direct phone call
Website
Media -newspaper
1300 number
Media - radio
Shopping centre kiosk
Hand delivered brochure
SMS / email
Marketing company
Frequency distribution of customer engagement strategies
Traditional methods of engagement
and consultation adopted

What else for customers?…
18 (30%)
7 (12%)
5 (8%)
5 (8%)
2 (3%)
6 (10%)
8 (13%)
6 (10%)
4 (6%)
0 5 10 15 20
Leakage alert
Benchmarking - with street or suburb
Benchmarking - with similar demographic households
Predictive alerts
Demand-based tariff reforms
Personalised consumption budgets
Self service
Not applicable
Other
New customer services plannedPortal for communication with utility
Comparing school with previous performance
and school benchmarks
Customers to check their smart phone app
Customers could subscribe to auto-SMS alert

Hey! You’re leaking!
9 (21%)
8 (18%)
7 (16%)
2 (4%)
6 (14%)
7 (16%)
5 (11%)
0 5 10
SMS
Smartphone app
Next bill
Not applicable
Other
Customer leakage alert method Web portal
Direct phone call or mail
Letter with information brochure
Site visit if severe
SCADA
Non-traditional methods of alerting,
popular choice for utilities
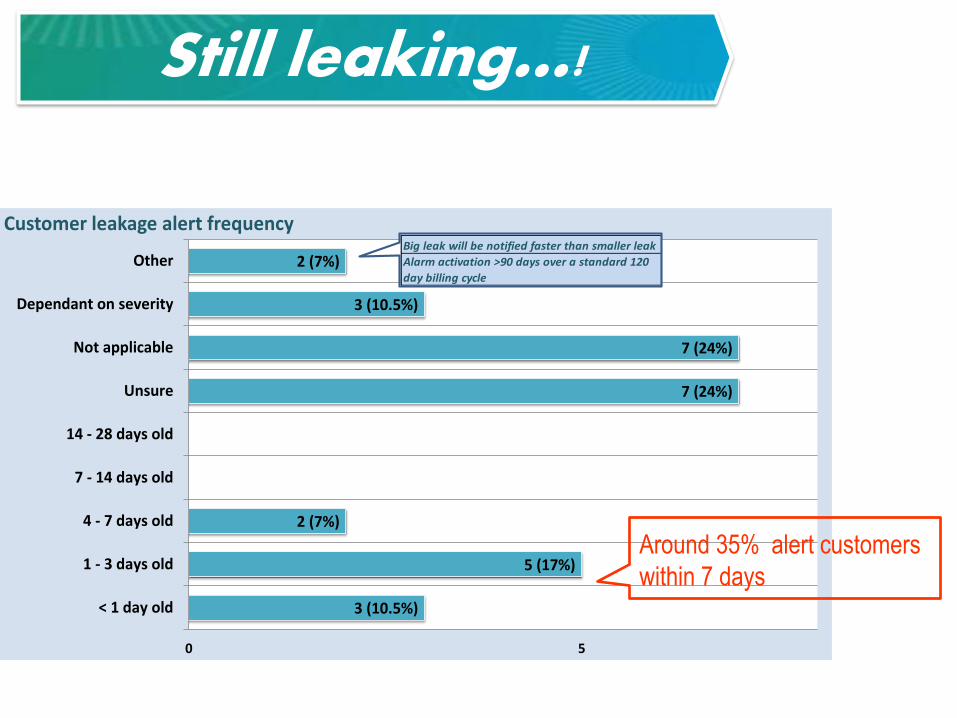
Still leaking…!
3 (10.5%)
5 (17%)
2 (7%)
7 (24%)
7 (24%)
3 (10.5%)
2 (7%)
0 5
< 1 day old
1 - 3 days old
4 - 7 days old
7 - 14 days old
14 - 28 days old
Unsure
Not applicable
Dependant on severity
Other
Customer leakage alert frequencyBig leak will be notified faster than smaller leak
Alarm activation >90 days over a standard 120
day billing cycle
Around 35% alert customers
within 7 days

Business case drivers

BUSINESS CASE REVIEW FOR MULTI-LEVEL DEVELOPMENT AMI PROJECT (CITY WEST WATER, VIC)
Using WSAA definitions – CWW 10k AMR meters existing in field, (walk-by remotes). This has been part of CWW remote metering strategy for a number of years and is still being rolled out for single meters that are deemed as inaccessible.
6-month trial for Everblu AMI was on 100 endpoint development, which
after successful trail, a decision was made to purchase Everblu hardware installed at site. Included in $45k purchase price was a software licence for a further 5000 endpoints, to be implemented for new developments.
CWW AMI Strategy is now that any application for a development that exceeds 4 levels will now need to have an AMI installed (Everblu), with the costs being met by the developer.
Business case - MUP

Business Case Driver
Outcome relating to driver Comments / assumptions
More accurate meter reads
• Identified previously that approximately 50 kL of water underestimated for several years.
Assuming 440 L/meter at Step 1 (1.78c/kL). Conservative estimate.
Reduced operating costs
• Estimate $45k annual savings associated with improving manual & special read efficiency
• If 50kL now accounted for = $89k savings in future.
• Reduced customer contact calls due to accurate and remote reading
Based on costs of scheduled reads, $0.70c, and out-of-cycle (OOC) reads, $7.00 (approx. costs), with 5000 endpoints on Everblu and 20% of meters requiring an OOC read:
5000 x 4 reads p.a. = $14k
1000 OOC reads = $7k
Totals cost of reads = $21k
Cost of annual Everblu licence = $4.5k
Leak detection and improved customer services
• Internal leaks detected more regularly and informed customer.
• Reduced customer queries and complaints due to inaccurate billing – from 270 to almost none.
Customer service improvement through leak detection and alert, more so a secondary driver.

Water and Co$t Saving$
COST SAVINGS
Reduced OPEXReduced manual
meter readsReduce customer
complaint handlingCAPEX deferral
“Water supplied to town
had reduced by almost
834 ML (2010-2012),
resulting in a $3M savings
for water supplied”
“By reducing monthly peak
demand by 10%, can defer
$100M infrastructure for 4 years,
representing savings of $20M
NPV”
“Bulk water reduced
by 3,800 ML”
“Deferring $20M WTP upgrade for 7 years,
representing capital efficiency savings of $7.9M.
Deferring $5M pipeline upgrade for 5 years,
representing capital efficiency savings of $1.6M.”
“approx. 270 queries/yr due
to inaccurate billing, down
to almost none” “Residential water use
reduced by 11% to 310 kL /
year in 2011-12”

Increase Revenue
INCREASE REVENUE
Reduced non-revenue water
Improve accuracy of meter reads
Underpin tariff reform
Streamline special meter reads
“Identified approximately 50 kL
of water was previously
underestimated “
“Two-part pricing able to be introduced (variable
and fixed) from July 2012
Now all 20 mm connections = same service fee and
one rate of 0.90c /kL.”

The customer benefits…
CUSTOMER SATISFACTION
Reduced water bill due to leak alerts
Informative and personalised billing
Instant verification of water bill queries
Eliminate need to access property
“Customer billing now includes trending data and
comparative benchmarks for water usage for
average households”

The community benefits too..
COMMUNITY / SOCIAL
Increased goodwill in community
Proactive approach “approved” by
community
Better education & awareness of water value
“WaterSense campaign and polling indicated 75% of
customers likely to change behaviour toward
water use”
“Before and after survey
showed customers clearly
happier with greater focus
on them and a more equitable
price structure”

Challenges & Limitations

Technical
TECHNICAL
Technology became out-dated and easily
damaged
Compatibility of meter –communication systems
Difficulties with customer portal –privacy concerns
Variability in walk / drive by signals
Strong opportunities to narrow
the gap between what we
want to do in the field, and
what we can currently do

Knowledge limitations
LIMITED KNOWLEDGE BASE
Lack of know-how of suitable technologies: “what, where & why”?
Few existing business cases showing
quantifiable outcomes
Limited industry knowledge & experience
in rolling out projects
Need to improve the knowledge base:
• further pilot trials
• research and development
• education and training

Making a case..
DEVELOPING BUSINESS CASE
Reluctance from internal hierarchy
Silo nature of water utilities / councils
Lack of precedence of other SM/IWN
Existing industry standards insufficient for
business needs

Practical issues
PRACTICAL
Length of time to install and commission meters
Absence of existing business systems
and workflows
Data management and data analytics – how to
maximise benefits of data
Engaging non-residential customers to act on leak
alerts
“We have a lot of information,
but didn’t have anything to tie
it together”
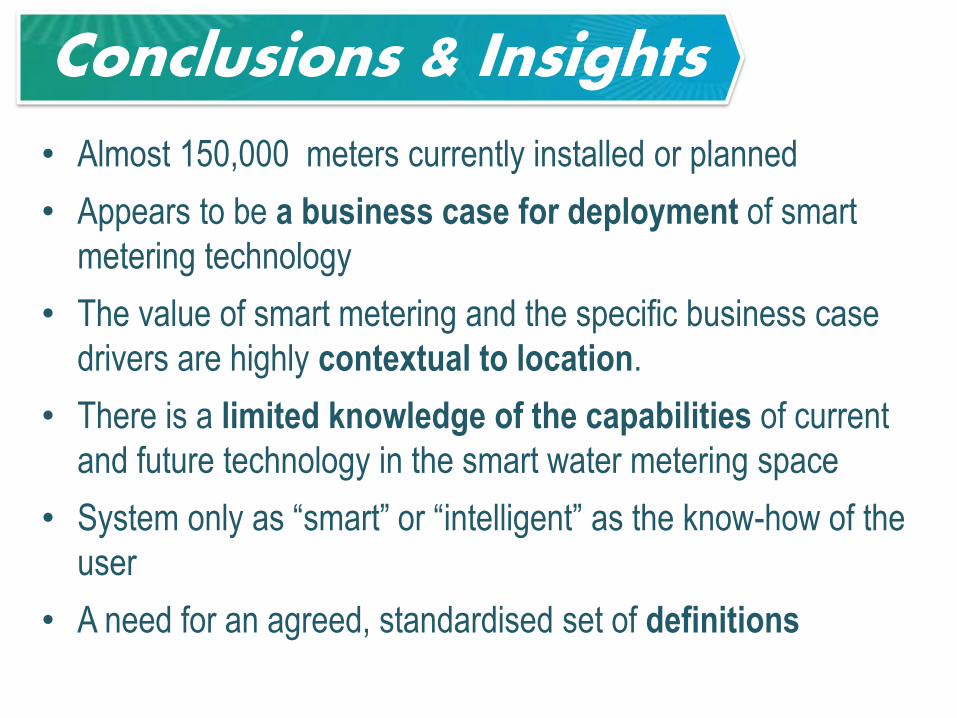
Conclusions & Insights
• Almost 150,000 meters currently installed or planned
• Appears to be a business case for deployment of smart
metering technology
• The value of smart metering and the specific business case
drivers are highly contextual to location.
• There is a limited knowledge of the capabilities of current
and future technology in the smart water metering space
• System only as “smart” or “intelligent” as the know-how of the
user
• A need for an agreed, standardised set of definitions

Is there a business case for (sub) smart metering?
• Case study interviews suggest that while the numbers are still
being crunched, there is good evidence to suggest economic,
environmental and social benefits
• Business drivers: operating cost savings, reduction in bulk
water supplied, deferred augmentation of infrastructure.
• Business drivers: customer satisfaction, community
acceptance and improved customer engagement and trust
• BUT – water utilities need to read and bill the sub-meters!!

Acknowledgements
• Joe Flynn (Joe Flynn & Associates)
• WSAA Smart Metering group
• Water businesses who took the survey!

Thank you [email protected]


