Some approaches to improve ventilation system in underground coal mines environment – A computational fluid dynamic study Agus P. Sasmito ⇑ , Erik Birgersson, Hung C. Ly, Arun S. Mujumdar Minerals Metals Materials Technology Centre (M3TC), National University of Singapore, 9 Engineering Drive 1, Singapore 117576, Singapore article info Article history: Received 18 October 2011 Received in revised form 13 April 2012 Accepted 7 September 2012 Available online 20 December 2012 Keywords: Air ducts Brattice Cross-cut region Gas control Rapid mining abstract This study addresses gas control in a typical ‘‘room-and-pillar’’ structure in an underground coal mine via mathematical model utilizing commercial computational fluid dynamic software. In essence, the model considers conservation of turbulent mass, momentum, species, and energy. Several turbulence models are tested and compared with published experimental data; good agreement between model prediction and experimental data is obtained for Spallart–Almaras turbulence model. Various design features were evaluated, e.g., flow stopping designs for improved quality (e.g., removal of contaminants) and quantity control (e.g., magnitude and direction of airflow). We further focus on the cross-cut region where rapid mining development take place, several ventilation scenarios with and/or without additional auxiliary ventilation are investigated for effective removal of methane. Two different cutting scenarios in rapid mining development are also evaluated. The advantages and limitations of each design are discussed and compared not only in terms of quality and quantity, but also in terms of the overall pressure drop which represent the associated cost of ventilation system. Ó 2012 Elsevier Ltd. All rights reserved. 1. Introduction Coal has become one of our most important energy resources and will remain so in the foreseeable future. Presently, coal avail- ability in surface mines is decreasing, whence one has to go deeper underground to mine coal. However, an underground coal mine is one of the most dangerous working environments since the pres- ence of methane and coal dust can result in explosions and/or health issues for miners. Several underground coal-mining acci- dents with fatalities have received much attention around the world: for example, over 1000 casualties in Courrieres France in 1906; 14 dead miners in the 8th Coalbed at San Nicolas (Asturias, Spain) in 1995; a total of 106 dead coal miners in 17 explosions in USA since 1980. More recent explosions of methane are summa- rized in Table 1. In order to ensure a safe and productive environment in an underground coal mine, a good ventilation system is mandatory. According to US law, the methane concentration should be less than 3% or greater than 20% and the oxygen concentration should be less than 10% in sealed areas to avoid explosions (NIOSH, 2011). In other countries, the regulation of permissible methane concen- tration is slightly lower: e.g., 1% in Germany, 1.25% in UK, 2% in France and 2.5% in Spain (Noack, 1998). A good ventilation system should ensure that the regulatory limits are met throughout the mine whilst also providing miners with sufficient fresh air and keeping operating costs to a minimum. The latter is important as a ventilation system can account for up to 60% of the total operating cost (Reddy, 2009) – the high cost is mainly due to the power needed to drive the air flow through var- ious parts of the mine. There are thus two main competing require- ments that have to be balanced: safety and cost, for which careful ventilation design is mandatory. Over the past decade, mathematical and computational model- ing has come to play an important role in the research and devel- opment of cost-effective ventilation system in underground mines. Herdeen and Sullivan (1993) were among the first who introduced computational fluid dynamics (CFDs) to investigate flow airflow ventilation in mines; however, their model was not validated against experimental data. Srinivasa et al. (1993) employed com- mercial CFD software to predict dust distribution in longwall face utilizing Eulerian–Lagrangian formulation. Uchino and Inoue (1997) validated their CFD model against blowing ventilation data from experimental counterpart. Tomata et al. (1999) extend the CFD model by including species equation to predict methane dis- persion. Wala et al. (2003) developed CFD model for longwall ven- tilation and validated the model with lab scale data for methane concentration. Canoo (2004) developed multiphase Eularian model to predict dust behaviour in more complex geometries. While Parra 0886-7798/$ - see front matter Ó 2012 Elsevier Ltd. All rights reserved. http://dx.doi.org/10.1016/j.tust.2012.09.006 ⇑ Corresponding author. Present address: Mechanical Engineering, Masdar Insti- tute of Science and Technology, P.O. Box 54224, Abu Dhabi, United Arab Emirates. Tel.: +971 2 810 9320. E-mail address: [email protected](A.P. Sasmito). Tunnelling and Underground Space Technology 34 (2013) 82–95 Contents lists available at SciVerse ScienceDirect Tunnelling and Underground Space Technology journal homepage: www.elsevier.com/locate/tust
Transcript
Tunnelling and Underground Space Technology 34 (2013) 82–95
Contents lists available at SciVerse ScienceDirect
Some approaches to improve ventilation system in underground coal minesenvironment – A computational fluid dynamic study
Agus P. Sasmito ⇑, Erik Birgersson, Hung C. Ly, Arun S. MujumdarMinerals Metals Materials Technology Centre (M3TC), National University of Singapore, 9 Engineering Drive 1, Singapore 117576, Singapore
a r t i c l e i n f o
Article history:Received 18 October 2011Received in revised form 13 April 2012Accepted 7 September 2012Available online 20 December 2012
This study addresses gas control in a typical ‘‘room-and-pillar’’ structure in an underground coal mine viamathematical model utilizing commercial computational fluid dynamic software. In essence, the modelconsiders conservation of turbulent mass, momentum, species, and energy. Several turbulence modelsare tested and compared with published experimental data; good agreement between model predictionand experimental data is obtained for Spallart–Almaras turbulence model. Various design features wereevaluated, e.g., flow stopping designs for improved quality (e.g., removal of contaminants) and quantitycontrol (e.g., magnitude and direction of airflow). We further focus on the cross-cut region where rapidmining development take place, several ventilation scenarios with and/or without additional auxiliaryventilation are investigated for effective removal of methane. Two different cutting scenarios in rapidmining development are also evaluated. The advantages and limitations of each design are discussedand compared not only in terms of quality and quantity, but also in terms of the overall pressure dropwhich represent the associated cost of ventilation system.
� 2012 Elsevier Ltd. All rights reserved.
1. Introduction
Coal has become one of our most important energy resourcesand will remain so in the foreseeable future. Presently, coal avail-ability in surface mines is decreasing, whence one has to go deeperunderground to mine coal. However, an underground coal mine isone of the most dangerous working environments since the pres-ence of methane and coal dust can result in explosions and/orhealth issues for miners. Several underground coal-mining acci-dents with fatalities have received much attention around theworld: for example, over 1000 casualties in Courrieres France in1906; 14 dead miners in the 8th Coalbed at San Nicolas (Asturias,Spain) in 1995; a total of 106 dead coal miners in 17 explosions inUSA since 1980. More recent explosions of methane are summa-rized in Table 1.
In order to ensure a safe and productive environment in anunderground coal mine, a good ventilation system is mandatory.According to US law, the methane concentration should be lessthan 3% or greater than 20% and the oxygen concentration shouldbe less than 10% in sealed areas to avoid explosions (NIOSH, 2011).In other countries, the regulation of permissible methane concen-
ll rights reserved.
al Engineering, Masdar Insti-Dhabi, United Arab Emirates.
ito).
tration is slightly lower: e.g., 1% in Germany, 1.25% in UK, 2% inFrance and 2.5% in Spain (Noack, 1998).
A good ventilation system should ensure that the regulatorylimits are met throughout the mine whilst also providing minerswith sufficient fresh air and keeping operating costs to a minimum.The latter is important as a ventilation system can account for upto 60% of the total operating cost (Reddy, 2009) – the high cost ismainly due to the power needed to drive the air flow through var-ious parts of the mine. There are thus two main competing require-ments that have to be balanced: safety and cost, for which carefulventilation design is mandatory.
Over the past decade, mathematical and computational model-ing has come to play an important role in the research and devel-opment of cost-effective ventilation system in underground mines.Herdeen and Sullivan (1993) were among the first who introducedcomputational fluid dynamics (CFDs) to investigate flow airflowventilation in mines; however, their model was not validatedagainst experimental data. Srinivasa et al. (1993) employed com-mercial CFD software to predict dust distribution in longwall faceutilizing Eulerian–Lagrangian formulation. Uchino and Inoue(1997) validated their CFD model against blowing ventilation datafrom experimental counterpart. Tomata et al. (1999) extend theCFD model by including species equation to predict methane dis-persion. Wala et al. (2003) developed CFD model for longwall ven-tilation and validated the model with lab scale data for methaneconcentration. Canoo (2004) developed multiphase Eularian modelto predict dust behaviour in more complex geometries. While Parra
L length of the mine, mM mean molecular massp pressure, PaPr PrandtlQ volume flow rate, m3 s�1
R universal gas constant, J kg�1 mol�1 K�1
Sc SchmidtT temperature, KU, u velocity, m s�1
w width of the mine, m
Greekq density, kg m�3
C fan polynomial constantl dynamic viscosity, Pa s�1
xi mass fraction of species i
Subscripts and superscriptsb braticedev developmenti species iin inletout outletref reference
Table 1Major coal mine explosion incidents (Dubinski et al., 2011).
Country Date Coal mine Number offatalities
China 14 February2005
Sunjiawan, Haizhou shaft, Fuxin 214
Kazakhstan 20September2006
Lenina, Karaganda 43
USA 2 June 2006 Sago, West Virginia 12Russia 19 March
2007Ulyanovskaya, Kemerovo 108
Ukraine 19November2007
Zasyadko, Donetzk 80
China November2009
Heilongjiang 104
USA 5 April 2010 Upper Big Branch, Montcoal,West Virginia
38
Russia 8 May 2010 Raspadskaja, Mezhdurechensk 66New
Zealand19November2010
River Pike 29
Columbia 26 January2011
La Preciosa, Sardinata 21
Pakistan 20 March2011
Sorange district of Pakistan 45
Ukraine 29 July 2011 Suhodolskaya–Vostochnaya coalmine
19
China 29 October2011
Xialiuchong mine in Hengyangof Hunan province
29
A.P. Sasmito et al. / Tunnelling and Underground Space Technology 34 (2013) 82–95 83
et al. (2006) simulated flow behaviour in underground tunnel andvalidated against experimental counterpart. Two different ventila-tion scenarios, i.e., blowing and exhausting were investigated. Har-greaves and Lowndes (2007) simulated blowing ventilation inmine development region in terms of flow velocities; effect of addi-tional scrubber was also investigated. Aminosadati and Hooman(2008) studied the effect of brattice length to the air flow velocityin the cross-cut region via CFD simulation. Zheng and Tien (2008)simulated the diesel particulate exhaust from mining machine inroom and pillar mines via CFD simulation. Torano et al. (2009)compared various turbulence models with experimental data forflow velocities in underground tunnel and evaluated methane dis-tribution in the underground tunnel. Ren and Balusu (2009) inves-tigated inertization in longwall gob with 3D CFD model. Liu et al.(2009) developed 3D multiphase flow model for longwall mining;the distribution of air with and without vapour were compared.Continuing their previous work, Torano et al. (2011) added dustto their model and validated the dust behaviour in undergroundtunnel with experimental data; they also compared performanceof blowing and exhausting ventilation. Wang et al. (2011) evalu-ated the effectiveness of air curtain for dust control in long wallshearer using CFD model. Recently, Diego et al. (2011) discussedadvantages and limitations of CFD modeling for underground min-ing. They also showed practical use of CFD model which can be ex-tended to account for mining auxiliaries. Although numerous CFDstudies have been conducted in mine ventilation area, less workshave been done with the aim to develop cost-effective ventilationdesign by evaluating several possible design and scenarios with re-gards to the safety, productivity and cost.
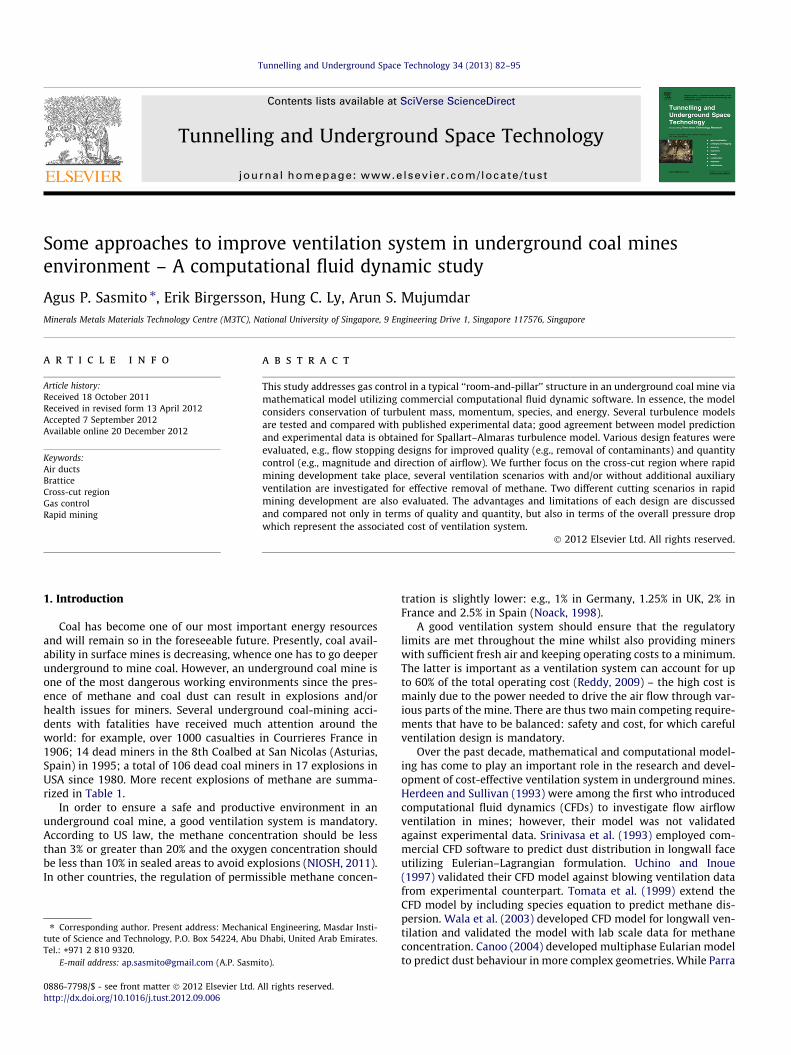
In light of the competing requirements, this study aims toinvestigate methane and oxygen distribution in an undergroundcoal mine via mathematical modeling in order to improve the ven-tilation design and to reduce the cost whilst still satisfying safetyand productivity requirements. In short, flow behaviour in typical‘‘room and pillar’’ mine structure (see Fig. 1a) is simulated withand without auxiliary equipment such as flow stopping, brattice,blowing and exhausting fans. Furthermore, in the mine develop-ment region (see Fig. 1b), two different cutting scenarios, i.e., right-and left-cutting, are simulated to ascertain the methaneaccumulation.
The layout of this paper is as follows. First, the mathematicalmodel is introduced; it is comprised of turbulent conservationof mass, momentum, species and energy. The model is thensolved numerically using the commercial computational fluiddynamics solver, Fluent 6.3. Four different turbulent model, i.e.,Spallart–Almaras, k-Epsilon, k-Omega and Reynolds Stress Model(RSM), are compared with experimental data of flow in under-
ground mine by Parra et al. (2006). Various flow stopping designsare then simulated with regards to the flow distribution, methaneaccumulation and pumping power required. We further examinethe cross-cut region where the active mining takes place andpossible methane accumulation is high. Six different ventilationscenarios are investigated with respect to the methane accumula-tion. Two different mine development (cutting) scenarios areevaluated and compared not only in terms of methane accumula-tion but also change in the system characteristic curve. Finally,conclusions are drawn and extensions of the work arehighlighted.
2. Model formulation
Three-dimensional underground coal mining models weredeveloped for (i) typical ‘‘room and pillar’’ mining with the sizeof 46 � 74 � 2.9 m (see Fig. 1a); (ii) cross-cut region where the
Fig. 1. Schematic views of (a) an underground room and pillar mine entity; (b) a close-up of a mining development region; and (c) underground tunnel for validation case.
84 A.P. Sasmito et al. / Tunnelling and Underground Space Technology 34 (2013) 82–95
active mining take place (Fig. 1b); and (iii) underground tunnel(Fig. 1c) similar to Parra et al. (2006) for which we compare and
validate our model with measurements. Details of the geometricalparameters are presented in Table 2.
A.P. Sasmito et al. / Tunnelling and Underground Space Technology 34 (2013) 82–95 85
2.1. Governing equations
The mathematical model comprises of conservation equationsof turbulent mass, momentum, species and energy as well as thescalar transport equations for turbulence model. The fan is re-solved as an interfacial condition with polynomial function.
r � qU ¼ 0 ð1Þ
r � qUU ¼ r � rþ qg ð2Þ
where
r ¼ �pIþ ðlþ ltÞðrU þ ðrUÞTÞh i
� 23ðððlþ ltÞðr � UÞIÞ
� qkIÞ ð3Þ
r � ðqcpUTÞ ¼ r � keff þcplt
Prt
� �rT ð4Þ
r � ðqxiUÞ ¼ r � qDi;eff þlt
Sct
� �rxi ð5Þ
2.2. Constitutive relations
We solve for ternary species mixture, xi, comprising of CH4, O2
and H2O. The interaction between the species is captured in themixture density which follows incompressible ideal gas law as
q ¼ pMRT
ð6Þ
where R is the universal gas constant and M denotes the mixturemolecular weight, given by
M ¼ xCH4
MCH4
þxO2
MO2
þxH2O
MH2OþxN2
MN2
� ��1
ð7Þ
where Mi is the molecular mass of species i, and the mass fraction ofnitrogen is defined as
xN2 ¼ 1�xO2 �xH2O �xCH4 ð8Þ
The gas mixture viscosity, l, is defined by
l ¼X
a
xalaPbxaUa;b
with a;b ¼ CH4;O2;H2O;N2 ð9Þ
where xa,b are the mole fraction of species a and b, and
Ua;b ¼1ffiffiffi8p 1þMa
Mb
� ��1=2
1þ la
lb
!12 Mb
Ma
� �14
24 352
ð10Þ
The mole fractions are related to the mass fractions as
xi ¼xiMMi
ð11Þ
For practical purpose, we present methane concentration interms of percentage of methane concentration, defined as
CH4 ¼ xCH4 � 100% ð12Þ
2.3. Turbulence models
The turbulence model is the key component in representingflow behaviour in underground environment (Veersteg and Mala-lasekara, 1995). Here, four commonly used turbulence modelsare evaluated and compared with experimentally measured data.
� Spallart–Almaras
The Spallart–Almaras is a relatively simple one-equation modelthat solves a modelled transport equation for the kinematic eddy(turbulent) viscosity. The transport equation for ~v is
r � ðq~mUÞ ¼ Gv þ1r~vr � ðlþ q~mÞr~mþ Cb2qðr~mÞ2h i
� Yv ð13Þ
where Gv is the production of turbulent viscosity and Yv is thedestruction of turbulent viscosity that occurs in the near-wall re-gion due to wall blocking and viscous damping. rv and Cb2 are con-stants and m is the molecular kinematic viscosity, m = l/q.
The turbulent viscosity, lt, is computed from
lt ¼ q~mfv1 ð14Þ
where the viscous damping function, fv1, is given by
fv1 ¼v3
v3 þ C3v1
ð15Þ
and
v �~mm
ð16Þ
The production term, Gv, is modelled as
Gv ¼ Cb1qeS~m ð17Þ
where
eS � Sþ~m
j2d2 fv2 ð18Þ
and
fv2 ¼ 1� v1þ vfv1
ð19Þ
where Cb1 and j are constants, d is the distance from the wall, and Sis a scalar measure of deformation tensor which is based on themagnitude of the vorticity
S � jXijj þ Cprod minð0; jSijj � jXijjÞ ð20Þ
where Xij is the mean rate-of-rotation tensor and Sij is the meanstrain rate, defined by
Xij ¼12
@ui
@xj� @uj
@xi
� �; Sij ¼
12
@uj
@xiþ @ui
@xj
� �ð21Þ
86 A.P. Sasmito et al. / Tunnelling and Underground Space Technology 34 (2013) 82–95
Including both rotation and strain tensor reduces the produc-tion of eddy viscosity and consequently reduces the eddy viscosityitself in regions where the measure of vorticity exceeds that ofstrain rate.
The destruction term, Yv, is modelled as
Yv ¼ Cw1qfw~md
� �2
ð23Þ
where
fw ¼ g1þ C6
w3
g6 þ C6w3
" #1=6
ð24Þ
g ¼ r þ Cw2ðr6 � rÞ ð25Þ
r �~meSj2d2 ð26Þ
where Cw1, Cw2 and Cw3 are constants.The model constants have the following values
Cb1 ¼ 0:1355; Cb2 ¼ 0:622; r~m ¼23; Cv1 ¼ 7:1
Cw1 ¼Cb1
j2 þð1þ Cb2Þ
r~m; Cw2 ¼ 0:3; Cw3 ¼ 2; j ¼ 0:4187
ð27Þ
� k-EpsilonThe model considers two-equation model which solves for tur-
bulent kinetic energy, k, and its rate of dissipation, e, which is cou-pled with turbulent viscosity. The equations for turbulent kineticenergy given by
@
@tðqkÞ þ @
@xiðqkUiÞ ¼
@
@xjlþ lt
rk
� �@k@xj
� �þ Gk þ Gb � qe
� YM ð28Þ
and its rate of dissipation is
@
@tðqeÞ þ @
@xiðqeUiÞ ¼
@
@xjlþ lt
re
� �@e@xj
� �þ C1e
ekðGk
þ C3eGbÞ � C2eqe2
kð29Þ
In these equations, Gk represents the generation of turbulencekinetic energy due to the mean velocity gradients. Gb is the gener-ation of turbulence kinetic energy due to buoyancy. YM representsthe contribution of the fluctuating dilatation in compressible tur-bulence to the overall dissipation rate. C1e, C2e and C3e are constants.rk and re are the turbulent Prandtl numbers for k and e, respec-tively. The turbulent viscosity is computed by combining k and eas follows
lt ¼ qClk2
eð30Þ
where Cl is constant.� k-Omega
The model also considers as two-equation model that solves forturbulent kinetic energy, k, and specific dissipation rate, x9, whichis equal to the dissipation rate per unit turbulent kinetic energy(Wilcox, 1993). The turbulent kinetic energy and the specific dissi-pation rate are obtained from the following transport equations
@
@tðqkÞ þ @
@xiðqkUiÞ ¼
@
@xjCk
@k@xj
� �þ Gk � Yk ð31Þ
@
@tðq _xÞ þ @
@xiðq _xUiÞ ¼
@
@xjC _x
@ _x@xj
� �þ G _x � Y _x ð32Þ
In above equations, Gk represents the generation of turbulence ki-netic energy due to mean velocity gradients, G _x represents the gen-eration of the specific dissipation rate. Ck and C _x represent theeffective diffusivity of k and _x, respectively. Yk and Y _x representthe dissipation of the k and _x due to turbulence. The effective dif-fusivities for the k and _x model are given by
Ck ¼ lþ lt
rkð33Þ
C _x ¼ lþ lt
r _xð34Þ
where rk and r _x are turbulent Prandtl number for k and _x, respec-tively. While the turbulent viscosity is computed from
lt ¼ a�qk_x
ð35Þ
� Reynolds Stress ModelThe model solves for seven additional scalar transport equa-
tions; that is for turbulent and molecular diffusion, stress, buoy-ancy and system rotation production, pressure strain anddissipation. The RSM model accounts for the effect of streamlinecurvature, swirl, rotation and rapid changes in strain rate; there-fore it has greater potential to give accurate prediction for complexflow. However, the fidelity of RSM predictions is still limited by theclosure assumptions employed to model various terms in the exacttransport equations. Thus, the RSM model might not always yieldresults that are clearly superior to the simpler models in all casesof flows to warrant the additional computational expenses. TheReynolds Stress Model is given as
@Rij
@tþ Cij ¼ Pij þ Dij � eij þPij þXij ð36Þ
where @Rij/@t, Cij, Pij, Dij, eij, Pij, and Xij are the accumulation, con-vective, production, diffusion, dissipation, pressure–strain interac-tion and rotation terms, respectively. These terms are defined as
@Rij@t¼@ðqau0iu
0jÞ
@t; Cij ¼ r � ðqau0iu
0jUÞ;
Pij ¼ � Rim@Uj
@Xmþ Rjm
@Ui
@Xm
� �; Dij ¼ r � lt
rkrRij
� �ð37Þ
eij ¼23edij;
Pij ¼ �C1ek
Rij �23
kdij
� �� C2
ek
Pij �23
Pdij
� �;
Xij ¼ �2xk u0ju0meikm þ u0iu
0mejkm
� �ð38Þ
and lt ¼ Clk2e
ð39Þ
where Rij is the Reynolds stress tensor and dij is Kronecker delta. Cl,rk, C1 and C2 are constants.
2.4. Fan model
To model the fan, its characteristic curve is introduced as aninterfacial condition; the model is represented by a polynomialfunction that is fitted to data from manufacturer for static pressureincreases over the fan vis-à-vis the flow velocity, similar to our pre-vious work (Sasmito et al., 2010). Further, the fan diameter is as-sumed to be the same as pipe diameter (see Fig. 1b).
Dpfan ¼ C1ðufanÞ2 þ C2ufan þ C3 ð40Þ
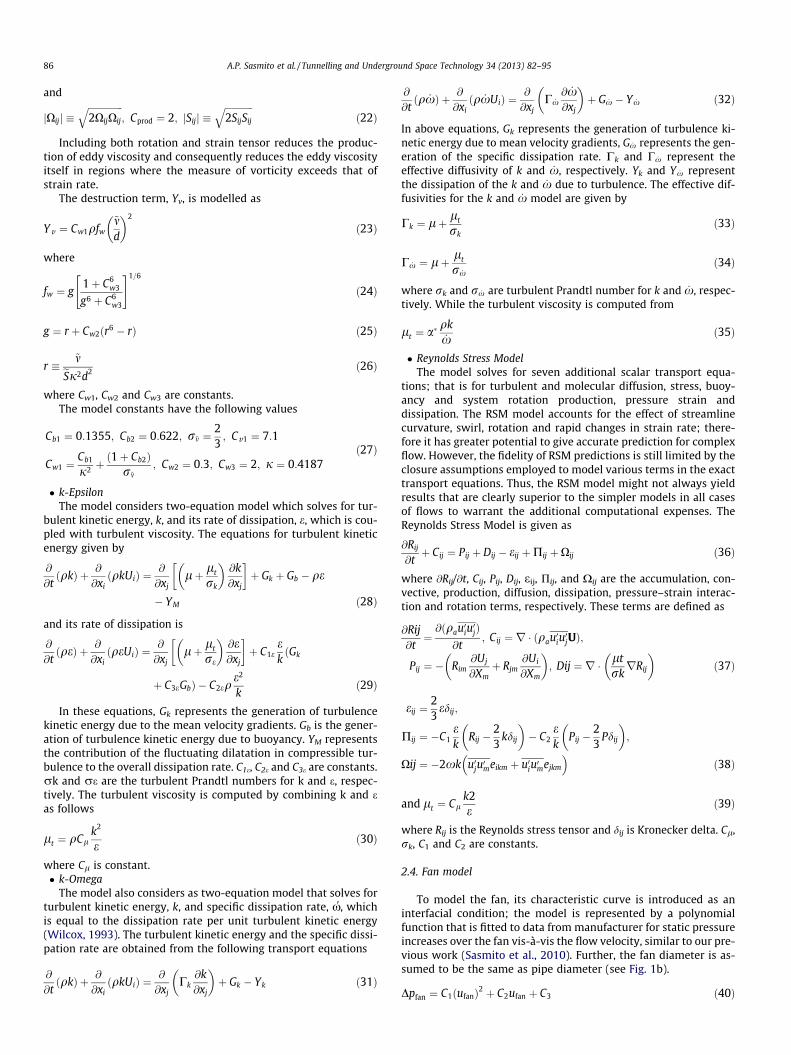
Fig. 2. Velocity contours (m/s) for various turbulence model at z0 = 4 m from the dead zone area (Fig. 1c).
A.P. Sasmito et al. / Tunnelling and Underground Space Technology 34 (2013) 82–95 87
2.5. Boundary conditions
� At walls, the standard wall function is used in all simulations.� At the inlet (Fig. 1a and b), air velocity of 2 m/s is prescribed at
the inlet, while methane from mining wall is assumed to be at5 � 10�3 m/s following Torano et al. (2009).� At the duct inlet, for the validation case (Fig. 1c), the air velocity
is set constant at 12 m/s which is similar to Parra et al. (2006).� At the outlet, the pressure is set to ambient and streamwise gra-
dient of the temperature and species is prescribed to zero.
3. Numerical methodology
The computational domains were created in commercial pre-processor software Gambit 2.3.16; the software can be used to cre-ate the geometry like CAD software, meshing (structured andunstructured) and labelling boundary conditions; see (Fluent doc-umentation) for details. Three different amount of mesh 5 � 105,1 � 106 and 2 � 106 were implemented and compared in termsof local pressure, velocities, and methane concentration to ensurea mesh independent solution. We found that the mesh amount ofaround 1 � 106 gives about 1% deviation compared to the meshsize of 2 � 106; whereas, the results from the mesh size of5 � 105 deviate up to 12% as compared to those from the finestone. Therefore, a mesh of around 1 million elements was sufficientfor the numerical investigation purposes: a fine structure near thewall and increasingly coarser mesh in the middle of the tunnel toreduce the computational cost.
The governing equations together with its correspond turbu-lence model and boundary conditions were solved using commer-cial CFD software Fluent 6.3.26; the software is basically a
multi-purpose CFD software which is based on finite volume meth-od. It is able to solve complex fluid mechanics, heat transfer, com-bustion, multiphase, particle tracking and so forth; detaileddiscussion of the software and its implementation can be foundin (Fluent documentation). The equations were solved with thewell-known Semi-Implicit Pressure-Linked Equation (SIMPLE)algorithm, second order upwind discretization and Algebraic Mul-ti-grid method. The convergence criteria was set to 10�6 for allequations.
4. Validation of turbulence model
Unlike in laminar flow model where we can obtain a nearly ex-act solution, modeling turbulence flow needs special attention tovalidation and comparison with experimental data since it is nec-essarily an approximation. Here, four commonly used turbulencemodels, e.g., Spallart–Almaras, k-Epsilon, k-Omega and ReynoldsStress Model (RSM) are compared with flow measurements fromParra et al. (2006); the three-dimensional model is illustrated inFig. 1c. For the sake of brevity, we refer the reader for details ofthe experimental set-up to Parra et al. (2006).
88 A.P. Sasmito et al. / Tunnelling and Underground Space Technology 34 (2013) 82–95
Fig. 2 shows the numerical results of velocity contours for var-ious models. It is seen that the choice of turbulence model isimportant as the predicted behaviour can be different. It is notedthat the Spallart–Almaras model gives reasonably good agreementas compared to experimental data with maximum relative error of�15%. The Spallart–Almaras model requires the lowest computa-tional cost as it is only solved one additional scalar equation forturbulence model; see Table 3 for details of the comparison. Aswe are interested in the overall flow behaviour for design purposes,the Spallart–Almaras model is found to be sufficient whilst main-taining low and fast computation. We therefore proceed furtherwith this turbulence model. It is noted that the data availablehas an uncertainty level of about 10%. Also the data are limitedfor thorough validation.
While experimental evidence and validation for correspondingdesigns would be ideal, lack of such evidence does not limit thisstudy as the leading order physical phenomena are well captured
Fig. 3. Velocity distribution (m/s) in ‘‘room and pillar’’ mining for (a) no-stopping; (b) wz = 1 m from the floor (Fig. 1a).
in the present model; comparison against several designs fromexperiments will be considered in future study to further ensurethe validity of model predictions. In addition, in the deep mineswhere the environment is harsh and the condition is unpredict-able, experimental investigation can be dangerous tasks to assiston the design of gas control due to safety concern (high risk ofexplosion) and expensive cost; mathematical and computationalmodeling on the other hand, has come to play an important rolein the design, maintenance, innovation and optimization as thereis almost risk-free and cheaper – which is the theme of this paper.
5. Results and discussion
The numerical simulations were carried out for typical condi-tions found in ‘‘room and pillar’’ underground mining. In the fol-lowing, four different flow stopping scenarios are examined.
ith parallel stopping; (c) with partial stopping; and (d) with serpentine brattice at
A.P. Sasmito et al. / Tunnelling and Underground Space Technology 34 (2013) 82–95 89
After which we focus to the cross-cut region where active miningtake place, six different ventilation scenarios and two different cut-ting scenarios are evaluated.
5.1. Flow-stopping designs
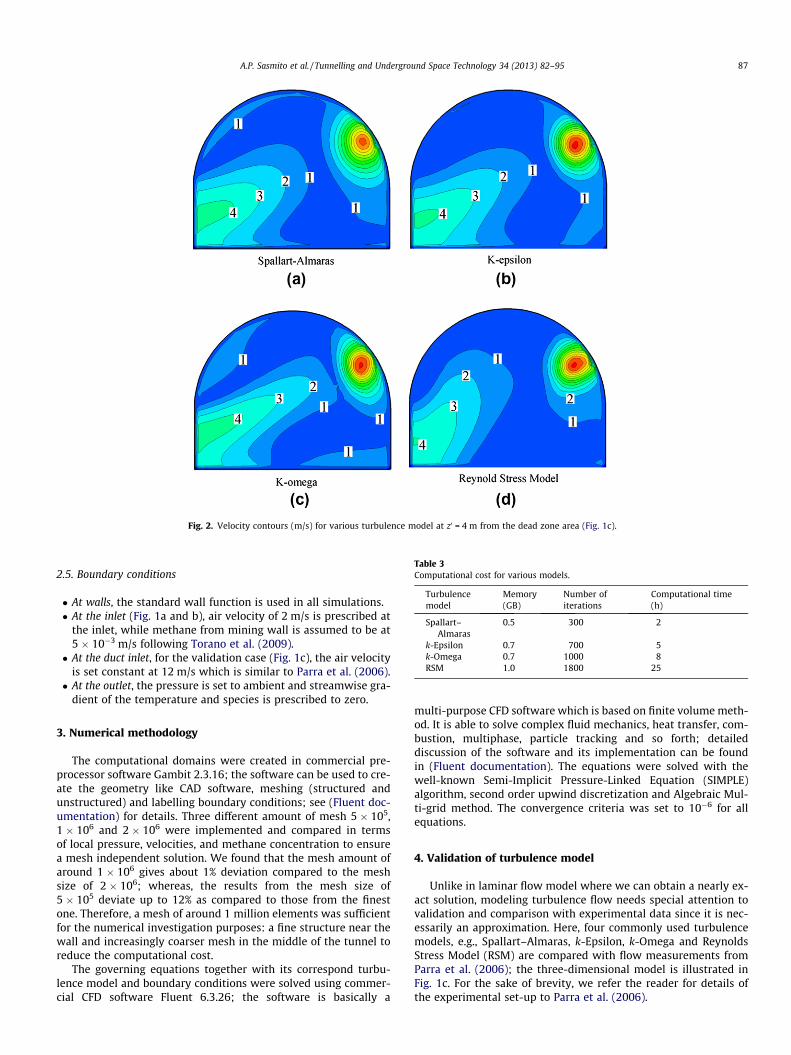
One of the key factors that determine the performance of venti-lation system is the velocity fields inside the mines. In general, ahigher air velocity results in higher methane removal; more freshair is supplied to the mines to dilute the methane and to provideoxygen for miners to breath. The predicted velocity profiles for fourdifferent flow-stopping designs are shown in Fig. 3. Here, severalfeatures are apparent; foremost among them is that the serpentinestopping designs gives the most uniform and highest velocities ascompared to other placements. This is mainly attributed to the factthat in serpentine design, the intake air flow does not split to sev-eral tunnels as compared to other designs, instead the intake air is
Fig. 4. Methane distribution (%) in ‘‘room and pillar’’ mining for (a) no-stopping; (b) wz = 1 m from the floor (Fig. 1a).
directed towards a single-long-tunnel with several turns; thushigher air flow rate is achieved throughout the tunnel. Hence, itcan be deduced that by re-arranging flow stopping design, a highair velocity for methane removal can be maintained.
A higher velocity is expected to have direct impact on methaneremoval; this is indeed the case, as can be inferred from Fig. 4,which illustrates a trend according to which the methane concen-tration increases a long the tunnel from inlet to outlet region. It isshown that for case without stoppage, methane accumulation ex-ists in the dead zone area and mine development region whichmay trigger explosion inside the mines. For the case with parallelflow stoppage, methane accumulation is more severe in the cornerdead-zone region as the air velocity is one order-of-magnitudesmaller than the inlet velocity. An improvement is achieved forpartial and serpentine stopping (see Fig. 4c and d) as the methaneaccumulation is reduced especially in the dead zone region. Carefulconsideration, however, has to be taken into consideration when
ith parallel stopping; (c) with partial stopping; and (d) with serpentine brattice at
90 A.P. Sasmito et al. / Tunnelling and Underground Space Technology 34 (2013) 82–95
designing large area ‘‘room-and-pillar’’ mining with serpentine de-sign as methane build-up in very long passage can result in highmethane concentration, especially at the outlet region.
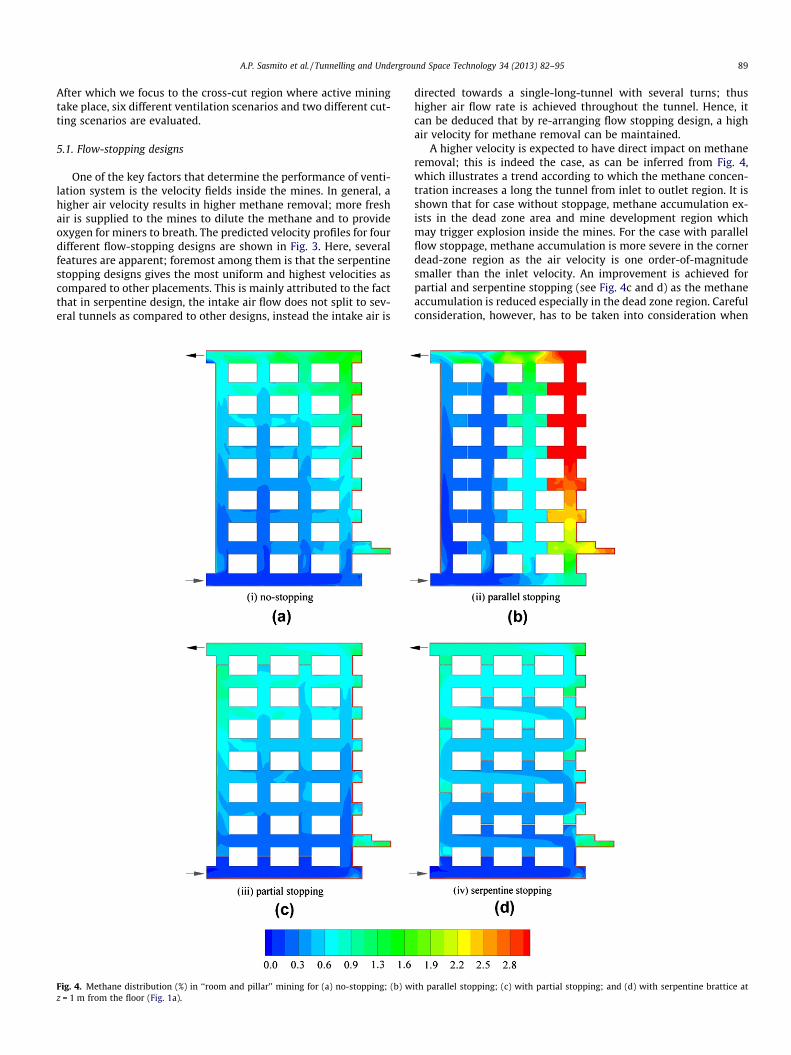
Keeping pressure drop at a minimum is of interest for reducingthe operating cost of ventilation system; whence a proper flowstopping design should be able to maintain low methane concen-tration, whilst keeping the pressure drop to a minimum. The ser-pentine design requires the highest pressure drop to drive theflow (� five times higher compared to the base-case); see Fig. 5for details. This can be expected from more turns in the tunnelwhich creates flow resistance as compared to other designs. Forpartial stopping, on the other hand, the pressure drop required isabout twice than that for the base-case, but the effectiveness ofmethane removal rate is comparable to serpentine design. In addi-tion, partial stopping requires less stopping construction which re-duces the cost; also it is easier to seal the mining area once theproduction/excavation is finished.
Fig. 5. Gauge pressure (Pa) in ‘‘room and pillar’’ mining for (a) no-stopping; (b) with parfrom the floor (Fig. 1a).
5.2. Cross-cut region
Thus far, we have looked at the global flow distribution in the‘‘room and pillar’’ underground coal mining. Now, we look closerto the cross-cut region (see Fig. 1b) where methane accumulationis of interest for miner’s safety. Six different ventilation scenariosin the cross-cut region are simulated; they are (a) without addi-tional equipment (base-case), (b) with blowing ventilation, (c) withexhausting ventilation, (d) with brattice, (e) with blowing-exhausting ventilation; and (f) with brattice–exhausting ventila-tion. Note that the auxiliaries used in the simulation, e.g., brattice,duct diameter and fan power rating, are typical in undergroundcoal mining; the fan characteristic curve is adapted from fan man-ufacturer (Korfmann). The road header, haulage and conveyor arenot considered in this study.
Fig. 6 presents the velocity contours for each scenario. For casewith no auxiliary equipment (Fig. 6a), a very low air velocity exists
allel stopping; (c) with partial stopping; and (d) with serpentine brattice at z = 1 m
A.P. Sasmito et al. / Tunnelling and Underground Space Technology 34 (2013) 82–95 91
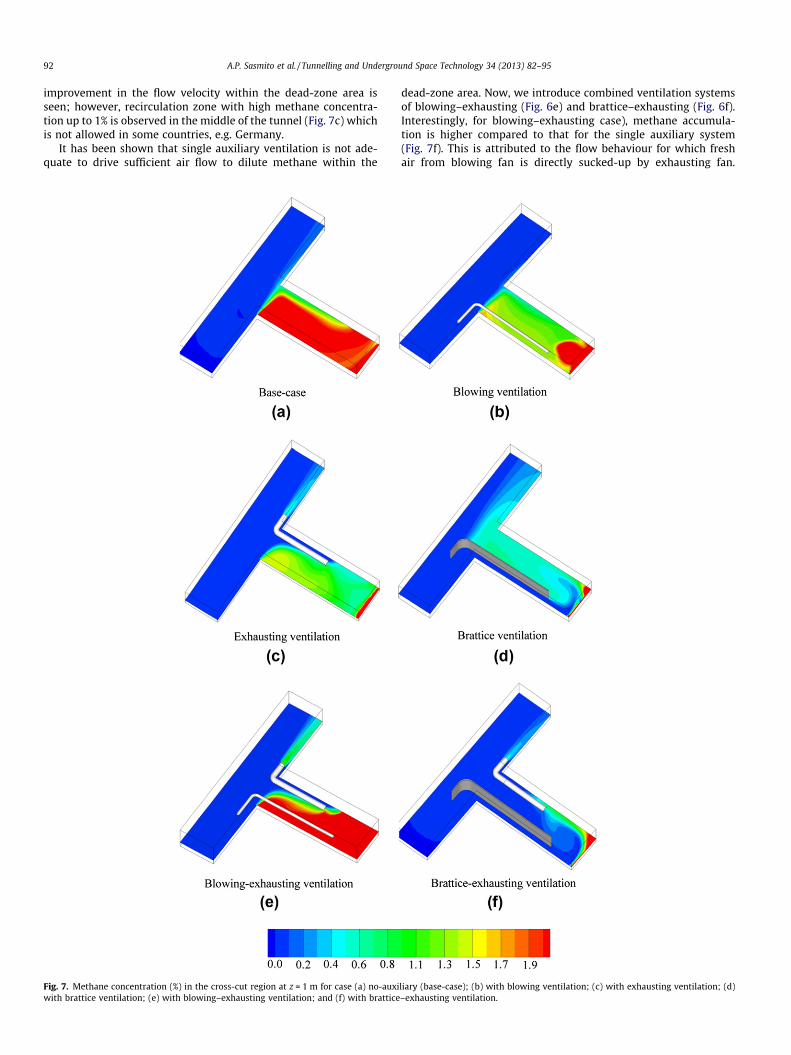
in the dead-zone area (one-order magnitude lower than inletvelocity). This is further mirrored by high methane concentration(exceeding permissible concentration of 2%) in the dead-zone areaas can be inferred in Fig. 7a. When blowing ventilation is added tothe cross-cut region (Fig. 6b), air flow from blowing ventilation isseen only in the near dead-zone area and seems to be insufficientto remove methane accumulation (see Fig. 7b). As the fan is placed
Fig. 6. Velocity fields (m/s) in the cross-cut region at z = 1 m for case (a) no-auxiliary (brattice ventilation; (e) with blowing–exhausting ventilation; and (f) with brattice–exh
in the exhausting mode (Fig. 6c), it is seen that most of the airsucked by fan comes from main flow (fresh air), not from dead-zone area. In this design, methane accumulates in the junction areaup to 1.5% (Fig. 7c); according to regulations in some countries, e.g.,Germany and UK, this level of methane concentration is not per-missible, while France, Spain and US allow this amount of concen-tration. Proceeding to the case with brattice (Fig. 6d), an
base-case); (b) with blowing ventilation; (c) with exhausting ventilation; (d) withausting ventilation.
92 A.P. Sasmito et al. / Tunnelling and Underground Space Technology 34 (2013) 82–95
improvement in the flow velocity within the dead-zone area isseen; however, recirculation zone with high methane concentra-tion up to 1% is observed in the middle of the tunnel (Fig. 7c) whichis not allowed in some countries, e.g. Germany.
It has been shown that single auxiliary ventilation is not ade-quate to drive sufficient air flow to dilute methane within the
Fig. 7. Methane concentration (%) in the cross-cut region at z = 1 m for case (a) no-auxiwith brattice ventilation; (e) with blowing–exhausting ventilation; and (f) with brattice
dead-zone area. Now, we introduce combined ventilation systemsof blowing–exhausting (Fig. 6e) and brattice–exhausting (Fig. 6f).Interestingly, for blowing–exhausting case), methane accumula-tion is higher compared to that for the single auxiliary system(Fig. 7f). This is attributed to the flow behaviour for which freshair from blowing fan is directly sucked-up by exhausting fan.
liary (base-case); (b) with blowing ventilation; (c) with exhausting ventilation; (d)–exhausting ventilation.
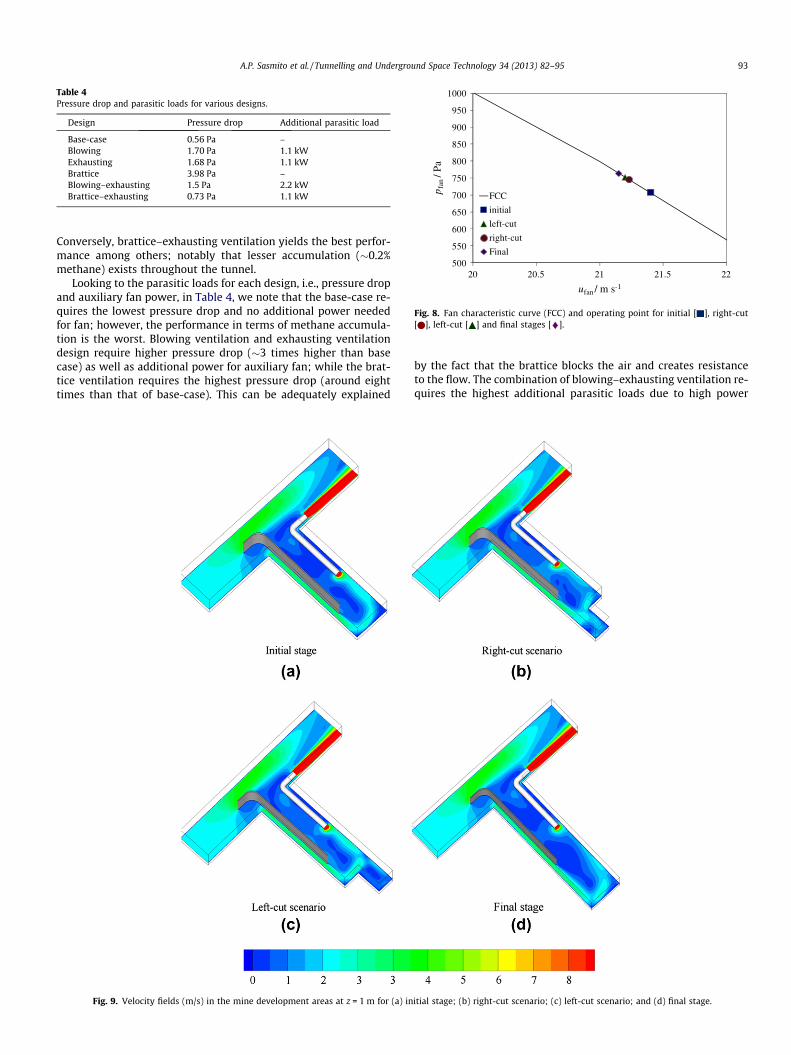
Table 4Pressure drop and parasitic loads for various designs.
Design Pressure drop Additional parasitic load
Base-case 0.56 Pa –Blowing 1.70 Pa 1.1 kWExhausting 1.68 Pa 1.1 kWBrattice 3.98 Pa –Blowing–exhausting 1.5 Pa 2.2 kWBrattice–exhausting 0.73 Pa 1.1 kW
500
550
600
650
700
750
800
850
900
950
1000
20 20.5 21 21.5 22
p fan
/ Pa
ufan / m s-1
FCC
initial
left-cut
right-cut
Final
Fig. 8. Fan characteristic curve (FCC) and operating point for initial [ ], right-cut[ ], left-cut [ ] and final stages [ ].
A.P. Sasmito et al. / Tunnelling and Underground Space Technology 34 (2013) 82–95 93
Conversely, brattice–exhausting ventilation yields the best perfor-mance among others; notably that lesser accumulation (�0.2%methane) exists throughout the tunnel.
Looking to the parasitic loads for each design, i.e., pressure dropand auxiliary fan power, in Table 4, we note that the base-case re-quires the lowest pressure drop and no additional power neededfor fan; however, the performance in terms of methane accumula-tion is the worst. Blowing ventilation and exhausting ventilationdesign require higher pressure drop (�3 times higher than basecase) as well as additional power for auxiliary fan; while the brat-tice ventilation requires the highest pressure drop (around eighttimes than that of base-case). This can be adequately explained
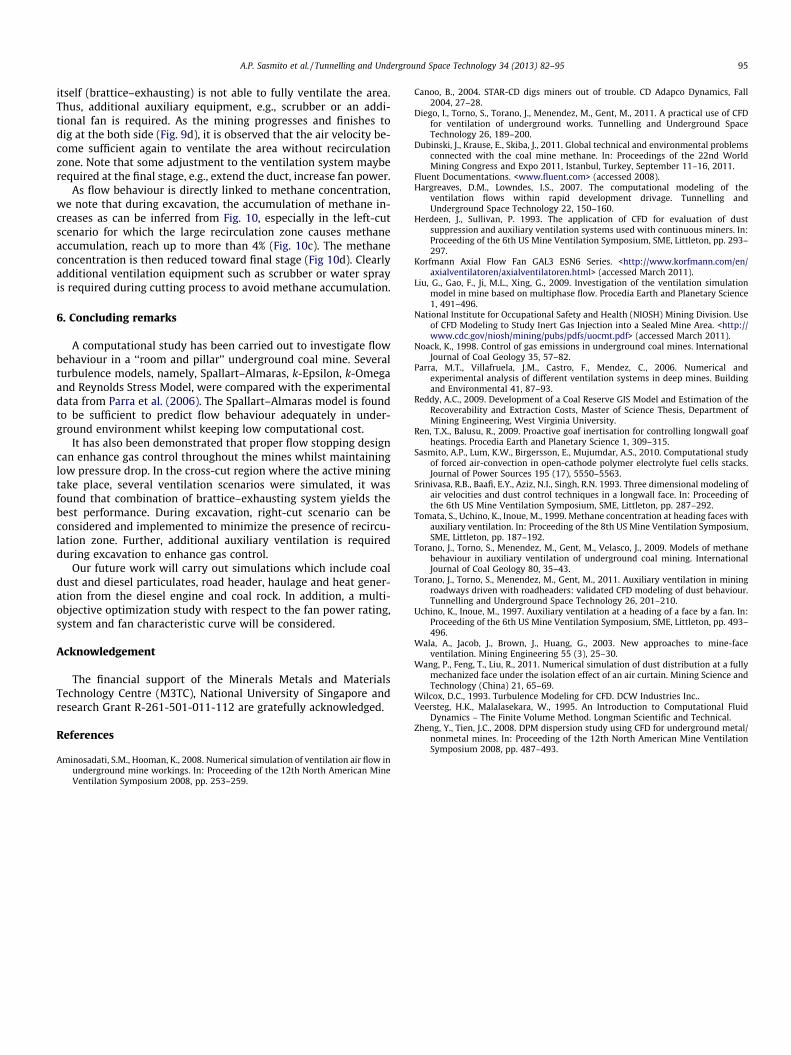
Fig. 9. Velocity fields (m/s) in the mine development areas at z = 1 m for (a) in
by the fact that the brattice blocks the air and creates resistanceto the flow. The combination of blowing–exhausting ventilation re-quires the highest additional parasitic loads due to high power
itial stage; (b) right-cut scenario; (c) left-cut scenario; and (d) final stage.
Fig. 10. Methane concentration (%) in the mine development areas at z = 1 m for (a) initial stage; (b) right-cut scenario; (c) left-cut scenario; and (d) final stage.
94 A.P. Sasmito et al. / Tunnelling and Underground Space Technology 34 (2013) 82–95
consumption to drive two fans. The pressure drop required by brat-tice–exhausting ventilation is found to be reasonably low (around20% higher than base-case design) with additional parasitic load;the low pressure drop can be attributed to the additional exhaustfan as it creates negative pressure at the dead zone area. Hence,it can be deduced that brattice–exhausting ventilation has poten-tial to be used for a cost-effective ventilation design in minesdue to low pressure drop and good methane removal – of coursefurther optimization is required.
5.3. Mine development scenario
It is well-known that mining environments are dynamic andchanging very rapidly as mining excavation continues using roadheader/continuous miner progressing. In essence, changes in mineenvironment will also change the ventilation system performance,e.g., ventilation area, methane flow rate, dust generated and soforth. To study the impact of rapid development stages in under-ground coal mining, we extend case (f) in previous section sinceit performs best among others to simulate two different cuttingscenarios and compare the flow behaviour as well as methane con-centration with those at the initial and final stages.
Mining development which includes full cutting and associatedventilation system is essentially a transient operation; it is, how-ever, practically difficult to model time dependent cutting cycles.As first approximation, we assume that the development is steadyand the presence of road header is neglected. We therefore inves-tigate two scenarios: (i) right-cut (similar to Hargreaves and Lown-des (2007)) for which the excavation is start from the right side ofthe road header digging up to three meter long from the initial dis-tance, the machine was then reversed and repositioned on the leftside to continue cutting; (ii) left-cut where the cutting start fromthe left side of the machine.
It is expected that the mine development stage changes theventilation system; this is indeed the case as can be seen inFig. 8 where the system characteristic slightly moves to the left:velocity drops up to around 0.2 m/s (2%) whereas the pressure dropincreases up to �50 Pa (7%) when the mining progressing. Thechange in fan-system operating point is mirrored by changing inflow behaviour, as illustrated in Fig. 9. We note that for theright-cut scenario (Fig. 9b), the air flow seems to be sufficient toventilate the development area. However, this is not the case forthe left-cut scenario (Fig. 9c) as a large recirculation area exists.This indicates that during the cutting process, main ventilation
A.P. Sasmito et al. / Tunnelling and Underground Space Technology 34 (2013) 82–95 95
itself (brattice–exhausting) is not able to fully ventilate the area.Thus, additional auxiliary equipment, e.g., scrubber or an addi-tional fan is required. As the mining progresses and finishes todig at the both side (Fig. 9d), it is observed that the air velocity be-come sufficient again to ventilate the area without recirculationzone. Note that some adjustment to the ventilation system mayberequired at the final stage, e.g., extend the duct, increase fan power.
As flow behaviour is directly linked to methane concentration,we note that during excavation, the accumulation of methane in-creases as can be inferred from Fig. 10, especially in the left-cutscenario for which the large recirculation zone causes methaneaccumulation, reach up to more than 4% (Fig. 10c). The methaneconcentration is then reduced toward final stage (Fig 10d). Clearlyadditional ventilation equipment such as scrubber or water sprayis required during cutting process to avoid methane accumulation.
6. Concluding remarks
A computational study has been carried out to investigate flowbehaviour in a ‘‘room and pillar’’ underground coal mine. Severalturbulence models, namely, Spallart–Almaras, k-Epsilon, k-Omegaand Reynolds Stress Model, were compared with the experimentaldata from Parra et al. (2006). The Spallart–Almaras model is foundto be sufficient to predict flow behaviour adequately in under-ground environment whilst keeping low computational cost.
It has also been demonstrated that proper flow stopping designcan enhance gas control throughout the mines whilst maintaininglow pressure drop. In the cross-cut region where the active miningtake place, several ventilation scenarios were simulated, it wasfound that combination of brattice–exhausting system yields thebest performance. During excavation, right-cut scenario can beconsidered and implemented to minimize the presence of recircu-lation zone. Further, additional auxiliary ventilation is requiredduring excavation to enhance gas control.
Our future work will carry out simulations which include coaldust and diesel particulates, road header, haulage and heat gener-ation from the diesel engine and coal rock. In addition, a multi-objective optimization study with respect to the fan power rating,system and fan characteristic curve will be considered.
Acknowledgement
The financial support of the Minerals Metals and MaterialsTechnology Centre (M3TC), National University of Singapore andresearch Grant R-261-501-011-112 are gratefully acknowledged.
References
Aminosadati, S.M., Hooman, K., 2008. Numerical simulation of ventilation air flow inunderground mine workings. In: Proceeding of the 12th North American MineVentilation Symposium 2008, pp. 253–259.
Canoo, B., 2004. STAR-CD digs miners out of trouble. CD Adapco Dynamics, Fall2004, 27–28.
Diego, I., Torno, S., Torano, J., Menendez, M., Gent, M., 2011. A practical use of CFDfor ventilation of underground works. Tunnelling and Underground SpaceTechnology 26, 189–200.
Dubinski, J., Krause, E., Skiba, J., 2011. Global technical and environmental problemsconnected with the coal mine methane. In: Proceedings of the 22nd WorldMining Congress and Expo 2011, Istanbul, Turkey, September 11–16, 2011.
Fluent Documentations. <www.fluent.com> (accessed 2008).Hargreaves, D.M., Lowndes, I.S., 2007. The computational modeling of the
ventilation flows within rapid development drivage. Tunnelling andUnderground Space Technology 22, 150–160.
Herdeen, J., Sullivan, P. 1993. The application of CFD for evaluation of dustsuppression and auxiliary ventilation systems used with continuous miners. In:Proceeding of the 6th US Mine Ventilation Symposium, SME, Littleton, pp. 293–297.
Korfmann Axial Flow Fan GAL3 ESN6 Series. <http://www.korfmann.com/en/axialventilatoren/axialventilatoren.html> (accessed March 2011).
Liu, G., Gao, F., Ji, M.L., Xing, G., 2009. Investigation of the ventilation simulationmodel in mine based on multiphase flow. Procedia Earth and Planetary Science1, 491–496.
National Institute for Occupational Safety and Health (NIOSH) Mining Division. Useof CFD Modeling to Study Inert Gas Injection into a Sealed Mine Area. <http://www.cdc.gov/niosh/mining/pubs/pdfs/uocmt.pdf> (accessed March 2011).
Noack, K., 1998. Control of gas emissions in underground coal mines. InternationalJournal of Coal Geology 35, 57–82.
Parra, M.T., Villafruela, J.M., Castro, F., Mendez, C., 2006. Numerical andexperimental analysis of different ventilation systems in deep mines. Buildingand Environmental 41, 87–93.
Reddy, A.C., 2009. Development of a Coal Reserve GIS Model and Estimation of theRecoverability and Extraction Costs, Master of Science Thesis, Department ofMining Engineering, West Virginia University.
Ren, T.X., Balusu, R., 2009. Proactive goaf inertisation for controlling longwall goafheatings. Procedia Earth and Planetary Science 1, 309–315.
Sasmito, A.P., Lum, K.W., Birgersson, E., Mujumdar, A.S., 2010. Computational studyof forced air-convection in open-cathode polymer electrolyte fuel cells stacks.Journal of Power Sources 195 (17), 5550–5563.
Srinivasa, R.B., Baafi, E.Y., Aziz, N.I., Singh, R.N. 1993. Three dimensional modeling ofair velocities and dust control techniques in a longwall face. In: Proceeding ofthe 6th US Mine Ventilation Symposium, SME, Littleton, pp. 287–292.
Tomata, S., Uchino, K., Inoue, M., 1999. Methane concentration at heading faces withauxiliary ventilation. In: Proceeding of the 8th US Mine Ventilation Symposium,SME, Littleton, pp. 187–192.
Torano, J., Torno, S., Menendez, M., Gent, M., Velasco, J., 2009. Models of methanebehaviour in auxiliary ventilation of underground coal mining. InternationalJournal of Coal Geology 80, 35–43.
Torano, J., Torno, S., Menendez, M., Gent, M., 2011. Auxiliary ventilation in miningroadways driven with roadheaders: validated CFD modeling of dust behaviour.Tunnelling and Underground Space Technology 26, 201–210.
Uchino, K., Inoue, M., 1997. Auxiliary ventilation at a heading of a face by a fan. In:Proceeding of the 6th US Mine Ventilation Symposium, SME, Littleton, pp. 493–496.
Wala, A., Jacob, J., Brown, J., Huang, G., 2003. New approaches to mine-faceventilation. Mining Engineering 55 (3), 25–30.
Wang, P., Feng, T., Liu, R., 2011. Numerical simulation of dust distribution at a fullymechanized face under the isolation effect of an air curtain. Mining Science andTechnology (China) 21, 65–69.
Wilcox, D.C., 1993. Turbulence Modeling for CFD. DCW Industries Inc..Veersteg, H.K., Malalasekara, W., 1995. An Introduction to Computational Fluid
Dynamics – The Finite Volume Method. Longman Scientific and Technical.Zheng, Y., Tien, J.C., 2008. DPM dispersion study using CFD for underground metal/
nonmetal mines. In: Proceeding of the 12th North American Mine VentilationSymposium 2008, pp. 487–493.