379 AM ,I SOME CAUSES OF INFLATION IN KOREA THESIS Presented to the Graduate Councial of the North Texas State University in Partial Fulfillment of the Requirements For the Degree of MASTER OF SCIENCE By Ihn Shik Lee Denton, Texas August, 1985
Transcript
379AM ,I
SOME CAUSES OF INFLATION IN KOREA
THESIS
Presented to the Graduate Councial of the
North Texas State University in Partial
Fulfillment of the Requirements
For the Degree of
MASTER OF SCIENCE
By
Ihn Shik Lee
Denton, Texas
August, 1985
Lee, Ihn Shik, Some Causes of Inflation in Korea.
Master of Science (Economics), August, 1985, 63 pp., 8
tables, 4 illustrations, bibliography, 54 titles.
The purpose of this study is to find causes of
inflation in Korea. We hypothesized that inflation in
Korea was a "mixed" inflation generated by not only
monetary factors but also nonmonetary factors. The data
was obtained mainly from International Finance Statistics
(IMF) and Monthly Bulletin (The Bank of Korea).
The first chapter introduces the Korean economy.
Chapter two surveyed the effects of import prices, wages,
and money supply in inflationary process. The third chap-
ter studied some theoretical backgrounds of inflation.
Chapter four analyzed the results of statistical tests.
Finally, chapter five consisted of summary and policy
implications.
TABLE OF CONTENTS
Page
LIST OF TABLES. ...... ... ....... . iv
LIST OF ILLUSTRATIONS .v . * ** . . * V
Chapter
I. OUTLAY OF KOREAN ECONOMY . . . . . . . * . 1
IntroductionRapid Economic GrowthConclusion
II. INFLATION IN KOREA .. ..... *. . . 9
The Effects of Import PricesThe Effects of WagesThe Effects of Money Growth
III. SURVEY OF LITERATURE . * * .W . * * * . * 22
Type of Inflation by CausesMonetarist and StructuralistTheoretical Formulation
IV. ANALYSIS OF EMPIRICAL RESULTS . . . . * * . 32
Test with Annual Time Series DataComparison with Other CountriesThe Limitation of AnalysisConclusion
4. Effect of Transitory Nonmonetary Shock onthe Trend Rate of Inflation . .. . . ... .0 . 29
V
CHAPTER I
OUTLAY OF KOREAN ECONOMY
Introduction
Korea is relatively small and densely populated.
Most of the country's total land area of about 99,000
square kilometers is mountainous. Only twenty-three
per cent of the land is cultivated.2
Korea is one of the world's most strategic areas
owing to its geographical location. Bordered by Russian
Siberia on the north, Mancuria and China to the west,
and Japan 120 miles by water to the east, it has been
both a bridge and a buffer between these powerful
neighbors.
Korea's foreign economic relations have been subject
to pressure from or direct control by other nations.
Japan occupied Korea from 1910 to 1945 not only because
of Korea's strategic position but also because of its
importance as a source of essential raw materials. Korea
1Hereafter, South Korea was simplified as Korea inthis thesis.
2B. L. Song, Korean Economy(Seoul, 1983), p. 421.
1
2
had no sovereignty while under Japanese control, and was
therefore unable to establish long-range policies or to
take other measures essential for any nation to develop
trade and industry for the welfare of its people. Since
the liberation of Korea from the thirty-six years of
Japanese rule at the, end of World War II, the United States
played an important role in shaping the development pattern
of the Korean economy. First of all, massive economic
assistance from the United States was the majer source of
foreign exchange required to maintain the stability and
order of the Korean economy. Subsequent to the Korean
war of 1950-1953, the postwar reconstruction program was
carried out mainly with U. S. assistance. Thus, heavy
reliance on U. S. assistance was the major charateristic
of the Korean economy prior to the rapid growth period of
the 1960s.3
Two hundred minerals and ores are known to exist in
Korea but their value lies more in their variety than in
quantity. Self-supporting minerals are very limited.
The principal mineral, anthrasite coal, is available in
great quantity but is poor in quality and unsuitable for
cooking.
The pressure of population on these limited resources
3 Edward S. Mason and others, The Economic and SocialModernization of the Republic of Korea (Harvard, 1980), pp.192-196.
3
are intense. Korea's population density of 403 persons
per square kilometer of the land is among the world's
highest.i Rising levels of education and income and a
strong effort to disseminate family planning services
brought down the rate of population growth from about
3 per cent a year in 1963 to 1.5 per cent in 1983.
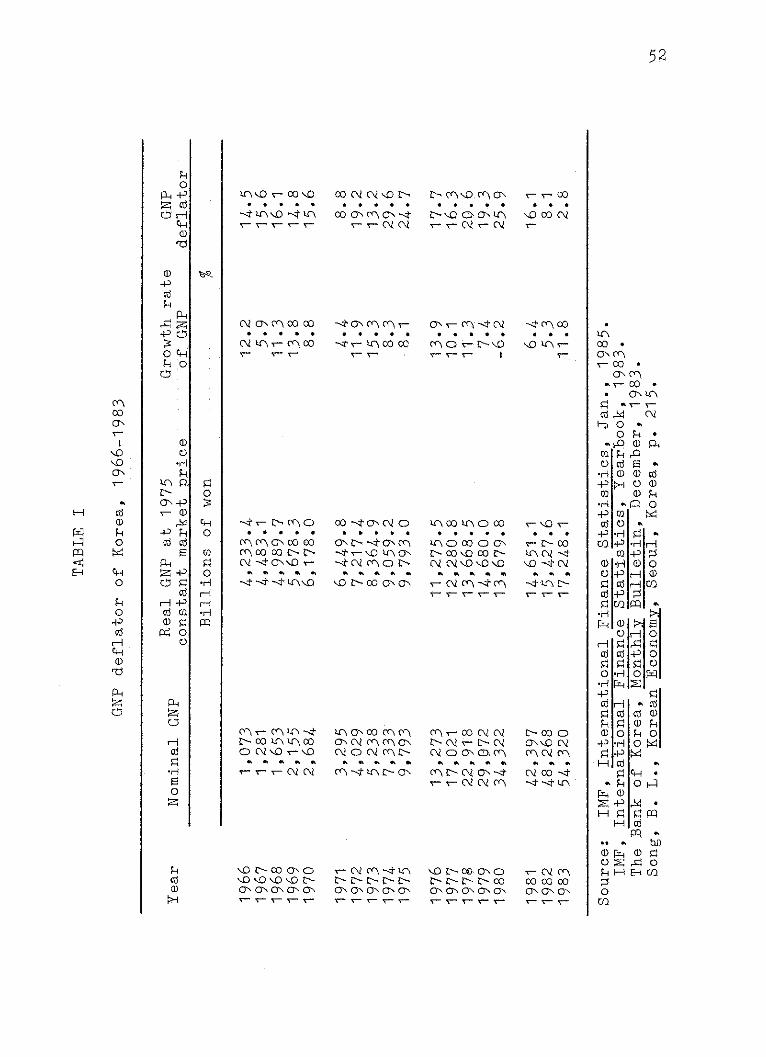
TABLE I
TOTAL POPULATION AND ANNUAL GROWTH RATE
ITEM 1963 1967 1971 1975 1979 1983
Total Population(millions of 27.2 30.1 32.9 35.3 37.6 39.9
persons)
Annual growthrate of 2.9 2.38 2.22 1.76 1.62 1.53
population( %)
Source: The Bank of Korea, Economic StatisticsYearbook, 1976. The Bank of Korea, MonthlyBulletin, July, 1984, pp. 118-119.
Rapid Economic Growth
In 1961, Korea was one of the poorest developing
countries, with heavy dependence on agriculture and a
weak balance of payments financed almost entirely by
4 Source: The Bank of Korea, Monthly Bulletin, July,1984, p. 118.
4
foreign grant. By 1976 it had become a semi-industrial,
middle income nation with a strong external payment
position in the late 1970s.
Above all, industrial structure was changed in this
period. In 1961 Korea remained a backward, rural economy,
with the primary sector, consisting of agriculture, forestry,
and fishing, accounting for about 40 per cent of the GNP,
and the manufacturing sector for only about 13 per cent.
With Korea's small domestic market, it was clear that
full employment of the vast labor force could not be at-
tained through development of domestic market-oriented
industries. An export-oriented industrialization strategy
was therefore adopted which took advantage of foreign
resources and markets as well as the abundant labor force.5
As a result, the volume of exports has increased at an
annual rate of 34.6 per cent since 1961. This in turn
caused the value-added in the manufacturing sector to
grow, and the value-added in manufacturing rose from
15 per cent of the GNP in 1961 to 30 per cent in 1982.
Social overhead and other services rose from 44.6 per cent
in 1961 to 53.3 per cent in 1982. reflecting the continuous,
large investment required to support rapid industrialization
(Fig. 1).
5Parvez Hasan and D. C. Rao, Korea(Baltimore, 1979),pp. 16-20.
5
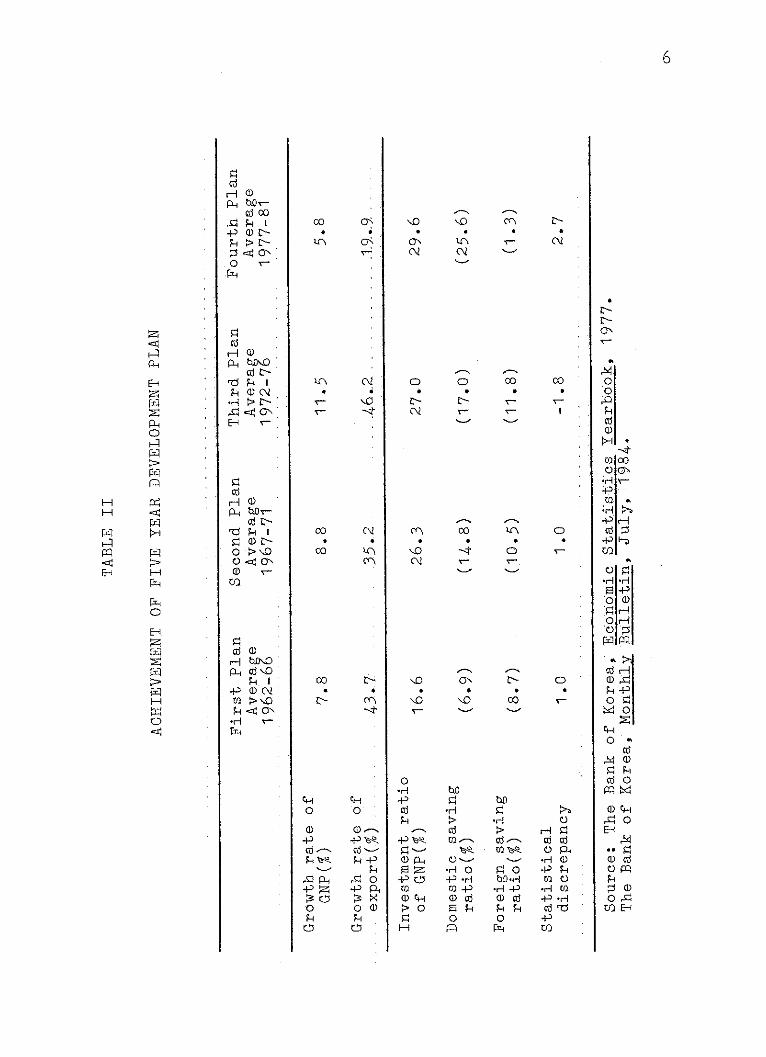
During the past Five-Year Development Plans, Korean
economy has achieved remarkable growth and a significant
change in the standard of living as well as industrial
structure.
SOC & otherservices44.6%
Mining &manufacturing15.2%
Agr., forestry& fishing40.2%
SOC & otherservices53.3%
Mining &manufacturing30.0%
Agr., forestry& fishing16.7%
Source: The Bank of Korea, Monthly Bulletin, July, 1975,and July, 1984.
Fig. 1--Industrial structure (1961-1982)
During the 1962-1981 period, Korea's economy grow
at an average growth rate of about 10 per cent a year,
accelerating from 7.8 per cent in 1962-1966, 8.8 per cent
rwou"MMA-MMA.""
ob
's,
H O)cd 00PHN i-
SOj0FH I
< 0
H a)
rd p
H O
o orf-j 40r0) <4 ONa) ~
c a)PH UD
-P Q) C\l
ON*H
PHI
EH
PH,0
-i
F:rl
H
H
00
(N
0
ell
4
P-,0H
) ~
o-PR00)C:2
0
-PC
OPH02
0)
Hn
00
0
40
0
*H -P
(1 w
0F=4
00
4-:5(:
OR
H
*H 0-P H
-00
9
O
o00
-HC) O
-H
0
0o
CO
oH
(':5A 4
E10
000d
o x!t/fE-p
6
0
C\l
%0
C\2
ON02
HH
0000
00
0
0)-PCd4PH
00 M
00-4
02
-H 0-P H
to
0-
0)"j
0Ho
7
in 1967-1971, 11.5 per cent in 1972-1976 to 5.8 per cent
in 1977-1981, the period of Koreat s fourth plan. Per
capita income in current price rose from less than $100
in 1961 to about $1.735 in 1982.6
Investment and saving ratio was changed largely in
this period. Investment ratio rose from 16.6 per cent
in 1962-1966 to 29.6 per cent in 1977-1981. The degree
of depending on foreign savings was reduced dramatically
in this period. As dependence on foreign savings declines
due to increased self-reliance in investment financing,
an important factor contributing to past balance of
payments deficts will be eliminated (TABLE II).
This rapid growth rate of GNP was caused mainly by
export. In spite of two oil-shocks in 1973 and 1979,
an average annual growth rate of export was 36.25 per cent
in 1962-1981 (TABLE II).
Conclusion
The Korean economy has undergone a rapid and dramatic
structure change with export orientation of labor intensive
manufactures. Political stability, strong leadership, and
a firm commitment to development were the prerequisites for
6All dollar figures in this thesis are U. S. dollars.
8
economic advw
has atabilizE
who was re-el
Since 1c
tant issue ii
the Korean e
rapid econom:
In economic -
economic groi
Development I
were worsene(
In the growt]
amost polof econdependsimporta
Korean
stability."
set at a rel
mic plans wi.
price stabil
nce.7 Since 1962, the Korean government
d under the administration of president Park,
ected in 1967 and 1971.
)62, economic growyh has been the most impor-
Korean economic policy. In recent years,
Vonomy was faced with a new problem with was
..c growth accompanied with price instability.
heory, inflation is a natural consequence of
ith. During the period of four Five-Year
lans, two main results were produced which
I inflation and widened income distribution.
i theory of Kardor'smodel:
3low and steady rate of inflation provides aerful aid to the attainment of a steady rate)mic progress... the money rate of profiton the rate of inflation and inflation is 8
it for maintaining a high level of investment.
,conomy should solve the problem of "growth and
The growth target for Korean economy will be
atively modest level in the future and econo-
Ll be aimed at harmonizing economic growth and
Lty.
7L. L. Wade and B. S. Kim, Economic Development ofSouth Korea (New York, 1978), pp. 22-32.
8N. Kardor, "Monetary Policy, Economic Stability andGrowth, " in Memoranda of Evidence, Radcliffe Committee _othe Workings of the Monetary System (H.M.S.S., 1958), citedTi~A . P. Thirlwall, Inflation, Saving and Growth in Devel-oping Countries (New York, 1974), p. 20.
CHAPTER II
INFLATION IN KOREA
Korea is a small open economy with a per capita
income in 1983 of about $2,000. During the period of
the last two decades (1962-1983), the Korean economy
has achieved a rapid growth rate of GNP and exports.
But price increases have been persistent since 1945
(Koreats liberation from Japan), except for a short
period of price stability in 1959. An average annual
rate of inflation (measured in terms of the consumer
price index) was about 14.4 per cent during the period
1966 to 1983. This experience of the Korean economy,
like similar developing countries, was related to higher
energy prices. During the first and second oil shocks
in 1973 and 1979, the annual rate of wholesale price
index rose to 37.2% in 1974 and 38.9% in 1980 (TABLE III).
Inflation is defined as:
By inflation we mean a time generally risingprices for goods and factors of production-risingprices for bread, car, haircuts; rising wages, rents,etc.1
1Paul A. Samuelson, Economics, 11th ed. (New York,1980), p. 255.
9
10
H
'H
0:a
\O V00ONOD\10 \C0 \c) \o0ON ONa,%ON ONA T- 1-1 T- T
to
0)
- 11- -- \ON11 ON ON olON= T- T-T- T-
>C\ .10 \00
C" f -4t00 ~ON--- C\
(sNI o4(N
NI ----- \
Cml1 NON
*C, 00 0,o
E - \-c 4"N 0
CN 0\m0 0 00
(NI MNC 00 0
* 0 0 N 0
(N )eNv-CN0. . .
\0 >00s ON\C) t- O 01\CD0V co - 0ONON ONNONT- T- T- T- T-
CN0>>~
4') 00N(
--t2cC\OQN
m Oo V-
L* 0 0 n0-*
0C ON\-O-
. . . 0 .
N 020
0\ 00 C- 02\0N 00t \ 0 0
Tr- tsn Nr
--t ON n nr
r- 4f\0 00V- T-
0000 00ON OINONT- T-- T-
00
0
0,
C* 0 0 \0 C0
--t cr It00(NIn noN N
L--C\(CON L-C\2
004046
0 0 It0 1010
0C 0N mEll
> CCO\N C \
*c 0 -- It0 0
r- 0 C-0 ONNON 00 00
ar\ C m ls
M 0 t0-0 \0
(NIONe-0000
No- 0- o
* 0 0 N 0
(r\O0 NO- - - I
1)
boU>
0 ONO*0 0
No"N -'
C\ 10A
o 0 0
. . 0
000
\0 0 0
C\2
CD CD
N
\0C)
H
Sa
%O)o00P-SR H
bH -
~rd
P-i
H
CDHPH
000
0 f0 p
PH
ZatZ -
H
H2
O0'
00-
m 4
O 0-
H L-O
to 0 ON
ol e p
-H '
0 + 01
4-D-) to H
4-D
0~ 0 r:i H-1 z 0)
rd o eiHoH
-P 0'
H 010
to .HH.P-1 o[c11
rO 'H 1 :1
CD ) 0)E
a)
00d
HCd0)
-.- i I'
"30)
11
Many definition of inflation have some different des-
criptions, but a general conception of inflation is a
persistent increase of the general level of prices. Which
measurement of inflation is the best for a description of
inflation? In most countries, the choice of a price index
to represent the general price level in measurement of
inflation is quote wide. In the case of orea, the main
possibilities are as follow:
(a) the wholesale price index (WPI);
(b) the consumer price index (CPI);
(c) G.N.P. deflator;
In this study, WPI, CPI and GNP deflator will be used to-
gether for measurement of general price level in Korea.
According to International Finance Statistics, WPI and
CPI in Korea are defined as follows:
WPI: Data refer to the average price level of
all types of commodities brought and sold in domestic
primary markets. The index includes imported goods.
CPI: Data refer to the all cities consumer price
index, 349 items. The weights and items selected were
derived from a family expenditure suyvey conducted in
1980 in nine cities, including Seoul.2
GNP deflator can be obtained by dividing the current price
of GNP by the real GNP. (TABLE IV) shows the weight of
major goods and serveces covered in Koreats wholesale price
index and consumer price index.
2International. Finance Statistics (IMF, June 1984).
pp. 500-501.
12
TABLE IV
WEIGHT OF MAJOR ITEM IN KOREA WPI AND CPI(%)
ITEMS WPI CPI
Agriculture product 15.5 36.8
Final consumer goods 37.9 37.7
Final capital goods 5.8 0.0
Intermediate goods 40.8 0.0
Service 0.0 25.5
Total 100.0% 100.0%
*The weights cover all commodities supplied to domestic
primary markets in 1980.Source: The Bank of Korea, Mont Bulletin, July,1984, p. 69 & p. 80.
As is shown, there is a big difference in coverage items
and their we-ight between WPI and CPI. One difference is
about intermediate goods and service. WPI is seen to
compromise no service items, while they are represented
with relatively heavy weight in CPI. We know that inter-
mediate goods are input of business firms and services _
are demanded mostly by consumers. These facts enable ius'
13
to believe that WPI is more closely related to costs of
firms and CPI to the movements of demand on the part of
the consumer.
With these comprehensions of WPI and CPI, we will
analyze causes of inflation in Korea.
The Effects of Import Prices
In Korea, the majority of low materials depends on
import from aboard (crude petroleum, wood, mineral products,
rubber, etc.). Total import bill was 37.8 per cent of the
GNP in 1983. Coal is Korea's only heating and cooking
fuel. Korea's import bill for petroleum was 21.3 per cent
for total import bill in 1983.3 Energy prices rose sharply
when the first and second oil shocks occurred in 1973 and
1979. The increases of oil prices directly effects related
products of petroleum. This external stimulus through
import to the domestic price level was relatively larger
than any other developing countries. Oil shock means
that import prices are suddenly increased. The increases
of import price has affected the domestic price level.
3Source: The Bank of Korea, Monthly Bulletin, July,1984. pp. 90-91.
7
/
i /
/i
/i
&CDO NO tr\tr\-st --st a e N N r rI r-
14
mo
00
00
000
cci
O -C)
0-
0)
0 10I\C
> 1 4:
1 --
1- t -H
C2 ~
H
C)ON
0 PCl)
rd
H0
CHo
a) 00
0 rci
0 OON
cd
P1H
rd
0Ici
OH
Er-
%0
15
To illustrate how the increase of import prices has
affected the consumer price index, (fig. 2) shows the
annual growth rate of import price index and that of CPI
in 1966-1983. The rapid increases in the import price
index in 1973-1974 and again in 1979-1980 are clearly
noticable in Fig. 2. The consumer price index also had
two peaks in the same periods. From 1966 through 1972,
the import price showed little change. That means that
the CPI was very stable in that period. The inflation
rate has gone through a- remarkable decline during the
past two years because of the decrease of import prices.
This type of inflation was attributed to foreign influences
and is called "Imported inflation."4
The Effects of Wages
If the rate of increase of real wage is greater than
that of labor productivity, it will be a cause of rising
price level. From 1966 to 1983, an average annual rate
of nominal wage was 23.8 per cent. CPI rose at an annual
rate of 14.4 per cent in the same period. At the same
time, an annual rate of labor productivity was only
4.15 per cent.5 It means that inflation was caused by the
4 Phillip Cagan, "Imported Inflation 1973-1974 and theAccommodation Issues," Journal of Money, Credit, and Banking,XII (February, 1980), 7. 1.
5 Source: The Bank of Korea, Economic Statistic Yearbook.
16
increase of wages to some degree during 1966-1983.
But one thing we should consider is that the wage
cost is a relatively small part of the total cost for
products in Korea. (TABLE V) shows us the structure of
total cost for products.
TABLE V
THE STRUCTURE OF TOTAL COST FOR PRODUCTS
Item 1970 1978
1 Raw material and cost of capital 45.7 53.4
a. Wage (18.9) (16.5)b. Tax (4.2) (2.3)
c. Depreciation cost (2.8) (3.5)d. Profit, interest, rent, etc.(28.4) (24.3)
2 Vaule added (a+bc+d) 54.3 46.6
3 Total cost (1+2) 100.0 100.0
Source: B. L. Song, Korean Economy (Seoul, 1983), p.210.
The rate of composition of wage cost for total cost was
only 16.5 per cent in 1978. It was due to abundant labor
supply in Korea. Raw material and the cost of capital was
the biggest part of total cost, and the second biggest part
of that was profit, interest, rent, etc. The third one was
wage cost. Otherwise, these relations among elements of
17
costs represent the relative importance of cost push infla-
tion in Korea.
The Effects of Money Growth
(Fig. 3) illustrates the annual percentage change of
the narrowly defined money supply M1 and that of CPI. An
average annual percentage change of money supply was 30.0
per cent during 1966-1983, but that of CPI was 14.4 per
cent. From 1966 to 1983, money supply rose more rapidly
than CPI except for the period in 1980-1981. The change
rate of money supply was varied in that period. Otherwise,
it was not stable. We cannot ascertain a relationship
between the change of money supply and that of CPI in the
figure.
Monetarists suggest that the change of price level
(rate of inflation) is consistent with that of money
supply in the long run, but short-term movements in price
indexes are caused by nonmonetary factors (oil shocks,
corp failures, etc.).6 Monetarists suggest that the current
rate of change of price level was caused by the lagged
rate of change of money supply. A simple monetary
guideline to inflation is as follows:
The rate of change of price over the next year
6Albert E. Burger, "Is Inflation All Due to Money?"Federal Reserve Bank of St. Louis Review, LX (December,19'7),p. 9.
18
r
00H
00 -
H d
'9 00
\0 H
-0H q
02
4-D>
00 CD )
0
H Cd OH D~Q
0 1
\:: d c0
HO -4
:2E: ci>
0 1210
O
ir
> 02~4 +-q
CD L( 0 LC 0 V' C) L\ C) - CD 4i) Q W) C\"o L-,\ L -, -t M C(-\ \? O
19
is equal the average of growth of the moneystock over the previous five years.7
In the Fig. 3, we can find some evidence of above
guideline. Two peaks of the annual growth rate of CPI
may be caused by the previous two peaks of that of money
stock. But we cannot find an obvious correlationship
between money supply and level in the graphical
method.
We can find some reasons why monetary expansion
cannot explain the inflationary process in Korea.
First, the change in real interest rates paid on
time deposits have had a big variation since 1966.
During the period from 1966 to 1971, Korean economy
had achieved high growth and economic stability.
This was due mainly to the rise in real interest rates
paid on time deposits beginning in 1966 (see TABLE VI).
The change in the interest rate is the main element of
monetary expansion. So, monetary policy alone cannot
explain the inflation in the face of highly expansionary
fiscal policy.8
The second reason was the existance of unorganized
money market in Korea like other developing countries:
7 Albert E. Beuger, "Is Inflation All Due to Money?"Federal Reserve Bank of St. Louis Review, LX (December,1978), p. 9.
8 David C. Cole and Y. C. Park, Financial Developmentin Korea (Harverd, 1983), p. 245.
20
TABLE VI
PRICE INDEXES AND INTEREST RATES IN 1966-1983
Year Percentage Percentage Nominal Real depositchange in change in interest interest
WPI CPI rate
19661967
1968
1969
1970
1971
1972
1973
1974
1975
1976
1977
1978
1979
1980
1981
1982
1983
9.0
6.4
8.1
12.1
11.4
12.0
8.9
4.7
37.2
26.6
12.1
9.0
11.7
18.8
38.9
20.4
4.6
0.2
11.7
11.1
10.6
12.5
16.0
13.5
11.7
3.2
24.3
25.3
15.3
10.1
14.4
18.3
28.9
21.3
7.3
3.4
30.0
30.0
26.0
24.0
22.8
22.0
15.0
12.6
15.0
15.0
15.6
15.8
16.9
18.6
19.5
17.4
8.0
8.0
+21.0
+23.6
+17.9
+11.9
+11.4
+10.0
+6.1
+7.9
-22.2
11.6
+3.5+6.8
+5.3-0.2
-19.4-3.0
+3.4
+7.8
Time deposit on one year base
Adjusted for WPI (Nominal interest-WPI)Source: The Bank of Korea, National Income in Korea, 1978.
The Bank of Korea, Monthl Bulletin, July, 1984.
21
Because most of the regular bank loans andforeign-loan guarantee were, in fact, long term,there was an important need for the unorganizedinstitutions to meet urgent short-term require-ments.9
A Presidential Emergency Decree was promulgated on
August 3, 1972, and introduced some drastic measure for
the unorganized money market, but the purpose was col-
lapsed because of the first oil-shock in 1973.10
9Cole, p. 283.
10 Cole, p. 271.
CHAPTER III
SURVEY OF LITERATURE
Type of Inflation by Causes
Since most prices in a mixed economy result from the
action of supply and demand, we can distinguish between
explanations of causes of inflation that stress the
demand side of the market (the so-called "demand-pull")
and those which emphasize the condition of supply (the
so-called "cost push"). Demand inflations are caused by
an excess of aggregate demand goods and services over
available supplies, at a given level of prices. For
example, the monetarists' theory of inflation emphasizes
increase in the supply of money faster than increase. in
the demand for money, which causes a larger demand for
goods and services, thus tending to pull prices up.
On the other hand, the cost-push theory ascribes
inflation to increases in cost which are independent of
the state of aggregate demand. For example, the price
increases for import goods caused by oil shock, wage
- ~ ~ ~ ~ ~ . . ... ........Iii .A ||
1Thomas M. Havrilesky and John T. Boorman, TheCurrent Issues in Monetary Theory and Policy (ITlinois,1980), pp. 232-233.
22
23
increase, foreign exchange devaluation, etc., will
directly raise the cost of living through higher prices
for finished good imports and indirectly through more
costly imported materials used by domestic producers.
In addition, trade unions may force wages up more
rapidly than increases in labor productivity. It is
especially called the name "wage push" inflation.
Monetarists suggest that:
Inflation is a persistent rise in the overall(or average) level of prices of all goods and services.This definition must be distinguished from an increasein relative prices (e.g., a rise the price of wheator oil) which, as argued below, is not inflation.Some advocates of the cost-push view confuse relativeprice changes with changes in the overall price level.
Changes in the prices of individual goods donot cause inflation, although they do affect itsmeasurement.2
Otherwise, nonmonetary factors can produce temporary
effects on the measured rate. They maintain that only
monetary factors are a reasonably good guide to the year-
to-year behavior of prices.3
Monetarist and Structuralist
There have been many attempts to empirically test the
economic relations assumed by one side or the other in
the monetarist-structuralist debate. Structuralists
and monetarists disagree on the cause of inflation and
2 Dallas S. Batten, "Inflation: The Cost-Push Myth,"Federal Reserve Bank of St. Louis Review, LXIII (June/July, 1981), p. 20.
3 Batten, p. 22.
24
appropriate policy response to inflation.
Monerarist's position on the cause of inflation can
be summarized briefly in that excess demand is responsible
for price increases. Increase in money income occurs in
response to increases in aggregate demand. So, they
do not consider either structural or cost-push causes of
inflation. Monetarist's model assumes the rate of growth
of the money stock as an exogenous variable. The policy
prescriptions offered by monetarist that inflation must
be ended with a program of monetary and fiscal restraint
since it is the lack of such restraint which led to the
rising prices.
The structuralist approach was used to explain
causes of inflation of Latin America in the 1950s.4
Those of Latin American countries have experienced the
high inflation relatively. Especially, food bottlenecks
are assumed to generate inflation because developing
countries' nonfarm prices are relatively fixed whereas
their agricultural prices are flexible.5 Structuralists
differ in the emphasis they give to various factors.
They stress that "structural causes" are at the root of
4 Susan M. Watcher, Latin American Inflation(Massachusetts, 1976), p. 4.
5Alfredo J. Canavese, "The Structuralist Explanationin the Inflation," World Development, X (July, 1982),p. 524.
25
inflation. Change in import price can also have
important direct and indirect effects on domestic
prices. Indeed, in a world of fixed exchange rates,
externational inflation may have a primary role in
causing domestic inflation. Structuralists regard the
agriculture and foreign trade as well as government
sectors as the causes of inflation with economic develop-
ment.6
Both monetarists and structuralists think the role
of money as the cause of inflation. But monetarists
regard the monetary expansion as an exogenous variable.
Many studies support the growth of money stock as an
endogenous variable in developing countries.
Theorotical Formulation
A great many models of the inflationary process have
been proposed in the last years, and it would not be pos-
sible to cover them all in this paper. I surveyed some
monetarist and structuralist models to explain the infla-
tionary process. Monetarists emphasize that inflation
is primarily a monetary phenomenon; that is:
6Wacher, p. 4.
7 Krishan G. Saini, "The Monetarist Explanation ofInflation: The Experience of Six Asian Countries,t" WorldDevelopment, X (October, 1982), p. 871.
26
The primary factors influencing future inflationare current and past behavior of the money stock.8
They regard the rate of growth of real income, together
with the impact of inflationary expectation and any lagged
adjustment to changes to the money stock.9
On the other hand, structuralists think that money
stock is an endogenous variable as well as exogenous.
They regard the rise of food price as another exogenous
variable to explain inflation.1 0
a) A Typical Simple Test11
In the quantity equation (MV = PY), monetarists
think that the velocity of money is very stable in the
economic process, so they regard that the rate of change
of velocity is constant in the short run.
MV = PY....... (1)
take the natural log of both sides of (1)
lnM + lnV = lnP + lnY
regard that lnV is constant
8R. W. Hafer, "Inflation: Assessing Its Recent Behavior
and Future Prospects," Federal Reserve Bank of St. LouisReview, LXV (August/September, 1983), p.T36
9Harvilesky, p. 233.
10 Subrate Ghatak, Monetary Economics in Developingcountries (New York, 1981), pp. 73-75.
1 1Ghatak, pp. 69-70.
27
DP = a + bDM - cDY
DPt-DPt1where DP = annual rate of inflation (DP= ~DPt1
DM = annual rate of money stock
DY = annual rate of real income growth
This model is carried out by Meiselman on pooled data
for sixteen Latin American countries in the period 1950-
1969. He obtains the following results:
DP = 1.35 + 1.05DM - 1.38DY(0.57) (22.31) (3.35)
R2 = 0.98(t values given in parentheses)
This results implies that for a given growth rate of
real income, price changes are the consequence of changes
in the money stock.
b) Harberger's Model12
Harberger's model was used in empirical analysis of
the causes of inflation in Chile. After its publication,
his model was used by Vogel to explain the inflation in
sixteen Latin American countries. Econometric model is
as follows:
DP = k + dDM + eDMt- (1+a)DY + b(DP -DP2)
where DP = the annual percentage change of price level
1 2Arnold C. Harberger, "The Dynamics of Inflationin Chile," Measurement in Economics, edited by Carl Christ(Stanford, 1963), pp. 219-250.
28
DMt = the current percentage change of money supply
DYt = the annual percentage change of real income
DPt- DPt-2 =the rate of change of the expectedcost of holding money
All variables are expressed as percentage changes. He
used quarterly data as well as an annual data. He made
many similar models including wage as an explanatory
variable:
DPt = DYt + DMt + DMt1 + (DPt-DPt-2) + DWt
where DWt = the percentage change of nominal wage
Harberger does not adopt the entirely monetaristst position.
His model was a mixed monetarist and structurist model.
His hypothesis was tested by using 20 yearly observations
The explanatory power of his equation was good and the
result appeared reasonable.
c) St. Louis' model
29
We can say that this model is the core of monetarist
models. It explains that measures as total spending,
prices, and unemployment are terms of changes of money.
They based this on empirical evidence amassed over the
variety of periods. To illustrate the effect of non-
monetary factors on the measured rate of inflation,
(Fig. 4) depicts the effect of transitory nonmometary
shock on the trand rate of inflation.
pricelevel
rate ofchange
of price
D
E
'of BD
slope slope
ofAB of DE
Source: Dallas S. Batten, "Inflation: The Cost-PushMyth," Federal Reserve Bank of St. Louis Review,LXIII (June/July, 1981)2, p. 2~~
Fig. 4--Effect of transitory nonmometary shock on thetrend rate of inflation
I
30
The slope of line (the rate of inflation) was related to
the trend rate of money growth. If the price of oil has
increased at time to, the result had been an increase in
the level of prices over. The higher price level (the
slope of BD) is depicted in the figure by time span to to
t1 . From t0 to t1 , the measured rate of inflation is
higher than that attributed solely to monetary factors.
Once adjustment period ends, the rate of inflation
represented by the same slope of the line (AB and DE).
It means that while non-monetary factors can influence the
measured inflation for relatively short period, monetary
factors determine the long-term path of inflation.
St. Louis econometric model for the inflation is
as follows:
n
DP = a0 + a w.DMt + u0 i=0 -
where DP = rate of change of prices, measured as the firstdifference in the natural logarithm.
DM = rate of change of money stock, measured as thefirst difference in the natural logarithm.13
This equation implies that the rate of change of prices
can be expressed as a function of the rate of change of
the money stock in the current and previous period. If
13 R. W. Haffer, "Inflation: Assessing its RecentBehavior and Future Prospect,?" Federal Reserve Bank ofSt, Louis Review, LXV (August/September, 1983),p. 39.
31
the sum of coefficient of DM becomes 1, it means that
the rate of change of prices can be explained by that
of the money stock perfectly, without considering non-
monetary factors.14
1 4 Denis S. Karnosky, "The Link Between Money and
Prices in 1971-1976," Federal Reserve Bank of St. Louis
Review, LVIII (June, 1976) . 18.
CHAPTER IV
ANALYSIS OF THE EMPIRICAL RESULTS
Test with Annual Time Series Data
To find out whether these changes are cause of in-
flation, we hypothesized that Korea inflation was a
"mixed" inflation generated not only by monetary factors
but also structural factors. The hypothesis was tested
by regression analysis using time series data based on
23 yearly observations from 1961 to 1983. The statictical
significance of the estimated coefficients has tested
at a five per cent level.
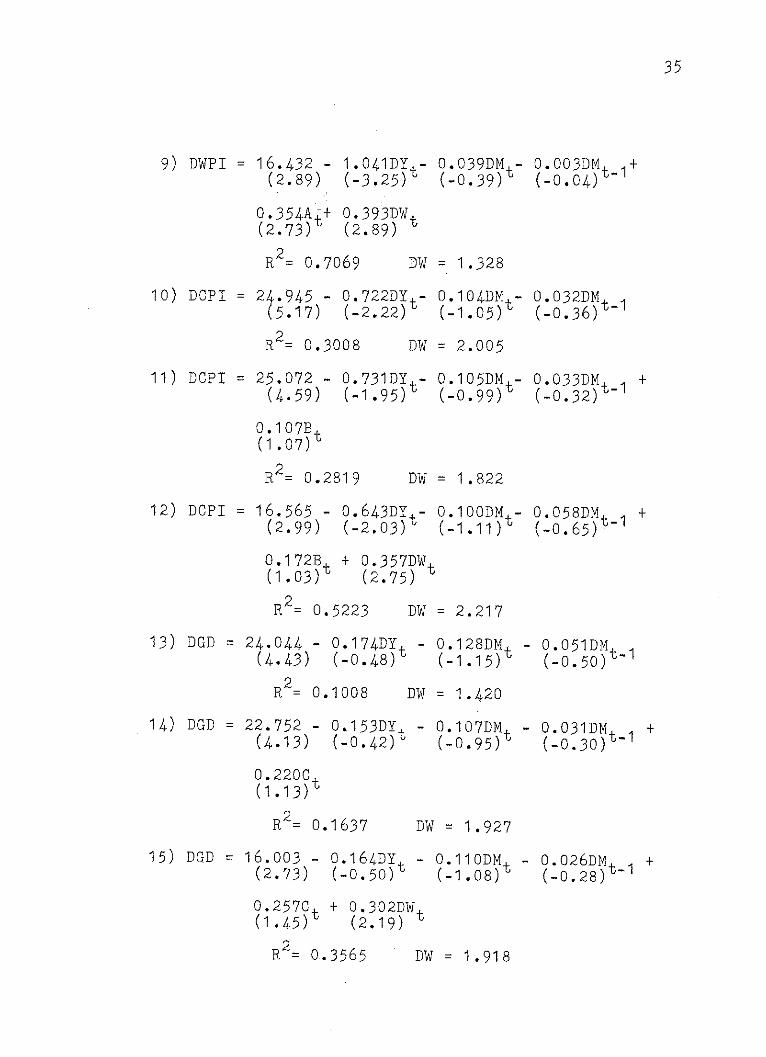
First, a typical simple model carried by Meiselman
was used for analysis. DM is the percentage change of
the narrowly defined money supply M1, 1 DY is the percentage
change of real income growth, and DWPI, DCPI, and DGD are
the percentage change of WPI, CPI, and GD.2 The results
The coefficients of DMt-2 and DMt-3 only have right signs,
but they are not significant statistically.
b) Other Developing Countries
Arno:ld Harberger's model was applied to explain
Chilean inflation for the period 1939-1958. He used
various price indexes as dependent variables. His explan-
tory power of his equations was good and the results
appeared reasonable. After his publication, his regres-
sion model was adopted to other Latin American countries
by other analysists. Robert Vogel's study showed that
Harberger's model was also well applied to Latin American
countries.5 Latin American countries have experienced
an almost entirely high inflation experience.
But the Asian countries have experienced relatively
5 Robert C. Vogel, "The Dynamics of inflation in LatinAmerican, 1950-1969,1" American Economic Review, LXIV,(March, 1974), pp. 102-114.
41
low and moderate inflation. Saini' study showed that the
Harberger-type model was not adequately adopted to the
six Asian countries. His study especially supported the
theory that the monetary factors were captured by the non-
monetary factors in those countries. He pointed out
several reasons why his result was different from Harberger's.
There are different inflationary experience and different
economic structures and widely dissimilar economic per-
formances. Another pointed out was two oil shocks during
Saini's sample period. 6
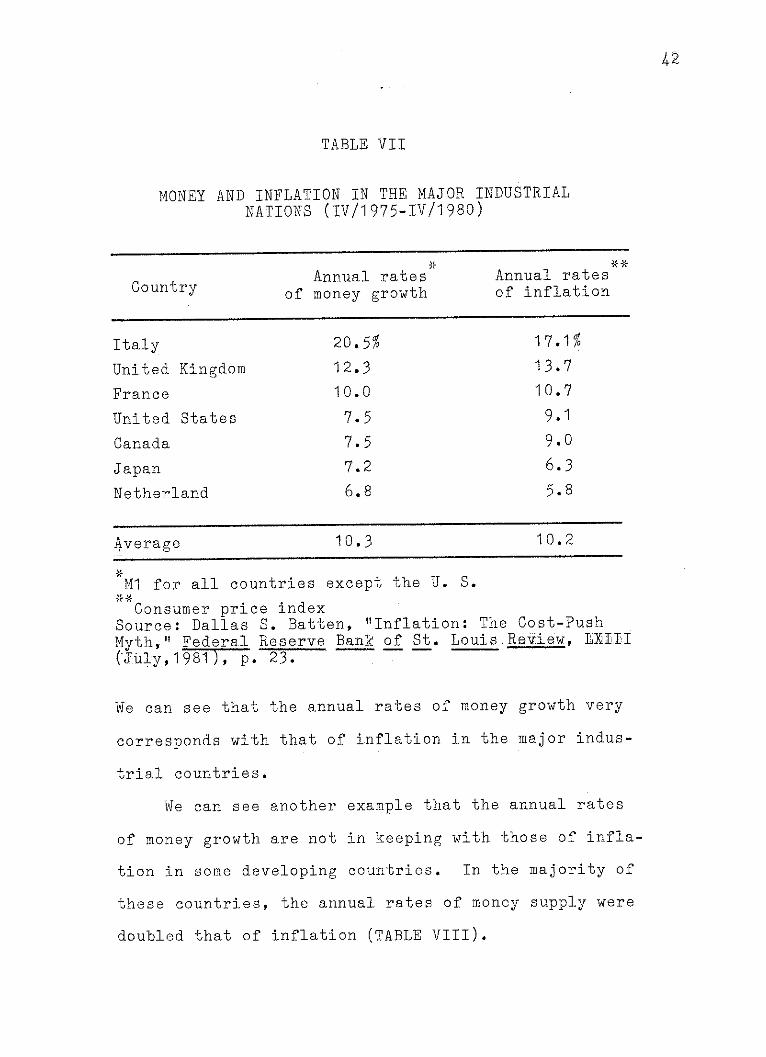
c) Cross Country Comparisons
Monetarists show a good example of money growth and
inflation. (TABLE VII) shows a cross-country comparison
of the rate of money growth and price level over 20-quar-
ters period for major industrial nations. The countries
are ranked in descending order according to the rate of
money growth experienced during the period. The country
of high rate of money growth have high rate of inflation.
Especially, an average percentage change of money supply
was 10.3% and that of inflation was 10.2% in these countries.
6 Krishan G. Saini, "The Monetarist Explanation: The
Experience of Six Asian Countries," World Development,
X (October, 1982), p. 871.
42
TABLE VII
MONEY AND INFLATION IN THE MAJOR INDUSTRIALNATIONS (IV/1975-IV/1980)
Annual rates Annual ratesCountry of money growth of inflation
Italy 20.5% 17.1%
United Kingdom 12.3 13.7
France 10.0 10.7
United States 7.5 9.1
Canada 7.5 9.0
Japan 7.2 6.3
Netherland 6.8 5.8
Average 10.3 10.2
Ml for all countries except the U. S.
Consumer price indexSource: Dallas S. Batten, "Inflation: The Cost-PushMyth," Federal Reserve Bank of St. LouisReView, LXIII(.uly,1981), p. 23.
We can see that the annual rates of money growth very
corresponds with that of inflation in the major indus-
trial countries.
We can see another example that the annual rates
of money growth are not in keeping with those of infla-
tion in some developing countries. In the majority of
these countries, the annual rates of money supply were
doubled that of inflation (TABLE VIII).
43
TABLE VIII
MONEY AND INFLATION IN SEVEN DEVELOPING COUNTRIES(1976-1980)
Annual rates Annual ratesCountry of money growth of inflation
Indonesia 31.9% 15.7%
Korea 27.4 18.7
Ecuador 24.5 11.7
Pakistan 22.1 9.0
Costarica 21.2 8.2
Bangladesh 20.0 8.0
Honduras 18.2 9.5
Average 23.6 11.5
*M1
Consumer price indexSource: IMF, International Finance Statistics.
In descending order according to the rate of money growth,
Korea and Honduras violate the ordering of inflation with
the rate of money growth. An average percentage change
of money supply was 23.6%, but that of inflation was only
11.5% in these countries.
The Limitation of Analysis
Inflation is like the weather: everyone talks
44
about it; no one does not anything about it.
That means that no one can find the cause of infla-
tion exactly, and that inflation is beyond our control.
The monetarist's theory is summarized as follows:
Inflation is primarily a monetary phenomenon;that is, the primary factors influencing futureinflation are the current and past behavior of themoney stock.8
But I would like to say that inflation may be caused by
all economic aspects. Only money, import prices, and
wages were to analyze the cause of inflation in this
study. I don't think absolutely that these results from
three economic aspects are enough to find generations
of inflation in Korea.
Many econometric models have been developed and
applied to many countries over a variety of period for
analysis of inflation. But, in my study, Harbergers
type of inflation model has focused on the inflation in
Korea. Jae Wan Chung's study showed that the nature and
causes of inflation in Korea were caused by multi-factors,
both internal and external factors by using the two-way
causation between prices and wages.9 According to his
explanation, the classical two-way is as follow:
7George W. Wilson,. Inflation (Bloomington, 1982),p. 1.
8R. W. Hafer, "Inflation: Assessing Its RecentBehavior and Future Prospects," Federal Reserve Bank ofSt. Louis Review, LXV (August/September, 1983), p. 36.
9Jae Wan Chung, "Inflation in Newly IndustrializedCountry: The Case of Korea," World Development, X (July,
1982). pp. 531-539.
45
Prices are assumed to increase due to increasesin wages and the costs of capital and materials, onthe one hand, and due to increases in aggregate spend-ing and thus economic growth, on the other hand.10
Another obstacle to find causes of inflation is the
existance of the black market where prices are higher
than official ones:
This discrepancy not only made the public distrustthe official price statistics, but also caused forma-tion of a distorted and higher expectation of futureprices on the basis of black-market prices.11
This statistical discrepancy and higher expectation of
future prices will be an obvious limitation to find exact
causes of inflation in Korea.
Conclusion
In this chapter, Harberger's model was applied to
find out causes of inflation in Korea. Only the changes
of import prices and wage were significant statistically.
But I could not find an obvious relationship between the
rate of inflation and that of monetary expansion in Korea
for the period 1961-1983. Generally, it is known that
the money supply is less responsible for the behavior of
inflation in developing countries. We can find some
reasons why the variation of money supply cannot explain
10 Jae Wan Chung, "Inflation in Newly IndustrializedCountry: The Case ofiKorea," World Developmement, X (July,1982).., p. 531.
11 David C. Cole and Y. C. Park, Financial Developmentin Korea (Harvard, 1983), p. 237.
46
well the variation of price level in those countries.
First, we can find an economic bottleneck in develop-
ing countries. In this situation, the supply of money is
not sensitive for the price level. Larger investment will
be required to achieve the economic growth in develop-
ing countries than industrial countries.
Second, in the course of economic development,
monetization may have endogenized the growth in money
supply. Structural changes may make part of the monetary
growth endogenous. We can one example from Canavese's
study:
Both a growing industrial sector and an in-creasing urbanization produce a change in the amountand structure of food and raw materials demanded.Low agricultural sector productivity does not allowfor a quick response of supply to the new demand.The relative price of agricultural goods tends torise. If industrial prices are inflexible downwardbecause of an oligopolistic market structure, moneyprices of agricultural goods must rise. . . . Thewhole process assumes the existance of passive moneysupply that assures equilibrium in money market.12
Saini's study showed that money supply in the six Asian
countries may have endogenous variables, so he thought
that the monetarists' model failed in the explanation
of inflation in those countries.1 3
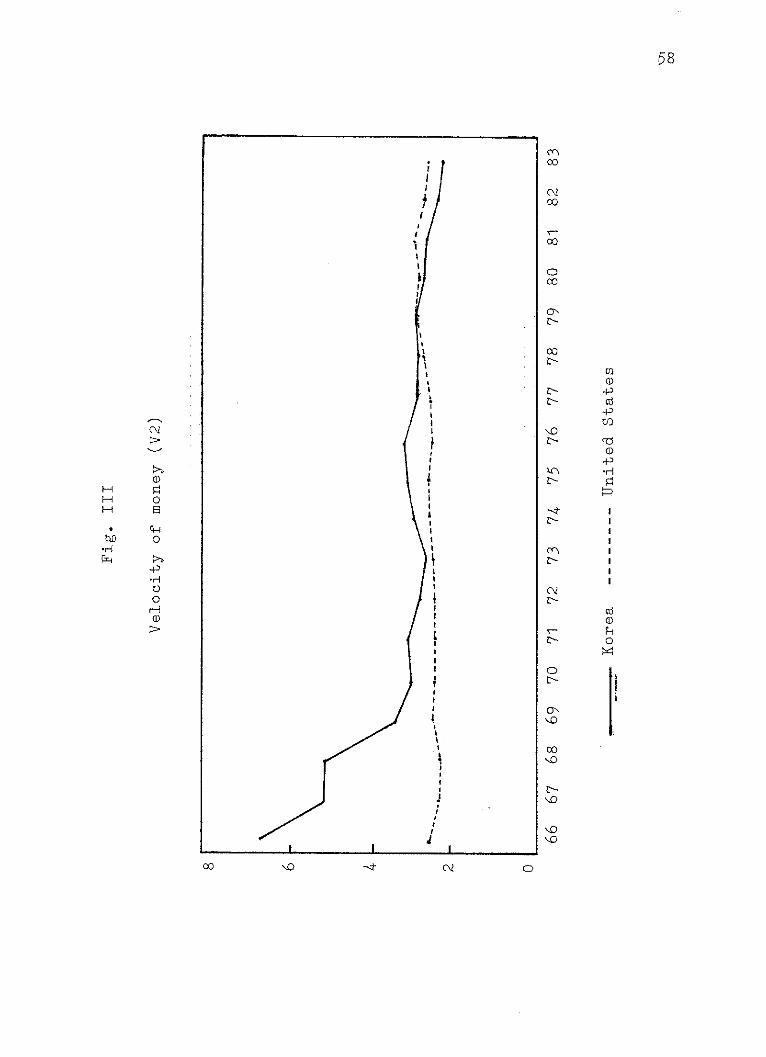
Third, change in velocity of money may also have
played a part in the inflation experience of developing
12 Alfredo J. Canavese, "The Structuralist Explana-tion in the Theory of Inflation, " World Development, X(July, 1982), p. 524.
1 3 Saini, p. 871.
47
countries. Monetarists postulate that the velocity of
money is stable in the long run, so the growth rate of
price level will be only related to the changes of money
supply. But in the case of Korea, the velocity of money
was not stable for the period 1966-1983. In comparison
with the United States, the velocity of money in the U. S.
was more stable than that in Korea for the same period
(APPENDIX). In this variation of velocity, monetarists'
models could not explain the causation in money and
inflation.
Fourth, it is well known that there are unorganized
money markets in developing countries because of a limited
supply of funds.1 4 A well developed financial system is
important for efficient allocation of capital between
competing uses. These different financial structures
between the industrial countries and developing countries
may be a cause of why the monetarists' model is not appro-
priate for the explanation of inflation in developing
countries.
Finally, large external shock was an obstacle to
explain the cause of inflation by using the monetarist's
model. Since 1973, these non-monetary factors may have
an important role in the behavior of inflation in major
14 A. P. Thirlwell, Inflation, Saving and Growth inDeveloping Countries (New York, 1974), p. 117.
48
industrial nations as well as developing countriea.15
Because of above reasons, many empirical results
shows that growth of money supply may not be the pri-
mary source of inflation in developing countries.
15Lloyd B. Thomas, Jr. and Krishna R. Akkina, "Re-cent Inflation in ten Industrial Nations: Some TestsUsing Monetarist Model," Review of Business & EconomicResearch, XVIII (Fall, 1982), pp. 60-73.
CHAPTER V
CONCLUSIONS
Summary
Korean economy, with a recent history of rapid
economic growth, has been experiencing a series of
problems between economic growth and price stability.
This study has focused on three economic aspects
to survey causes of inflation in Korea during the period
1961-1983. I adopted some empirical models in regres-
sion analysis of time series data in Korea.
The correlation between inflation and import
prices was positive and significant statistically.
We can say that inflation in Korea was transmitted from
resource-exporting countries.
Money supply in Korea was not stable during the
sample period. The rate of growth of money stock doubled
that of the price level. In the regression analysis,
monetary variables were not significant statistically.
The monetarist model was inadequate in explaining the
variation in prices. Like any other developing coun-
try, we can find some reason why the monetarist model
was not suitable for explaining the causes of inflation.
49
50
There are the existance of economic bottleneck, money
supply as an endogenous variable, the variation of velo-
city, an unorganized money market, and large external
shocks in developing countries. In addition, I can
point out the variation of real interest and the existance
of black market in Korea.
The correlation between wage and inflation was sig-
nificant statistically. It may not have played an impor-
tant role in Korea because the wage cost was a relatively
small part of total cost for products.
Policy Implications
The increase in the prices of imported raw materials
transferred to the domestic price level directly, since
Korea's exports and imports of goods and services already
accounted for approximately 35.3 per cent and 37.8 per
cent of GNP in 1983. It seems that independent domestic
measures for price stabilization have only a limited
effect. Beginning in 1973, however, Korea was faced
with a new type of inflation, which can be described as
"imported inflation."
Monetarists and structurists agree with the idea
that money supply has an important part in the fight
against inflation. To extend that such major price (raw
material and capital goods) increase due to foreign
51
influence, inflation could not be immediately prevented
by domestic monetary restraints. In this situation,
traditional monetary policies are inappropriate. Phillip
Cagan proposed "accommodated monetary policy." That is
as follow:
Supply the monetary growth needed to sustain
the higher prices resulting from foreing influence.
Monetary growth was reduced and the usual
sings of a tight monetary policy appeared, reflec-
ing ara unusually sharp decline in the real value
of money balances due to slower monetary growth
and higher inflation.1
The growth rate of nominal wage also affected to
the price level. Domestic inflation can be tamed in some
degree. It is needed to make a standard wage rate reflec-
ting labor productivity and price level.
1Phillip Cagan, "Imported Inflation 1973-1974 and
the Accommodation. Is sue," Money, Credit, and Banking,
XII (February, 1980), pp. 1-3.
APPENDIX
0
rd
0)-P
cii
-P
0
0
L( -D 00 \,
C\2 ON CY\ 00 000 0 9 0
- %r- M0
mr c(>ON00 00
m~ 0 0%0 0%E
02 --tCO N \O
0 - CT- I'
N C xxlr
\Q > -00 QN C0
\0\O\O' O>
Q'N ON ON ON O\T- r- V- N
52
00 C\ C\\OE
00 ON (YN)ON
00- ol l N0
C\ m 0 9 0
% 0 4% 0% 0%
O >00 ONON
1\00 Cm\CmON (IQ Cm m \
0N N ME-cx s
C~-f>ON
ON ON ON ON ONA =T-T l
*l CC \0 m0ON>s OO ~O tC\
ON CC C02
~0 0 0 0 0c\ 00 C) ON
1 0 00>
Mr- 00% N%\2
C- N- - L -
N0 01 \ o 0m
(Y) >02ON -I
N N NO NM
ON V N
T- I- I I N
P4
0
cc'00
ONr-
H
p-~qF4<C-:::
C
-H
4K
0)4
0
0
CH0)
rd
PHq
z0
0)
-H
P4
H -P
Cdr j2
0) Z
FreO
0
PH
d
z0H
-HS
\O cf -
r-
C(')00
>0C)O NO (Ni(e\(\ oo
(~00 0
oo00 00NON ON
ST- N
xr\00.
ONC-00
-H2 Q 0CO I k-i
) 0cC)> o a)
o Hq
. H 0
d d -P
0 -ri 0 P
) H 0 CH d
~00 ~ 0%
0i -PI0I
O% PH 0rF4.. .,~ t
0 p
-P
pq H 04i
F1ci l co0 )F0f)0O
F-40)
A
0-P
H(1)rd
-H
pc
0
-p
H
Cd
z
0
H"3
OH
0H2
ON N ON
O 0 00
ON -C\ ->EI
DON CO0-
0 0 \0 \10
VN- 0 CI -4> 0
SN \ 0 \o
>00 O C)~0 1110 \0
\0 00ONOr. .0. .\.>
ON ON ON ON ONT-- T- T- A -
(N C\2 N tNT-( \ 2 --- tr
%-, C\ 0 0C
00 N 0i 0 NC
T-C\ N m --- t4
00C\Thx~0
oo -I 4C 00 CN
0s4 Ok Ok fN 0N O tN
C\?0(\2C
CI- - -
ON ON ON ON ON- T~ '-- v- r
53
E-H
4-)\\0 0
W\(\ 0 -04- 0 0 0 0
tWN N \0 --It
>x ~Q\0 ON C0
> \0V--m 4\ (NW\00
CY~h 0 (MMC
9% t ok ft(Y) m ON o
C-00 C\2 C~l
N Q ON 0C(04 0% ft ft ft
C C>C\2 ON-tr-=C\C\2 Mc
\C) > 00 ONO0O- O- - - .
O ON CN ON 01\
T--= Aso so
I
oN00
0
o
0
'H
H
H
00ON
0 \
V-
ON
ci
0
-H
rd
p
rd
z0d
C\ C\2
so Lr'N# 00
\Q LN (YN
ot 0% 4
(Y 0 \.O
E N 00
0 t\0 02
m>C\2 m
0 0% 9%
>020
00 00 00OINON ONT- T-T
o00 cr)ON 00V.ON
c'0
-P-0
cd
100
rki- H sI
O.H I
(1) 4-H
-Pp
cd tl)z
.1"3
oiQ
H
- H
H4H
00 0
rO
"30
"3
0CH
0
0
-)*H
0-pCH"3-p
ci)
z0|
II
0"30)
o
n
00C
ON
OCx
04-3
CH
rd
0
c)
'H 0Cd
b-0
b3
CI
0 0
P-)
ON
0
Lc 0 Lc C) c0 0 tL(\ C0
0C 0 0 0 0
0 Lv-L C
0 T- M 4* LA =
N~ -It N krN cl
t 00 LN 00
Cl 0 O C-00- C\2 -,t k00
m - ON N0& Cr W' LAON
00'O x\ 0
C- - CV (Y\
N 00 m \ 7 000 N O -\
r- r- T- C\r (T
\C t- 00 O 0
M co to0O e0 & O ON r
0 L 00 LON
00 \O 00 Lnall0 E-VON- C-\
00 Lr 00 r xr
(V Cr\ \ Ot ON -,ONt
'- C\? 0 T00
oON00 C\l
CCN )r4-)C-ON --
U' 1 00(V C \\
m - - r-
\O ONt -I- ON 00 ON C
S0N \l CNl(V
0 m -t>CV (\O 00 -t00 0
* *0 0 *0
00 E-0000 ON
LC\ XXON 00 C\
C2 00 ON 00 xr
C*- ~ ON C\
\ M0-0C\
CV m CC\0 O 00
'(tC\ Lr C
L( - N 00
C\2N MmON
MT- 00 N N
N0 0\--0 m
r --- tCN 2 1\
\.o t- 00 O Nc
rl-C- L-- - 00
ON ON ON ON ONT- T- T - -
55
HH
-:4EH
00ON
ON
0)
o l0
0)C0
-P
0
\O Ce
m 00
C M
0 000
r- - co
\O ONON
ON N
o 0 Lr 0
00O(DN00
ON00 G\
(Y)C\2 mCs% ft ft
C\200 -t
No--C
o00 00ON ON ONT- I- I
-Hto"3
'HS
0
0
rHHq
-H
0)q
00*ON
O O00
o o0 O
'H C1 &00
+ motcV C)
or-
00
Sto yto
. H 'H
0 1
rd- r--i
)- -P
rd C C
SHH
0
l- L-00 00 \o
0NN t N 0
C\ M ,t
ON ' 0 00
ONO&-0 C\ COCD(), 0 00 0
00 " t 0(YoNNoco
4 6 * 0 0
WrN (Y)r -- t C e
C' N C\ 4"\
o C0a',0 r -C\CO rONO tr\
0*L)- 0 0 0
\0 ONCC\ NtO
~CONCat t'O\- O NMOt N
\0 t - 00 ON 0
\( 0 0 \0 CI
O0 N ON ON ONN - - - - 1%
V'*C 0 00 0
0 lx-
tQ\0 0 ONO
*0 0 Onr 0
LCO ON-4(c\
011 C\mON
0 0 \ 0 0 O N
E- -0t 0
It\0 1 C 002N N C\? m
\D ON -ItC\2 C\2
0 -t U*
N M -t U,\i rS0 0 4 9\ 0
ON ON ON ON ONT- T- N - N ~
trC\\0 O OO
ON V -tv- E0
CC CO0 C\
m\* 00 0 N
ONC00t0 00 1>-
(N? \ N?\, 0 N00
\,O Ns 00 00
Mc$\M0 r\N
* 0 0 0N 0 N
4-\ c's 00 N \10
CO m mC\ -4 I
4-N LC) k-st
ot CNOO>mrmm-r~t-t
C) m O er\00 eocx C Ct -
>s ON r t- O
0 >s 00 ONO1 - Cl- Ll- 00ON ON ON ON ON
I = I- -- T
56
-H
F:1
crx00GOO
O
o
'-d
-P
0-P
'H
0
CVN
'H
'i
-0
H
-H
to
HH0
-HH
e00 rr00 C-
mC\N C\
007
ON 0
00 m 00
.0.0\0
(f c-
N 01 0r\
4'\0C\ Cl
fN0 C\,
ONO N?
-tr- N-
CO- t(r C
>r tf\\,0
ON O (V
00 CO GOON ON ON
cc00
0O
0 cd a
r-tCO /
(D
00
C\2ct oi
-H aC2 m
rd cd C2-H .H
rdF11 0
* i- -p0 HCh-
II 0G-H
57
00
00
00
00
ON
00 4-
-P
1--
(a))
-H 0
0*
00
I -p
I U-
)1
0
co c
0c \-C0)
'1
\
j
I'
00
0
) 8
H l
00 O
-H
Nv00
00
0co
toO
V2
CO
a)
-P
-P
Qi)
0
0
aN
00 -It
BIBLIOGRAPHY
Books
Berman, Peter I., Inflation and The Money Supply in TheUnited States, 1956-1977, Massachusetts, LexingtonBook, 1978.
Brown, Gilbert T., Korean Pricin Policies and EconomicDevelopment in the 1960's, Baltimore, The John HopkinsUniversity Press, 1973.
Cline, William R. and Associates, World Inflation andDeveloping Countries, Washington D. C., The BrookingInstitution, 1981.
Cole, David C. and Y. C. Park, Financial Development inKorea, 1945-1978., Massachusetts, Harvard UniversityPress, 1983.
Eckstein, Otto, Core Inflation, New Jersey, Prentice-HallInc., 1981.
Flemming, J. S., Inflation, London, Oxford University Press,1976.
Gale, William A., editor, Inflation, Massachusetts,Oelgeschager, Gunn & Hain, Publishers, Inc., 1981.
Ghatak, Subrata, MonEtary Economics in Developing Countries,New York, St. Martin's Press, 1981.
Gujarati, Damodar, Basic Econometrics, New York, McGraw-Hill,1978.
Hadjinmichalakis, Michael G., Modern Macroeconomics,New Jersey, Prentice-Hall, Inc., 1982.
Hagger, A. P. Inflation: Theory and Policy, New York, TheMacmillan Press LTD., 1977.
59
60
Harberger, Arnold C., Measurement in Economics, California,Stanford University Press, 1963.
Harvrilesky, Thomas M. and John T. Boorman, Current Issuesin Monetary Theory and Policy, Illinois, AHM PublishingCorporation, 1980.
Kim, C. K., editor, Model and Macroeconomic Policy Issues,Seoul, Korea, The Korean Development Institute, 1977.
Kim, K. S. and Michael Roemer, Growth and Structure Trans-formation, Massachusetts, Harvard University Press, 1979.
Macesish, George and Hui-Liang Tsai, Mone in EconomicSystems, New York, Praeger Publishers, 1982.
Mason, Edward S. and Others, The Economic and Social Moder-nization of the:. Republic of Korea, Massachusetts, HarvardUniversity Press, 1980.
Mendenhall, William and Janes T. McClave, Business Statistics:Regression Analysis, San Francisco, Dellen PublishingCompany, 1981.
Samuelson, Paul A., Economics, 11th edition, New York,McGraw-Hill, 1980.
Sawyer, Malcolm C., Business Pricing and Inflation, New York,St. Martins Press, 1983.
Song, B. L., Korean Econ , Seoul Korea, Park Young Sa, 1983.
Thirlwall, A. P., Inflation, Saving and Growth in DeveloiEconomics, New York, St. Martin's Press, 1974.
Wade, L. L. and B. S. Kim, Economic Development of SouthKorea, New York, Praegers, 1978.
Whitney, Simon N., Inflation Since 1945, New York, PraegerPublishers, 1982.
Wilson, George W., Inflation, Bloomington, Indiana UniversityPress, 1982.
61
Articles
Barth, James R. and James T. Bennett, "Cost-Push versusDemand-Pull Inflation: Some Empirical Evidence,"Money, Credit, and Banking, VII (August, 1975),391 - 397.
Batten, Dallas S., "Inflation: The Cost-Push Myth,"Federal Reserve Bank of St. Louis Review, LXIII(June/July, 1981), 20- 7.
-, and Daniel L. Thornton, "M1 or
M2: Which Is the Better Monetary Target?" FederalReserve Bank of St. Louis, LXV (June/July, 1983),36 - 42.
Bird, Alan R., "Inflation and the Money Supply," Agricul-tural Economics Research, XXXII (January, 1980)43 - 44.
Burger, Albert E., "Is Inflation All Due to Money?" FederalReserve Bank of St. Louis Review, LX (December, 1978),8 - 12.
Cagan, Phillip, "Imported Inflation 1973 - 1974 and theAccomodation Issue," Money, Credit, and Banking,XII (February, 1980), 13 - 19.
Canavese, Alfredo J., "The Structuralist Explanation inThe Theory of Inflation," World Development, X(July 1982), 523 - 529.
Carson, Keith M., "Money, Inflation, and Economic Growth:Some Updated, Reduced Form Results and Their Impli-cation," Federal Reserve Bank of St. Louis Review,LXII (April, 1980), 13 - 19.
"The Lag Form Money To Prices," FederalReserve Bank of St. Louis Review, LXII (October, 1980),3 - 10.
Chung, Jae Wan, "Inflation in a Newly Industrialized Country:The Case of Korea," World Development, X (July, 1982),
531 - 539.
Davidson, Lawrence S., "Inflation Misinformation and MonetaryPolicy," Federal Reserve Bank of St. Louis Review, LXIV(June/July, 1982), 15 - 26.
62
Edwards, Sebastian, "The Short-Run Relation Between Growthand Inflation in Latin America: Comment," AmericanEconomic Review, LXXIII (June 1983), 477 - 482.
Fly, Maxwell J., "Money, Interest, Inflation and Growth inTurkey," Journal of Monetary Economics, VI (October,1980), 535 - 545.
Hafer, R. W., "Monetary Policy and the Price Rule: theNewest Odd Couple," Federal Reserve Bank of St. LouisReview, LXV (August/September, 1983),73 73-41.
, "Inflation: Assessing Its RecentBehavior and Future Prospects," Federal Reserve Bankof St. Louis Review, LXV (August/September, 1983),36 - 41.
, "Examining the Recent Behavior of
Inflation," Federal Reserve Bank of St. Louis Review,LXVI (August7September, 1984T~9 - 39.
, and Gail H. Hafer, "The RelationshipBetween Inflation and its Variability: InternationalEvidence From the 1970s," Journal of Macroeconomics, III(Fall, 1981), 571 - 577.
Holdon, Kenneth and David A. Peel, "The Relationship BetweenPrices and Money Supply in Latin America," The Reviewof Economics and Statistics, LXI (August, 1979)4-46- 450.
Hudson, John, "Expectations of Wage Inflation and theirFormation," Applied Economics, X (September, 1978),195 - 201.
Karnosky, Denis S., "The Link Between Money and Prices--1971-76," Federal Reserve Bank of St. Louis Review,LVIII (June, 1976), 17 - 23.
McDonald, John, "The Relationship Between Wage Inflation andExcess Demand--New Estimates Using Optimal ExtrapolativeWage Expectation," The Economic Record, LIII (January,1977), 490 - 507.
Niskanen, William A., "Deficits, Government Spending, andInflation," Journal of Monetary Economics, IV (August,1978), 591 -7-01.
63
Saini, Krishan G., "The Monetarist Explanation of Inflation:
The Experience of Six Asian Countries,t World Development,
X (Octobrt, 1982), 871 - 884.
Shahi, M. A. and I. H. Sheikth, "Inflationary Expectations
and Monetary Adjustment in Nigeria: 1960 - 1978,"
Pakistan Development ReView, XVIII (Winter, 1979),
333 - 339.
Shiffer, Zalman F., "Money and Inflation in Israel: The
Transition of an Economy to High Inflation," Federal
Reserve Bank ofSt. Luis Review, LXIV (AugusSeptember
1982), 28 - 39.
Tang, De-Piao, and Teh-Wei Hu, "Money, Prices, and Causality:
The Chinese HyperinflatiOn, 1945-49," Journal of
Macroeconomics,V (Fall, 1983), 503 - 510.
Thomas, Lloyd B., Jr., and Krishna R. Akkina, "Recent Inflation
in Ten Industrial Nations: Some Tests Using a Monetarist
Model," Review of Business & Economic Research, XVIII
(September, 198377 ,6-0-73.
Vogel, Robert C., "The Dynamics of Inflation in Latin America,
1950-1969," American Economic Review, LXIV (March, 1974),