Some Characteristics of Fluvial Processes in Rivers William W. Emmet t*. Luna B. Leopold** and Robert M. Myrick*** Abstract Fluvial processes in rivers have been studied extensively in the United States during the past 20 years. This paper relates some older studies of scour and fill to some new studies for which detailed data on water-surface slopes and bedload-transport rates help to substantiate earlier interpretations. Although discussion is based on data from three small rivers, the principles involved have transfer value to other rivers. Reversal in maximum values of water-surface slope from riffles during low flow to pools during high flow causes a similar reversal in maximum values of stream power; this reversal is reflected in measured values of bedload-transport rate. Both pool and riffle reaches are likely to contribute sediment to bedload, resulting in generalized scour during high flow. However, spatially-variable bedload-transport rates require those reaches with the least available stream power during times of high transport rate to temporarily fill as continuity in the sediment budget is maintained. Similarly, those reaches with the least available stream power during times of receding river stage become sinks for storage of the moving sediment. This process helps explain the sorting mechanism of sediment and the maintenance of pool-riffle sequences in rivers. The volume of scoured material within its annual travel distance is, on average, equal to annual bedload. but this is only an approximation because all bed particles do not move at the same speed or travel the same distance. Scour is associated with dilation of the grain bed through the scour depth, but individual particles move intermittently and at a speed much less than that of the water. The volume of material scoured and moved may be large, but because of its low mean speed downstream, the entire volume does not move out of a long reach but. in effect, is shifted downstream only a limited distance. * U. S. Geological Survey, Box 25046. MS 413, Denver Federal Center, Lakewood, Colorado 80225 USA. * Department of Geology and Geophysics, University of California, Berkeley, California 94720 USA. '• U. S. Geological Survey, Box 25046. MS 413. Denver Federal Center. Lakewood, Colorado 80225 USA.
Transcript
Some Characteristics of Fluvial Processes in Rivers
William W. Emmet t*. Luna B. Leopold** and Robert M. Myrick***
Abstract
Fluvial processes in rivers have been studied extensively in the United States during the past 20 years. This paper relates some older studies of scour and fill to some new studies for which detailed data on water-surface slopes and bedload-transport rates help to substantiate earlier interpretations. Although discussion is based on data from three small rivers, the principles involved have transfer value to other rivers.
Reversal in maximum values of water-surface slope from riffles during low flow to pools during high flow causes a similar reversal in maximum values of stream power; this reversal is reflected in measured values of bedload-transport rate. Both pool and riffle reaches are likely to contribute sediment to bedload, resulting in generalized scour during high flow. However, spatially-variable bedload-transport rates require those reaches with the least available stream power during times of high transport rate to temporarily fill as continuity in the sediment budget is maintained. Similarly, those reaches with the least available stream power during times of receding river stage become sinks for storage of the moving sediment. This process helps explain the sorting mechanism of sediment and the maintenance of pool-riffle sequences in rivers. The volume of scoured material within its annual travel distance is, on average, equal to annual bedload. but this is only an approximation because all bed particles do not move at the same speed or travel the same distance. Scour is associated with dilation of the grain bed through the scour depth, but individual particles move intermittently and at a speed much less than that of the water. The volume of material scoured and moved may be large, but because of its low mean speed downstream, the entire volume does not move out of a long reach but. in effect, is shifted downstream only a limited distance.
* U. S. Geological Survey, Box 25046. MS 413, Denver Federal Center, Lakewood, Colorado 80225 USA.
* Department of Geology and Geophysics, University of California, Berkeley, California 94720 USA.
'• U. S. Geological Survey, Box 25046. MS 413. Denver Federal Center. Lakewood, Colorado 80225 USA.
Introduction
Although numerous studies have been undertaken to describe fluvial processes in rivers, many shortcomings remain in understanding the hydrologic and morphologic measurements that have been made. Changes in inflowing water and sediment discharges to a reach of river initiate a complex reaction within the river reach to accommodate the changes in water and sediment. This report attempts, albeit based only on examples for three small streams in western United States, to describe recent progress in understanding fluvial processes in rivers.
Since 1967, the East Fork River in western Wyoming has been a field laboratory for the study of fluvial processes. Studies on the East Fork River and its principal tributary, Muddy Creek, have been reported by Andrews (1977. 1979a, 1979b, 1981, 1982a. 1982b), Bagnold (1977, 1980), Bennett and Norbin (1977), Dietrich (1982a. 1982b), Dietrich, Smith, and Dunne (1979), Dunne and Leopold (1978), Emmett (1980a, 1980b, 1981, 1982a. 1982b), Emmett and Leopold (1977). Emmett, Myrick, and Meade (1980, 1982), Klingeman and Emmett (1982). Leopold (1982a, 1982b), Leopold and Emmett (1976. 1977. 1982), Lisle (1976, 1979, 1982), Mahoney and others (1976), Meade, Emmett, and Myrick (1981a, 1981b), Meade, Myrick. and Emmett (1980. 1982). and Prestegaard (1982a. 1982b).
The present paper draws on 15 years of participation in the East Fork River studies and on comparable studies on two other rivers. Illustrative examples are largely from field studies on East Fork River conducted during 1979 and 1980; the data collected during these studies are tabulated in the references (Emmett, Myrick, and Meade; 198a 1982; and Meade, Myrick. and Emmett; 198a 1982). Data for fluorescent-tracer studies are yet unpublished. Other examples presented in this paper are the Rio Grande del Ranches (Emmett and Leopold; 1965) and Arroyo de los Frijoles (Leopold, Emmett, and Myrick; 1966).
Design of Field Studies
To describe downstream patterns of river hydraulics, channel geometry, and sediment transport, data are required at closely-spaced intervals along a reach of river. The selected river reach needs to include several sequences of pools and riffles, curved as well as straight segments, and wide.as well as narrow sections. These criteria generally are met when the reach length exceeds the equivalent of about 20 channel widths. The studies reported herein have reach lengths equal to between 40 and 400 channel widths.
If measurement sections along the studied reach are spaced at intervals not exceeding several channel widths, then straight-line interpolation between sections may be used to describe the character of each subreach. Data reported herein are trom measurement sections spaced along the channel at intervals equal to between 1 and 4 channel widths.
Collected data are of several types. Water-surface elevations at each section provide river stage versus time relations, and, with discharge measurements relating stage to flow, enable flow-rate computations. Synoptically collected at each section, these elevation data also enable computations of water-surface slope and of changes in gradient with
731
stage or time. Surveys at cross sections determine channel size and shape, and provide data for computation of streambed scour and fill that may have occurred between times of measurement. A combination of flow data and channel cross-sectional data enables computation of other hydraulic data, for example, velocity, shear stress, and stream power. Bed-material tracers can be placed and sequential bed-material sampling at each section indicates gradation and rate of movement of bed material, providing data for computing travel times and distances of bedload. Suspended-load and bedload measurements provide sediment-transport rates. Properly collected, the data enable a complete accounting of the water and sediment in the studied reach of river.
Examples of Results
One of the first of our studies was on the Rio Grande del Ranchos, a small perennial stream on the west slopes of the Sangre de Cristo Range about 4.5 km (kilometers) south of Taos, New Mexico. Peak discharges occur in the spring and are normally produced by snowmelt. The study reach consists of a straight segment of 80m (meters) followed by a curved segment of 220 m. The streambed is predominantly gravel and quite uniform in size from section to sectioa Median particle size ranges from 21 to 33mm (millimeters). Channel width at bankfull stage varies from 5 to 10 m. A total of 32 measurement sections were established along the study reach. Level surveys of the sections were made at a high flow of im3/s (cubic meters per second) on May 16, 196L and at a low flow of 0Jm3/s on June 12, 1961-
The net changes in cross-sectional areas of the bed and, separately, the crass-sectional areas of the two flows, are plotted against distance along the channel in figure 1^ Values are considered scour if the bed elevations during high flow are lower than those during low flow. Thus, a negative area within this curve represents the total volume of material scoured from the streambed within the study reach. A positive area represents the total volume of material brought in from upstream and temporarily deposited as a fill.
At the time of the high-stage measurements, scour generally existed throughout the entire reach. No marked difference in the magnitude of scour occurred between pool and riffle or between straight and curved segments.
It might be expected that scour would have been greatest at sections with the smallest flow area which, for constant discharge, had the highest mean velocity. To test this hypothesis, flow areas at both high and low stages are plotted at the bottom of figure 1. No systematic correlation between the flow area and magnitude of scour is apparent. Discharge is constant through the reach so the velocity is inversely proportional to the cross-sectional flow area. Zones of low velocity, therefore, are from 75 to 100 m, and from 250 to275m(fig. 1). The former was a reach of considerable scour, about 0.3 m2, whereas the latter had no net scour. Another example is the reach from 100 to 250 m along which the cross-sectional area at high flow was about constant at 3 m2. Yet, in that reach, there are wide variations in values of scour. Thus, scour is not correlated with high values of mean velocity.
The absolute magnitude of flow area may not provide an ideal comparison for the effect of area on values of scour and fill. Some cross-sectional areas at low flow were
732
CROSS-SECTIONAL FLOW AREA I I I L_
- 3
25 50 75 100 125 ISO 175 200 225 250
DOWNSTREAM DISTANCE ALONG STUDY REACH. IN METERS
275 300
Z <
§
Figure 1 Scour or fill (A), and cross-sectional flow area (B), Rio Grande del Ranchos near Taos, New Mexico (modified from Emmett and Leopold; 1965)
larger than others at high flow. The relative increase in flow area from a low stage to a high stage would describe more accurately the changes that occurred at a particular sectioa Superimposed as a dashed line on the flow area plot is the relative increase in cross-sectional flow area. Efforts to relate this relative increase to the magnitude of scour also were unsuccessful.
Similar comparisons were made for other physical dimensions of the stream. Data for channel widths and depths were analyzed in the same manner as the data for flow areas. No meaningful correlation could be established between these channel properties and the magnitude of scour.
A second example is provided by studies on the Arroyo de los Frijoles, a sandy ephemeral channel located about 2.5 Am northwest of Santa Fe, New Mexico. Normally, flows are the result of runoff from local thunderstorms during the summer. The flash flood is typical. Peak flow normally occurs within several minutes after the initial flood wave. In the study reach, the channel increases in size from a rill near the watershed divide to a width of about 30 m downstream. The bed is composed of medium sand and a moderate quantity of. gravel. This material extends downward several meters, far deeper than the scour that occurs. The median sand-grain diameter is about 0.5 mm.
Measurements of scour and fill were made by using scour chains (Emmett, 1965; p. 94—98)- Recorded values of fill are always subsequent to the occurrence of any
733
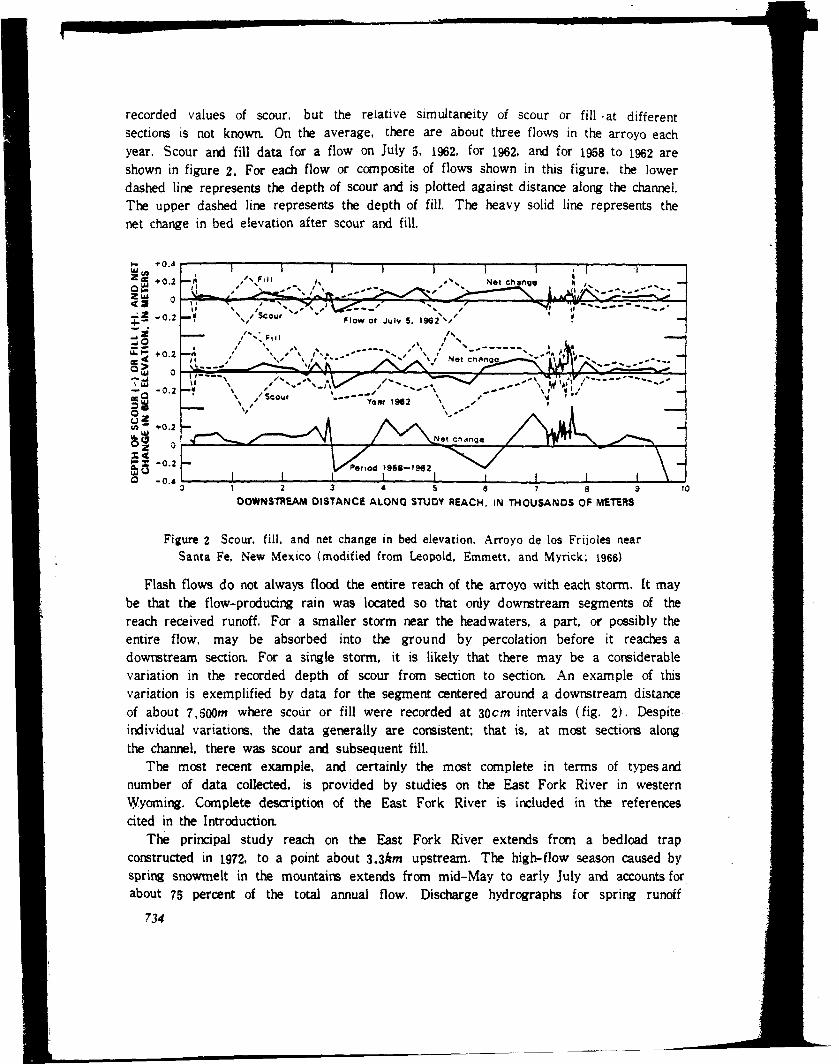
recorded values of scour, but the relative simultaneity of scour or fill at different sections is not knowa On the average, there are about three flows in the arroyo each year. Scour and fill data for a flow on July 5, 1962, for 1962, and for 1958 to 1962 are shown in figure 2. For each flow or composite of flows shown in this figure, the lower dashed line represents the depth of scour and is plotted against distance along the channel. The upper dashed line represents the depth of fill. The heavy solid line represents the net change in bed elevation after scour and fill.
DOWNSTREAM DISTANCE ALONG STUDY REACH. IN THOUSANDS OF METERS
Figure 2 Scour, fill, and net change in bed elevation. Arroyo de los Frijoles near Santa Fe, New Mexico (modified from Leopold, Emmett, and Myrick; 1966)
Flash flows do not always flood the entire reach of the arroyo with each storm. It may be that the flow-producing rain was located so that only downstream segments of the reach received runoff. For a smaller storm near the headwaters, a part, or possibly the entire flow, may be absorbed into the ground by percolation before it reaches a downstream sectioa For a single storm, it is likely that there may be a considerable variation in the recorded depth of scour from section to section. An example of this variation is exemplified by data for the segment centered around a downstream distance of about 7,500m where scour or fill were recorded at 30cm intervals (fig. 2). Despite individual variations, the data generally are consistent; that is, at most sections along the channel, there was scour and subsequent fill.
The most recent example, and certainly the most complete in terms of types and number of data collected, is provided by studies on the East Fork River in western Wyoming. Complete description of the East Fork River is included in the references cited in the Introductioa
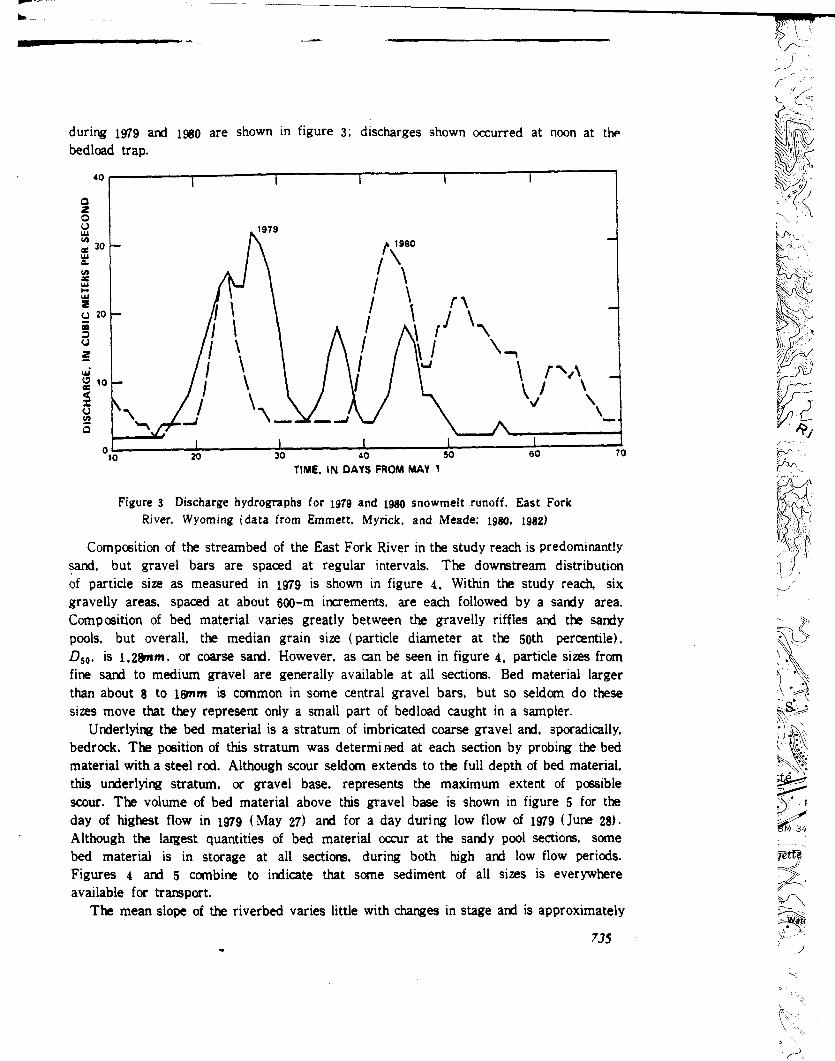
The principal study reach on the East Fork River extends from a bedload trap constructed in 1972. to a point about 3.2km upstream. The high-flow season caused by spring snowmelt in the mountains extends from mid-May to early July and accounts for about 75 percent of the total annual flow. Discharge hydrographs for spring runoff
734
during 1979 and 1980 are shown in figure 3; discharges shown occurred at noon at the bedload trap.
>0 20 30 40 50 SO 70
TIME. IN DAYS FROM MAY 1
Figure 3 Discharge hydrographs for 1979 and 1980 snowmelt runoff, East Fork River, Wyoming (data from Emmett, Myrick, and Meade; 198O, 1982)
Composition of the streambed of the East Fork River in the study reach is predominantly sand, but gravel bars are spaced at regular intervals. The downstream distribution of particle size as measured in 1979 is shown in figure 4. Within the study reach, six gravelly areas, spaced at about 600-m increments, are each followed by a sandy area. Composition of bed material varies greatly between the gravelly riffles and the sandy pools, but overall, the median grain size (particle diameter at the 50th percentile), Dsa, is 1.28mm, or coarse sand. However, as can be seen in figure 4, particle sizes from fine sand to medium gravel are generally available at all sections. Bed material larger than about 8 to 16mm is common in some central gravel bars, but so seldom do these sizes move that they represent only a small part of bedload caught in a sampler.
Underlying the bed material is a stratum of imbricated coarse gravel and, sporadically, bedrock. The position of this stratum was determined at each section by probing the bed material with a steel rod. Although scour seldom extends to the full depth of bed material, this underlying stratum, or gravel base, represents the maximum extent of possible scour. The volume of bed material above this gravel base is shown in figure 5 for the day of highest flow in 1979 (May 27) and for a day during low flow of 1979 (June 28). Although the largest quantities of bed material occur at the sandy pool sections, some bed material is in storage at all sections, during both high and low flow periods. Figures 4 and 5 combine to indicate that some sediment of all sizes is everywhere available for transport.
The mean slope of the riverbed varies little with changes in stage and is approximately
735
100
ee UJ UJ
s i" Z UJ
a t.o u
2
o.t
A°« \̂ N ,4\
35 30 25 20 15 10 5 DISTANCE UPSTREAM OF BEDUOAD TRAP, IN HUNDREDS OF METERS
Figure 4 Downstream distribution of bed-material particle size, May 18—19. 1979, East Fork River, Wyoming (data from Emmett. Myrick, and Meade; 1980)
20 ee UJ
I U
< 3 UJ y
l u
ff "* x O O UJ co O
<I S 2 10
u Q Z UJ z
o r
is • UJ ee !
ea 3 CD
15 —
35
May 27. 1979
June 23. 1979
30 25 20 15 10 5 0
DISTANCE UPSTREAM OF BEDLOAD TRAP. IN HUNDREDS OF METERS
Figure 5 Downstream distribution of volume of bed material, May 27 and June 28, L979, East Fork River, Wyoming (data from Meade. Myrick, and Emmett; 1980)
736
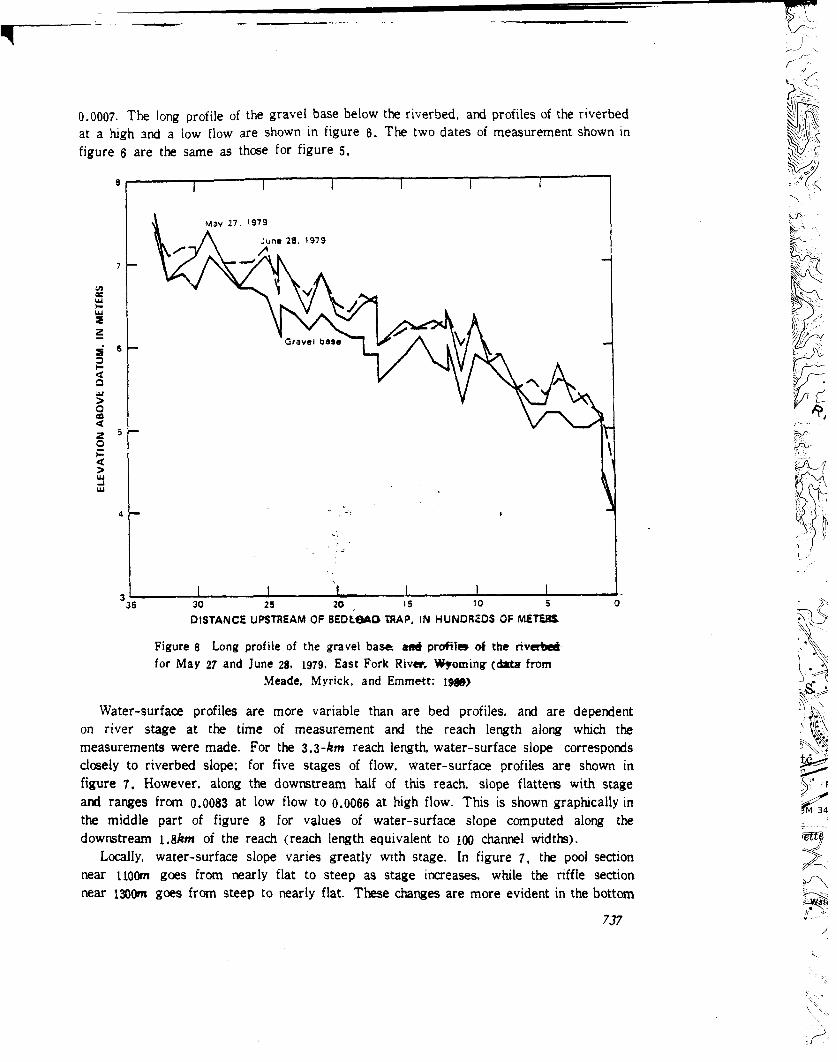
0.0007- The long profile of the gravel base below the riverbed, and profiles of the riverbed at a high and a low flow are shown in figure 6. The two dates of measurement shown in figure 6 are the same as those for figure 5.
OS
S 2
S*
< a LLf > o < 2 O < >
May 27. 1979
June 28. 1979
I 3S 30 25 20 IS
DISTANCE UPSTREAM OF BEDtOAO TRAP. 10 5
IN HUNDREDS OF METERS
Figure 6 Long profile of the gravel base asrf profifw ot the riverbed for May 27 and June 28. 1979. East Fork River, Wyoming (data from
Meade, Myrick, and Emmett: 19»)
Water-surface profiles are more variable than are bed profiles, and are dependent on river stage at the time of measurement and the reach length along which the measurements were made. For the 3.3-fcm reach length, water-surface slope corresponds closely to riverbed slope; for five stages of flow, water-surface profiles are shown in figure 7. However, along the downstream half of this reach, slope flattens with stage and ranges from 0.0083 at low flow to 0.0066 at high flow. This is shown graphically in the middle part of figure 8 for values of water-surface slope computed along the downstream i.&km of the reach (reach length equivalent to 100 channel widths).
Locally, water-surface slope varies greatly with stage. In figure 7, the pool section near uoom goes from nearly flat to steep as stage inaeases, while the riffle section near 1300m goes from steep to nearly flat. These changes are more evident in the bottom
737
35 30 25 20 15 10 5 0
DISTANCE UPSTREAM OF BEDLOAO TRAP. IN HUNOREDS OF METERS
Figure 7 Long profiles of the water surface for low to high flows. 1979, East Fork River, Wyoming (data from Emmett, Myrick, and Meade; 1980)
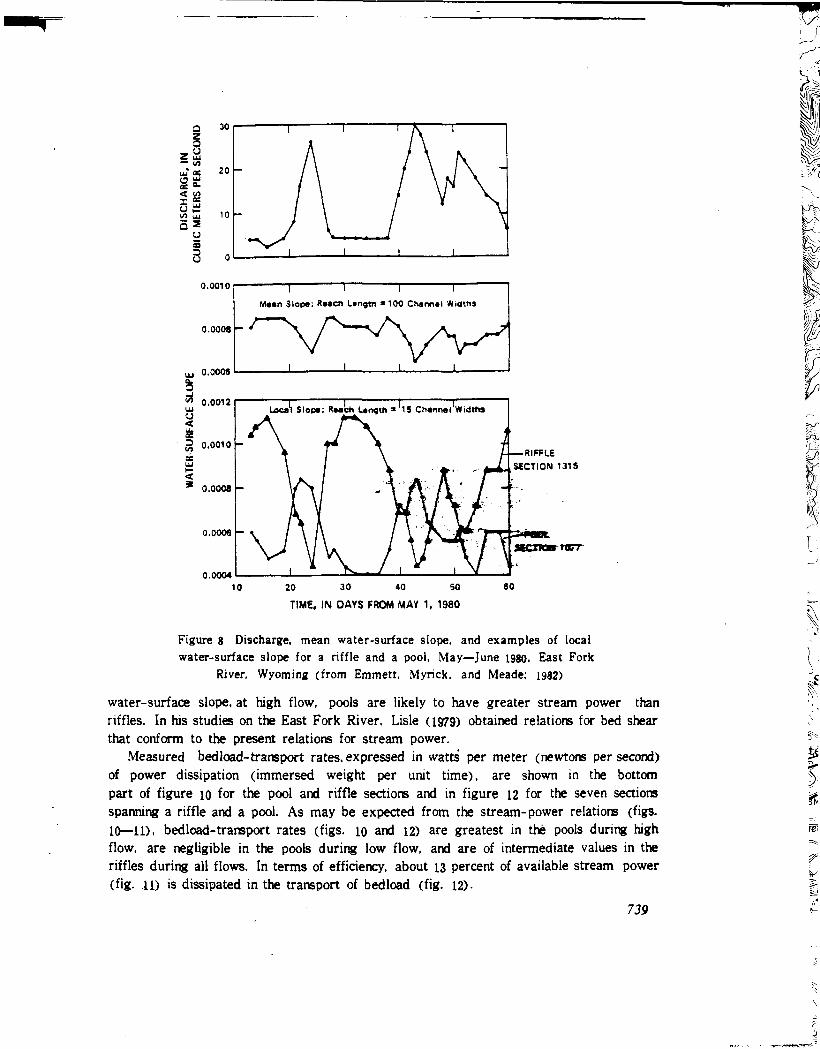
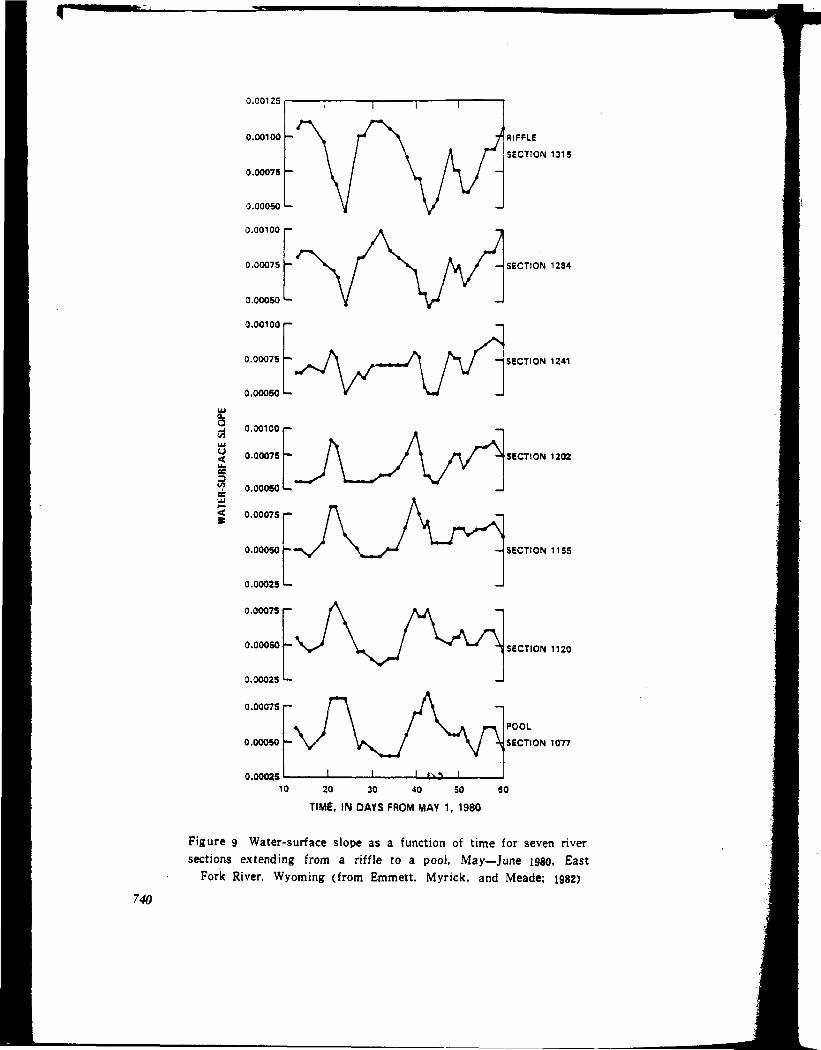
graph of figure 8 for values of slope computed along a reach length equivalent to 15 channel widths, or about 275m. At the riffle (section 1315), slope decreased from about 0.0011 at low flow to about 0.0004 at high flow. Conversely, the pool (section 1077) increased in slope from about 0.0004 at low flow to a little more than 0.0008 at high flow. In figure 9, changes in slope are shown sequentially along the reach for seven sections spanning a riffle and a pool. There is clearly a reversal in magnitude of slope; at high flow, the water-surface slope in the pool became steeper than that in the riffle.
Stream power is a measure of the work rate of a stream; it is computed as the product of gravitational acceleration, mass density of the fluid flow, discharge, and water-surface slope. Dimensions of stream power are watts per meter of channel length (W/m), numerically and physically equivalent to newtons per second (N/s), and represent the power available per unit length of channel, including that power dissipated in the transport of sediment For the same pool and riffle sections as shown in figure 8, the middle part of figure 10 shows the range in values of stream power during the spring runoff period. The sequential distribution, from riffle to pool, of stream power as a function of time, is shown in figure n . From figures 10—11, all sections show the greatest stream power at high flow; at low flow, pools are likely to have negligible sediment transporting capability. However, because of the reversal in maximum values of
738
RIFFLE StCTION 1315
ttBT"
0.00O4 10 20 30 40 SO
TIME. IN OAYS FROM MAY 1, 1980
Figure g Discharge, mean water-surface slope, and examples of local water-surface slope for a riffle and a pool. May—June 1980. East Fork
River, Wyoming (from Emmett. Myrick, and Meade; 1982)
water-surface slope, at high flow, pools are likely to have greater stream power than riffles. In his studies on the East Fork River, Lisle (1979) obtained relations for bed shear that conform to the present relations for stream power.
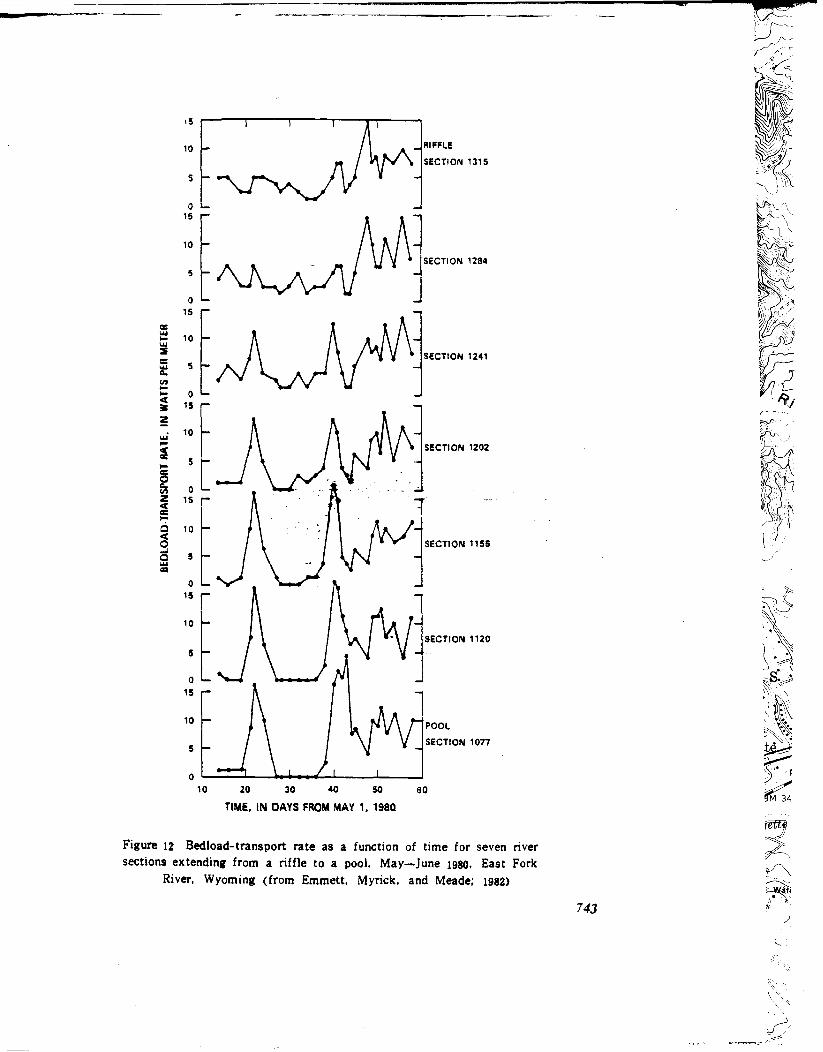
Measured bedload-transport rates, expressed in watts' per meter (newtons per second) of power dissipation (immersed weight per unit time), are shown in the bottom part of figure 10 for the pool and riffle sections and in figure 12 for the seven sections spanning a riffle and a pool. As may be expected from the stream-power relations (figs. 10—11), bedload-transport rates (figs. io and 12) are greatest in the pools during high flow, are negligible in the pools during low flow, and are of intermediate values in the riffles during all flows. In terms of efficiency, about 13 percent of available stream power (fig- -11) is dissipated in the transport of bedload (fig. 12)-
739
0.00125
0.001001-
0.00O7S | -
0.00050
0.00100
0.00075 I -
0.00050 I -
0.00100 r
0.00075
0.0OO501-
TA 0.0O10O
U I
U
< 0.00075
-SU
RF
0.00050
RIFFLE
SECTION 1315
- SECTION 1284
- SECTION 1241
SECTION 1202
SECTION 1155
SECTION 1120
< 0.00075 r-
0.00050 h
0.00025
0.00075
0.00050 j -
0.00025 L.
0.00075
0.00050
0.00025 10 20 30 40 50 60
TIME, IN DAYS FROM MAY 1, 1980
Figure 9 Water-surface slope as a function of time for seven river sections extending from a riffle to a pool. May—June 198O. East
Fork River, Wyoming (from Emmett, Myrick, and Meade; 1982)
POOL
SECTION 1077
? -
)
25
P 20
I a <
§2
15
10
POOL SECTION 1077
RIFFLE SECTION 1315
10 20 30 40 50
TIME. IN DAYS FROM MAY 1, 1980
Figure 10 Discharge, and examples of stream power and bedload-transport rate for a riffle and a pool. May—June 1980. East Fork River, Wyoming
(from Emmett, Myrick. and Meade; 1982)
741
>
# v
m 34
200
100
i r
vvJ^ 0
200 p-
RIFFIE SECTION 1315
SECTION 1284
SECTION 1241
SECTION 1202
SECTION 1155
- SECTION 1120
POOL
H SECTION 1077
10 20 30 40 SO SO
TIME, IN DAYS FROM MAY 1, 1980
Figure ll Stream power as a function of time for seven river sections extending from a riffle to a pool. May—June 1980. East Fork River,
Wyoming (from Emmett, Myrick, and Meade; 1982)
a.
<
o 7, z < Q < O
RIFFLE
SECTION 1315
SECTION 1234
SECTION 1241
SECTION 1202
SECTION 1155
SECTION 1120
POOL
SECTION 1077
20 30 40 SO SO
TIME, IN DAYS FROM MAY 1, 1980
Figure 12 Bedload-transport rate as a function of time for seven river sections extending from a riffle to a pool. May—June 1980, East Fork
River, Wyoming (from Emmett, Myrick. and Meade; 1982)
The spatially-varied transport rates shown in figure 12 indicate that bed material is going in and out of storage at various sections along the channel. That is, continuity in the total quantity of sediment requires that with spatially-variable bed load-transport rates, some sections must be filling and other sections must be scouring. This is illustrated in the bottom part of figure 13 for the pool and riffle sections and in figure 14 for the seven sections spanning a riffle to a pool. While some sections show little change in mean bed elevation as the sediment supplied to them is transported past, other sections show alternating scour and fill as the sections have fluctuating availability of stream power to transport sediment. At the end of the runoff period, most sections heve about the same value of mean bed elevation as they had prior to runoff.
20 30 40 50
TIME. IN DAYS FROM MAY 1. 1980 Figure 13 Discharge, and examples of scour and fill for a pool and a riffle. May-June 1980. East Fork River, Wyoming (from Emmett,
Myrick, and Meade; 1982)
For the z.Z-km reach, this downstream pattern of scour and fill is shown in figure 15 for two periods of flow during 1979: from May 20—21 to May 27, the rising hydrograph, and from May 27 to June 28. the falling hydrograph. Figure 15 is similar to figures 1 and 2; that is. during time of high flow, more than three-fourths of the sections show scour or no change in bed elevation. Subsequently, during the recession to low flow, fill occurs. There is little net change in bed elevation during the total period of May 20—21 to June
744
6.4
6.2
S.O
6.2
6.0
S.S
s.o r
5.4 _L I _L 10 20 30 40 50
TIME. IN DAYS FROM MAY 1. 1980
RIFFLE
SECTION 1315
SECTION 1284
SECTION 1241
SECTION noz
secno»Tis5
section rna
POOL
SECTION 1077
SO
Figure u Mean bed elevation as a function of time for seven river sections extending from a riffle to a pool, May—June 1980. East
Fork River, Wyoming (from Emmett, Myrick, and Meade; 1982)
•*-^*m
28- The average magnitude of both scour and fill is 0.07m. Although the largest individual values of scour that occur during a rise in stage (fig. 15) are likely associated with those sections storing the greatest quantities of bed material (fig. 5), other scouring sections and the filling sections are located all along the reach. During high flow, bedload is being transported past all sections (fig. 12) and whether intervening segments are scouring or filling is related to the transport capacity, stream power, that is available on the given date at various locations along the reach (fig. H).
+ 1.0
ui 2 +0.5 Z
D O O
a. UJ
a
- 0 . 5
- 1 . 0
A A
35
May 27 to June 28. 1979
May 20-21 to 27. 1979
I I 30 25 20 15 10 5
DISTANCE UPSTREAM OF BEDLOAD TRAP. IN HUNDREDS OF METERS
Figure 15 Downstream pattern of depth of scour or fill for two periods of flow during 1979: May 20—21 to 27. the rising hydrograph. and May 27 to June 28. the falling hydrograph. East Fork River, Wyoming (data from
Meade, Myrick. and Emmett; 1980)
The width of the streambed is shown in figure 16. There is about two-fold variability in bed width along the channel and the mean value is about 17m. Surface width is about 20 percent greater than bed width, or averages about 20"». Wider sections (fig. 16) are generally associated with pools or flat water-surface profiles at low flow (fig. 7)» smaller bed-material sizes (fig. 4). the most sediment in storage as bed material (fig. 5), and meandering rather than straight segments. However, the downstream pattern of riverbed scour and fill, shown in figure 15, is not definitively related to width, gradient, particle size, abundance of material, or curvature.
The depths of scour or fill shown in figure 15 can be transformed to volumes of sediment within each subreach of channel by multiplying scour or fill depth times bed width times increment of channel length between midpoints of channel sections. This
746
transformation is shown graphically in figure 17- A summation of the volumetric data included in figure 17 shows that between May 20—21 to May 27 (peak flow), 2544m3 of
30 25 20 15 10 5
DISTANCE UPSTREAM OF BEDLOAO TRAP, IN HUNDREDS OF METERS
Figure 16 Downstream values of streambed width, 1979, East Fork River, Wyoming (data from Meade. Myrick. and Emmett; 1980)
f z u
— Ma
~ O + «»
— a
= § 1 5
si <" <
1* 3 5 > <
Ui
+ 4
- *
May 27 to June 28.
May 20-21 to 27. 1979
35 30 25 20 15 10 5
DISTANCE UPSTREAM OF BEDLOAO TRAP. IN HUNDREDS OF METERS
Figure 17 Downstream pattern of volume of scour or fill in each subreach of channel for two periods of flow during 1979: May 20—21 to 27, the rising hydrograph. and May 27 to June 28. the falling hydrograph. East
Fork River, Wyoming (data from Meade, Myrick, and Emmett; 1980)
747
bed material were scoured from the streambed, and between May 27 to June 28, 2784m3
of material were deposited as fill. Additionally, between June 28 and October 8, 237m3
of material were deposited as fill. It is estimated that about 500m3 of material were scoured from the streambed between May 15 (beginning of runoff, see fig. 3) and May 20—21 (the first days of measurement). On average, a little more than 3000m3 of bed material were not in storage on the channel bed during time of high flow. Based on several years of operating the bedload trap, annual bedload is approximately one-third to one-half the volume of scoured material within the study reach, indicating that the annual travel distance of bedload is on the order of one-third to one-half the study reach, or a little over lOOOm. Apparently, during high flow, the volume of scoured material is in transport as bedload and it is not detected as bed material. Because soundings were used to detect the unmoving bed, it is suggested that the volume of scoured material moving as bedload was sufficiently dilated that it could not support the sounding probe.
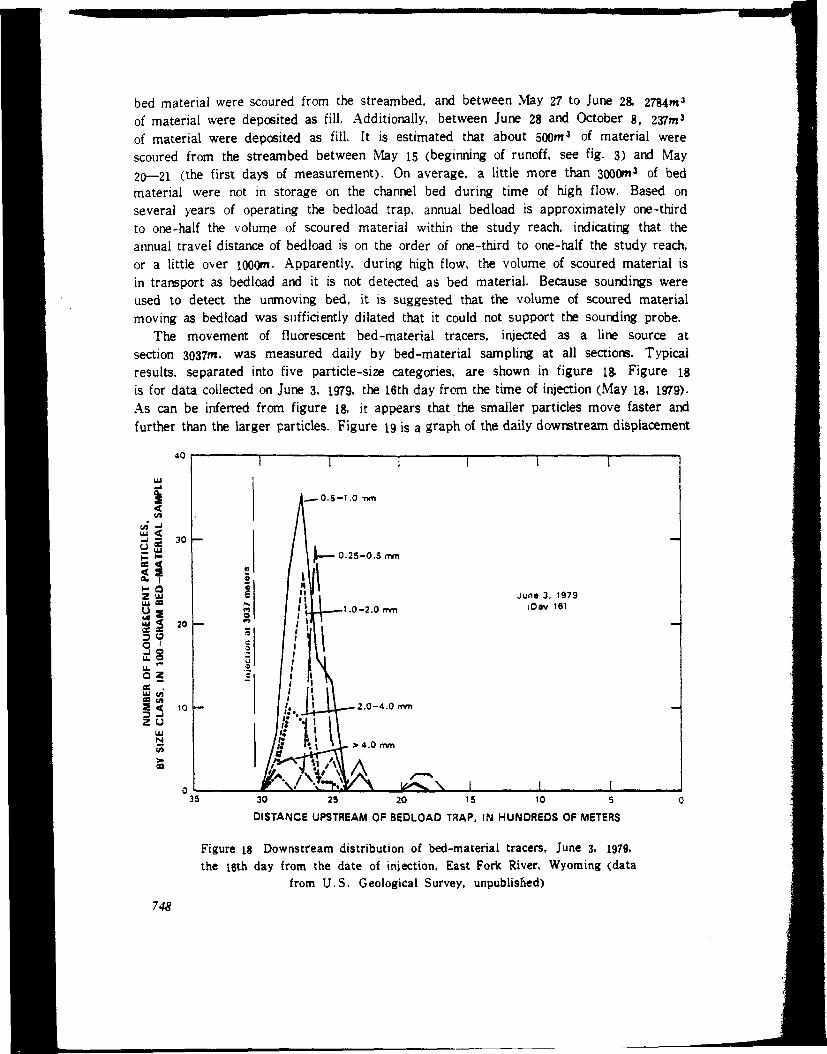
The movement of fluorescent bed-material tracers, injected as a line source at section 3037m, was measured daily by bed-material sampling at all sections. Typical results, separated into five particle-size categories, are shown in figure 18. Figure 18 is for data collected on June 3, 1979- the 16th day from the time of injection (May 18, 1979). As can be inferred from figure 18, it appears that the smaller particles move faster and further than the larger particles. Figure 19 is a graph of the daily downstream displacement
40
s <
<"" -i UJ < -J = 30 2 3
i
20
ce
S3 ui so
ui < a. as •3 O
a! 8 u. " O Z oe —. £ <" S «» S < to 3 -1 z u
35
_— 0.5-t .O mm
25-0.5 mm
1.0-2.0 mm
June 3. 1979 lOav 16)
2 .0-4 .0 mm
>4 .0 mm
k^N.N L 1 35 30 25 20 15 10 5
DISTANCE UPSTREAM OF BEDLOAD TRAP. IN HUNDREDS OF METERS
Figure 18 Downstream distribution of bed-material tracers, June 3. 1979, the 16th day from the date of injection, East Fork River, Wyoming (data
from U.S. Geological Survey, unpublished)
748
of the peak concentration (approximate centroid), for tracer particles of size between 0.5 to i.Qmm. Because downstream displacement of the tracer was recorded only at measurement sections, the relation that describes the displacement shown in figure 19 is a curve which envelops the data rather than a best-fit to the data.
50
40
< s
O 30 LU -) 2 O LU r-< o s o ee u.
20
< a
s 10
Approximately S50 meters '979 runofr season
June 9, 1979
Approx imator 3 & U I » I « J J oer day.
0.5-1.0" m r i
I 35 30 25 20 15 10 5
DISTANCE UPSTREAM OF BEDLOAD TRAP, W HUNOBB3S. OF METERS
Figure 19 Downstream daily displacement of the peak concentration of 0.5-to 1.0-mm bed-material tracers, 1979. East Fork River, Wyoming (data
from U.S. Geological Survey, unpublished)
Graphs similar to- figure 19 could be prepared for other particle-size classes or for other characteristics of the dispersed tracer. For example, the leading edge of the tracer defines first arrival time, or maximum particle speed, whereas the centroid of the distribution defines mean particle speed. For particles of size between 0.5 to 1.0mm. figure 20 shows downstream particle speed and travel distance for the leading edge (maximum values), for significant quantities of tracer, and for the peak concentration (approximate mean values). For 0.5- to 1.0-mm particles, mean particle speed is about 30m/d (meters per day); transport occurred during about 22 days, giving an annual downstream travel distance of about 650m. A significant but minority part of the tracer travelled at 38m/d to a total distance of 1200m, while the leading edge of the tracer moved
749
at i7m/d and went a distance of 1400m. Particles that travelled farthest moved for about 33 days after injection, with little movement recorded after June 20-
50
40 —
U 3 0 -
Z
o UJ
< a 3 >• < Q
10
1 1 i
650 m
1
1200 m
I I
1550 m on
at
3037
me
ters
— 0 c
— / " / / 30 m/d ipsak concentration)
/ / / 47 m/d (leading edge)
,
u/ 0 .5 -1 .0 mm Darticlas
F I I I i r
•
20 —
35 30 25 20 15 10 5 0
DISTANCE UPSTREAM OF BEDLOAO TRAP. IN HUNDREDS OP METERE
Figure 20 Downstream particle speeds and travel distances for 0.5- to 1.0-mm bed-material tracers, 1979. East Fork River, Wyoming (data
from U.S. Geological Survey, unpublished)
Downstream travel distances of the tracer correspond to locations of accumulated sandy deposits (fig.5), that is, the low-flow pool areas. The mean travel distance of the tracer relates to the large volume of stored sediment at sections near 2400m. Likewise, the leading edge of the tracer moved downstream to sections near 1500—1600m where a large volume of sediment was stored. The average of the downstream travel distances conforms to that distance computed by considering the volumes of scoured material and of annual bedload.
The extent of sediment movement varied with water discharge and with the location of the sediment in the study reach. For example, the initial and highest rise in stage during 1979 was completed on about June 2 (fig. 3). At this time, the majority of the tracer was located near section 2700—2800m (fig. 19), a riffle segment (figs. 6—7) which has intermediate values of stream power at modest flow rates. Sufficient stream
750
power was available during the second rise in hydrograph during 1979, June 2—9 (fig. 3), to move the sediment to a location near section 240On (fig. 19), a pool segment (figs. 6-7) which has low values of stream power except at highest discharge. Although the third rise in hydrograph during 1979, June 9—20 (fig- 3). was comparable in magnitude to the second rise in hydrograph. sufficient stream power was not available in the pool to transport the sediment further downstream. In contrast, on June 9, the leading edge of the tracer was located in the riffle segment near section 2000- During the third rise in hydrograph. sufficient stream power was available in this segment to transport the sediment to the pool segment near 1500—1600m.
There is a modest day-to-day decrease in the total number of observed tracer particles as the sediment moves downstream. As may be seen in figure 15, some particles move faster than the majority and some lag behind. While some particles may move a great distance in a short time, others are consumptively used in river-building processes (for example, floodplain building); however, they may be replaced by particles supplied from other processes (for example, bank cutting). Downstream continuity in transport may be maintained, but there is replacement of particles making up the transport.
Summary
Based primarily on the Rio Grande del Ranches and Arroyo de los Frijoles examples presented herein, the authors stated some 20 years ago (Emmett and Leopold; 1965) that scour is associated with dilation of the grain bed through the scour depth, but individual particles move intermittently and at a speed much less than that of the water. The volume of material scoured and moved may be large, but because of its low mean speed downstream, the whole volume does not move entirely out oi a long reach but. in effect, is shifted downstream only a limited distance. Detailed studies on the East Fork River, Wyoming, provide additional insight and quantification of the above interpretation.
Reversal in maximum values of water-surface slope from riffles during low flow to pools during high flow causes a similar reversal in values of available stream power. During high flow, pools often have a greater bedload-transport rate than riffles; during other stages of flow, the riffles have a greater transport rate. During low flow, the pools have negligible bedload-transport rates and become sinks, or storage areas, for the moving sediment. Accordingly, during the next high flow, pools often become a primary source of bedload sediment. Although all sections are likely to contribute sediment to bedload, resulting in the generalized scour during high flow as reported herein, spatially-variable bedload-transport rates require that those sections with the least available stream power during times of high transport rate fill temporarily as continuity in the sediment budget is maintained.
The downstream speed of sediment particles is low, on the order of 0.01 to o.l percent of the mean velocity of the flow. The duration of particle movement is controlled by the flow hydrograph and the locations of particles along the river as available stream power recedes. As the flow rate and stream power become low. particles within pools generally move no further. Smaller particles within riffles generally will continue to
75/
move to the next downstream pool because moderate stream power is still available in the riffle during low flow. This continued transport from riffle to pool at low flow helps explain sediment-sorting mechanisms and the maintenance of pool-riffle sequences in rivers.
The volume of scoured material in each increment of downstream travel distance is, on average, equal to the annual bedload. This is- only an approximation for estimating bedload because individual particles move at different speeds, for different durations of time, and for different downstream travel distances. Because of relatively short travel distances, much of the scoured material moving as bedload is still within the studied reach of channel but is not detected as bed material. Apparently, the volume of scoured material moving as bedload is sufficiently dilated that it cannot support the weight of either a bedload sampler or a bed-material sounding probe. This permits measurement of bedload and detection of scour.
References
Andrews. E. D.. 1977. Hydraulic adjustment of an alluvial stream channel to the supply of sediment, western Wyoming: University of California, Berkeley, Ph. D. Dissertation, i52p. . 1979a, Scour and fill in a stream channel, East Fork River, western Wyoming: U.S. Geological Survey Professional Paper 1117, 49 p. . 1979b, Hydraulic adjustment of the East Fork River, Wyoming to the supply of sediment, in Rhodes, D. D., and Williams, G. P., eds., Adjustments of the fluvial system: Dubuque, Iowa, Kendall/Hunt Publishing Co., p. 69—94. , 1981. Measurement and computation of bed-material discharge in a shallow sand-bed stream, Muddy Creek, Wyoming: Water Resources Research, v. 17, no. 1, p. 131—141-, 1982a, Adjustment of the East Fork River to bedload sediment contributed by Muddy Creek, in Leopold, L. B., ed., Field Trip Guidebook: American Geomorphological Field Groupi982 Conference, p. 57—68-, 1982b, Bank stability and channel width adjustment, East Fork River. Wyoming: Water Resources Research, v. 18, no. 4, p. 1184—1192-
Bagnold, R. A., 1977, Bedload transport by natural rivers: Water Resources Research, v. 13, no. 2. P- 303—312-, 1980, An empirical correlation of bedload transport rates in flumes and natural rivers: Royal Society of London Proceedings, v . 372A, Oct. 31, P- 453—473-
Bennett, J. P., and Nordin, C. F., 1977, Simulation of sediment transport and armouring: Hydrological Sciences Bulletin, v. 22 no. 4, P- 555—569-Dietrich, W. E., 1982a. Mechanics of a river meander, in Leopold, L. B.. ed., Field Trip
Guidebook: American Geomorphological Field Group 1982 Conference, p. 18—29-, 1982b, Flow, boundary shear stress, and sediment transport in a river meander: University of Washington, Seattle. Ph. D. Dissertation, 261 P-
Dietrich, W. E., Smith. J. D., and Dunne. Thomas. 1979, Flow and sediment transport in a sand bedded meander: Journal of Geology, v. 87, p. 305—315-
Dunne, Thomas, and Leopold. L. B., 1978. Water in environmental planning: W. H. Freeman and Co., San Francisco, 818 P-
Emmett, W. W., 1965. The Vigil Network: methods of measurement and a sampling of data collected: International Association of Hydrological Sciences Publication 66, p. 89—106-
752
. 1980a, A field calibration of the sediment-trapping characteristics of the Helley-Smith bedload sampler. U.S. Geological Survey Professional Paper 1139, 44 p. , 1980b, Bedload sampling in rivers: Proceedings, International Symposium on River Sedimentation, Beijing, China, March 24—29. 1980. Guanghua Press, p. 991—1017. , i98i, Measurement of bedload in rivers, in Erosion and sediment transport measurement: International Association of Hydrological Sciences Publication 133, p. 3—15. , 1982a. Helley-Smith bedload sampler, in Leopold. L. B.. ed., Field Trip Guidebook: American Geomorphological Field Group 1982 Conference, p. 41—48-. 1982b. Variability of bedload and some hydraulic characteristics along a reach of East Fork River, in Leopold. L. B.. ed.. Field Trip Guidebook: American Geomorphological Field Group 1982 Conference, p. 49—56-
Emmett, W. W., and Leopold, L. B.. 1965. Downstream pattern of riverbed scour and fill: Proceedings, Federal Inter-Agency Sedimentation Conference. 1963. Agricultural Research Service Miscellaneous Publication 970. P- 399—409-, 1977, A comparison of observed sediment-transport rates with rates computed using existing formulas, in Doehring, D. D., ed., Geomorphology in Arid Regions, Proceedings, Eighth Annual Geomorphology Symposium, Publications in Geomorphology. p. 187—188-
Emmett, W. W., Myrick, R. M.. and Meade, R. H.. 1980, Field data describing the movement and storage of sediment in the East Fork River, Wyoming: Part I. River hydraulics and sediment transport, 1979: U.S. Geological Survey Open-File Report 80—1189. 43 p. . 1982, Field data describing the movement and storage of sediment in the East Fork River, Wyoming: Part III. River hydraulics and sediment transport, 1980". U.S. Geological Survey Open-File Report 82-359. 289 p.
Klingeman. P, C.. and Emmett, W. W., 1982. Gravel bedload transport processes, in Hey, R.D., Bathurst, J. C., and Thorne, C. R., eds., Gravel-bed Rivers: John Wiley and Sons. p. 141—179.
Leopold, L. B., 1982a, Geologic setting (of East Fork River, Wyoming), in Leopold, L. B., ed.. Field Trip Guidebook: American Geomorphological Field Group 1982 Conference, p. 4—13-. 1982b, Water surface topography in river channels and implications for meander development, in Hey, R. D., Bathurst, J. C.. and Thorne. C. R., eds.. Gravel-bed Rivers: John Wiley and Sons. p. 359—388-
Leopold. L. B., and Emmett, W. W., 1976, Bedload measurements, East Fork River, Wyoming: [U.S.] National Academy of Sciences Proceedings, v. 74, no. 4, p. 1000—1004-• 1977, 1976 bedload measurements, East Fork River, Wyoming: [U.S.] National Academy of Sciences Proceedings, v. 74, no. 7. p. 2644—2648-. 1982. Bedload trap. East Fork River, in Leopold. L. B., ed., Field Trip Guidebook: American Geomorphological Field Group 1982 Conference, p. 30—40-
Leopold. L. B., Emmett, W. W., and Myrick, R. M.. 1966, Channel and hillslope processes in a semiarid area, New Mexico: U.S. Geological Survey Professional Paper 352-G. p. 193—253.
Lisle, T. E., 1976. Components of flow resistance in a natural channel: University of California. Berkeley, Ph. D. Dissertation, 66 P-. 1979. A sorting mechanism for a riffle-pool sequence: Geological Society of America Bulletin, v. 90, pt. II, p. 1142—1157-. 1982, Variations of hydraulic friction and roughness in a pool, riffle, and two bends of the East Fork River during a period of high runoff, in Leopold, L. B., ed., Field Trip Guidebook: American Geomorphological Field Group 1982 Conference, p. 69—76-
753
Mahoney, H. A., Andrews. E. D., Emmett. W. W., Leopold, L. B., Meade, R. H.. Myrick. R. M., and Nordin, C. F., 1976- Data for calibrating unsteady-flow sediment-trans port models. East Fork River, Wyoming, 1975: U.S. Geological Survey Open-File Report 76-22, 293 p.
Meade. R. H., Emmett, W. W., and Myrick, R. M., 198U, Movement and storage of bed material during 1979 in East Fork River, Wyoming, USA. in Erosion and sediment transport in Pacific rim steep lands: International Association of Hydrological Sciences Publication 132, P- 225—235. . 1981b, Wavelike movement of bedload. East Fork River, Wyoming, USA, in Abstracts: Symposium on Modern and Ancient Fluvial Systems. University of Keele, UK, p. 81-
Meade. R. H., Myrick. R. M., and Emmett, W. W., 1980, Field data describing the movement and storage of sediment in the East Fork River, Wyoming: Part II. Bed elevations. 1979: U.S. Geological Survey Open-File Report 80-1190. 172 p. . 1982, Field data describing the movement and storage of sediment in the East Fork River, Wyoming: Part IV. Bed elevations, 1980: U.S. Geological Survey Open-File Report 82-336, 197 P-
Prestegaard. K. L.. 1982a, Variables influencing water surface slope in gravel and coarse sand streams: University of California. Berkeley, Ph. D. Dissertation, i l l p. -t- appendices. . 1982b. Components of flow resistance in the East Fork River. Wyoming, in Leopold, L. B., ed., Field Trip Guidebook: American Geomorphological Field Group 1982 Conference, p. 77—85.