115 – Nr. 1 / 2010
SOME DATA AND RESULTS CONCERNING
GROUND MOTION IN MOLDOVA DURING RECENT
STRONG EARTHQUAKES OF 1986 AND 1990
Vasile ALCAZ1
, Ioan Sorin BORCIA2
, Horea SANDI3
1
Institute of Geology and Seismology of the Academy of Sciences of Republic Moldova
2
National Building Research Institute (INCERC), Bucharest, Romania
3
Academy of Technical Sciences of Romania, Institute of Geodynamics of the Romanian Academy
ABSTRACT
The instrumental data at hand from Republic
Moldova and from two of the accelerographic
stations of the network of Romania, located close
to the common border, are used in order to compare
the features of ground motions and to derive some
conclusions on the features of seismicity in
Republic Moldova. Response spectra of absolute
accelerations and discrete intensity spectra are
used for this purpose.
Key-words: strong earthquakes, Vrancea, Republic
of Moldova, seismicity, acceleration spectra,
intensity spectra
1. INTRODUCTION
1.1. General
The Vrancea seismogenic zone is by far the most
important source zone in Romania. According to
than 95 % of all seismic energy released per century
in Romania.
The strong Vrancea earthquakes of 30 August
1986 (MGR
= 7.0), 30 May 1990 (MGR
= 6.7) and 31
May 1990 (MGR
= 6.1) (Table 1) generated strong
ground motions for extensive areas of Romania,
Republic Moldova and Bulgaria (MGR
denotes
Gutenberg-Richter magnitudes). Numerous
accelerographic records were obtained during these
events. The wealth of instrumental data available
No Date Code EQ Lat. N Long. E h (km) MGR Mw
1 1986.08.30 861 45,53 26,47 133 7.0 7.3
2 1990.05.30 901 45,82 26,90 91 6.7 7.0
3 1990.05.31 902 45,83 26,89 79 6.1 6.4
Table 1.
Characteristics of Vrancea earthquakes referred to
made it possible to obtain a comprehensive picture
of the features of Vrancea earthquakes.
The data at hand make it possible to compare on
an instrumental basis the features of ground motions
for several sites of Romania and Republic Moldova
where accelerographic records were obtained. The
object of this paper is represented by such an attempt.
Response spectra of absolute accelerations and
discrete intensity spectra are used for this purpose.
1.2. Methodological aspects and
processing techniques used
The investigation of the features of ground
motion and of the reasons for these features was
performed using following main approaches:
REZUMAT
Datele instrumentale disponibile din Republica
comune, sunt utilizate pentru a compara caracteristicile
Moldova. În acest scop, sunt utilizate spectrele de
de intensitate.
Cuvinte cheie: seisme puternice, Vrancea, Republica
de intensitate
116
– Nr. 1 / 2010
1. Determining response spectra for strong
motion records for 12 horizontal, azimuthally
equidistant directions as presented in [Stancu
& Borcia, 1999];
2. Calculating corner periods of response
spectra;
3. Determining intensity spectra as defined
in [Sandi & Floricel, 1998], and briefly
summarized also in [Borcia & Sandi, 2010];
4. Determining also of global intensities, on
the same basis.
The symbols used in the paper correspond to
the entities referred to in Table 2.
The basic definitions of the intensity measures
used in the paper [Sandi & Floricel, 1998] are
reproduced in Table 3.
Note also that, in addition, following notations
were used:
EPA = (Saa averaged on 0.4 s
)max
/ 2.5 (1)
EPV = (Srv averaged on 0.4 s
)max
/ 2.5 (2)
Symbols used for intensities:
* global
** related to a frequency
*** averaged upon a
frequency interval
Name
* ** ***
Source of definition / comments
(ϕ: frequency, Hz)
Spectrum based
intensities
IS is (ϕ) is
∼
(ϕ′, ϕ′′) Linear response spectra for absolute accelerations and
velocities / use of EPA, EPV, redefined as EPAS, EPVS
respectively (see Table 2); averaging rules specified
Intensities based on
Arias’ type integral
[Arias, 1970]
IA id (ϕ) i
d
∼
(ϕ′, ϕ′′) Quadratic integrals of acceleration of ground (for IA), or of
pendulum of natural frequency ϕ (for id (ϕ)) / extensible to
tensorial definition; averaging rules specified
Intensities based on
quadratic integrals
of Fourier images
IF
(≡ IA)
if (ϕ) if
∼
(ϕ′, ϕ′′) Quadratic integrals of Fourier image of acceleration (for IF),
or quadratic functions of Fourier images (for id (ϕ)) /
extensible to tensorial definition; averaging rules specified.
Table 2.
System of instrumental criteria for intensity assessment
Intensity
measures
Definitions Notes
IS IS = log4 (EPAS × EPVS) + 8.0 EPAS = maxϕ saa (ϕ, 0.05) / 2.5
EPVS = maxϕ sva (ϕ, 0.05) / 2.5
is (ϕ) is (ϕ) = log4 [saa (ϕ, 0.05) × sva (ϕ, 0.05)] + 7.70 saa (ϕ, 0.05): absolute acceleration resp. sp.
sva(ϕ, 0.05): absolute velocity resp. sp.
IA IA = log4 {∫ [wg (t)]
2
dt} + 6.75 wg (t) ground motion acceleration
id (ϕ) id (ϕ) = log4 {∫ [wa (t, ϕ, 0.05)]
2
dt} + 5.75 wa (t, ϕ, 0.05): absolute acceleration
of pendulum with eigenfrequency ϕ
and 5% critical damping
Table 3.
Basic definitions of IS
, is
(ϕ), IA
, and id
(ϕ)
EPD = (Srd averaged on 0.4 s
)max
/ 2.5 (3)
TC
EPV / EPA (4)
TD
EPD / EPV (5)
IS
= log4
(EPA × EPV) + 8.0 (6)
IS1
= is
∼
(0.25 Hz, 16.0 Hz) (7)
ID1
= id
∼
(0.25 Hz, 16.0 Hz) (8)
where Saa
, Srv
and Srd
represent the response spectra
for absolute accelerations, relative velocities and
relative displacements respectively, all of them as
functions of period this time, each of them for 5%
critical damping, according to the definitions adopted
in the code [MTCT, 2006]. Note also that the values
EPA and EPV are somewhat lower than the
homologous values EPAS or EPVS, referred to in
Table 2, and this leads to somewhat lower estimates
for IS
.
2. BASIC DATA USED
The basic data used, referred to in Table 4, are
represented by accelerographic records obtained
V. Alcaz, I.S. Borcia, H. Sandi
117 – Nr. 1 / 2010
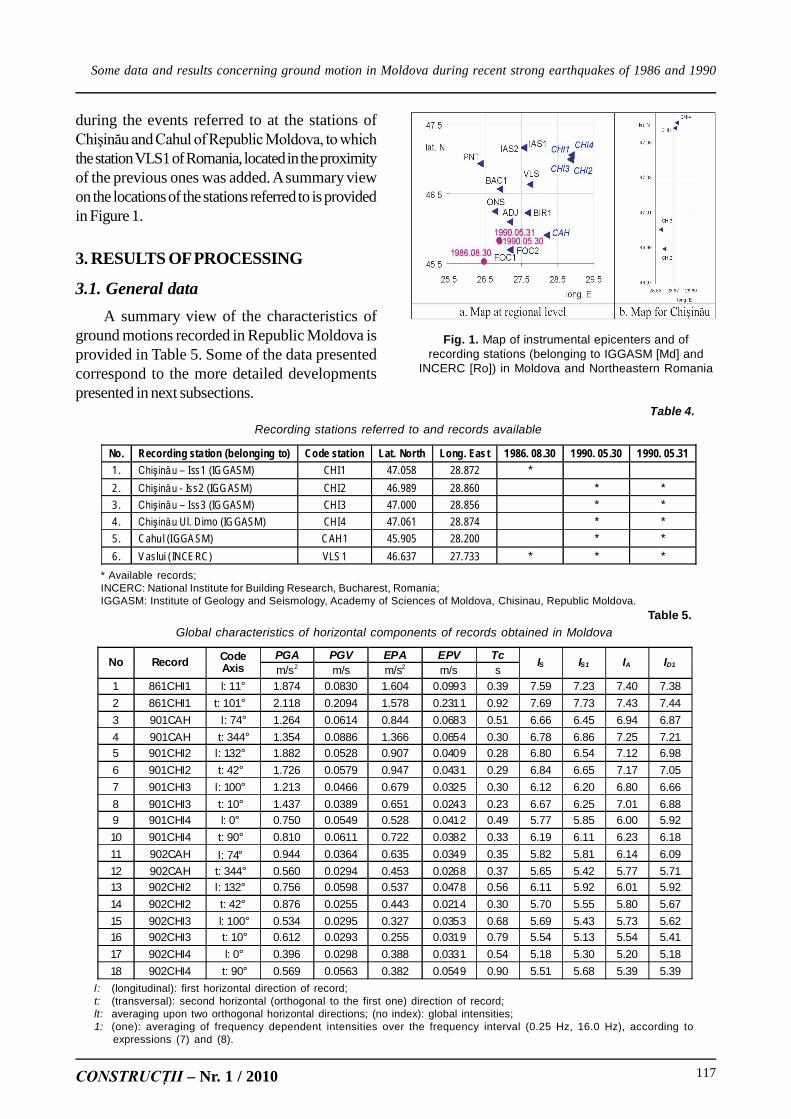
during the events referred to at the stations of
the station VLS1 of Romania, located in the proximity
of the previous ones was added. A summary view
on the locations of the stations referred to is provided
in Figure 1.
3. RESULTS OF PROCESSING
3.1. General data
A summary view of the characteristics of
ground motions recorded in Republic Moldova is
provided in Table 5. Some of the data presented
correspond to the more detailed developments
presented in next subsections.
Fig. 1. Map of instrumental epicenters and of recording stations
(belonging to IGGASM [Md] and INCERC [Ro]) in Moldova
and Northeastern Romania.
Fig. 1. Map of instrumental epicenters and of
recording stations (belonging to IGGASM [Md] and
INCERC [Ro]) in Moldova and Northeastern Romania
Table 4.
Recording stations referred to and records available
* Available records;
INCERC: National Institute for Building Research, Bucharest, Romania;
IGGASM: Institute of Geology and Seismology, Academy of Sciences of Moldova, Chisinau, Republic Moldova.
No. Recording sta tion (belonging to) Code stat ion Lat. North Long. East 1986. 08 .30 1990. 05 .30 1990. 05 .31
1. – Iss1 (IGGASM) CHI1 47.058 28.872 *
2 . - Iss2 (IGGASM) CHI2 46.989 28.860 * *
3 . – Iss3 (IGGASM) CHI3 47.000 28.856 * *
4 . Ul. Dimo (IGGASM) CHI4 47.061 28.874 * *
5 . Cahu l (IGGASM) CAH1 45.905 28.200 * *
6 . Vaslui ( INCERC) VLS1 46.637 27.733 * * *
PGA PGV EPA EPV Tc
No Record
Code
Axism/s
2
m/s m/s
2
m/s s
IS
IS1
IA
ID1
1 861CHI1 l: 11° 1.874 0.0830 1.604 0.0993 0.39 7.59 7.23 7.40 7.38
2 861CHI1 t: 101° 2.118 0.2094 1.578 0.2311 0.92 7.69 7.73 7.43 7.44
3 901CAH l: 74° 1.264 0.0614 0.844 0.0683 0.51 6.66 6.45 6.94 6.87
4 901CAH t: 344° 1.354 0.0886 1.366 0.0654 0.30 6.78 6.86 7.25 7.21
5 901CHI2 l: 132° 1.882 0.0528 0.907 0.0409 0.28 6.80 6.54 7.12 6.98
6 901CHI2 t: 42° 1.726 0.0579 0.947 0.0431 0.29 6.84 6.65 7.17 7.05
7 901CHI3 l: 100° 1.213 0.0466 0.679 0.0325 0.30 6.12 6.20 6.80 6.66
8 901CHI3 t: 10° 1.437 0.0389 0.651 0.0243 0.23 6.67 6.25 7.01 6.88
9 901CHI4 l: 0° 0.750 0.0549 0.528 0.0412 0.49 5.77 5.85 6.00 5.92
10 901CHI4 t: 90° 0.810 0.0611 0.722 0.0382 0.33 6.19 6.11 6.23 6.18
11 902CAH l: 74° 0.944 0.0364 0.635 0.0349 0.35 5.82 5.81 6.14 6.09
12 902CAH t: 344° 0.560 0.0294 0.453 0.0268 0.37 5.65 5.42 5.77 5.71
13 902CHI2 l: 132° 0.756 0.0598 0.537 0.0478 0.56 6.11 5.92 6.01 5.92
14 902CHI2 t: 42° 0.876 0.0255 0.443 0.0214 0.30 5.70 5.55 5.80 5.67
15 902CHI3 l: 100° 0.534 0.0295 0.327 0.0353 0.68 5.69 5.43 5.73 5.62
16 902CHI3 t: 10° 0.612 0.0293 0.255 0.0319 0.79 5.54 5.13 5.54 5.41
17 902CHI4 l: 0° 0.396 0.0298 0.388 0.0331 0.54 5.18 5.30 5.20 5.18
18 902CHI4 t: 90° 0.569 0.0563 0.382 0.0549 0.90 5.51 5.68 5.39 5.39
Table 5.
Global characteristics of horizontal components of records obtained in Moldova
l: (longitudinal): first horizontal direction of record;
t: (transversal): second horizontal (orthogonal to the first one) direction of record;
lt: averaging upon two orthogonal horizontal directions; (no index): global intensities;
1: (one): averaging of frequency dependent intensities over the frequency interval (0.25 Hz, 16.0 Hz), according to
expressions (7) and (8).
Some data and results concerning ground motion in Moldova during recent strong earthquakes of 1986 and 1990
118
– Nr. 1 / 2010
3.2. Response spectra and corner periods
Response spectra for the absolute acceleration
Saa
(T, n) were determined for 12 horizontal,
azimuthally equidistant directions, as adopted in
[Stancu & Borcia, 1999] (Figures 2.1, 2.2 and 2.3).
This was done for a 5 % critical damping. The
availability of response spectra along 12 equidistant
directions made it possible to emphasize the
differences in different directions of ground motion.
In addition, a comparison is presented in Figure
2.4 between the response spectra of the records
obtained on 1986.08.30 at station CHI1 and on
1990.05.31 at station CAH1 and during both events
at VLS1 on one hand and the normalized
acceleration response spectra specified by the codes
in force of Moldova, and of Romania, [MTCT,
2006], respectively.
Station CHI1 Station VLS1
Fig. 2.1. Response spectra for absolute accelerations along 12 equidistant azimuthal directions
for records obtained in Chisinau (Md) and Vaslui (Ro) during the 1986 Vrancea earthquake
CHI2
CHI3
CHI4
Fig. 2.2. Response spectra for absolute accelerations along 12 equidistant azimuthal directions
for records obtained in Chisinau (Md) during the 1990 Vrancea earthquakes
V. Alcaz, I.S. Borcia, H. Sandi
119 – Nr. 1 / 2010
1990.0
5.30
1990.0
5.31
CAH1 VLS1
Fig. 2.3. Response spectra for absolute accelerations along 12 equidistant azimuthal directions for
records obtained in Cahul (Md) and Vaslui (Ro) during the 1990 Vrancea earthquakes
Fig. 3. Normalized acceleration response spectra and spectral curves corresponding to the codes in force
in the two countries, [MTCT, 2006]
hquake (left) and for Cahul (CAH1) and Vaslui (VLS1) for 30 May 1990 Vrancea earthquake (right).eart
Fig. 2.4. Normalized acceleration response spectra and spectral curves corresponding to the
codes in force in the two countries, [MTCT, 2006] for Chisinau (CHI1) and Vaslui (VLS1) for
the 1986 Vrancea earthquake (left) and for Cahul (CAH1) and Vaslui (VLS1) for
30 May 1990 Vrancea earthquake (right)
3.3. Intensity Spectra Derived on the Basis
of Accelerographic Records
The intensity spectra (discreet, averaged upon
6 dB spectral intervals) presented in Figures 3.1,
3.2 and 3.3 were derived on the basis of
accelerographic records. The intensity spectra are
organized as follows:
• the abscissa corresponds to lg T;
• the ordinate corresponds to (instrumental)
intensity values.
3.4. Comments on the results of processing
3.4.1. On response spectra and corner
periods
Attention is to be paid not only to the features
of individual motions or spectra, but also to features
of sequences of spectra as a whole, which make it
possible to emphasize the trends of attenuation and
also the trends to stability or to variability (from one
Some data and results concerning ground motion in Moldova during recent strong earthquakes of 1986 and 1990
120
– Nr. 1 / 2010
event to another, at a definite location) of the features
of ground motion.
Looking at Figure 2.1, combined with Figure
1, it turns out that the response spectrum is more
severe for CHI1 than for VLS1, in spite of the fact
that the two stations are located along about the
same azimuthal direction with respect to the source,
while the location of CHI1 is more remote. This
difference appears to be obvious especially for
relatively long periods, around 1 s.
Looking at Figure 2.2, it turns out that the
spectral ordinates were about half as high for the
event of 1990.05.31, as compared with homologous
results for the event of 1990.05.30, which should
be the effect of the features of radiation / attenuation.
Fig . 4.1 . Averaged intensity spectra ( ) (red) and ( ) (blue) for 6 dB intervals
1) for the 1986 Vrancea earthquake.
i is d
~ ~
’, ’’ ’ ’’,
Fig . 4.2 . Averaged intensity spectra ( ) (red) and ( ) (blue) for 6 dB intervals
0 Vrancea earthquakes.
i is d
~ ~
’ ’’ ’ ’’, ,
Fig. 3.1. Averaged intensity spectra is
~
(ϕ’, ϕ’’) (red) and id
~
(ϕ’, ϕ’’) (blue) for 6 dB intervals for
Chisinau (recording station CHI1) and Vaslui (VLS1)
for the 1986 Vrancea earthquake
On the other hand, it turns out that, in case of the
latter event, the spectral ordinates become in some
way unexpectedly important for CHI4 for the latter
event.
Looking at Figure 2.3, it turns out that, while
the response spectra were about equally severe for
CAH1 and VLS1 in case of the event of 1990.05.30,
there is a considerably higher severity for CAH1 in
case of the event of 1990.05.31. This is very much
in agreement with the fact emphasized in [Sandi &
al, 2004] for the stations of Romania, namely the
strong trend to radiation towards East in case of the
latter event.
The values of corner periods Tc in Table 5 are
between 0.23 s and 0.92 s, making the value 0.5 s
V. Alcaz, I.S. Borcia, H. Sandi
Fig. 3.2. Averaged intensity spectra is
~
(ϕ’, ϕ’’) (red) and id
~
(ϕ’, ϕ’’) (blue) for 6 dB intervals for Chisinau
(recording station CHI2, CHI3, CHI4) for the 1990 Vrancea earthquake
121 – Nr. 1 / 2010
Fig. 3.3. Averaged intensity spectra is
~
(ϕ’, ϕ’’) (red) and id
~
(ϕ’, ϕ’’) (blue) for 6 dB intervals for
Cahul (CAH1) and Vaslui (VLS1) for the 1990 Vrancea earthquakeFig . 4.3 . Averaged intensity spectra ( ) (red) and ( ) (blue) for 6 dB intervals
for Cahul (CAH1) and Vaslui (VLS1) for the 1990 Vrancea earthquakes.
i is d
~ ~ ?’ ’’ ’ ’’, ,for the end of the flat portion of the spectral curve
corresponding to the code in force in the Republic
of Moldova questionable. This fact is illustrated also
in Figure 2.4 (left). Table 5 shows a very good
correlation between values of Arias intensity IA
and
values of intensity based on the destructiveness
spectrum averaged over the frequency interval
(0.25 Hz, 16.0 Hz), ID1
.
In spite of the fact that the ground conditions
are the same for all directions of oscillation, there
are in some cases important differences between
spectral ordinates corresponding to different
directions for the same event and place (the extreme
ratios of ordinates reach or even exceed, the
threshold 3.0 for some oscillation periods as
illustrated in Figure 2.1 for the CHI1 station, in Figure
2.2 for the CHI4 station and in Figure 2.3 for the
CAH1 station, for the event of 1990.05.31).
3.4.2. On intensities and intensity spectra
A look at Table 5 shows that correlations are
strong between the values IS
and IS1
on one hand
and even stronger between IA
and ID1
on the other
hand. The correlation is weaker between IS
and IA
,
but the individual relative deviations are nevertheless
(perhaps with the exception of 901 CHI3 l) lower
than the accuracy and certainty with which traditional
macroseismic intensities can be estimated.
A look at Figures 3.1, 3.2 and 3.3 makes it
possible to express some remarks about the intensity
spectra. The two kinds of intensity spectra are well
correlated for most of the cases and spectral bands
dealt with. It turns out that, when relevant differences
appear, the values of is
~
(ϕ’, ϕ”) (red) tend to be
higher for longest period spectral bands and lower
for shortest period spectral bands than id
~
(ϕ’, ϕ”)
Some data and results concerning ground motion in Moldova during recent strong earthquakes of 1986 and 1990
122
– Nr. 1 / 2010
(blue). This may be remarked especially for the
stations CHI2 and CAH1. A look at Figure 3.3,
e.g., shows that there are differences around 0.6
degree of intensity for intensities averaged over
period intervals (0.0625…0.125 s) and (0.125…
0.250 s) and differences around -0.9 degree of
intensity for (2.0...4.0 s).
A look, especially at Figures 3.2 an 3.3, for the
spectral interval ranging from about 0.125 s to about
2.0 s, which is the most significant for the effects
upon structures, shows that the intensity spectra
strongly depend upon period. This remark warns
upon the danger of misestimate of intensities in case
one neglects the spectral bands for which the field
data sampled during post-earthquake field surveys
are.
4. FINAL CONSIDERATIONS
An examination of the strong-motion records
available and of the spectra determined indicate that
it is particularly important to consider all available
data because considering one station or even one
event in isolation could lead to unrealistic conclusions.
This is why the availability of strong-motion data for
several events originating in the same source zone is
so important.
An aspect of primary interest for this paper is
the fact that for sites CHI1 and CHI4 there was a
strong tendency to variability of the spectral contents
of ground motion (as illustrated by the response
spectra of figures 2.1, 2.2 and 2.3). Explaining the
reasons for this is of obvious interest because it is
directly connected with the ability to anticipate the
spectral contents of future strong ground motions.
More in depth analyses should lead to results
concerning the relative importance of the features
of radiation and of local conditions to this fact.
The two ways of processing instrumental data,
namely the determination of response spectra and
of intensity spectra, appear to be complementary.
The use of both of them appears to be suitable for
in depth analyses of ground motion.
Depending on period or frequency interval,
there appears to occur frequently a significant
variation of the spectral band-related averaged
intensities. This provides a picture of the spectral
intervals for which the intensities are higher and,
consequently, the severity of seismic action appears
to be higher. There are differences in outcome if
alternative definitions of is
~
(ϕ’, ϕ”) and id
~
(ϕ’, ϕ”)
are used, but the differences are moderate and defi-
nitely less than the possibilities for discrimination
provided by the use of macroseismic intensities
derived from visual post-earthquake surveys. It
is to mention that the instrumental intensities are
continuous quantities, differing of standard
macroseismic intensity (discrete quantity).
REFERENCES
[1] V. Alcaz, Nauchno-metodicheskie osnovy prognoza
seismicheskoy opasnosti i seismicheskogo riska
territorii Respubliki Moldova (Scientific – metho-
dological bases of seismic hazard and risk evaluation
for the territory of Republic Moldova, PH.D. Thesis,
[2] V. Alcaz, I. S. Borcia, A. Drumea, H. Sandi, D.
(Scientific
cooperation Romania – Republic Moldova on
earthquake protection themes). Proc. Zilele
Academice ASTR 2007 (Proc. Academic Days ASTR
2007), Editura AGIR, Bucharest
[3] A. Arias, A measure of earthquake intensity. Seismic
Design for nuclear power plants, Ed. R. J. Hansen,
Cambridge, Mass.: The MIT Press, 1970
[4] Cutremurul
Romania earthquake of 4 March 1977), Editura
Academiei, Bucharest, 1982
[5] I. S. Borcia, Data processing of strong motion records
obtained during Romanian earthquakes (in
Romanian), Doctoral Thesis, UTCB, 2006
[6] S. Borcia, A comparative analysis of accelerographic
records obtained in the Republic of Moldova and
Romania during the 1986 and 1990 Vrancea
earthquakes, International Workshop on Seismic
Hazard and Seismic Risk Reduction in Countries
Influenced by Vrancea Earthquakes, May 20, 2008
Chi
the NATO research Project SfP-980468
[7] I.S. Borcia, H. Sandi, Techniques and results of
processing of macroseismic and instrumental
information for sample events, in relation to the
calibration of instrumental criteria, in H. SANDI
(Project Director & Editor) et al Quantification of
Seismic Action on Structures, Ed. AGIR, Bucharest,
2010
V. Alcaz, I.S. Borcia, H. Sandi
123 – Nr. 1 / 2010
[8] H. Sandi, I.S. Borcia, Damage spectra and intensity
spectra for recent Vrancea earthquakes (Paper
no. 574), Proc. 1-st European Conference on
Earthquake Engineering and Seismology, Geneva,
2006
[9] H. Sandi, I, S. Borcia, M, Stancu, Analysis of
attenuation for recent Vrancea intermediate depth
earthquakes ( No. 2477). Proc. 13WCEE, Vancouver,
2004
[10] H. Sandi, I. Floricel, Some alternative instrumental
measures of ground motion severity, Proc. 11-th
ECEE, AFPS, Paris, 1998
[11] M. Stancu, I. S. Borcia, Studies concerning the direc-
tionality of seismic action for Vrancea earthquakes,
Proc. International Workshop for Vrancea
Earthquakes, Bucharest, 1997, Kluwer, Dordrecht,
1999
[12] MTCT: P100-1/2006: Seismic Design Code. Part I.
Design Rules for Buildings, UTCB-MTCT (in
Romanian), 2006
[13] MD SNiP II-7-81, Stroitel’nye Normy i Pravila
Some data and results concerning ground motion in Moldova during recent strong earthquakes of 1986 and 1990