Page 1
Some Data on the Growth and the Unequal Incidence of Incarceration in the US since 1980
September 11, 2008
by
Glenn C. Loury Merton P. Stoltz Professor of the Social Sciences Brown University
Page 3
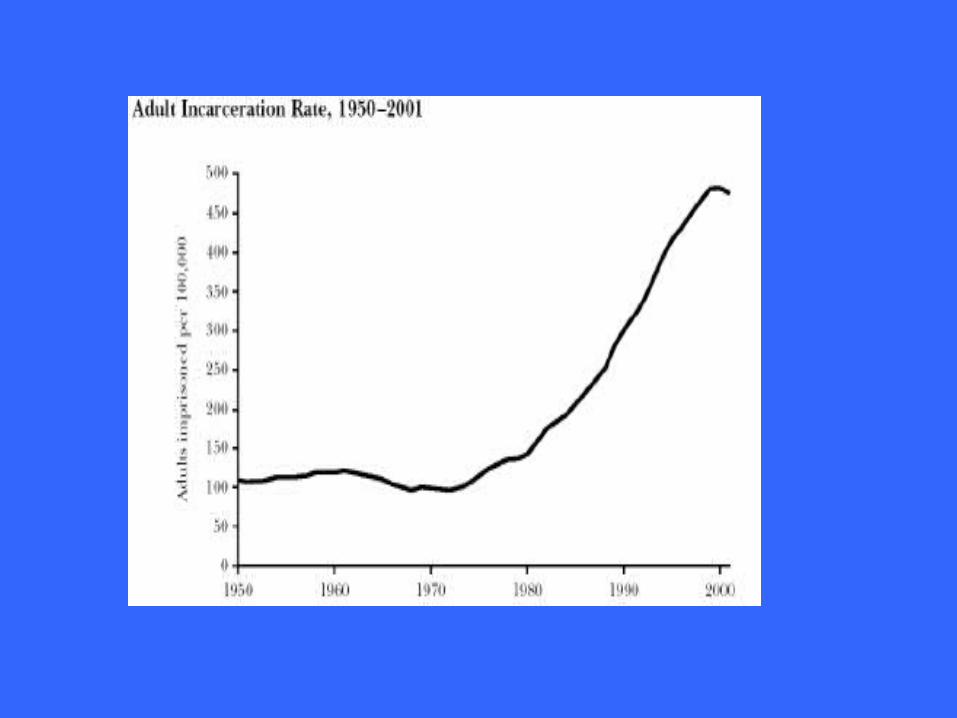
Trends in Imprisonment and Offending
Page 9
A Huge Commitment of Resources
Page 16
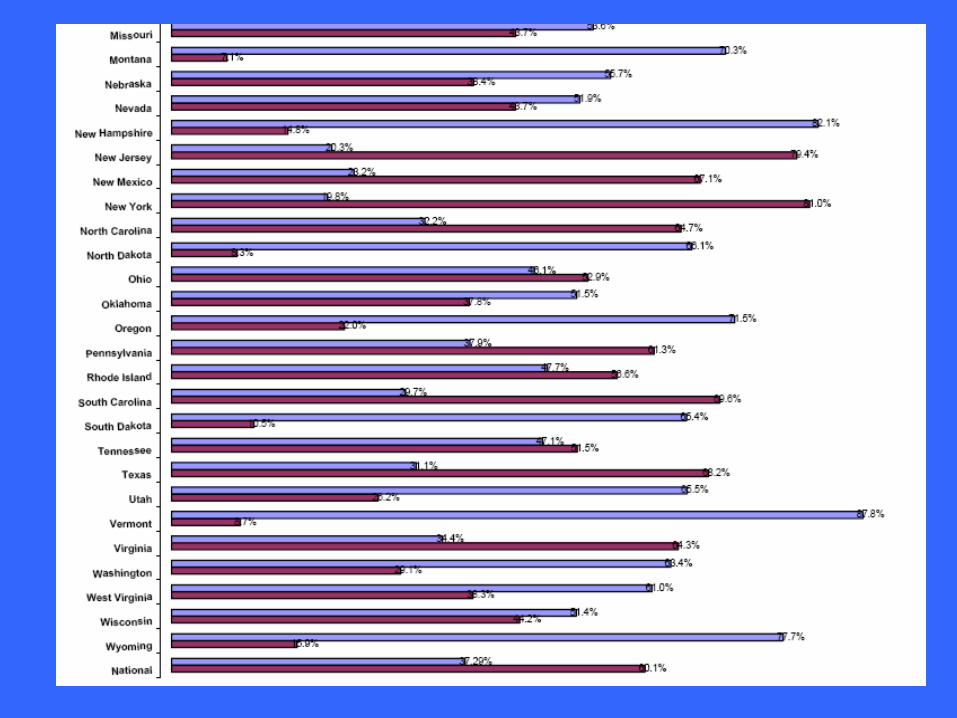
Racial Disparities
Page 30
General Trends in Social Disparities by Race
Page 31
Median Income of Households by Race
0
10,000
20,000
30,000
40,000
50,000
1979
1981
1983
1985
1987
1989
1991
1993
1995
1997
1999
2001
White
Black
http://www.census.gov/compendia/statab/tables/07s0679.xls
Page 33
Holzer, Harry J; Offner, Paul; Sorensen, Elaine. 2005. Declining Employment among Young Black Less-Educated Men: The Role of Incarceration and Child Support.” Journal of Policy Analysis and Management, vol. 24, no. 2, Spring , pp. 329-50
Page 35
Percent College Graduate by Race
0
5
10
15
20
25
30
White
Black
http://www.census.gov/compendia/statab/tables/07s0214.xls
Page 36
Per Capita Annual Hours of Employment for Native-Born Non-Hispanics Aged 25 to 59; 1968 to 2007
500
700
900
1,100
1,300
1,500
1,700
1,900
2,100
1968 1971 1974 1977 1980 1983 1986 1989 1992 1995 1998 2001 2004 2007
PE
R C
AP
ITA
HO
UR
S O
F E
MP
LO
YM
EN
T
White Men
Black Men
Black Women
White Women
Page 37
Percent of Native-Born, Non-Hispanic Men and Women Aged 25 to 34 Reporting a Four-Year College Education
0%
5%
10%
15%
20%
25%
30%
35%
40%
45%
50%
1968 1971 1974 1977 1980 1983 1986 1989 1992 1995 1998 2001 2004 2007
Black Men
White Men
0%
5%
10%
15%
20%
25%
30%
35%
40%
45%
50%
1968 1971 1974 1977 1980 1983 1986 1989 1992 1995 1998 2001 2004 2007
Black Women
White Women
Page 38
$5,000
$15,000
$25,000
$35,000
$45,000
$55,000
$65,000
$75,000
1968 1971 1974 1977 1980 1983 1986 1989 1992 1995 1998 2001 2004 2007
Black Men
White Men
$5,000
$15,000
$25,000
$35,000
$45,000
$55,000
$65,000
$75,000
1968 1971 1974 1977 1980 1983 1986 1989 1992 1995 1998 2001 2004 2007
Black Women
White Women
Per Capita Income Reported by Persons Aged 25 to 59 (constant 2007 Dollars)
Page 39
Median Income of Households Headed by Native-Born Non-Hispanics (shown in constant 2007 Dollars)
$10,000
$15,000
$20,000
$25,000
$30,000
$35,000
$40,000
$45,000
$50,000
$55,000
$60,000
1968 1971 1974 1977 1980 1983 1986 1989 1992 1995 1998 2001 2004 2007
Whites
Blacks
Page 40
Percent of Native-Born Non-Hispanics Below the Poverty Line; 1968 to 2007
0%
5%
10%
15%
20%
25%
30%
35%
40%
1968 1971 1974 1977 1980 1983 1986 1989 1992 1995 1998 2001 2004 2007
ImpoverishedBlacks
Impoverished Whites
Recession Periods
Page 41
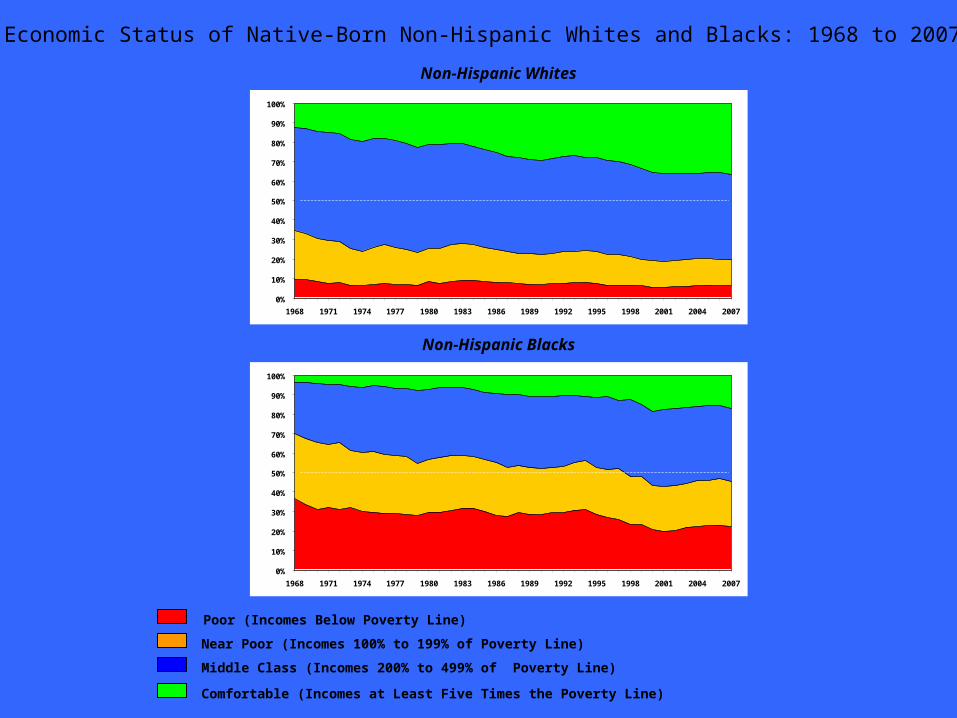
Non-Hispanic Whites
Non-Hispanic Blacks
Poor (Incomes Below Poverty Line)
Near Poor (Incomes 100% to 199% of Poverty Line)
Middle Class (Incomes 200% to 499% of Poverty Line)
Comfortable (Incomes at Least Five Times the Poverty Line)
Economic Status of Native-Born Non-Hispanic Whites and Blacks: 1968 to 2007
0%
10%
20%
30%
40%
50%
60%
70%
80%
90%
100%
1968 1971 1974 1977 1980 1983 1986 1989 1992 1995 1998 2001 2004 2007
0%
10%
20%
30%
40%
50%
60%
70%
80%
90%
100%
1968 1971 1974 1977 1980 1983 1986 1989 1992 1995 1998 2001 2004 2007
Page 42
Median Wage and Salary Earnings for Native-Born Non-Hispanics Reporting Earnings
$10,000
$15,000
$20,000
$25,000
$30,000
$35,000
$40,000
$45,000
$50,000
$55,000
$60,000
1968 1971 1974 1977 1980 1983 1986 1989 1992 1995 1998 2001 2004 2007
White Men
Black Men
Black Women
White Women
Page 43
Number of Blacks Elected to Serve in Congress: 1966 to 2006
41
41
37
37
37
38
39
38
25
24
23
20
21
17
16
17
16
16
13
10
6
0 5 10 15 20 25 30 35 40 45
2006
2004
2002
2000
1998
1996
1994
1992
1990
1988
1986
1984
1982
1980
1978
1976
1974
1972
1970
1968
1966
Page 44
Percent of Married Spouse Present, Native-Born, Non-Hispanic White Women Aged 25 to 34
Married to Black Men, and Percent of Similar Black Women Married to White Men
Percent of Married Spouse Present, Native-Born, Non-Hispanic White Men Aged 25 to 34 Married to Black Women, and Percent of
Similar Black Men Married to White Women
0%
1%
2%
3%
4%
5%
6%
7%
8%
9%
10%
11%
12%
13%
14%
15%
Black Wives Married to
White Husbands
White Wives Married toBlack Husbands
0%
1%
2%
3%
4%
5%
6%
7%
8%
9%
10%
11%
12%
13%
14%
15%
1960 1970 1980 1990 2000 2006
Black Husbands Married to
White Wives
White Husbands Married to
Black Wives
Page 45
Racial Attitudes of National Samples of Whites; General Social Survey, 1972 to 2004
0%
10%
20%
30%
40%
50%
60%
70%
80%
90%
100%
1972 1974 1976 1978 1980 1982 1984 1986 1988 1990 1992 1994 1996 1998 2000 2002 2004
Would vote for a black candidate
Would vote forOpen Housing
Law
Believe blacks shouldn't
push
Oppose interracialmarriage
Believe whites have right to segregate their neighborhoods