SOME EFFECTS OF HYDRAULIC DREDGING AND COASTAL DEVELOPMENT IN BOCA CIEGA BAY, FLORIDA 1 BY JOHN L. TAYLOR AND CARL H. SALOMAN, Fishery Biologists BUREAU OF COMMERCIAL FISHERIES BIOLOGICAL LABORATORY ST. PETERSBURG BEACH, FLA. 33706 ABSTRACT Filling of 1,400 hectares (3,500 acres) of bay by hy- draulic dredging has reduced the area of Boca Ciega Bay, Fla., by about 20 percent since 1950. An estimate of the annual standing crop destroyed is 1,133 metric tons (798 kg. per hectare, dry whole weight) of sea grass and about 1,812 metric tons (1,277 kg. per hectare, dry weight) of associated infauna. In terms of annual production, the loss of biological resources is far greater-minimum estimates are 25,841 metric tons of Boca Ciega Bay is a pltrt of Tamplt Blty, Fllt., where cOltstal development lt11(} progressive de- teriomtion of wltter qUltlity llltve ltdversely influ- enced plltnt and animal production. This report describes some biological and physical cllltnges t.hltt followed alteration of the blty and compltreS estu- arine conditions in dredged ItreltS wit.h those in relatively undisturbed ttreas. Hydl'ltulic dredging becmue. ltll ltccepted meltns of crea.ting coastal uplltnd in Florida about 1920, and has since proved an efficient means of provid- ing waterfront renI esta.te of premium vnIue. Dredging was not II, serious threa.t to coastltl re- sources until after 1950 when coa.sta.l construc- tion st.arted on a large scale, especinlly along the lower east coast and the low-energy stra.nd of the west coast from Tltmpa Bn.y southward. Profit and permissive ltttitudes toward the sa.le of submerged la.nd contributed to rapid disposa.l of va. ''It. public holdings along much of Florida's 14,400 km. (9,- 000 statute miles) of tidal eoastline. Bay filling has been lit.tle regulated, and in most sitlllttions Published Octooet 11168. FISHERY BULLETIN: VOL. 67, NO. :2 sea grass, 73 metric tons of fishery products, and 1,091 metric tons of infauna exclusive of meiofauna. Natural areas remaining in the Bay support local and offshore fisheries and are of value for recreation, public utilities, commerce, and industry. At an estimated'value of $988 per hectare per year, worth of the estuarine area already eliminated is $1.4 million annually. In addition, in- estimable secondary losses occur, princlpally from sedimentation, turbidity, and domestic sewage. biological and recrelttion:tl resources of estuarine waters hn.va been disregarded by coastal devel- opers and goveming authorities (Dttvis, 1956; Brunn n.nd De Grove, 1959; Kidd, 1963). Legisl!1tion to control dredge-fill projects in Floricht appeltred first in 1957 (Sootion 253.122 Florida. Statutes, 1957), and the following year nIl such projects becltlne subject to Federal review (Fish and Wildlife Coordination Act, P.L. 85- 624). Unfortunately, unde.r these laws the sale and development of submerged IltllCl remained largely arbitrary and most efforts to stop landfills in estu- aries llltve been unsuccessful (Arnold, 1967). Guidelines for ltppraisal of e.c;tuarine ltreltS were proposed by Thompson (1961),'und more positive measures are nO\\- being tn;ken to conserve marine resources ltnd provide for their mtional' use in Florida as we.ll as in other pa.rts of the country and abroad (Florida Statutes, chapter67-393; Gil- mour, 1965; Hutton, 1964; Tukey, 1965; Cain, 1960; Oa.ld \\'p.lI; W(6). Encourltging, t.oo, is the I Contribution No. 47. Bureau of Commercial Fisheries Biologiral Labom- tory. St. Petersburg BeaCh. Fla. 337Qb. 213
Transcript
SOME EFFECTS OF HYDRAULIC DREDGING AND COASTAL DEVELOPMENTIN BOCA CIEGA BAY, FLORIDA 1
BY JOHN L. TAYLOR AND CARL H. SALOMAN, Fishery BiologistsBUREAU OF COMMERCIAL FISHERIES BIOLOGICAL LABORATORY
ST. PETERSBURG BEACH, FLA. 33706
ABSTRACT
Filling of 1,400 hectares (3,500 acres) of bay by hydraulic dredging has reduced the area of Boca CiegaBay, Fla., by about 20 percent since 1950. An estimateof the annual standing crop destroyed is 1,133 metrictons (798 kg. per hectare, dry whole weight) of sea grassand about 1,812 metric tons (1,277 kg. per hectare, dryweight) of associated infauna. In terms of annualproduction, the loss of biological resources is fargreater-minimum estimates are 25,841 metric tons of
Boca Ciega Bay is a pltrt of Tamplt Blty, Fllt.,where cOltstal development lt11(} progressive deteriomtion of wltter qUltlity llltve ltdversely influenced plltnt and animal production. This reportdescribes some biological and physical cllltnges t.hlttfollowed alteration of the blty and compltreS estuarine conditions in dredged ItreltS wit.h those inrelatively undisturbed ttreas.
Hydl'ltulic dredging becmue. ltll ltccepted meltnsof crea.ting coastal uplltnd in Florida about 1920,and has since proved an efficient means of providing waterfront renI esta.te of premium vnIue.Dredging was not II, serious threa.t to coastltl resources until after 1950 when coa.sta.l construction st.arted on a large scale, especinlly along thelower east coast and the low-energy stra.nd of thewest coast from Tltmpa Bn.y southward. Profit andpermissive ltttitudes toward the sa.le of submergedla.nd contributed to rapid disposa.l of va.''It. publicholdings along much of Florida's 14,400 km. (9,000 statute miles) of tidal eoastline. Bay fillinghas been lit.tle regulated, and in most sitlllttions
Published Octooet 11168.
FISHERY BULLETIN: VOL. 67, NO. :2
sea grass, 73 metric tons of fishery products, and 1,091metric tons of infauna exclusive of meiofauna. Naturalareas remaining in the Bay support local and offshorefisheries and are of value for recreation, public utilities,commerce, and industry. At an estimated'value of $988per hectare per year, worth of the estuarine area alreadyeliminated is $1.4 million annually. In addition, inestimable secondary losses occur, princlpally fromsedimentation, turbidity, and domestic sewage.
biological and recrelttion:tl resources of estuarinewaters hn.va been disregarded by coastal developers and goveming authorities (Dttvis, 1956;Brunn n.nd De Grove, 1959; Kidd, 1963).
Legisl!1tion to control dredge-fill projects inFloricht appeltred first in 1957 (Sootion 253.122Florida. Statutes, 1957), and the following yearnIl such projects becltlne subject to Federal review(Fish and Wildlife Coordination Act, P.L. 85624). Unfortunately, unde.r these laws the sale anddevelopment of submerged IltllCl remained largelyarbitrary and most efforts to stop landfills in estuaries llltve been unsuccessful (Arnold, 1967).
Guidelines for ltppraisal of e.c;tuarine ltreltS wereproposed by Thompson (1961),'und more positivemeasures are nO\\- being tn;ken to conserve marineresources ltnd provide for their mtional' use inFlorida as we.ll as in other pa.rts of the countryand abroad (Florida Statutes, chapter 67-393; Gilmour, 1965; Hutton, 1964; Tukey, 1965; Cain,1960; Oa.ld\\'p.lI; W(6). Encourltging, t.oo, is the
I Contribution No. 47. Bureau of Commercial Fisheries Biologiral Labomtory. St. Petersburg BeaCh. Fla. 337Qb.
213
fact that developers of bayfill projects have rece.ntly demonstrated a willingness to preserve somenatural features on development sites (Gresham,1967; Sykes, 1967).
In Florida and other States bordering the Gulfof Mexico, dredging and other forms of estuarinedestruction damage fisheries bec.ause most of the .spec-ies taken in sport and commercial fisheries livein estuaries during part. or all of their life cycle(Skud and Wilson, 1960; Sykes and Finue-ane,19(6). Premium estuarine habitats t.hat supportthe fisheries are vegetated, littoral biot.opes containing populous, stable, and highly productiveeommunities (Humm, 1956; Odum and Hoskin,1958; Pomeroy, 1959; Odum, 1961; Margalef,1963; Moore, 1963; Livingstone, 1965; St.ephens,1966; O'Gower and Wacasey, 1967).
Commercial fisheries in the Gulf of Mexic.o account for one.-third of the Nation's marine. landings and are worth about $114 million annually(Lyles, 1966). The landings could probably be increased two to five t.imE','; through gt·eat.er fishingeffort, and use of species not now fished wouldmise these figures even higher (Schaefer, 106f,;Pirie., 1967). In addition, production in some estuaries will certainly inerease when methods aredeveloped for eulture. of c.e.rtain fishes, erustaeeaus,mollusks, and marine pla.nt,~ (Allen, 1963; Loosanoff and Davis, 1963; Shelbourne, 1964; Bone.y,1965). Thus, perhaps the most time.Iy argumentagainst further destruction of estuarine habitat.sis the. present. and potent.ia.} value of these areas forproduction of food (Tressler and Lemon, 1951;Hornig, 19(6). Other nondestructive uses of estuaries, such as recreation, are compatible with fisheries and gre.atly add to t.he cash vn.lne of estuarineacreage, particularly in resort ltl'eas like BoclLCiega Bay.
DESCRIPTION OF AREA
Boca Ciega Bay lies within Tampa Bay, midway along the west coast of peninsular Florida.Separated from the Gulf of Mexico by a chainof barrier islands, Boca Ciega Bay merges withTampa. Ray 011 t.he south n-nd l'>xtends 25.6 km.(16 miles) north as a narrow coastal lagoon (fig.1)" 'Water area is about. 70 km.2 (27 square miles)and wat.er de.pth over nea.rly 80 percent of t.he are.ais 1.8 m. or less (Olson, 1953; Olson amI Morrill,1955) .
214
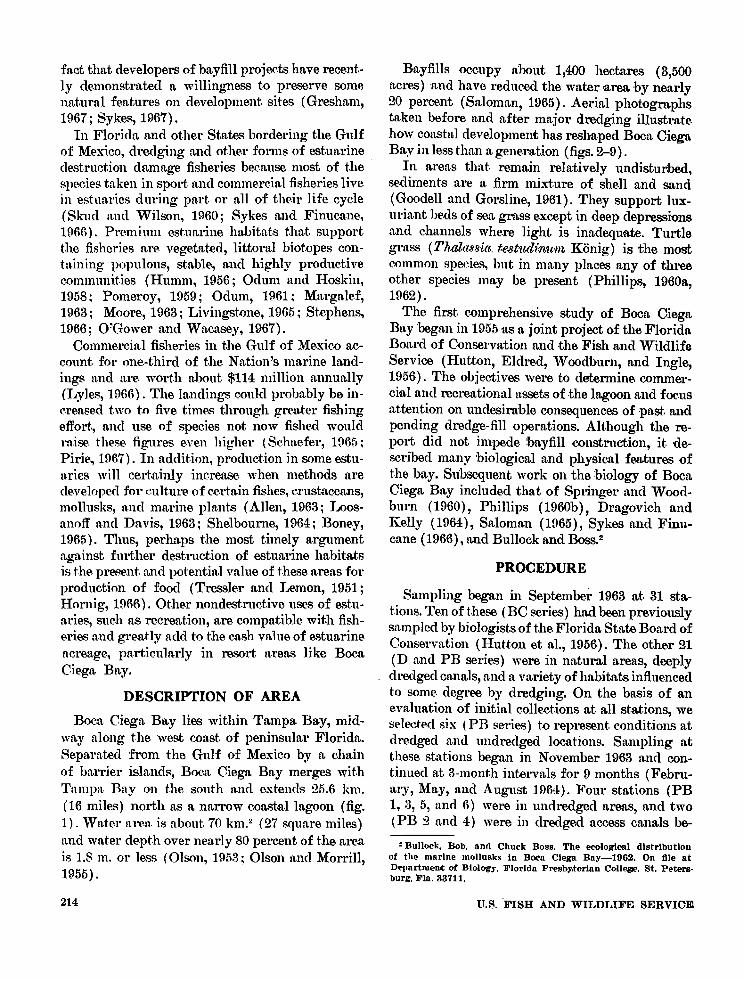
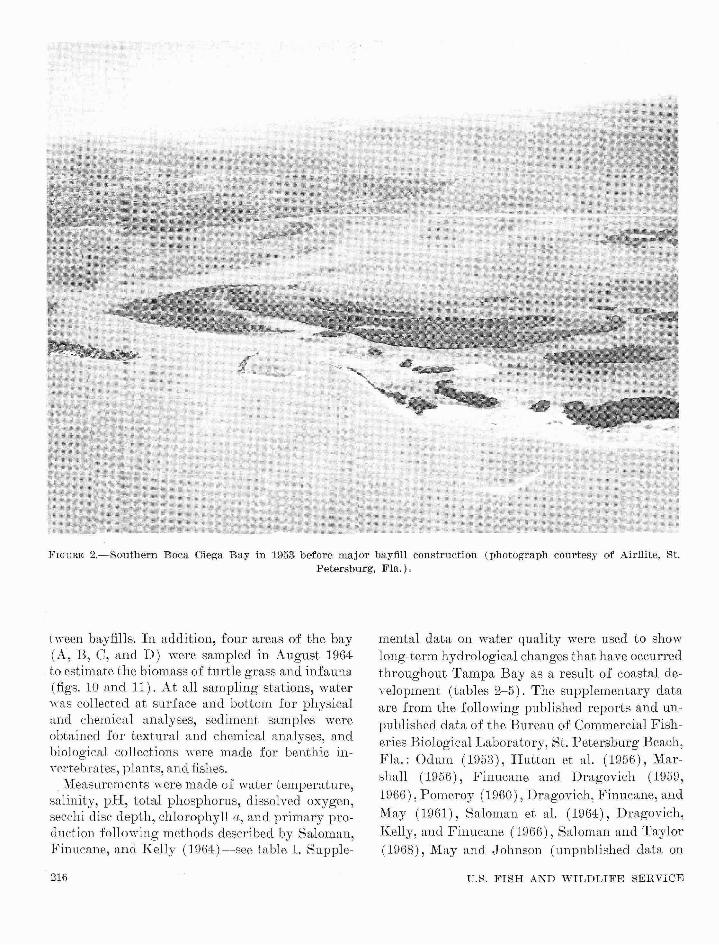
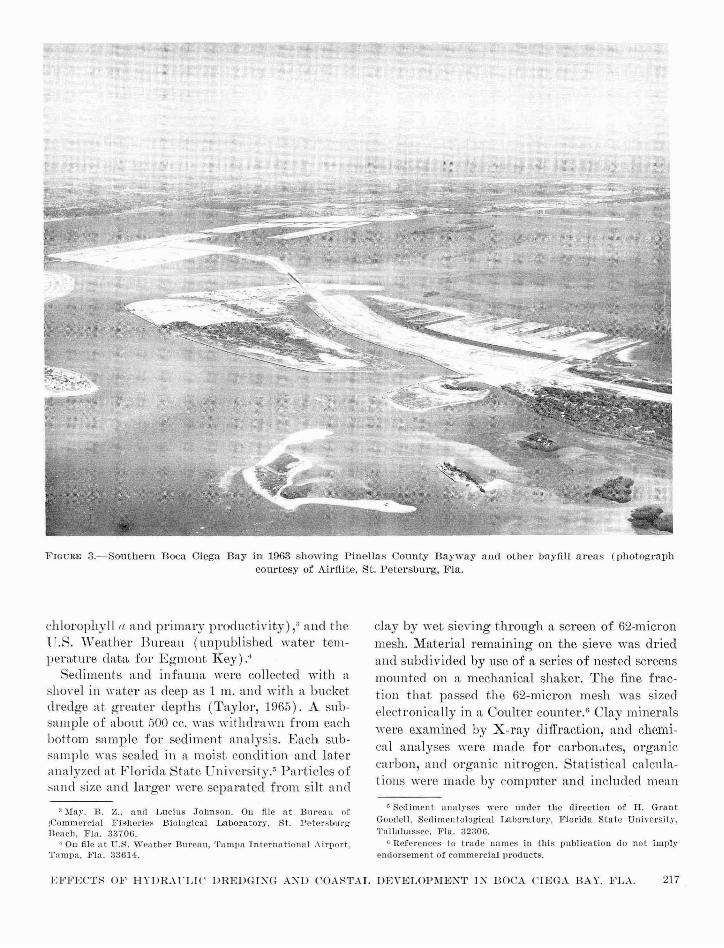
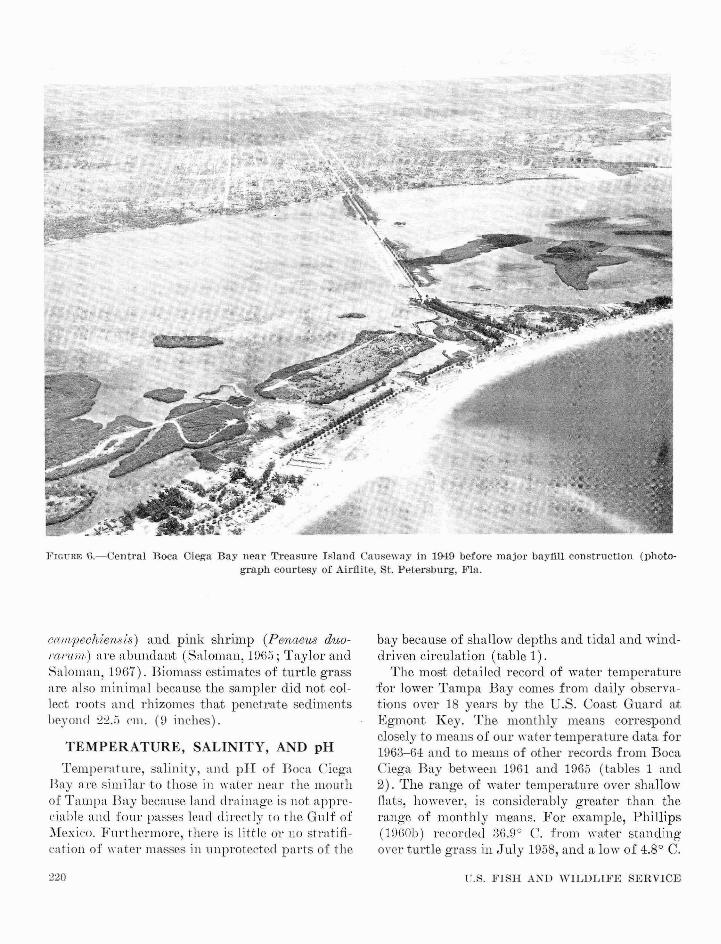
Bayfills oce-upy ahout 1,400 hectares (3,500acres) -and have reduced the water area by nearly20 percent (Saloman, 1965). Aerial photographstaken before and after major dredging illustrate.how coastal development has reshaped Booa CiegaBay in less than a generation (figs. 2-9) .
In area·s that remain relat.ively undisturhed,sediments are a firm mixture of shell and snnd(Goodell and Gorsline, 1961). They support luxurin-nt heds of sea grass except in deep depressionsltnd channels where light is inadequate. Turtlegrn,ss (Tlw}aJJ8i(r.. te8t-udimun Konig) is the mostcommon speeies, hut in ma.ny places any of threeother species may be present (Phillips, 1960a,1962).
The first. eomprehensive study of Booa CiegaBay began in 1955 as a joint projeet of the FloridaBoard of C.onservlttion and the Fish and WIldlifeServioo (Hutton, Eldred, W'oodhurn, and Ingle,1956). The objectives were to determine. commerc.ial and recreational assets of the lagoon and foousltttention on undesirable consequences of ·past. andpending dredge-fill operations. Alt.hough the report. did not impede hayfill construction, it described many biological and physieal fea.tures oft.he ba.y. Subsequent work on t.he biology of BocaCiega Bay included that of Springe.r and Woodburn (1960), Phillips (1960b), Dragovieh andKe.Ily (1964), Saloman (1965), Sykes and Finucane (1966), a.nd Bullock and Boss.2
PROCEDURE
Sampling began in September 1963 a.t. 31 sta.tions. Ten of t.hese (BC series) ha.d been previouslysampled by biologist.s of the Florida Sta.te Board ofConservation (Hutton et al., 1956). The other 21(D and PB series) were in natural areas, deeplydredged canals, and a va.riety of habitats influencedto some degree by dredging. On the basis of anevaluation of initial colle.ct.ions at all sta.tions, wesele.ctt'd six (PR series) to represent conditions atdredged and undredged looations. Sampling atthese stations began in November 1963 and continued at 3-month intervals for 9 months (February, May, and August 1964). Four stations (PB1, 3, 5, and 6) were. in undredged areas, and two(PB 2 uml 4) were in dredged access eanals be-
: Bullol'k, Bob. aml ChUl'k Bo~s. The eoologlcat dlstrlbutiollof the marine mollusks In BO<'a Clega Bay-1962. On file atDepartment of Biolog,". Florida Presb,",terian Colle4!'£'. St. Petersburg. Fla. 33711.
u.s. 'FISH AND WILDLIFE SERVICE
40'
50'
28°N.
27°30'N.
RIVER
HILLSBOROUGH
I I I I II I I I I 1
KILOMETERS6 8 10 12 14
82° 30·W.
-0mZ
Z~
C~
»
z~
m
'"'"»-<
TAMPA
BAY
40'
OF
50'
TREASURE
COREY
G U L F
BLIND BOCA
o t7b:t- '-If <0'
PASS-A-GRILLE CHAN:Ld' ~OCIEGA ~u. 0 Q ~'i\ 0 0
BUNCES PASS~~1{ BAY
M EX leo MULLET
KEYEGMONT CHANNEL
EGMONTGKEY
FIGURE I.-Boca Ciega Bay and Tampa Hay, I!~la.
EFFECTS OF HYDRAULIC DREDGING AND COASTAL DEVELOPMENT IN BOCA CIEGA BAY, FLA. 215
FIGURE 2.-Southem Boca Oiega Bay in 1953 before major bayfill construction (photograph courtesy of Airfiite, St.
Petersburg, Fla.).
hyeen ba.yfills. In addition, four areas of the bay(A, B, C, and D) were sampled in August 1964to estimaJe the bionmss of turtle grass and infauna(figs. 10 and 11). At all sampling stations, water,,-as collected at surface and bottom for physicaland chemical analyses, sediment samples wereobtained for textural and chemical analyses, andbiological collections were made for benthic inyertebrates, plants, and fishes.
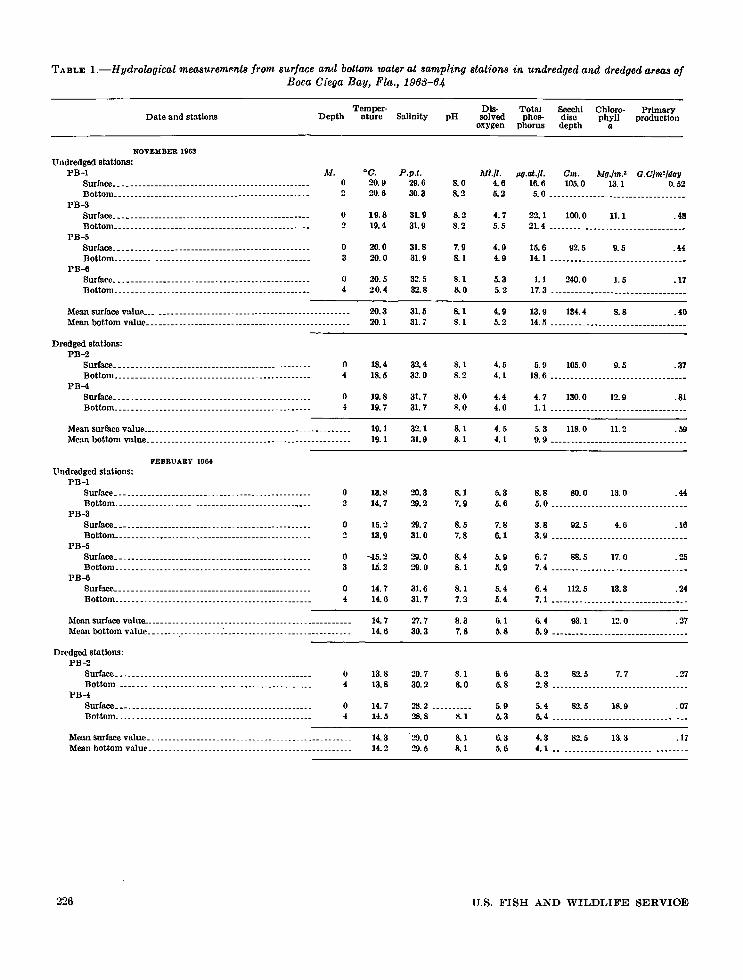
:Measurements were made of water temperature,salinity, pH, total phosphorus, dissolved oxygen,secchi disc depth, chlorophyll 0., and primary production following methods described by Saloman,Finucane, and Kelly (1964)--see table 1. Supple-
216
mental data on water quality were used to showlong-term hydrological changes that have occurredthroughout Tampa Bay as a result of coastal development (tables 2-5). The supplementary dataare from the following published reports and unpublished data of the Bureau of Commercial Fisheries Biological Laboratory, St. Petersburg Beach,Fla.: Odum (1953), Hutton et aI. (1956), Marshall (1856), Finucane and Dragovich (1959,1966), Pomeroy (1960), Dragovich, Finucane, andMay (1961), Saloman et aI. (1964), Dragovich,Kelly, and Finucane (1966), Saloman and Taylor(1868), May and ,Johnson (unpublished data on
U.S. FISH AND WILDLIFE SERVIGE
J!~LGURE 3.-Southern Boca Ciega Bay in 1l>63 showillg Pinellas County Bayway and other b-ayfill areas (photographcourtesy of Airflite, St. Petersburg, Fla.
chlorophyll II and primary productivity)," and thel '.S. 'Weather Bureau (unpublished water tempenvture da,bv for Eg-mont Key)."
Sediments and infaUll<1 ,yere collected with ~t
shol'el in water as deep as 1 m. and with a bucketdredge at greater depths (Taylor, 1955). A subsample of about 500 cc. was withdrawn frolll eachbottom sample for sediment analysis. Each subsample was sealed in a moist. condition and lateranalyzed at Floricht State Unil·ersity.5 Particles ofsand size and larger ,yere separated from silt and
"~Ia.\'. B. Z,. and TAlcius .TohnSOII. Oll file at Bllreau of~Commercial FisherieK Biological Laboratory, St. Petershurg'Heach, Fla. 33i06.
., On file at U.R. W"ather Bureau, Tampa International Airport,Tampa, Fla. 33614.
clay by 'yet sieving through a screen of 52-micronmesh. Material remaining on the sieve was driedand subdivided by use of ~t series of nested screensmounted on a mechanical shaker. The fine fraction that passed the 52-micron mesh was sizedelectronically in a Coulter counter. 6 Clay minerals,yere examined by X-ray diffraction, and chemical analyses were made for carbOlutes, organiccarbon, and organic nitrogen. Stati tical calculations ,yere made by computer and included mean
• Sediment 'UU1!)'s~S were under the direction of H. GrantGoodell, Sedimentological Lallorntorj', Floric!a State Uaiversitj',1'nllal1Hs~e(" J),la. 3230(;.
'I References to trade names in this publication do not imlll)'endorsement of commercial products.
FIGURE 4.-Oentral Boca Oiega Bay near Corey Causeway in 1949 before major bayfill construction (photographcourtesy of Airflite, St. Petersbm'g, Fla.
grain size, standard deviation (sorting), skewness, and kurtosis.
In addition to the collection of bottom organisms taken by shovel and dredge, the epibenthoswas sampled at' all stations by a bottom drag fitted\I'ith fine netting (Taylor, 1965). Infauna was remoyed from sediments in a Tyler No. 24 screenof 30-cm. diameter and 0.701-mm. mesh. To distinguish small specimens from debris, rose bengal dye was added to material concentrated byscreening (Jones, 1961). Ten percent sea-waterForma.lin used to Iix specim,ens was replaced laterby 70 percent isopropanol.
2lH
Fishes were collected at each station \yith eithera 4.8-m. semi-balloon trawl or a 21-m. beach seine.The trawl ,,'as hung with it 3.75-cm. stretch meshbody fitted \yith a, 1.2i5-cm. bag liner. The seine hada stretch mesh of 1.25 em. in the end sections and0.08 em. in the bag. In a-ddition, a 7.5-cm. stretchmesh trammel net, 90 m. x 1.8 m., was fished eachsampling period at the entrance of access canals",here stations \yere located. Fishes, invertebrates,and plants taken in nets and by bottom samplers"'ere sorted, enumerated, and identified. Animalsin each group are not treated in deta,il in thepre:ent. re.port, although some ,1re mentioned because of their prominence in bayfill canals.
u.S. FISH A:-\D WILDLIFE SERVICE
FIGURE G.-Cenlral Boca Ciega Bay ll(~a~' Corey Causeway ill 1063 showing lJayfill areas (photograph courtesy ofAirfii te, St. Petersburg, Fla.).
Quantitative samples for estimates of biomass\yere t,aken in August 1964 \vith a 0.25 m. 2 plugsampler that extracts sediments to a depth of 22.5CIll. (fig. 1:2). In operation, the sa.mpler is pushedinto the sediment and then dug out "'ith a shovelwhich covers the bottom of the sampler and retains the sediment plug. Total weights of plantsand infauna from grass beds were determinedfrom sets of tri plica te sam pIes taken in representa.ti\"e stands of turtle grnss in lower, central, andupper Bora Ciega Bay (areas A, B, and C, fig. 10) .Infallnal l.Jiomass from ullvegetatec1 bottom \\'asdetermined 1'1'0111 a single set of three samples in thecentral part of the bay shoreward of station D-5
in area D (fig. 11). Wet and oven-dried plants andwet \yhole animals were weighed on a MettlerK-7 balance. Dry whole weight of animals wasarbitrarily caJculated at 15 percent of wet whole"'eight because most of the animals in all sampleswere polychaete 'YOI'lTIS, small crustaceans, andsmall mollusks (Sanders, 1956; Thorson, 1957).Large mollusks and crustaceans that appearedsporadically in bottom samples we.re disregardedin calculations of standing crop because of the biasthey would have introducBd. Consequently, figuresfor dry whole weight of animals are conservative,particularIy in lo\yer Boca Ciega Bay (area A),w here the southetn hard-shell clam (111ercenaria
El"FECTS OF HYDRATLIC DREDGTXG Al\D COASTAL DI~VELOP~lENT IX BOCA cmGA BAY, FLA. 219
FIGURE G.-Central Boca Ciega Bay Ileal' Treasure Islund Causeway in 1949 before major bayfill construction (photograph courtesy of Airflite, St. Petersburg, Fla.
cnlllpechien8lS) and pink shrimp (Penaeu8 dtwI'(t}'wn) are aounchl,nt (S~tloll1an, IDol'); Tf1ylor a.ndSaloman, 1067). Biomass estimates of turtle grassare also minimal because the sampler did not collect roots and rhizomes that penetrate sedimentsheyond :2:2.') (·nl. (9 in("hes) .
TEMPERATURE, SALINITY, AND pH
Temperature, salinity, and pH of TIoca CiegaBt1Y are similar ,to those in \\"ater neal' the mouthof Tampa B~1Y because Jand drainage is not apprcl'iallle and {Ol!l' passes lead <lireetly to the Gulf of~Iexi('o. Furthermore, there is little or uo stratification of lI'ater I11Uisses in unprotected parts of the
220
bay because of shallow depths and tidal and winddriven circulation (table 1) .
The most detailed record of water temperatureTor lower Tampa Bay Coomes from daily observat[.ons over 18 years by the U.S. Coast Guard atEgmont Key. The monthly means correspondclosely to means of our wa tcr temperature data for1963-64 aud to means of other records from BocaCiega Bay behyeen 1961 and 1965 (tablcs 1 and2). The range of 'water temperature over shallowfiats, however, is considerably greater than therange of monthly means. For example, Phillips(l!)(iOb) re('orded )In.9° C'. from ,,"wter standingover turtle grass in July 1958, and a low of 4.8 0 C.
{;.8. FISH Ai\'D WILDLIFE SERVICE
FIGURE 7.-Central Booa Ciega Bay near Treasure Island Causeway in 1963 showing bayfill areas (photographcourtesy of Airflite, St. Petersburg, Fla.).
was recorded near shore at Mullet Key on Januftry 31, 1966 (Salonran and Taylor, 1968).
,IVater temperature is usually the same in theopen bay and inbayfill canals, except in winterwhen periodic cold fronts create a temporarythermocline in deep water. At such times, bottomwater may be 4 to 5° C. wanner than surfacewater :and serves asa refuge for polythermal fishes(Kinne, 1963). If cold weather persists for morethan a few days, however, bottom water becomescolel and sequestered fishes may die. During prolonged cold in February 1966, John H. Finucane(unpllblished data)' observed mass mortality
among snook, Oentropomus undeci?nalis (Block),in bayfill canals of Boca Ciega Bay.
Average salinity in Boca Ciega Bay (32 p.p ..t.)approaches that of the nearshore Gulf and is atleast 10 p.p.t. higher than water in northernreaches of Old Tampa Bay and Hillsborough Bay(table 3). Even though the major portion of annual rainfall (127 em.) comes in the summer andfall, seasonal fluctuations of salinity in the lagoonare slight. Appreciable changes occur only in surface water directly south of Lake Seminole Dam
7 Unpublished data (quarterly report) on file, Bureau ofCommerdal Fisherirs BiOlogical Laborato.ry. St. PetersburgBeach, Fla. 33706.
l';FFECTS OF Hl:DRAljL1C DREDGH\G AKD COASTAL DEVELDPMENT IN BOCA CIEGA BAY, FLA. 221
l<'IGURE 8.-Northern Boca Oiega Bay near Johns Pass in 1952 showing first bayfill areas (photograph courtesy ofAirflite, St. Petersburg, Fla.).
itt station PB-1 (fig. 10 and table 1). Stable andrebtively high salinity in Boca Ciega Bay andthe temperate or subtropical witter temperaturefa,vor the occurrence of a large number and diversity of I1mrine plants and animals (Gunter, 1961;Kinne, 1964) .
In thE'~ seil, pH is generally near 8 and remainsstable unless affected by abnormally high photosynthetic acti \'ity, rapid temperature change, oranoxic conditions on the sea fioor (Skirrow, 19(5).In Bocn, Ciega Bay the observed pH range of 7.'2to 8.5 is normal for water of nearly oceiwic salinity(Park, Hood, and Odnrn, 1058; Heid, 10(1).
222
'IVithin any single sampling period pH on the surface and bottom at each station varied no morethan one unit.
OXYGEN
Dn,ytime concentrations of oxygen on the surfaceand bottom of dredged and undredged stations\\-ere at least 3.5 ml./l. in all seasons (table 1). Inmore recent "ark, however, less thitn '2 ml./l. wasrecorded in June and August from bottom witterat a dredged location in the central part of EocitCiega Bay near station PB-4 (Dragovich et al.,10(6). These recent data sho,v that oxygen is re-
r.S. FISH Al\"D WILDLIFE SERVIOE
FIGURE 9.-Northern Boca Oiega Bay near Johns Pass in 1900 showing bayfill areas (photograph courtesy of Airflite.St. Petersburg, Fla.).
duced in summer oveT the soft sediments of accesscanals. Tidal movements in the bay probaNy makesome oxygen ~wailable throughout the watereolumn at most times, but occasional reductionslimit some marine animals (Emery and Stevenson,l!:)57; Reish, 1959).
Elsewhere in Tampa Bay, marked oxygen reduct.ion nea,r the bottom has been recorded only inHillsborough Bay (Saloman et a1., 1964), wherepollution from sewage is heavy, summer water temperat.ure is high, and water circulation is poor.Additional bayfill development in Boca CiegaBay would increase sewage volume, impede watercirculation, and further reduce dissolved oxygen.
PHOSPHORUS AND NITROGENPhosphorus concentration was high in surface
and bottom water at dredged and undredged locations. At dredged locations, bottom concentrationwas generally higher than surface concentration.At undredged locations, however, concentrationdid not vary consistently with water depth (table6). Phosphorus was probably reduced in calm, surface water between finger-fills by deposition ofsorbed phosphates bound to particles of silt andclay (Pomeroy, Smith, [md Grant, 1965).
Nitrogen was not measured in this study, butother data show that it is plentiful in Boca CiegaBay (table4).
EFlmCTS OF HYDRAULIC DREDGING A::\'D COASTAL DEVELOPl\1EN-T I:\T BOCA ClEGA BAY, I<'LA. 223
B LI N D
SKYWAYBRIDGE
KEY
A
7
3
E3I
5 6
PASS-A-GRILLE
E3I I
KILOMETERS3 4
1 2NAUTICAL MILES
OF
JOH NS
GULF
MEXICO
1 2
E3Io
o
FIGURE lO.-Boca Ciega Bay showing station locations (BC and PB series, and biomassstations A, B, and C), baytill areas (Glack), and proposed baytill areas (shaded).
Mean surface value __ . _Mean bottom value __ . . . _
14.314.2
8.18.1
6.35.6
4.3 82.5 13.3 . 174.1 .• ..• _
226 u.s. FJSH AND WILDLIFE SERVIOE
TABLE l.-Hydrologicalmeasurements from surface and bottom water at sampling stations in undredged and dredged areas afBoca C1:ega Bay, Fla., 1963-64--Continued
Date and stationsTemper-
D"pth ature Salinity pHDis·
solvedoxygen
Totalphos·
phorus
Secchidisc
depth
Chloro' Primaryphyll production
a
Mean surface value " . . . __ -------Mean bottom value. . _. • __ .-.-. . ._. __
EF~'EC·.rS O~' HYDRAliLIC DREDGING AND COASTAL DEVELOPMENT IN BOCA CIEGA BAY, FLA. 227
TABLE '2.-Mean monthly surfacc water temperature (DC.) from obserlJations (daily at 0700 hours) ncar Tampa Bay cntrancc(Egmont Key) 1948-65,1 (m£! Boca Ciega Bay (near station PB-4) 1961-65 2
Jan. Feb. Mar. Apr. May June July Aug. Sept. Oet. Nov. Dec.
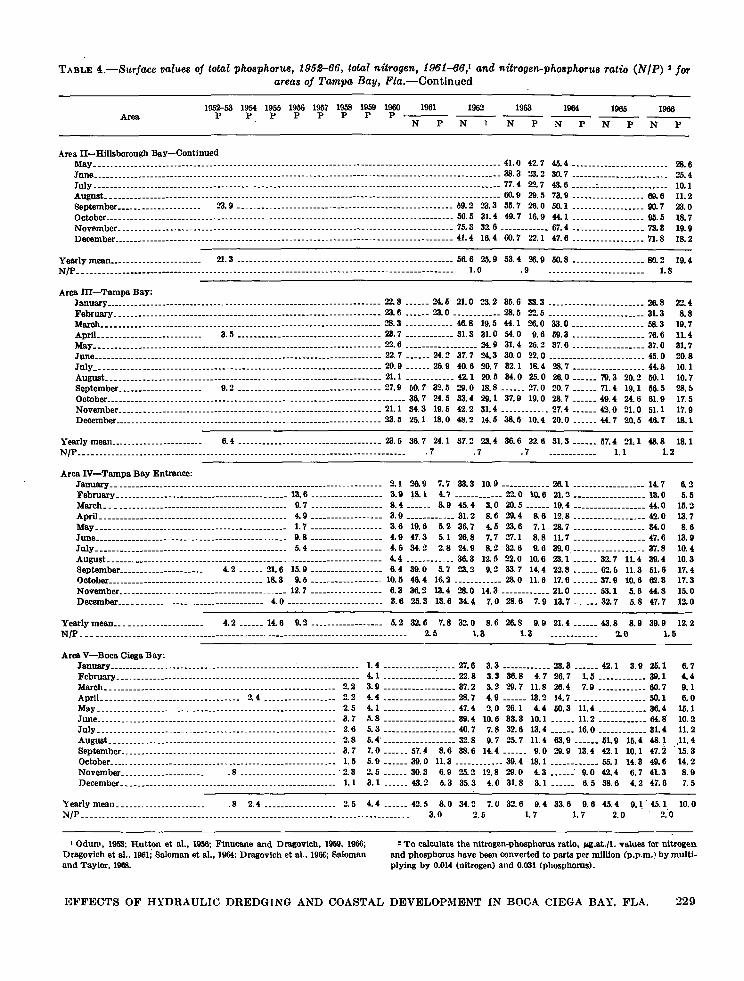
TABLE 4.-Surface values of total phosphorus, 1952--66, total nitrogen, 1961-66,· and nitrogen-phosphorus ratio (NIP) 2 forareas of Tampa Bay, Fla.-Continued
I OduIl', 1953; Hutton et aI., 1956; Finucane and o ragovicb , 1959, 1960;Dragovich et al .. 1961; Saloman et aI., 1964: Dragovich et aI., 196&; Salomanand Taylor, 1968.
• To calculate the nitrogen·phosphorus ratio, ~.at./l. values for nitrogenand phosphorus have been converted to parts per mlllion (p.p,m.) by multiplying by 0.014 (nitrogen) and 0.031 (phosphorus).
EFFECTS OF Hl:DRAULIC DREDGING AND COASTAL DEVELOPMENT IN BOCA CIEGA BAY, FLA. 229
TABLE 5.-Surface values of chlorophyll a (rng./m.3), 1955-66, and primary prodltction (G. Clm.2fday) , 1965-66, for areas ofTamp/;. Bay, Fla.!
TAJILE 5.-Su.rface vahles of chlorophyll a (mg./m..3), 1952-66, and primary production (G. C/m,2fday) , 1962-66, for areasof Ta7npa Bay, Fla. 1-Continued
I Marshall, 1956; Pomeroy, 1960; May and John30n, unpublished data. onfIle at Bureau of Commercial Fisheries Biological Laboratory, St. Petersburg
Compnred wit.h avernge concent.rations of phosphorus and nit.rogen in surface sea wnt.er. BocaCiegn Bay hns about. five t.imes more phosphorusand four times us much nit.rogen (Sverdnlp, John-
Beach, Fla.; Saloman et aI., 1964; Finucane and Dragovich, 1966; Dragovichct aI., 1\166; Saloman and Taylor, 1968.
son, and Fleming, 1942; Armstrong, 1965; Vaccaro, 1965). Even when compared with other estuarine systems of the Atlantic and Gulf Coasts,Bocn Ciega Bay and t.he other areas of TampaBny rank high in these elements (Newcombe andBrust, 1940; 'Williams, 1954; Riley nnd Conover,1956; NcNulty, R.eynolds, and Miller, 1959;Lackey, 1963; l\1ackent.lnm, 1965; Saville, 1966).
Under natural conditions, phosphorus and nitl'Ogen enter Tampa Bay mainly through dischargefrom rivers und springs (Dragovich and May,1962; Dragovieh, Kelly, and Goodell, 1968). Themajor contribution of phosphorus enters Hillsborough Bay t.hrough the Alafia River frommining operations in e.xtensive phosphatic depositse.ast of Tampa. On the basis of water analyses madein the early 1950's phosphonls in Hillsborough
TABLE 5.-Mean total phosphorl/s from surface and bottomwater of lIndredged and dredged sampling stations in BocaCl:ega Ba.y, Fla., 1963-64
FIGURE 12.-BoHom sampler of 'stainless ~teel CO.25 m.")llSM for sampling vegetation and inf-al1na.
Mean . _ 10.2 0.9 5.5 8.2
El!'l!'ECTS lW HYDRAUJ..IC DREDGING AND GOAS'fAL DEVELOPMENT IN BOCA cmGA BAY, FLA. 231
Bay has remaine.d at about its present level since195~ or before (Odum, 1953)-see table 4. In areasof t.he estuary less affected by mining runoff, highconcentrat.ions of phosphorus tUld nit.rogen recorded since t.he early 1960's are due to un increasein industrial" and domest.ic sewage. Population int.he area around Tampa Bay was less than onehalf million in 1950, rose to about three-fourt.hsmillion by 1960, and is now near 1 million. Aspopu1at.io;1 rose, t.he method of sewage disposalwas eonverted from septic ta-nks to treatment pla.nt.in the late 1950's and early 1960's. This chungeint.rodueed treated sewage direc.t1y into all a·reasof the estuary. In Boca Ciega Bay, the mean annual concentration of tot.al phosphorus rose from'2.5 p.g.iI./l. in 1954-58 to 4.4 in 1959, and S by 1961.At. present, tot.a.l phosphorus averil.ges 10 p.g.a./l.and totulnitTogen 45.1 p.g.a,';l., and sewage volume·is about 17 million gallons per day (secondaryt.rea-t.me.nt) from outfalls located throughout t.helagoon. Along wit.h progre.ssive eut.rophicat.ion ofBoca Cieg-a. Ray, eounts of eoliform baderia haverisen so high t.hat shellfishing has been prohibitednear ltll outfalls and in all ,,'aters of the bay northof Pinellas Count.y Bayway (fig. 13)-PinellasCounty Health Department, personal eommunicat.ion.
Relative a.s well as total concent.ration of nitrogen and phosphorus influences t.he oc.cUlTence andabundance of nmrine life (Raymont, 1963). Withinlimit.ing vulues, studies of marine plankton inclieate that growt.h and re.production of ml\rinephytophtnkton are greatest when the ratio of nit.rogen to phosphorus is 10 or higher (Odum, Lackey,Hynes, and Marshal, 1955; Lackey, 1963). In BocaCiega Bay the observed NIP is about 2. The disproport.ionately high .level of phosphorus maylimit kinds and numbers of phytoplankton in thelagoon and perha.ps explu.ins why plankton bloomsare infrequent and planktonic primary productionis not extremely high (Dragovich, Kelly, andKelly, 1965; Romise.fell and Dragovich, 1966;Dragovich and Johnson, 1966).
Attn.ched u.1gae and sea grasses also respond toeutrophy. McNulty (1961) noted an abundance ofGraeiht;ria b1odgett-ii Harvey, other re.d algae, andthe green alga [71v(I. la.et'/tca Linnaeus in Biscayne~ay, Fla., before pollution abatement.. 'Wilkinson'(964) found a direct relation between eutrophication of a New Zeu.lu.nd estuary and marked inerease of two green algae, Ulva. sp. and Ente-ro-
232
morpha sp. He wrote that foul odor of hydrogensulphide was emitted from decny of algal matsand tlmt white paint was turned black on homesnearby. Production of hydrogen sulphide byE-nte1'01norph(7. has also been studied by BnasBecking and Mackay (1956).
Species of flraellal'i<t have been implicated inreport.s of offensive odors arising from Hillsborough Bay (Florida St.nte Board of Health,1964). The Federal Water Pollution Control Administration is now investigating this matter. InBoca Ciega Bay, G1'acila1'ia is present, as are Ulvaand Enf,e·l'o'll/.o?'111w,. We observed windrows ofUl-M. laef,'uea in bayfill access eanals after residentsreported objeetionable odors in t.he cent.ral part. oft.he bay in the spring of 1965. Further nutrifi.cation of TIoea Ciega Bay would lnere~tse growth ofthese and perhaps other filament.ous algae tha,tbecome fetid as t.hey decompose.
TURBIDITY
Data from 1963-64 show that secehi discs werevisible to depths greater than 150 em. only insouthern Boca Ciega Bay (PB-6), weH away frombayfill deve10pment.s (table 1). HeTe., average lightt.ransmission t.hrough t.he water eolumn is 53 percent of ineident. radiation at. about 40 cm. beneaththe surfnee (Saloman et al, 1964). In cont.rast,water in the open bay neaTer bayfills is turbid.'Vithin protected waters of access cnnals, however,t.ransparency approllehes that. of the lower bay.For example, a.verage mont.h1y light t.ransmissionIII one eanal was 45 percent at 40 em. (Saloman etld., 1964). Even so, canal bottoms are far too deept.o receive light required for the. growt.h of seagrass.
Mueh of the silt and clay rnised by dredgingwill event.ually be removed from eirculati,on in thelagoon by biological fixation and tidal ti'ansport(Dapples, H142; Ginsburg and Lowenstam, 1958;Van St.ratten and Kuenen, 1958; Phillips, 1960a;Lyntz, 1966) .. Until water is clarified by t.hese processes, turbidity will continue to limit biologicalproducfion in central and northern pnrt.s of BocaCiegaBay.. .
CHLOROPHYLL A AND PRIMARYPRODUCTION
Nei·thE'r I:hlol'ophyll a nor·rute of pltlllktol1ieprimary production· differed consistently in
U.S. FISH AND WILDLIFE SERVIOE
TAMPA BAY
I!'IGURE l3.-Approximate seWl'r outfall location", and dischargl' volume", (sl'rondarytreat.ml'nt I in Boca Cil'ga Bay. I!'la. 1966.
]~I<'I<'ECTS 01<' HYDRAULIC DREDGING AND COASTAL Dl';VEIJOPMENT IN BOCA emGA BAY. I<'LA. 233
dredged and undredged locations. Chlorophyll ((.did not. fluct.uat.e seasonally. Low primary production noted in February may be due to t.urbid condit.ions rather t.han lack of nutrient.s or limitationby anot,her factor, such as temperature (t.able 1).Except for higher values in extremely eutrophicHillsborough Bay, pigment and production figures(ta.ble 5) are· both simila.r t.o those recorded forother areas of the estuary as well as other estuarine waters of the southeast (Ragot.zkie; 1959;Odum and Wilson, 1962; vVilliams, Murdock, andThomas, 1966; Saville, 1966; Dragovich and Johnson, 1966).
In 1962-66, mean chlorophyll (l. in Bac.a Ciega.Bay was 8.6 mg./m.3 and mean primary product.ion by phytoplankton was 0.40 G.C/m.2/day. Themost extensive data for chlorophyll a and primaryproduotion in BocIL Ciega Bay are from dailyobservat.ions by May and Johnson 8 bet.ween June1962 and June 1964 (table 5). These figures showa slightly lower mean annual value for chlorophyll a (7.3 mg./m.3 ) but. the same value for meanannual product.ion (0.40 G.C/m.2/day). Earlierdat.a indicat.e about a twofold rise in chlorophyll((. since 1952, following nutrificat.ion of the lagoonby sewage (table 5) .
Actually, the productivit.y figures given abovefor Boca Ciega Bay are misleading and far toolow because sea grasses and unicellular and filamentous benthic algae add t.o the production thatwas recorded only for phytoplankton. Pomeroy(1960), who considered photosynthet.ic contributions by all hydrophytes in his study of primaryproduction in lower Boca Ciega Bay, condudedthat an average value is about 5 G.02/m,2/day.Odum and Hoskin (1958) gave a value of about5 grams of dry organic material per day. On thebasis of an allowance of 0.5 G. of C for each gramof organic matter produced (May, 1966), this isequivalent to about 2.5 G.C/m.2jday or nearlysix times the estimates of daily production in thelagoon by phytoplankton alone. The main pointto be made is that under natural condit.ions primary product.ion from a variety of photosynthetict.axa far exceeds production in turbid waters wherephotosynthetic activity of benthic flora has beenreduced or eliminated (Blinks, 1955; Odum,McConnell, and Abbott, 1958; Pomeroy, 1959).
S See footnote 3.
234
SEDIMENTS
Sediments of Tampa Bay are mainly a firm mixture of sand and shell containing little silt or clay(Goodell and Gorsline, 1961). Soft. deposits arelocnJized in upper reaches of Old Tampa Bay,Hillsborough Bay, natural depressions, anddredged bottom of bayfill access canals, where theweight percentage of silts and days may exceed90 percent. In Boclt Ciega Bay the sediments inundredged areas ltveraged 94 percent sand andshell whereas the sediments in dredged canalsavern,ged 92 percent silt and clay (table 7) .
The ooze measured in two dredged pockets between bayfill fingers extended downward to adepth of about 3.6 m. The upper 30 em. was dark,semifluid, and sulphurous; below was an unconsolidated horizon of gray clay. The predominantlyorganic upper laye.r consists of decomposing detritus that accumulates in the. canals. The origin ofthe underlying clay has not been determined, butit seems likely that It thick stratum of clay wasuncove.red in the dredging which extended somedistance below a bay floor veneer of &'tnd and shell.To judge from the uniformity of the viscous claylaye.r, this material was redeposited after dredgingceased and now lies too deep to be reworked bynormal water movements. Clay settles out of suspension slowly and may form deposits to 364 m.or more beyond dredging sites (Phillips, 1960a;Mackin, 1961; Hellier and Komicker, 1962; Odum,1963; 'Voodburn, 1965). Thus, resident benthosfar from fiU and borrow are:.1S may be suffocatedby sedimentation from dredging oper-ations.
MACROBIOTA
Analysis of biological samples in Boca CiegaBay supplements earlie.r studies in undredgedareas and eontrasts these findings with a. s~arcityof macrobiota found in bayfill canals.
DIVERSITY AND ABUNDANCE
In the first comprehensive survey of Boca CiegaBay, Hutton et al. (1956) recorded nearly 200plant and animal species from marine and tidewater communities and presented fishery statisticsthat attest to the importance of commercial andsport species. Later a notable addition was made
u.s. FISH AND WILDLIFE SERVICE
to the list of algal speeies by Phillips (1960b);Springer and 'Woodburn (1960) brought the listof fishes from Tampa Bay up t.o 108; and unpublished work by Bullock and Boss 9 increased therecorded 1ll1luber of mollusks in BO(~IL Ciega Ihyfrom 30 -to 175. Nea.rly 700 species of marine plantsand animals lUI \'e been identified from our sampling i.n 1~)('i:3-fi4 and from other work in the area.Among the major taxa are about 180 spedes ofmollusks, 120 polycha.et.e worms, (:iO decapod crusta.ceans, 20 e.chinode.rms, 110 fishes, and 200 .plants.·
Comparative records show that stations insidedeeply dredged canals contnin less than 20 percentof the spedes we recorded for the bay. If fishes
• 'See footnote 2.
are excluded from the species total, ne.arly 100 percent of the organisms recorded come from collections made outside dredged areas. Invertebratescollected in hayfill canals consisted of only a fewpolychaete worms, mollusks, blue erabs, -and pinkshrimp. "Te conelude, therefore, that. soft. depositsin the cann.ls are in some way unsuitable for mostbobt.om inyertebrates found in other areas of thebn,y. Thorson (1957) and obhers have demonstratedthat larvae of many benthie forms are sensitive tosediment composit.ion and will not metamorphosefrom a .plankt.onic stnge until conta.ct. is made withsuitable bottom. In 10 yelLrs, recolonization ofcanal sediments has been negligible and it appearsdoubtful that soft sediments of bayfill canals will
TABLE 7.-Comparison of sediments atltnclredged and dredged sfat-ions in Boca Ct:ega Ba·y, Fla. (1.963-64), show-ing depth,mean grain size, percentage of {hell and sand by weight (particle size <4 0), percentage of silt and clay by weight(particle size >4 qJ), and percentage of fotal carbon by weight
Stiltion Depth Mean grain sizePercentage ofshell and sand
I The phi unit is a logarithmic transformation of '.he Wentworth gradescale of pilrticlc size (Krumbcin and Pettijohn. 1938).
'Berm (If canal not included in calculation of mean.3 Transitional bottom not included In'calculation of mean.
EFFI'~CTS OF HYDR.U;J,TC DRI,mGING AND OOASTAL DEVELOPMENT IN BOCA cmGA BAY. I!'LA. 235
ever support. a. rich or diverse. infaunn. The existence of soft sediments does not necessarily precludet.he presence of a dive-rse and abunda.nt bottomfltunn (Barna.rd and Hartma.n, 1959; Sanders,1960), but. where sediments a.re 'highly organic,deposit.ion rapid, and dissolved oxygen low, t.hebenthos is likely to be impove.rished (PraM" 1953;RadE'r, 1954; Reish, 1959: McNulty, 'Vorl\:, andMoore, 1962; McNulty, 1966).
Fort.y-nine speeies of fishes were. eaught a.t stnt.ions in dre.dged canals. None were demersal, andthe ahsencE'. of this t.ype of fish in the cat.eh may bedue to 1:l('k of food organisms on and in bottomdeposit,s. In l'ontrast, 80 species of fish were colIE'ded at. stations outside. ba.yfill canals. Eventhough waters in the open hay aceounted for agreater number of fish species, 30 perce.nt. more fishWE're netted within dredged canals. One species, thehay anchO\'y, !.Lnehoa. m,itch:i71i (Va.le.nciennes),was most common in t.he canal catch but. the Cubananchovy, A11clwa. ell-barn(t (Poey), amI the scaledsardine, HI(/'t~ngtlla. pe·lw'.cola~ (Goode &. Be.an),were aIso ahundn.nt.
BIOMASS AND PRODUCTION
The major bent.hic habit.ats in Bocn. Ciega Bn.yare turtle grass beds, unvegetated bottom, andoyste.r reE'fs. All contn.in large numbe.rs of species,but the grass bed community is outst.n.nding beea·use it is widespread and highly produetive.
Extensive beds of turtle grass now exist onlysouth and east. of t.he Pine.Jlas County Bayway(fig. 1), Poorer stands a·re located in central andnorthel'll pa.rts of t.he bay, but only ill very shallowwater. Representative beds were sampled t.o compare standing erop in the relatively undisturbedsouthern seetion of the bay (a.rea. A) with thatin extensively dre,dged central (area B) andnort.hern (n.rea. C) sections (fig. 10). Dry wholeweight. of t.urtle grass in areas A, B, and C averaged I,HIS, 1,008, and 320 g./m.\ respectively.The figure for area C agrees with other biomassestimates of turtle grass in the Gulf of Mexico, butvalues from areas A and B are two to t.hree timesgt'eatN' (Phillips, 1960a; Odum, 1963). Maximumdevelopment. of turtle grass probably occurs in t.heCaribbean where Burkholder, Burkholde.r, andRivero (19;j!)) have obsel'\'ed stll.nds having a biomass of 2,800 g./nl.~ dry weight.
236
Pomeroy (1900) reported an avern.ge biomass ofabout. 81 g./m.:! for turtle grass sampled randomlyalong-a tra.nsed, across lower Doell, Ciega. Bay. Thisfigure seems low, but. no doubt. inc.ludes vn.lues fromsamples in some sparsely vegetated areas. Sinceba.yfills cover ba.n~ and veget,ated hot.tom, 80 g./m.~ is proba.bly n reasonable faetor for calculatingtot.a1 biomass of turtle grass that. has been coveredby bayfills in Hoea Ciegl1 Bay. Using 1,400 heetaTes (3,500 ac.res) as the filled are·a of the ba.y, wecompute that stn,nding crop of t.urtle grass buriedby filling is at least 1,13~ metric tons. If the areaof bayfill eanals and other borrow aTe.as were ineluded in this ealculation, the figure would benearly doubled.
Our estimate of t.otal primary production inBoca Ciega Bay is based on work by Pomeroy(1960) and studies in vegetated Texas bays byHellier (1962) and Odum and Wilson (1962). Anaverage production figure would be a.bout 5 G.02 /
m,2/day (ca. 2.5 G.C/m,2/day) whieh is roughlyequivalent to 18~206 kg./ha./yr. (16,243 Ibs./acre/yr.) of dry organic material or an annual loss ofabout 25,841 metric tons (28,425 tons) for the1,400 hectm;es (3,500 acres) of the bay now filled.
No quantitative study has been made of biomassof animals living among blades of turtle grass,although Moore (1963) and Stephens (1966) estimated the abundance of small invertebrates, anddrop-net. samples in Texas bays gave data on somelarger invertebrates and fishes (Hellier, 1958,1962; Jones, Ogletree, Thompson, and Klenniken,1963). The drop-net studies gave a mean annualstanding crop of about 15 g./m.2 wet weight (3 g./m.2 dry weight-20 pereent of wet weight) (Vinogradov, 1953). Annual fish production is alsoabout 3 g./m.2 in Texas ba.ys or about. 30 kg./ha,;yr.(2i lbs./acre/yr.) (He.Ilier, 1962). This figure isbelow an estimate by Sykes (1963) for fishery produetion in Gulf estuaries (52 kg./ha./yr., or 46lbs./aere/yr.). Using Sykes' est.imate., we caleulatethat filling of 1,400 hectares (3,500 ael'es) has l'educed fishery production in Roc,a Ciega Bay by 73metric tons (80 tons) per year.
Biomass of il1\'ertebrate. infa.una living amongroots and rhizomes of turtle. grass was enlcuInted
. from wet whole weight of anima-Is reeovered bysieving 0.25 m.2 plug samples collec.t.ed in moeas~c\, B, and C. At. area D, t.he. infauna. biomass wasdetermined in the same manner for unvegetated
U.S. FISH AND WILDLIFE SERVIOE
bottom (fig. 10). Melln wet weights of infauna inareas A, B, C, and D were 912, 560, 128, and 80g./m.2
, respectively. Thus, the density of sea grassand abundance of infauna were posit.ively correlated. If 85 percent of wet whole weight is weightof contained water and inert structures, dryweight of infauna from luxuriant bE.'ds of turtlegrass in t.he lower bay was about 137 g./m.2 Thisfigure is high in comparison with other biomassfigure.s for estuarinE.'. wat.('.rs (Sanders, Goudsmit,Mills, and Hampson, 1962). Bayfills in BocaC.eiga Bay have reduced the staliding crop of bot-
. t.om invertebrates by about l,812met.ric tons (1,993tons) -eaIeulated from re18ltively low infaunalbiomass of area C.
Figures for the annual produet.ion of infaunaare much highE.'r. SandE.'rs (1956) estimated infaunal production n.t. two to five times the standingerop and indicntE.'d that the larger factor verylikely applied in t.ropical situations. We arbitrarily selected four as a multiplier, and calculated infaunal production in the best stands of turtle grassat about 548 g./Ill.2
/ yr. (5,466 kg./ha./yr., or 4,877Ibs./aere/yr. dry weight.). Even in poor grass bedsat area C infaunal production would be about 768kg./ha./yr. or 685 Ibs./aere!yi·. This figure multiplied by the 1,400 heetares (3,500 ac.l'es) now inbayfills puts the loss of inbunal production atabout 1,091 metric tons (1,200 tons/yr.). If morE.'refined collecting had been done (screening at lessthan O.701-nun. mesh), the addition of biomasfrom meiobenthos would have added considerablyto the figures reported for maerobenthos alone, andthe annual produetion of Illeiobenthos would verylikely be equivalent or somewhat greater than theestimate for maerobenthos (Weiser, 1960; Melntyl'e, 1964).
ESTUARINE EVALUATION
Products and other values provided by the Nation's tidewaters are so numerous and diverse thattheir true worth is difficult to eompute. Nonetheless, a number of attempts have been made to estimate the cash value of estuarine aereage. In thenortheast, notable contributions WeI'e made byShuster (1959) ; Fogg (1964) ; J~rome, Chesmor;.,Anderson, and Grice (1965) ; Jerome, Chesmore,and Anderson (1966) ; and Cain (1966). Pertinentdetails of estuarine evaluations along the Gulf of
Mexico were abstracted and annotated by Woodburn (1965).
On the basis of these estimates, we conclude thatfishery production ~lone in Tampa Bay estuaryhas an annual value of about $741/ha. ($300/aere).In addition, these waters are used by publieut·ili:ties, industry, and comlllE.'.rce and serve reerE.'.ational requirements of nE.'arly a million residents 10
and 1~ million annual vaeationers.u Hence, totalworth of eaeh water acre in' the E.'stuary can beconservatively estimated at $988/ha. ($400/ac.re)per year. At this rate, the 1,400 hectares (3,500~l'eS) covered by bayfills in Boca Ciega Bay represent an annual loss of about $1.40 million, whiehif eapitalized l1t 6 percE.'llt would total a. naturalinvestment of $23.3 million. This accopnting is notcomplete becauSE.' the undesirable aspE.'cts of eoastaldevelopment extend well bE.'yond bulkheads andoutfalls.
LITERATURE CITED
ALLEN. DONALD M.1963. Shrimp farming. U.S. Fish Wildl. Serv.. Fish.
Leafl. 551. S pp.ARMSTRONG, F. A. J.
1965. Phosphorus. In J. P. Riley and G. Skirrow(editors), Chemical oceanography 1. pp. 323-864.Academic Press, Inc., London.
ARNOLD. E. L.. JR.1967. Man's alteration of estuaries by dredging and
filling a grave threat to marine resources. Proc.Southeast. Game Fish Comm., 18th Amitl. Sess., pp.269-273.
BAAS BECKING. L. G. M.. and l\1. MACKAY.1956. Biological processes in the estuarine environ
ment. Va. .The influence of E1itet"n1orpha uponits environment. Kon. Ned. Akad. Wetensch. Proc.Ser. B Phys. Sci. 59: 109-123.
BADER. RICHARD G.1954. Role of organic matter in determining distribu
tion of pelecypods in "marine sediment$. J. Mar.Res. 13: 32-47.
BARNARD, J. LAURENS. and OLGA HARTM"AN.1959. The sea bottom off Santa Barbara. C!llifornia :
Biomass and community structure. Pac. Nat. 1(16) : 1-16.
BLINKS. L. R.1955. Photosynthesis and productivity of littoral
marine algae. J. Mar. Res. 14: 363-373.BONEY, A. D.
1965; Aspects of the biology of the seaweeds of economic importance. In F. S. Russell (editor), Advances in marine biology. vol. 3. pp. 105-253. Academic Press, Inc., London.
,. Tampa data.. Gl'ente-r Tampa Chamber of Commerce. Tampa.Fla.
U'St. Petersburg Times. July 19, 1966.
EFFECTS OF HYDRAULIC DREDGING AND OOASTAL DEVELOPMENT IN BOCA CIEGA BAY, FLA.
BRUUN, PER, and JOHN M. DE GROVE.1959. Bayfill and bulkhead line problems-engineer
ing and management consideratIons. Public Admin. Clearing Serv.. Univ. Fla. Stud. Public Admin.18. iv + 35 pp.
BURKHOLDER. PAUL R.. LILLIAN M. BURI(HOLDER, and JUANA. RIVERO.
1959: Some chemical constituents of turtle grass.Thalassia. tcstudinum. Bull. Torrey Bot. Club86: 88-93.
CAIN. STANLEY A.1966. Estuaries: A neglected resource complex.
Commer. Fish. Rev. 28(10) : 27--34.CALDWELL. LYNTON K.
1966. Problems of applied ecology-perceptions, institutions. methods. and operational tools. BioScience 16: 524-527.
DAPPLES, E. C.1942. The effect of macro-organisms upon near
shore marine sediments. J. Sediment. Petrol.12: 118-126.
DAVIS. JOHN H.1956. Influences of man upon coast lines. In W. L.
Thomas, Jr. (editor), Man's role in changing theface of the earth. pp. 5<»-521. Univ. Chicago Press.Chicago, Ill.
DRAGOVICH. ALEXANDER. JOHN H. FINUCANE, and BILLIEZ. MAY.
1961. Counts of red tide organisms. GymnodinJrl-»r,bre'l'e. and associated ocea;nographic data fromFlorida west coast. 1957-59. U.S. Fish Wildl. Sen..Spec. Sci. Rep. Fish. 369. iii + 175 pp.
DRAGOVICH, ALEXANDER. and LUCIUS JOHNSON, JR.1966. Chemical environment project. In Report of
the Bureau of Commercial Fisheries Biological Station, St. Petersburg Beach. Florida, fiscal year 1965.l>P. 16--17. U.S. Fish Wildl. Serv.. Cire. 242.
DRAGOVICH, ALEXANDER, and JOHN A. KELLY, JR.1964. Ecological observations of macro-invertebrates
in Tampa Bay, Florida 1961-1962. Bull. Mar. Sci.Gulf Garibbean 14: 74--102.
DRAGOVICH, ALEXANDER, JOHN A. KELLY, JR., and JOHN H.FINUCANE.
1966. Oceanographic observations of Tampa Bay,Charlotte Harbor, Pine Island Sound, Florida, andadjacent waters of the Gulf of Mexico, Ft>bruary1964 through February 1965. U.S. Fish Wildl.Serv., Data Rep. 13, ii + 72 pp. on 2 microfiches.
DRAGOVICH. ALEXANDER, JOHN A. KELLY, JR., amI H. GRANTGOODELL.
1968. Hydrological and biological characteristics ofFlorida's Wl'st coast tributaries. U.S. Fish Wildl.Serv., Fish. Bull. 66: 463-477.
DRAGOVICH. ALEXANDER, JOHN A. KELLY. JR.. and ROBERTD. KELLY.
1965. Red water bloom of a dinoflagellate in Hillsborough Bay. Flo l' ida. Nature (London)207(5002') : 1209-1210.
238
DRAGOVICH. ALEXANDER. and BILLIE Z. MAY.1962. Hydrological characteristics of Tampa Bay
tributaries. U.S. Fish Wild!. Serv.. Fish. Bull.62: 168--176.
EMERY. K. 0., and R. E. STEVENSON.1957. Estuaries and lagoons. I. Physical and chem
ical characteristics. In J. W. Hedgl>l'th (editor).Treatise on marine ecology and paleoecology I,Ecology. pp. 673-693. Geol. Soc. Amer. Mem. 67,New York.
FINUCANE, JOHN H .. and ALEXANDER DRAGOVICH.1959. Counts of red tide organisms, Gyrnnodinillln
bret'e, and associated oceanographic data fromFlorida west coast. UI54-57. U.S. Fish Wildl.Serv.. Spec. Sci. Rep. Fish. 289, iv + 220 pp.
1966. Hydrographic observations in Tampa Bay.Florida, and the adjacent Gulf of Mexico-1963.U.S. Fish Wild!. Serv.. Data Rep. 14. ii + 81 pp. on2 microfiches.
FLORIDA STATE BOARD OF HEALTH.1964. A study of the causes of obnoxious odors Hills
borough Bay, Hillsborough County. Florida. Fla.State Board Health, Bur. Sanit. Eng., Jacksonville.Fla.. 7 pp. + 5 plates.
FOGG, FORREST F.1964. Salt marshes of New Hampshire-its past, pres
ent and future evaluation. New Hampshire Fish'and Game Dep.. 24 pp.
GILMOUR. A. J.1965. The implications of industrial development on
the ecology of a marine estuary, 11 pp. Fish. Contrib. 20. Fish. Wildl. Dep., Victoria, Australia.
GINSBURG. RORERT N., and HEINZ A. LOWE~STAM.1958. The influence of marinl' bottom communities
on the depositional environment of sediments. J.Geol. 66: 310--318.
GOODELL, H. G.• and D. S. GORSLINE.1961. A sedimentologic study of Tampa Bay, Florida.
Rt>p. Int. Geol. Congr.. XXI Sess.. Norden. 1960.Pt. XXIII, pp. 75-88. Int.. Ass. Sediment... Copenhagen, 1961.
GRESHAM. GRITS.1967. MarcQ Island model for developers, shovels.
and bulldozers. Nat. Wildl. 5(2) : 4-9.GUNTER. GORDON.
1961. Some relations of estuarine organisms to salinity. Limnol. Oceanogr. 6: 182-190.
HELLIER, THOMAS R., JR.1958. The drop-net quadrat, a new population sam
pling dt>vice. Publ. Inst.. Mar. Sci.. Uni". Tl'x.5: 16.5-168.
196'2. Fish production and biomass studies in relation to photosynthesis in the Laguna Ma<lre ofTexas. Pub!. Inst. Mal'. 'Sci.. Univ. Tex. 8: 1-22.
HELLIER. THOMAS Ro, JR.. and LOUIS S. KORNICKER.1962. Sedimentation from a hydraulic dredge in a
hay. Publ. Inst. Mar. Sci.. Univ. 'rex. 8: 212-215.HORNIG. DONALD F. (CHAIRMAN).
1966. Effective use of the sea. Rep. Panel Oceanogr., President's Sci. Adv. Comm. U.S. Government Printing Off.. Wash., D.C.. xv + 144 pp.
U.S. FISH AND WILDLIFE SERVICE
HlTMM, HABOLD J.1956. Se-agrassl'S of the northenl Gulf Coast. Bul!.
Mar. Sci. 'Gulf Oaribb€'an 6: 305--308.HUTTON. ROBERT F.
HUTTON, RoBERT F .. BONNIE ELDRED, KENNETH D. WOODBURN. and ROBERT M. INGLE.
1956. The ecology of Boca Ciega Bay with sl>€'cialreference to dredging and filling opt>rations. Fla.State Board Conserv. T€'eh. 81"1'. 17, pt. 1. 87 pp.
JEROME. \VILLIAM 0., JR., ARTHUR P. CHESMORE, andOHARLES O. ANDERSON, JR.
1966. A study of the marine resoUl"C€'S of QuincyBay. Commonw. Mai!'s.. Div. Mal'. Fish.. Dep.Natm'. Res.. Monogr. 81"1'. 2, iii + 62 pp.
JEROME. \VILLIAM 0., JR., ARTHUR P. CHESMORE.CHARLES O. ANDERSON, JR.. and F. GRICE.
1965. A study of the marine resourC€'s of the- Merrimac River estuary. ComlllOnw. Mass., Div. Mar.Fish., Dep. Natur. Rei!'.. Monogr. Se-r. 1. iii + 90 I>P·
JONES. MEREDITH L.1961. A quantitative evaluation of the- benthic fauna
off Point Richmond. Oalifonlia. Univ. Oalif. Publ.in Zool. 67: 210-320.
JONES. ROBERT S.. \VILLIAM B. OGLETREE. JOHN H.THOMPSON, JR.. and CUR. WM. F. KLENNIKEN. USN.
1963. He-licopter borne l>urse ne-t for populationsampling of shallow marine- bays. 'Pub!. Inst. Mar.Sci., Univ. Tex. 9: 1~.
KIDD, \VILLIAlII R.1963. Florida outdoor recre-ation at. the crossroads.
Gove-rnor's Committee on Recre-ational Developme-nt. Tallahassee. Fla., 36 pp.
KINNE. O.1963. The effects of t.emperature and salinit.y on
marine and brackish wat.er animals. I. Temperature-. In H. Barnl'S (roitor), Oceanography andmarine biology, an annual review I, pp. 301-340.George Allen and Unwin. Ltd., London.
19&1. The effects of te-mperature and salinity onmarine and brackish wate-r animals. II. Salinity1111(1 temperature---salinity combinations. In H.Barnes (editor). Oceanogral>hy llnd marine biology- an annual review. 2. pp. 281-339. George Allenand Unwin, Ltd.. London.
KRUMBEIN. W. C.. llnd F. ,J. PETTIJOHN.1938. Manual of sedimentary petrography, x + 549
pp. Appleton-Century-Croft!l. Inc.. New York.LACKEY. JAMES II.
1963. The microbiology of a Long Island Bay in thesummer of 1961. Int. Re-v. Hydrobi'Ol. 4.S: 577-601.
LIVINGSTONE, ROBERT, JR.196-5. A preliminary ,bi,bliography with KWIC index
on the ecology of estuaries all(l ('oastal areas ofthe e-astern United States. U.S. Fish Wild!. Serv.•Spee. Sci. Rep. Fish. 507. iii + 352pp.
LOOSANOFF, VICTOR L.. and HARRY G. DAVIS.196.3. Rearing of bivlllve mollusks. In. J!'. S. Russell
LYLES, CHARLES H.1966. Fishery statistics of the United States. 1964
U.S. Fish Wild!. Serv., 'Stat. Dig. 68, 541 pp.LYNTZ, GEORGE W.
1966. Relationship of sediment-size distribution ·toecologic factors in Buttonwood Sound. Florida Bay.J. Sediment. Petrol. 36(1) : 66-74.
MACKENTHUN, KENNETH M.1965. Nitrogen and phosphorus in water-an anno
ta ted selectpcl bi'bliography of their biological effects. U.S. Public Health Serv. Publ. 1305.xxviii + 111 pp.
MACKIN, JOHN G.1961. Canal dredging and silting in Louisiana bays.
PubI. Inst. Mar. 'Sci.. Univ. Te-x. 7: 262--314.1\:IARGALEF. RAMON.
1963. On certa.in unifying principles in ecology.Amer. -Natur. 97(897) : 357--374.
MARSHALL. NELSON.1956. Chlorophyll a· in the phytoplankton in coastal
waters of the eastern Gulf of 1\:Iexico. ,J. ·Mar. Res.15: 14--32.
MAY, BILLIE Z.1966. Chemical e-nvironment. project. In Report of
the Bm'eau of Oommercial Fisheries Biological 'Station. 'St. Pet.ersburg Beach. Florida, fiscal years1962~4. pp.15-17. U.s. Fish Wildl. Serv.. eirc. 239.
McINTYRE. A. D.1964. Meiobenthos of sub-littoral muds. J. Mar.
BioI. Ass. U.K. 44: 665-674.McNULTY. J. KNEELAND.
1961. Ecological effects of sewage pollution in Biscayne Bay. Florida: sediments and t.he distributionof 'benthic and fouling macro-organisms. Bull. Mar.Sci. -Gulf Cari'bbean 11: 394-+17.
1966. Recovery of Biscayne- Bay from pollution.Ph.D. thesis. Univ. Miami. 192 'PP. Univ. Microfilms, Ann Arbor, Mit-h. «. Order No. 66-13,(06),
McNULTY. J. KNEELAND, ERNEST S. REYNOLDS, amI SIGMUND 1\:1. MILLER.
1959. Ecological effects of sewage pollution in Biseayne Bay. Florida: distribution of coliform'bacteria. chemical nutrients, amI volumes of zooplankton. In C. M. Tarzwell (compiler). Biologicalproblems in water pollution. pp. 189-202. Trans.Second Seminar BioI. Prob!. Water Pollut. heldApr. 20-24. 1959 at Cincinnati. Ohio.
McNULTY, J. KNEELAND. ROBERT C. WORK, and HILARYB. MOORE.
1962. -Some relationships between the infauna of thelevel ·bottom and the sediment in south Florida..Bull. Mar. Sci. Gulf Cari'bbean 12: 322--332.
:\iOORE. DONALD R.Hlf'o.3. Distribution ,)f seagrass, TllO·1u88-ia., in the
United States. Bull. Mar. Sci. Gulf Caribbean 13:329--342.
NEWCOMBE. CURTIS L., and H. I'. BRUST.1940. Variations in the phosphorus rontent of estu
arine waters of the Chesapeake Bay near SolomonsIsland. Maryland. J. Mal'. Res. 3: 76-88.
EFFECTS OI<' HYDRAULIC DREDGING AND OOASTAL DEVEL')PMENT IN BOCA CIEGA BAY, FLA. 259
ODUM. EUGENE P.1961. The role of tidal marshes in estuarine produc
tion. N.Y. State Conserv. I)e.P.. Div. Conserv.Educ.• Leail. 2546. 4 pp.
ODUM, BOWARD T.1953. Dissolved phosphorus in Florida waters. Fla.
Geol. Surv. Rep. Invest. 9, pt. I: Miscellaneousstudies, pp. 1-40.
1963. Productivity measurements in Texas turtlegrass and the effects of dredging an intracoastalchannel. Publ. Inst. Mar. Sci., Univ. Tex. 9 : 48-58.
ODUM. HOWARD T .. and CHARLES M. HOSKIN.1958. Comparative studies on the metabolism of ma
rine waters. Publ. Inst. Mar. Sci.. Univ. Tex. 5:16-46.
ODUM, HOWARD T .. J. B. LACKEY, JACQUELINE HYNES, andNELSON MARSHAL.
1955. Some red tide characteristics during 19521954. Bull. Mar. Sci. Gulf Caribbean 5: 247-258.
ODUM. HOWARD T .• WILLIAM MCCONNELL, and WALTERABBOTT.
1958. The chlorophyll "A" of communities. Publ.Inst. Mar. Sci.. Univ. Tex. 5: 65-96.
ODUM. HOWARD T .. and RONALD F. WIT.SON.1962. Further studies on reaeration and metabolism
of Texas ·bays, 1958-1960. Publ. Inst. Mar. Sci..Univ. Tex. S: 23-55.
O·GowER. A. K.. and .J. W. WACASEY.1967. Animal communities associated with Tlialas
sia, Dipl.lllltllera., and sand' beds in Biscayne Bay.I. Analysis of communities hi relation to watermovements. Bull. Mar. Sci. 17: 175-210.
OLSON, F. C. W.1953. Tampa Ba:\, studies. Fla:' State Univ.Oceanogr. Inl;lt. Rep. 1, Contr. 19.27 pp.
OLSON, F. C. W., and JOHN B. MORRILL. JR.1955. Literature survey of the Tampa Bay area.
Fla. State Univ. Oceanogr. Inst.. 66 pp.PARK, KILHO, DONALD W. HOOD, and HOWARD T. ODUM.
1958. Diurnal pH variation in Texas bays. and itsapplication to primary production estimation.Publ. Inst. Mar. Sci.. Univ. Tex. 5: 47-64.
PHILLIPS. RONALD C.1960a. Observations on the ecoiogy and distl"ibution
of the Florida seagrasses. Fla. State Board Con'servo Mar. Lab. Prof. Pap. Se-r. 2. iv + 72 pp..
1960b. Ecology and distribution of marine algaefound in Tampa Bay. Boca Ciega Bay and atTarpon Springs, Floridn. Qunrt. J. Fla. Acad.Sci. 23: 222-260.
1962. Distribution of seagrasses in Tampa Bay.Florida. Fla. State Board Conserv.. Mar. Lab.Spec. Sd. Rep. 6. 12 pp.
PIRIE, N. W.1967. Orthodox and llllorthodox metl)ods of meet
ing world food ne-eds. Sci. Amer. 216(2) : 27-35·POMEROY. LAWRENCE R.
1959. Algal productivity in salt marshes of Georgia.Limnol. Oceanogr. 4: 386-397.
1960. PrimarY prOductivi,ty of Boca Ciega Bay. Florida. Bull. Mar. Sci. Gulf Caribbean 10: 1-10.
240
POMEROY, LAWRENCE R.. E. E. SMITH, and CAROL M. GRAN".1965. The exchange of phosphate between estuarine
water and sediments. Limnol. Oceanogr. 10: 167172.
PRATT. DAVID M.1953. Abundance and growth of l'enus tnercellm-ia
and Oallocat'dia mor,.lutQ·na in relation to charactersof bottom sediments. J. Mar. Res. 12: 60-74.
RAGOTZKIE. RoBERT A.1959. Plankton productivity in est.uarine waters of
Georgia. Publ. Inst. Mar. Sci., l.lniv. Tex. 6: 146158.
RAYMONT, JOHN E. G.1963. Plankt.on and produotivity in the oceans.
Macmillan Co., New York, viii + 660 pp.REID. GEORGE K.
1961. Ecology of inland waters and estuaries. Reinhold Publ. Corp., New York. xvi + 375 pp.
REISH, DONALD J.1959. An ecological study of pollution in Los Angeles
Long Beach harbors, California. Allan Han('()('kFound. Publ. Occas. Pap. 22. 119 pp.
RILEY. GORDON A., and SHIRLEY A. MACMILLAN CONOVER.1956. Oceanography of Long Island Sound. 1952-54.
III. Chemical oceanography. Bull. BinghamOce-anogr. Collect. 15: 47--61.
RoUNSEFELL. GEORGE A., Rnd ALEXANDER DRAGOVICH.1966. Correlation between oceanographk fRctors
Rnd abundance of the Florida red-tide (Gllm.n.odill
iu-m. brc·~'e Davis) . 1954--61. Bull. Mar. Sci. 16: 404422.
SALOMAN, CARL H.1965. Bait shrimp (Pella611'8 dllora.rllm.) in Tampa
Bay. Florida-biology, fishery economics. and('hanging. habitat. U.S. Fish Wildl. Serv.. Spec.
. Sci. Rep. Fish. 520, iii + 16 pp.SALOMA-N, CARL H .. JOHN H. FINUOANE, and JOHN A.
KELLY. JR.1964. Hydrographic observations of Tampa Bay,
FIOlida. and adjacent waters August 1961 t.hroughDecember 1962. U.S. Fish WildI. Serv.. Dat"a Rep.4, ii + 112 pp. on 6 microfiches.
SALOMAN. CARL H .• and JOHN L. TAYLOR.1068. Hydrographic observations in Tampa Bay,
Florida. and the adjacent Gulf of Mexico-196566. U.S. Fish Wildl. Se-rv.. Dftlta Rep,. 24. 393 pp.on 6 microfiches.
SANDERS. HOWARD L.1956. O<.>eRnography of Long Island Sound. 1952
1954. X. The biology of marine bottom communities. Bull. Bingham Oceanogr. Collect. 15: 345-414.
1960. Benthic studies in Buzzards' Bay. III. Thestructare of the soft-bottom community. Lilllnnl.Oceanogr. 5: 138-153.
SANDERS, H. L., E. M. GOUDBMIT, E. L. MILLS. and G. E.HAMPSON.. 1962. A study of the intertidal fauna of Barnstable
SAVILLE, THORNDIKE.1966. A study of estuarine pollution problems on a
SDlall unpollut.ed estuary and a small pollntedestuary in Florida. Eng. Progr. Univ. Fla. 20(8),viii + 202 pp.
SCHAEFER, MILNER B.1965. The potential harvest of t.he soo. Trans. Amer.
Fish. Soc. 94: 123-128.SHELBOURNE, J. E.
1964. The artificial propagation of marine fish. InF. S. Russell (editor), Advances in marine biology,vol. 2, PI>. 1-83. Academic Press, Inc., London.
SHUSTER, CARL N., JR.1959. A biological evaluation of the Delaware River
estuary. Univ. Del. Mar~ Lab. Inform. Ser. Publ. 3.77pp.
SKIRROW, GEOFFREY.1965. The dissolved gases--carbon dioxide. In J. P.
Riley and G. Skirrow (editors), Ohemical oceanography I, pp. 227-317. Academic Press, Inc., LOlldon.
SKUll. BERNARD E .. and WILLIAM B. WILSON.1960. Role of estuarine waters in Gulf fisheries.
Trans. 25th N. Amer. Wildt Natur. Resourc. Coni. :320-826.
SPRINGER, VICTOR G.. and KENNETH D. 'VOODBURN.1960. An ecological stUdy of t.he fishes of the Tampa
Bay area. Fla. State Board Conserv. Mar. Lab.Prof. Pap. Ser. I, V+ 104: pp.
STEPHENS, 'VILLIAM M.1966. Life in the turtle grass. Sea Frontiers 12:
264--275.SVERDRUP, H. U., MARTIN W. JOHNSON, and RICHARD H.
FLEMING.1942. The oceans-their physics, chemistry, and gen
eral 'biology. P·rentice-Hall. Inc., New York, x +1087pp.
SYKES, JAMES E.1963. Multiple utilization of Gulf Coast estuaries.
Proc. Southeast. Ass. Game Fish Comm., 17th Annu.Conf., pp. 323-326.
1967. The role of research in the preservation ofestuaries. Trans. 32d N. Amer. Wildt Natur.Resourc. Conf.: 150-160.
SYKES. JAMES E., and JOHN H. FINUCANE.1966. Occurrence in Tampa Bay, Florida, of im
mature species dominant in Gulf of Mexico commercial fisheries. U.S. Fish Wildt Serv.. Fish.BuH. 65: 369-379.
TAYLOR, JOHN L.1965. Bottom samplers for estuarine research.
Chesapeake Sci. 6: 233-234.TAYLOR, JOHN L., and CARL H. SAI-OMAN.
1967. Benthic project. Ill- RellOrt. of the Bureau ofCommercial Fisheries Biological Laboratory, St.Petersburg Beach, Florida. fiscal year 1966, pp. 4--8.U.S. Fish Wild!. Serv., Circ. 257.
THOMPSON, SETON H.1961. What. is happening to our estuaries? Trans.
26th N. Amer. Wildt Natur. Resourc. Conf.: 318322.
THORSON, GUNNAR.1957. Bot.t.om commtUlities (sublittoral or shallow
shelf). Ill- J. W. Hedgpeth (edit.or). Treatise onmarine ecology and paleoecology 1. Ecology, pp.461--534. Geol. Soc. Amer. Mem. 67, New York.
TRESSLER, DONALD K., and J. McW. LEMON (EDITORS).1951. Marine products of commerce. Reinhold Publ.
Corp.. New York, xiii + 782 pp.TUKEY, JOHN W. (CHAIRMAN).
1965. Restoring the quality of our environment. Report of the environmental pollution panel, President's Sci. Ad". ConlIn., U.S. Govt. Printing Office,Wash., D.C.. xii + 317 pp.
VACOARO, RALPH F.1965. Inorganic nitrogen in sea water. In J. P. Riley
and G. Skirrow (editors), Chemical oceanography1. pp. 365-408. Academic Press, Inc., London.
VAN STRATTEN, L. 1\:1:. J. U., and PH. H. KUENEN.1A)58. Tidal action as a cause of clay accumulation.
J. Sediment. Petrol. 28: 406-413.VINOGRADOV. A. P.
1953. The elementary chemical composition of marine organisms. Mem. Sears Found. Mar. Res. 2.Yale Univ.. New Haven, Conn., xiv + 647 pp.
WEISER, WOLFGANG.1960. Benthic studies in Buzzards Bay. II. 'The
meiofauna. Limnol. Oceanogr. 5: 121-137.'VILKINSON. L.
HI6!. Nitrogen transformations in a polluted estuary.Ill- E. A. Pearson (edi,tor), Advances in water pollution research 3, pp. 405-!22. The Macmillan Co.,New York.
WILLIAMS, RICHARD B., MARIANNE B. MURllOCK, and LEONK.THOMAS.
1966. Productivity. In Annual report of the Bureauof Commercial Fisheries Radiobiologieal Laboratory, Beaufort, N.C.. for the fiscal year ending June30, 1965, pp. 7-11. U.S. Fish Wild!. Serv., Circ.244.
WILLIAMS, RoBERT H.1954. Distribution of chemical constituents of sea
water in the Gulf of Mexico. In P. S. Galtsoff(coordinator). Gulf of Mexico-its origin, waters,and marine life, pp. 143-151. U.S. Fish WildtSel'\".. Fish. Bull. 55.
WOODBURN. KENNETH D.1965. A discussion and selected, annotated refer
ences of subjective or contro\"ersinlmarinl' matters.Fla. State Board Conser\". Tech. Ser. 46, iv + 50pp.
EFFECTS OF HYDRAULIC DREDGING AND OOASTAL DEVELOPMENT IN BOCA CIEGA BAY, FLA. 241