Some Experiences and results from EMEP-Intensive- ring-Campaigns at Melpitz site (German lowlands, Sa Summer 2006 and Winter 2007 – Planned possible measurements for 2008 and 2009 dler 1 , L. Poulain 1 , E. Brüggemann 1 , T. Gnauk 1 , A. Grüner 1 , K. Müller 1 , ch 3 , M.Wallasch 2 , B. Wehner 1 , A. Wiedensohler 1 , H. Herrmann 1 EMEP/TFMM workshop: specification of the next intensive measurement campaign and future plans related to the EMEP monitoring strategy, Dublin 23 rd October 2007 z-Institute for Tropospheric Research, Permoserstrasse 15, 04318 Leipzig, Germany ntre for Environmental Research, Permoserstrasse 15, 04318 Leipzig, Germany bundesamt, Wörlitzer Platz 1, 06844 Dessau, Germany ional contributions to EMEP Database
Transcript
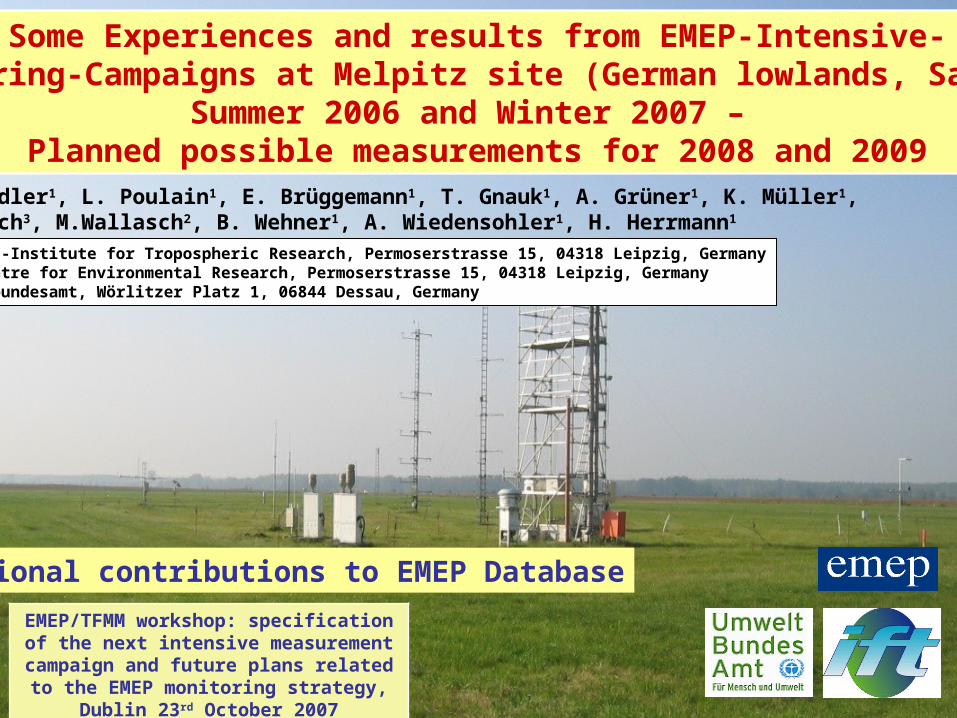
Some Experiences and results from EMEP-Intensive-Measuring-Campaigns at Melpitz site (German lowlands, Saxony)
Summer 2006 and Winter 2007 – Planned possible measurements for 2008 and 2009
G. Spindler1, L. Poulain1, E. Brüggemann1, T. Gnauk1, A. Grüner1, K. Müller1, Th.M.Tuch3, M.Wallasch2, B. Wehner1, A. Wiedensohler1, H. Herrmann1
EMEP/TFMM workshop: specification of the next intensive measurement campaign and
future plans related to the EMEP monitoring strategy, Dublin 23rd October 2007
1Leibniz-Institute for Tropospheric Research, Permoserstrasse 15, 04318 Leipzig, Germany2UFZ Centre for Environmental Research, Permoserstrasse 15, 04318 Leipzig, Germany3Umweltbundesamt, Wörlitzer Platz 1, 06844 Dessau, Germany
National contributions to EMEP Database
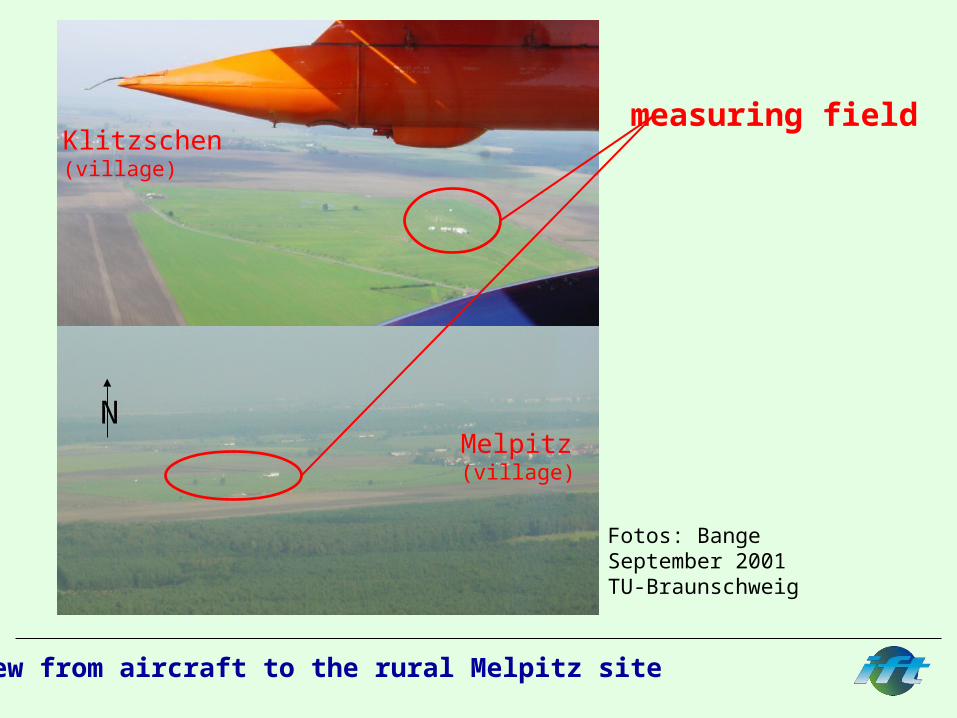
View from aircraft to the rural Melpitz site
Fotos: BangeSeptember 2001 TU-Braunschweig
N
Klitzschen(village)
Melpitz(village)
measuring field
Evolution of half-hourly PM10-mass concentration and precipitation in winter
(November until April) and summer (May until October) at Melpitz site in the least 14 years. The half yearly precipitation sum is plotted as inverse.
y = 0.04x2 - 1.61x + 38.91
R2 = 0.90 n=14
y = 0.04x2 - 1.76x + 45.25
R2 = 0.49 n=14
0
10
20
30
40
50
60
70
80
90
100m
ass
con
cen
trat
ion
PM
10 [
µg/
m³]
0
100
200
300
400
500
600
700
800
900
1000
pre
cip
itat
ion
su
m [
mm
]
PM10 (winter) PM10 (summer) precipitation sum
Polynomisch (PM10 (summer)) Polynomisch (PM10 (winter))Three years of intensive investigation
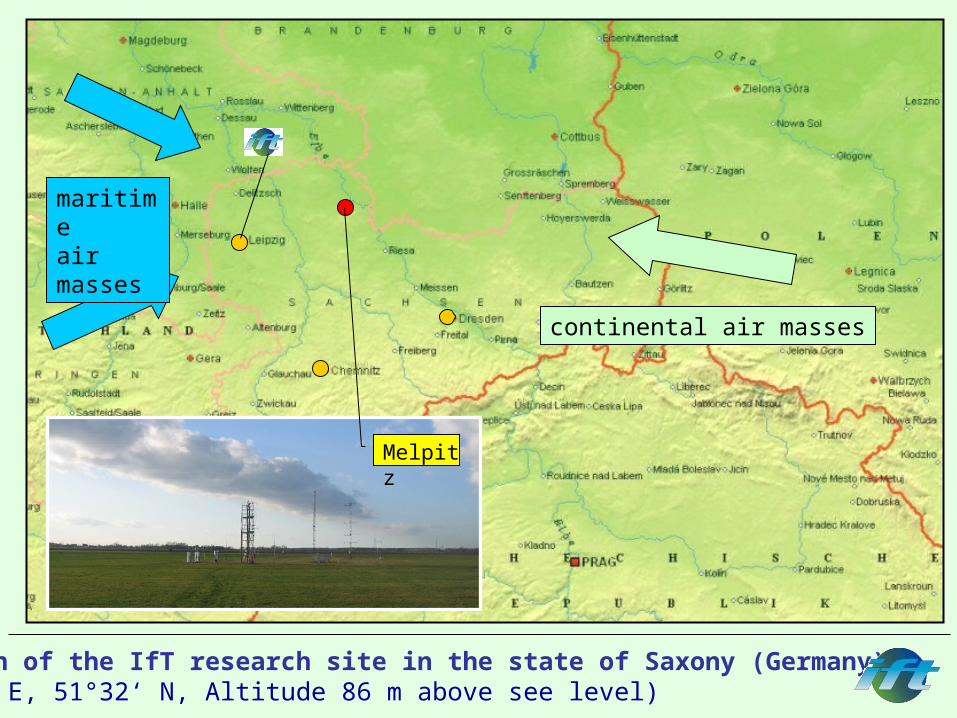
Location of the IfT research site in the state of Saxony (Germany) (12°56‘ E, 51°32‘ N, Altitude 86 m above see level)
maritimeair masses
continental air masses
Melpitz
Mean PM1, PM2.5 and PM10 mass concentrations, the concentrations of the main ions (nitrate, sulfate and ammonium) and organic and elemental carbon content (OC and EC) in winter and summer. Only days with air mass transport explicitly from West (blue frame) or from East (green frame) are considered.The error bars are the standard deviation for the particle mass concentration. “n” is the number of days. Averages of three winters (2004/05, 2005/06, 2006/07) and three summers (2005, 2006, 2007) are shown.
Results DIGITEL Sampler
0 5 10 15 20 25 30 35 40 45 50 55 60
PM10
PM2.5
PM1
PM10
PM2.5
PM1
mass concentration [µg/m³]
mass(unidentified)SO42-
NO3-
NH4+
organic carbon
elemental carbon
summer 04, 05, 06
winter 04/05, 05/06, 06/07
n=87
n=300
n=312
n=85
n=315
n=324
0 5 10 15 20 25 30 35 40 45 50 55 60
PM10
PM2.5
PM1
PM10
PM2.5
PM1
mass concentration [µg/m³]
winter 04/05, 05/06, 06/07
summer 04, 05, 06
n=16
n=84
n=83
n=22
n=107
n=107
0
10
20
30
40
50
60
70
80
90
100
04 /
06
05 /
06
06 /
06
07 /
06
08 /
06
09 /
06
10 /
06
11 /
06
12 /
06
01 /
07
02 /
07
03 /
07
04 /
07
time [month]
part
icle
mas
s co
ncen
trat
ion
[µg/
m³] PM10
PM2.5PM1air masses from westair masses from east
Indicator for air mass direction
Time series of daily particle mass concentration PM1, PM2.5 and PM10 (May 2004 until October 2006) with indicator for air mass origin and time-slotsfor the EMEP winter- and summer-campaign (2006 and 2007)
Summer-campaign
Winter-campaign
Meteorological parameters during the EMEP intensive campaigns at Melpitz site
Difference from normal climate (1971-2000) for daily mean temparature
at the Meteorological Institute of the Leipzig University®
-30
-20
-10
0
10
20
30
40
time (days)
Tem
pera
ture
[°C
]
30
40
50
60
70
80
90
100
rela
tive
Hum
idity
[%]
Temperaturerelative Humidity
-30
-20
-10
0
10
20
30
40
time (days)
Tem
pera
ture
[°C
]
30
40
50
60
70
80
90
100
rela
tive
Hum
idity
[%
]
Temperaturerelative Humidity
Temperature and relative Humidity at Melpitz siteJune 2006 January/February 2007
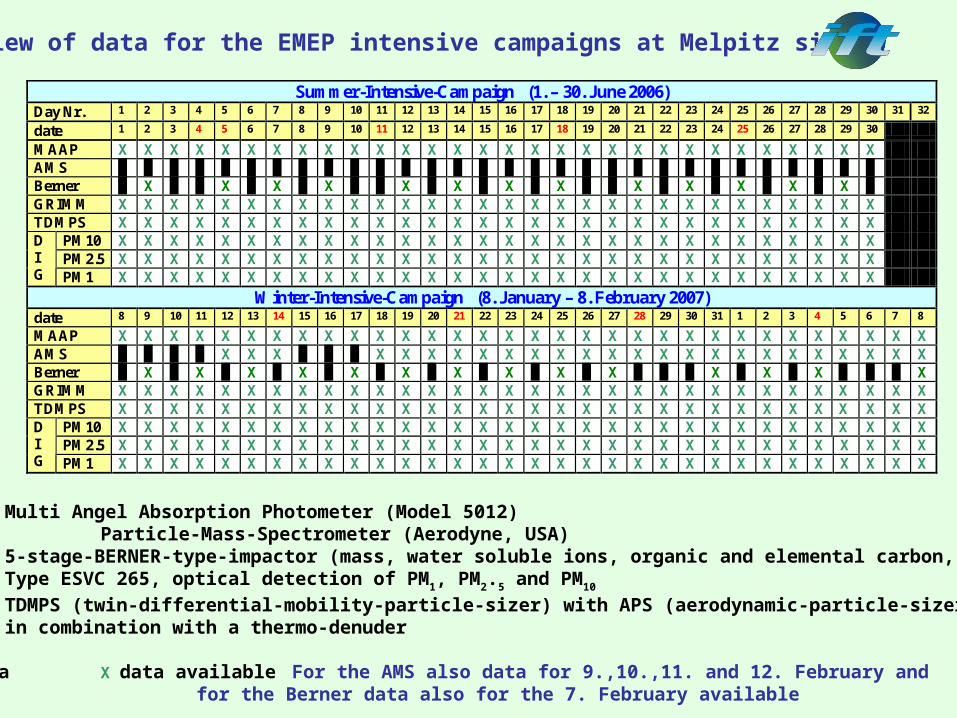
MAAP X X X X X X X X X X X X X X X X X X X X X X X X X X X X X X AMS █ █ █ █ █ █ █ █ █ █ █ █ █ █ █ █ █ █ █ █ █ █ █ █ █ █ █ █ █ █ Berner █ X █ █ X █ X █ X █ █ X █ X █ X █ X █ █ X █ X █ X █ X █ X █ GRIMM X X X X X X X X X X X X X X X X X X X X X X X X X X X X X X TDMPS X X X X X X X X X X X X X X X X X X X X X X X X X X X X X X
PM10 X X X X X X X X X X X X X X X X X X X X X X X X X X X X X X PM2.5 X X X X X X X X X X X X X X X X X X X X X X X X X X X X X X
DIG PM1 X X X X X X X X X X X X X X X X X X X X X X X X X X X X X X
MAAP X X X X X X X X X X X X X X X X X X X X X X X X X X X X X X X X AMS █ █ █ █ X X X █ █ █ X X X X X X X X X X X X X X X X X X X X X X Berner █ X █ X █ X █ X █ X █ X █ X █ X █ X █ X █ █ █ X █ X █ X █ █ █ X GRIMM X X X X X X X X X X X X X X X X X X X X X X X X X X X X X X X X TDMPS X X X X X X X X X X X X X X X X X X X X X X X X X X X X X X X X
PM10 X X X X X X X X X X X X X X X X X X X X X X X X X X X X X X X X PM2.5 X X X X X X X X X X X X X X X X X X X X X X X X X X X X X X X X
DIG PM1 X X X X X X X X X X X X X X X X X X X X X X X X X X X X X X X X
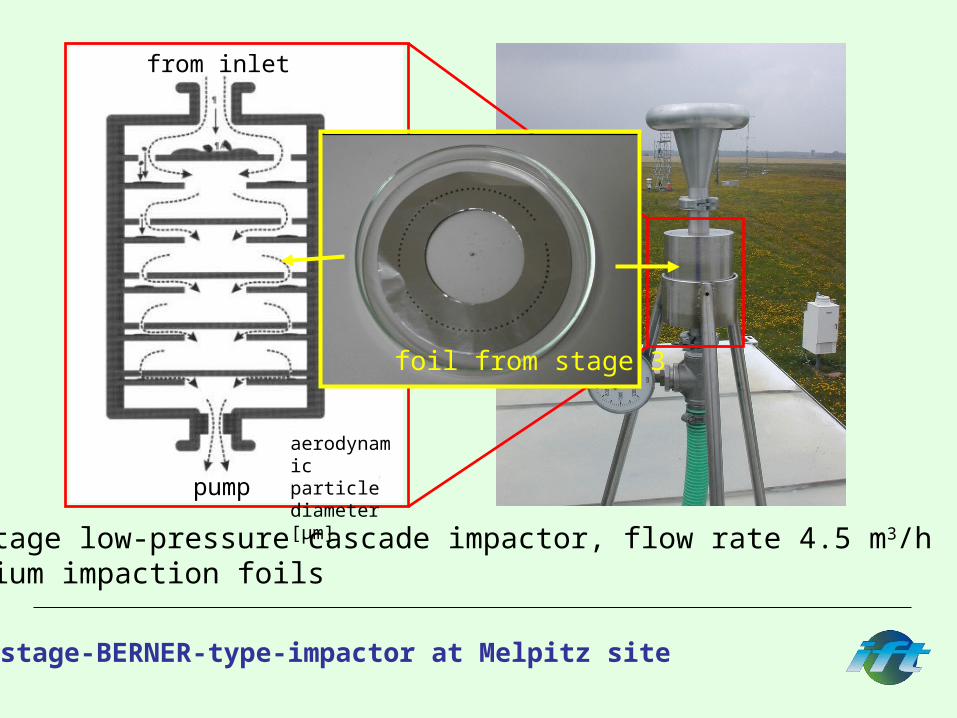
MAAP, Multi Angel Absorption Photometer (Model 5012)TOF-AMS, Particle-Mass-Spectrometer (Aerodyne, USA)Berner, 5-stage-BERNER-type-impactor (mass, water soluble ions, organic and elemental carbon, OC, EC)GRIMM Type ESVC 265, optical detection of PM1, PM2.5 and PM10
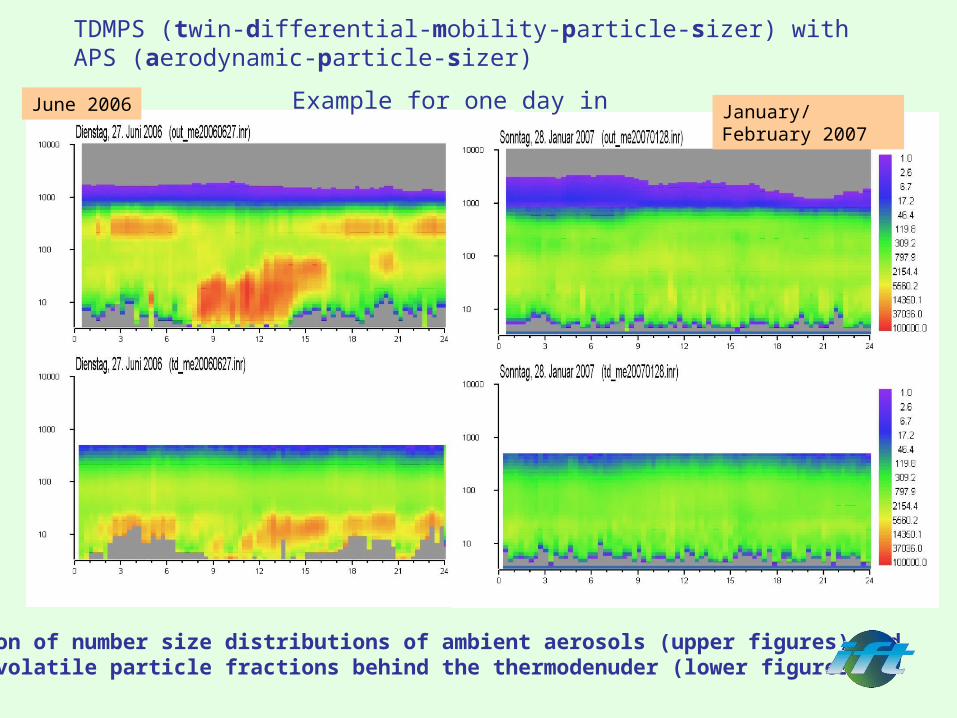
TDMPS TDMPS (twin-differential-mobility-particle-sizer) with APS (aerodynamic-particle-sizer) in combination with a thermo-denuder
█ no data X data available For the AMS also data for 9.,10.,11. and 12. February andfor the Berner data also for the 7. February available
Overview of data for the EMEP intensive campaigns at Melpitz site
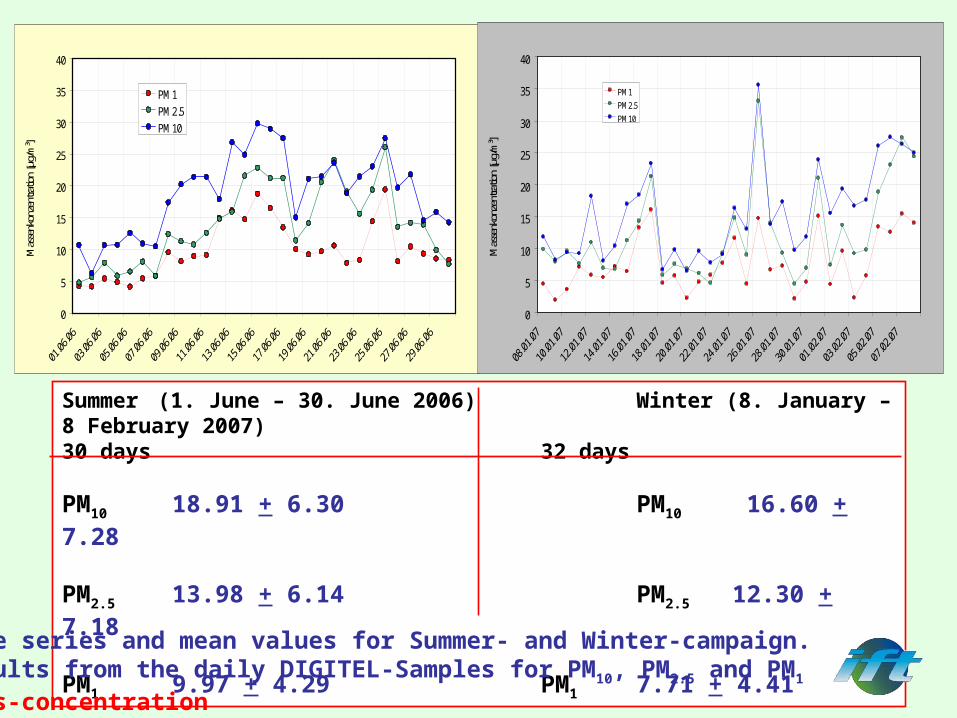
Summer (1. June – 30. June 2006) Winter (8. January – 8 February 2007)30 days 32 days
PM10 18.91 + 6.30 PM10 16.60 + 7.28
PM2.5 13.98 + 6.14 PM2.5 12.30 + 7.18
PM1 9.97 + 4.29 PM1 7.71 + 4.41
0
5
10
15
20
25
30
35
40
Mas
senk
onze
ntra
tion
[µg/
m³]
PM1
PM2.5
PM10
0
5
10
15
20
25
30
35
40
Mas
senk
onze
ntra
tion
[µg/
m³]
PM1
PM2.5
PM10
Time series and mean values for Summer- and Winter-campaign. Results from the daily DIGITEL-Samples for PM10, PM2.5 and PM1
Mass-concentration
y = 0.98x
R2 = 0.62
0
5
10
15
20
25
30
35
40
0 5 10 15 20 25 30 35 40PM10 high volume [µg/m³]
PM
10 d
aily
mea
n G
RIM
M [
µg/
m³]
0
10
20
30
40
50
60
70
days in June 2006 (half hourly means)
par
ticl
e m
ass
con
cen
trat
ion
[µ
g/m
³]
PM10
PM2.5
PM1
PM10 high volume
Comparison of half-hourly PM10-measurements of an optical device (Type ESVC 265, Fa. GRIMM, Germany)with daily PM10 data from the DIGITEL
June 2006
N=30
y = 0.78x
R2 = 0.78
0
5
10
15
20
25
30
0 5 10 15 20 25 30PM10 high volume [µg/m³]
PM
10 d
aily
mea
n G
RIM
M [
µg/
m³]
0
5
10
15
20
25
30
35
40
days in January/February 2006 (half hourly means)
par
ticl
e m
ass
con
cen
trat
ion
[µ
g/m
³]PM10
PM2.5
PM1
PM10 high volume
January/February 2007
Comparison of half-hourly PM10-measurements of an optical device (Type ESVC 265, Fa. GRIMM, Germany)with daily PM10 data from the DIGITEL
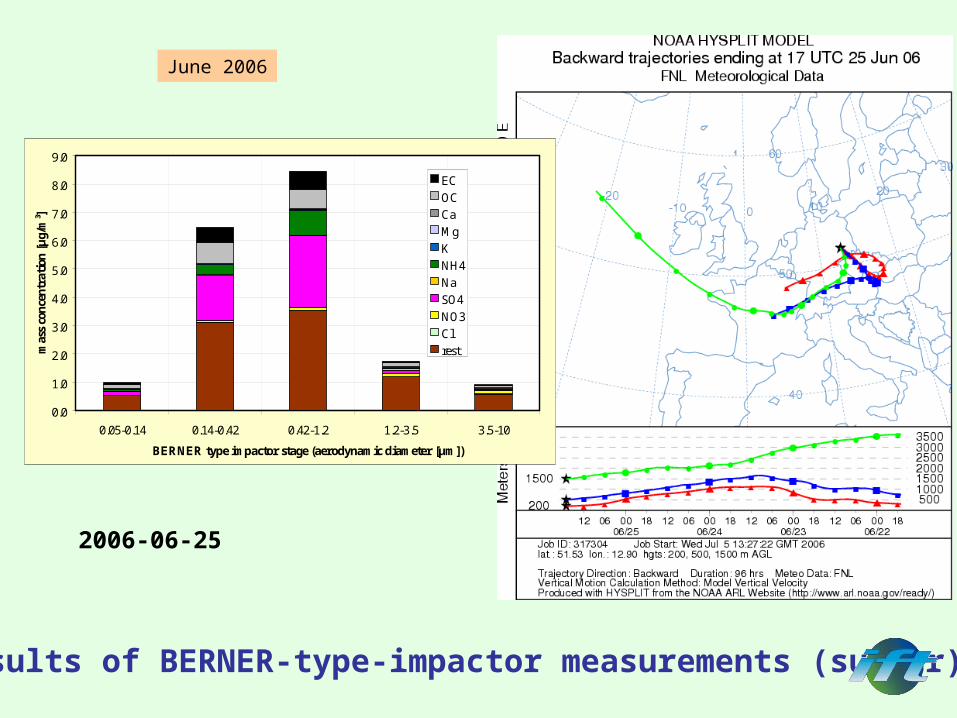
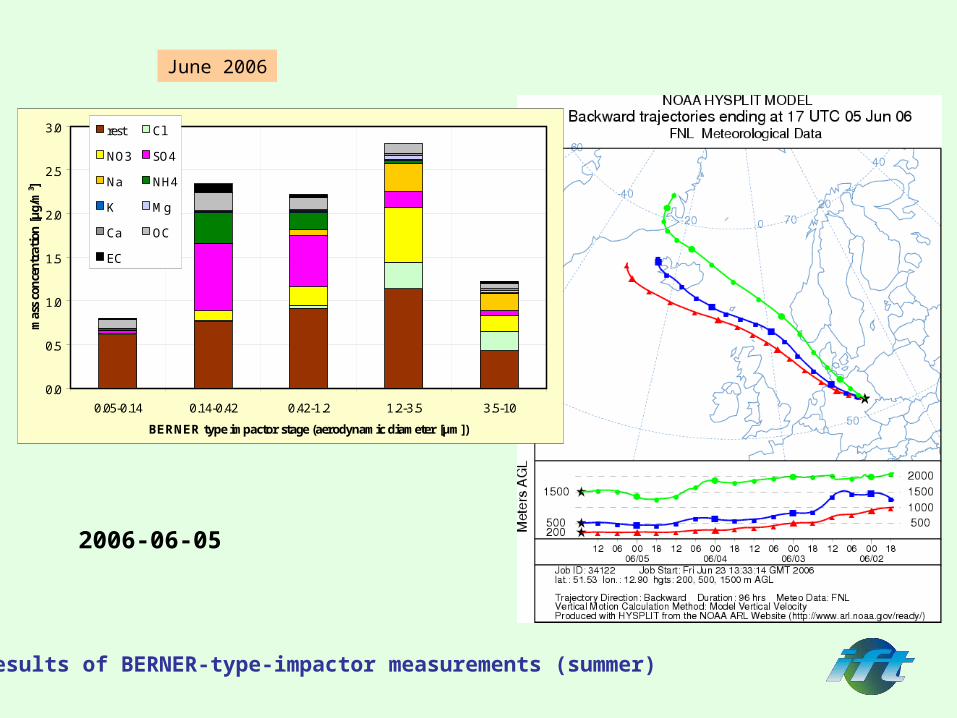
Results of BERNER-type-impactor measurements (summer)
June 2006
2006-06-25
0.0
1.0
2.0
3.0
4.0
5.0
6.0
7.0
8.0
9.0
0.05-0.14 0.14-0.42 0.42-1.2 1.2-3.5 3.5-10
BERNER type impactor stage (aerodynamic diameter [µm])
mas
s co
nce
ntr
atio
n [
µg/
m³]
EC
OC
Ca
Mg
K
NH4
Na
SO4
NO3
Cl
rest
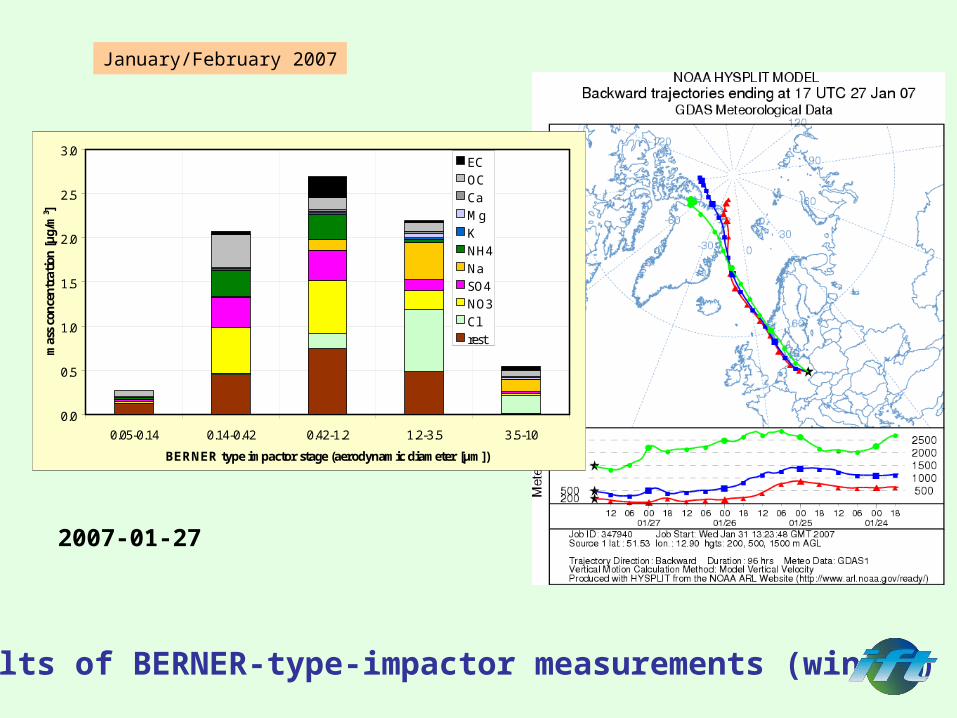
Results of BERNER-type-impactor measurements (winter)
2007-01-27
January/February 2007
0.0
0.5
1.0
1.5
2.0
2.5
3.0
0.05-0.14 0.14-0.42 0.42-1.2 1.2-3.5 3.5-10
BERNER type impactor stage (aerodynamic diameter [µm])
mas
s co
ncen
trat
ion
[µg/
m³]
EC
OC
Ca
Mg
K
NH4
Na
SO4
NO3
Cl
rest
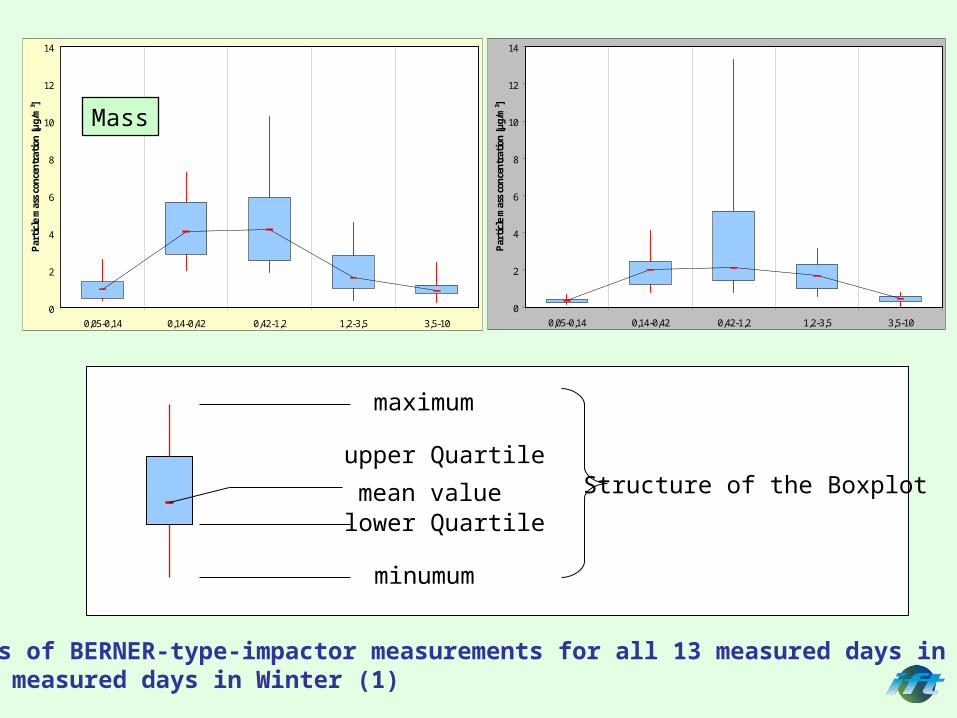
Results of BERNER-type-impactor measurements for all 13 measured days in Summerand 15 measured days in Winter (1)
0
2
4
6
8
10
12
14
0,05-0,14 0,14-0,42 0,42-1,2 1,2-3,5 3,5-10
Par
ticl
e m
ass
con
cen
trat
ion
[µ
g/m
³]
Mass
0
2
4
6
8
10
12
14
0,05-0,14 0,14-0,42 0,42-1,2 1,2-3,5 3,5-10
Par
ticl
e m
ass
conc
entr
atio
n [µ
g/m
³]
Mass
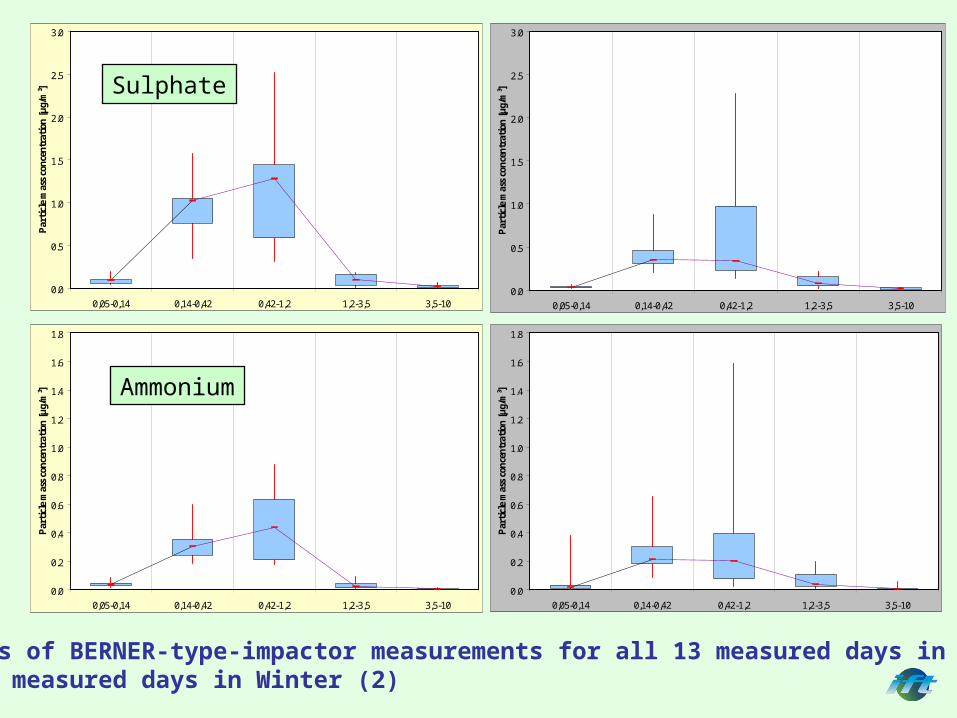
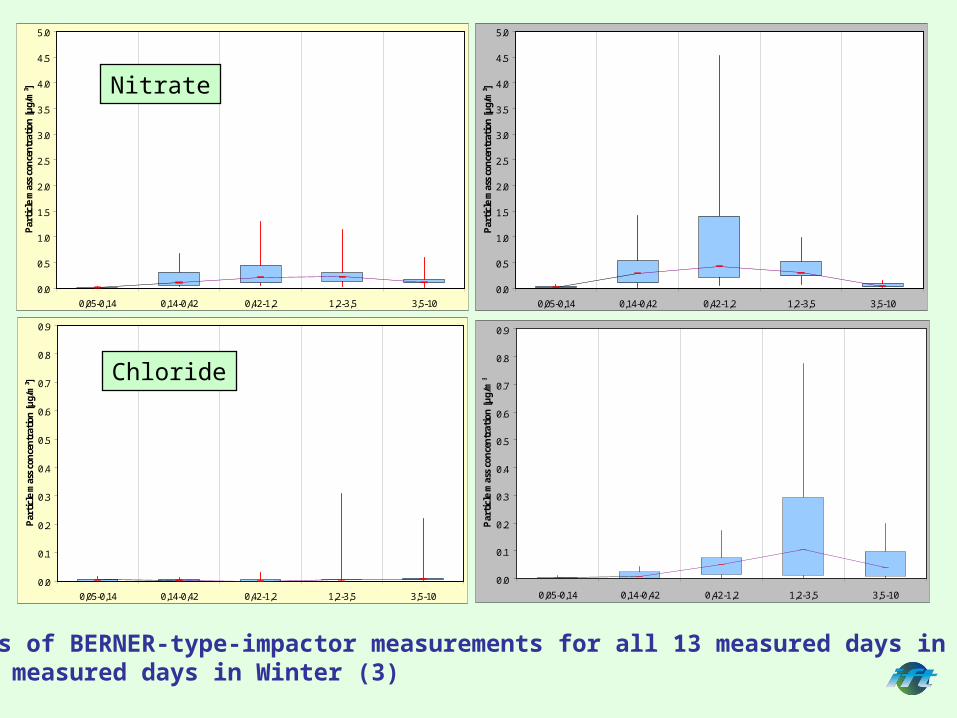
Structure of the Boxplot
minumum
lower Quartile
upper Quartile
mean value
maximum
Mass
Time profiles and mass fraction
Comparison with PM1 DIGITEL daily filter samples
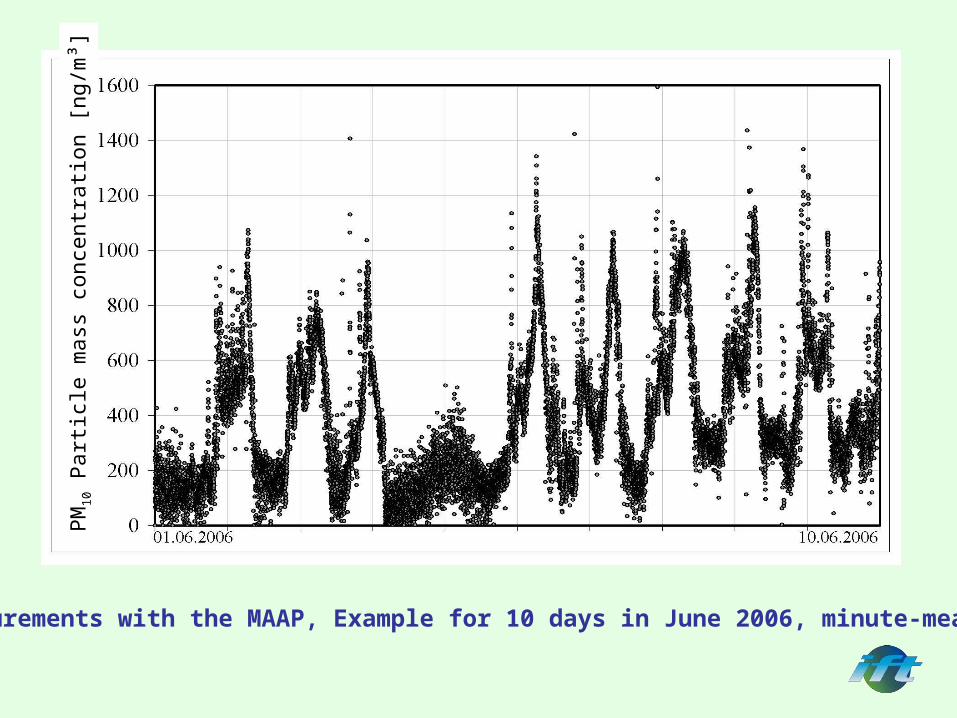
PM
10 P
arti
cle
mas
s co
ncen
trat
ion
[ng/
m³]
Measurements with the MAAP, Example for 10 days in June 2006, minute-means
June 2006 January/February 2007
Evolution of number size distributions of ambient aerosols (upper figures) and of non-volatile particle fractions behind the thermodenuder (lower figures) as a meanfor the EMEP-summer- and -winter-campaign.
We provide data for both EMEP-Intensive campaigns in 2006 and 2007DIGITEL High Volume Sampler (daily means, PM1, PM2.5 and PM10)MAAP, Multi Angel Absorption Photometer (Model 5012) (Minute means)Berner, 5-stage-BERNER-type-impactor (mass, water soluble ions,
organic and elemental carbon, OC, EC) (daily means for selected days,13 during summer and 15 during winter campaign)
GRIMM Type ESVC 265, optical detection of PM1, PM2.5 and PM10 (half-hourly means)
TDMPS TDMPS (twin-differential-mobility-particle-sizer) with APS (aerodynamic-particle-sizer) in combination with a thermo-denuder (10 minute means and daily contour plots)
TOF-AMS, Particle-Mass-Spectrometer (data in winter campaign available)(5-minute-means)
This measurements can be done at Melpitz site also for 2008 and 2009
Plus …
Possible new and modified measurements for the future campaigns in 2008 and 2009 at Melpitz
AMS measurements in both campaigns with more focus also on organic speciation (HOA, OOA) (5 minute means)
Quasi continuously measurements of OC and EC with the SUNSET LABORATORY’s Carbon Aerosol Analyzer (hourly means for OC/EC)
Artifact free sampling of OC/EC (following EUSAAR) – Analysis of OC and EC with C-mat 5500 (VDI 2465 page 2) (daily mean every second day)
Monitor for Aerosols & Gases in Ambient AirMARGA (commercial vision of SJAC)for NO3
-, NH4+, SO4
–, Cl- /HNO3, HCl, NH3, SO2 in PM2.5
(hourly means) (MARGA can be integrated in the 2009 campaign)
TEOM® FDMS for nearly artifact free measurements of PM10 mass concentration (10 minute means)
NH3-Measurements by photoacoustic (TGA 310) (10 minute means)
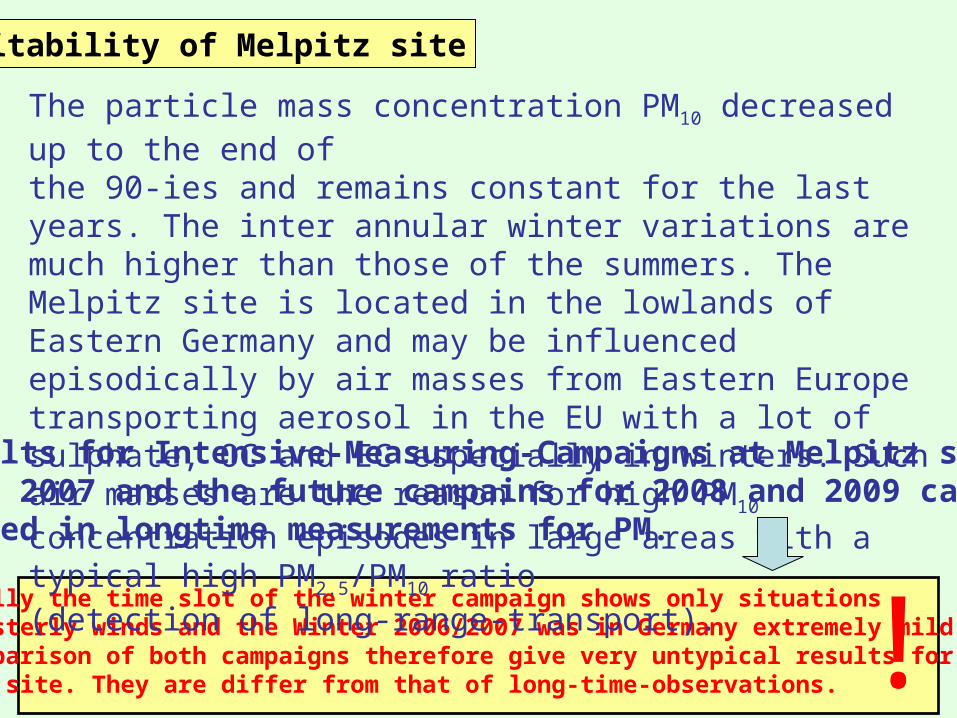
Especially the time slot of the winter campaign shows only situations with westerly winds and the Winter 2006/2007 was in Germany extremely mild.The comparison of both campaigns therefore give very untypical results for the Melpitz site. They are differ from that of long-time-observations. !
The particle mass concentration PM10 decreased up to the end of the 90-ies and remains constant for the last years. The inter annular winter variations are much higher than those of the summers. The Melpitz site is located in the lowlands of Eastern Germany and may be influenced episodically by air masses from Eastern Europe transporting aerosol in the EU with a lot of sulphate, OC and EC especially in winters. Such air masses are the reason for high PM10 concentration episodes in large areas with a typical high PM2.5/PM10 ratio (detection of long-range-transport). The results for Intensive-Measuring-Campaigns at Melpitz site for 2006 and 2007 and the future campains for 2008 and 2009 can be integrated in longtime measurements for PM.
Suitability of Melpitz site
reasons
actions
We would like to thank Jörn Hanß, Eveline Neumann, Annelie Thomas, Helga Mamczak, Brigitte Gerlach and Anett Dietze.
Particulate MatterWe acknowledge the support from the
Umweltbundesamt in Germany for the 2006 and 2007EMEP-Intensive-Measuring-Campaigns
(project 351 01 031) and continuation of measurements in 2006/07 (project 351 01 38)
Time-slots of the summer and winter EMEP-Intensive-Measuring-campaignsin the daily long-time PM10-Mesurements at Melpitz site
Campaigns inWinter and Summer
0
90
180
270
360
time (days)
win
ddi
rect
ion
[°]
0.00
1.00
2.00
3.00
4.00
5.00
6.00
7.00
8.00
9.00
10.00
pre
cipi
tatio
n [
mm
]
winddirection
precipitation
0
90
180
270
360
Zeit (Tage)
win
ddire
ctio
n [°
]
0.00
1.00
2.00
3.00
4.00
5.00
6.00
7.00
8.00
9.00
10.00
prec
ipita
tion
[mm
]
winddirectionprecipitation
0
200
400
600
800
1000
1200
time (days)
glo
ba
l ra
dia
tion
[W
/m²]
0
2
4
6
8
10
12
14
16
18
20
win
dve
loci
ty [
m/s
]
globalradiation
wind velocity
0
200
400
600
800
1000
1200
time (days)
glo
ba
l ra
dia
tion
[W
/m²]
0
2
4
6
8
10
12
14
16
18
20
win
dve
loci
ty [
m/s
]
global radiation
windvelocity
Meteorological parameters during the EMEP intensive campaigns at Melpitz site (2)
Global radiation and wind velocity at Melpitz site
June 2006 January/February 2007
Wind direction and precipitation at Melpitz site
Summer (1. June – 30. June 2006) Winter (8. January – 8 February 2007)30 days 32 days
PM10 1.09 + 1.22 PM10 2.96 + 2.31
PM2.5 0.55 + 0.90 PM2.5 2.46 + 2.16
PM1 0.30 + 0.55 PM1 0.66 + 1.56
Time series and mean values for Summer- and Winter-campaign. Results from the daily DIGITEL-Samples for PM10, PM2.5 and PM1
Nitrate-concentration
0
1
2
3
4
5
6
7
8
9
10
Mas
senk
onze
ntra
tion
[µg/
m³]
PM1
PM2.5
PM10
0
1
2
3
4
5
6
7
8
9
10
Mas
senk
onze
ntra
tion
[µg/
m³]
PM1
PM2.5
PM10
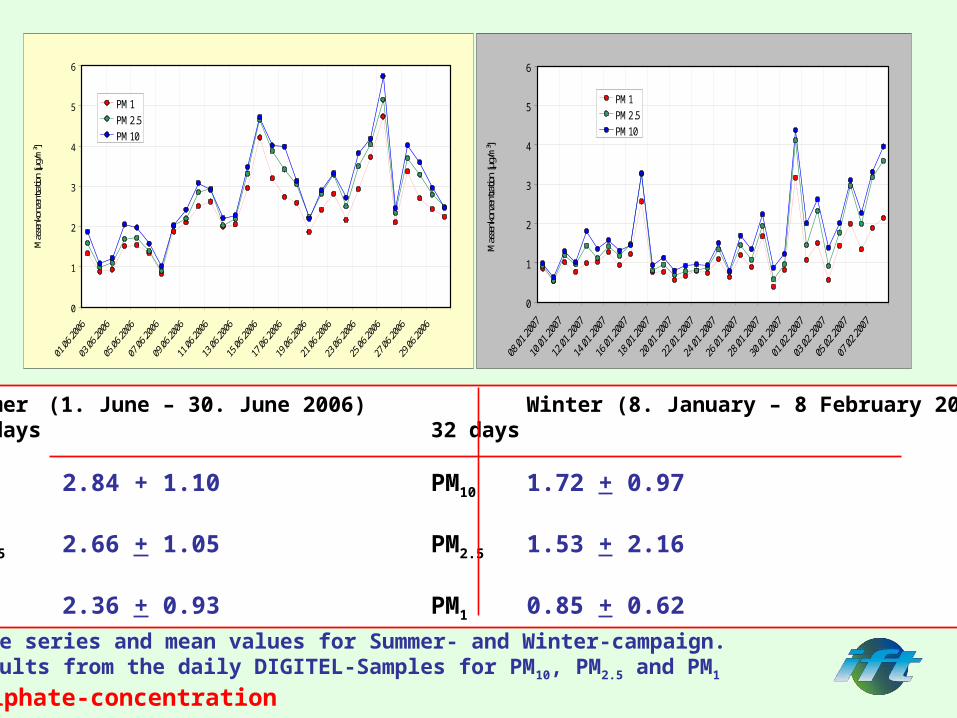
Summer (1. June – 30. June 2006) Winter (8. January – 8 February 2007)30 days 32 days
PM10 2.84 + 1.10 PM10 1.72 + 0.97
PM2.5 2.66 + 1.05 PM2.5 1.53 + 2.16
PM1 2.36 + 0.93 PM1 0.85 + 0.62
Time series and mean values for Summer- and Winter-campaign. Results from the daily DIGITEL-Samples for PM10, PM2.5 and PM1
Sulphate-concentration
0
1
2
3
4
5
6
Mas
senk
onze
ntra
tion
[µg/
m³]
PM1
PM2.5
PM10
0
1
2
3
4
5
6
Mas
senk
onze
ntra
tion
[µg/
m³]
PM1
PM2.5
PM10
Summer (1. June – 30. June 2006) Winter (8. January – 8 February 2007)30 days 32 days
PM10 1.03 + 0.36 PM10 1.20 + 0.92
PM2.5 1.04 + 0.33 PM2.5 1.13 + 0.89
PM1 0.93 + 0.28 PM1 0.86 + 0.66
Time series and mean values for Summer- and Winter-campaign. Results from the daily DIGITEL-Samples for PM10, PM2.5 and PM1
Ammonium-concentration
0.0
0.5
1.0
1.5
2.0
2.5
3.0
3.5
4.0
Mas
senk
onze
ntra
tion
[µg/
m³]
PM1
PM2.5
PM10
0.0
0.5
1.0
1.5
2.0
2.5
3.0
3.5
4.0
Mas
senk
onze
ntra
tion
[µg/
m³]
PM1
PM2.5
PM10
Results of BERNER-type-impactor measurements (summer)
June 2006
2006-06-05
0.0
0.5
1.0
1.5
2.0
2.5
3.0
0.05-0.14 0.14-0.42 0.42-1.2 1.2-3.5 3.5-10
BERNER type impactor stage (aerodynamic diameter [µm])
mas
s co
nce
ntr
atio
n [
µg/
m³]
rest Cl
NO3 SO4
Na NH4
K Mg
Ca OC
EC
Results of BERNER-type-impactor measurements (summer)
June 2006
2006-06-12
0.0
0.5
1.0
1.5
2.0
2.5
3.0
3.5
4.0
0.05-0.14 0.14-0.42 0.42-1.2 1.2-3.5 3.5-10
BERNER type impactor stage (aerodynamic diameter [µm])
mas
s co
nce
ntr
atio
n [
µg/
m³]
EC
OC
Ca
Mg
K
NH4
Na
SO4
NO3
Cl
rest
Results of BERNER-type-impactor measurements (winter)
2007-01-15
January/February 2007
0.0
0.5
1.0
1.5
2.0
2.5
3.0
3.5
0.05-0.14 0.14-0.42 0.42-1.2 1.2-3.5 3.5-10
BERNER type impactor stage (aerodynamic diameter [µm])
mas
s co
nce
ntr
atio
n [
µg/
m³]
EC
OC
Ca
Mg
K
NH4
Na
SO4
NO3
Cl
rest
Results of BERNER-type-impactor measurements (winter)
2007-02-08
January/February 2007
0.0
2.0
4.0
6.0
8.0
10.0
12.0
14.0
0.05-0.14 0.14-0.42 0.42-1.2 1.2-3.5 3.5-10
BERNER type impactor stage (aerodynamic diameter [µm])
mas
s co
nce
ntr
atio
n [
µg/
m³]
EC
OC
Ca
Mg
K
NH4
Na
SO4
NO3
Cl
rest
0
0.5
1
1.5
2
2.5
3
3.5
4
4.5
5
01.06
.2006
03.06
.2006
05.06
.2006
07.06
.2006
09.06
.2006
11.06
.2006
13.06
.2006
15.06
.2006
17.06
.2006
19.06
.2006
21.06
.2006
23.06
.2006
25.06
.2006
27.06
.2006
29.06
.2006
Mas
sen
kon
zen
trat
ion
[µ
g/m
³]
MAAP_PM10
EC_DIGITEL_PM10
TC_DIGITEL_PM10
0
0.5
1
1.5
2
2.5
3
3.5
4
4.5
5
08.01
.2007
10.01
.2007
12.01
.2007
14.01
.2007
16.01
.2007
18.01
.2007
20.01
.2007
22.01
.2007
24.01
.2007
26.01
.2007
28.01
.2007
30.01
.2007
01.02
.2007
03.02
.2007
05.02
.2007
07.02
.2007
Mas
sen
kon
zen
trat
ion
[µ
g/m
³]
Comparison of black carbon determination from DIGITEL-Filters as EC (VDI-2465, page 2) and an optical determination with an Multi Angel Absorption Photometer (MAAP, Model 5012)for the EMEP summer and winter campaigns 2006 and 2007Database daily meansTC = OC + EC
Evolution of number size distributions of ambient aerosols (upper figures) and of non-volatile particle fractions behind the thermodenuder (lower figures)
January/February 2007
June 2006 Example for one day in
TDMPS (twin-differential-mobility-particle-sizer) with APS (aerodynamic-particle-sizer)
Results of BERNER-type-impactor measurements for all 13 measured days in Summerand 15 measured days in Winter (2)
0.0
0.5
1.0
1.5
2.0
2.5
3.0
0,05-0,14 0,14-0,42 0,42-1,2 1,2-3,5 3,5-10
Par
ticl
e m
ass
con
cen
trat
ion
[µ
g/m
³]
0.0
0.5
1.0
1.5
2.0
2.5
3.0
0,05-0,14 0,14-0,42 0,42-1,2 1,2-3,5 3,5-10
Par
ticl
e m
ass
con
cen
trat
ion
[µ
g/m
³]Sulphate
0.0
0.2
0.4
0.6
0.8
1.0
1.2
1.4
1.6
1.8
0,05-0,14 0,14-0,42 0,42-1,2 1,2-3,5 3,5-10
Par
ticl
e m
ass
con
cen
trat
ion
[µ
g/m
³] Ammonium
0.0
0.2
0.4
0.6
0.8
1.0
1.2
1.4
1.6
1.8
0,05-0,14 0,14-0,42 0,42-1,2 1,2-3,5 3,5-10
Par
ticl
e m
ass
con
cen
trat
ion
[µ
g/m
³]
Results of BERNER-type-impactor measurements for all 13 measured days in Summerand 15 measured days in Winter (3)
0.0
0.5
1.0
1.5
2.0
2.5
3.0
3.5
4.0
4.5
5.0
0,05-0,14 0,14-0,42 0,42-1,2 1,2-3,5 3,5-10
Par
ticl
e m
ass
con
cen
trat
ion
[µ
g/m
³]
0.0
0.5
1.0
1.5
2.0
2.5
3.0
3.5
4.0
4.5
5.0
0,05-0,14 0,14-0,42 0,42-1,2 1,2-3,5 3,5-10
Par
ticl
e m
ass
con
cen
trat
ion
[µ
g/m
³]Nitrate
0.0
0.1
0.2
0.3
0.4
0.5
0.6
0.7
0.8
0.9
0,05-0,14 0,14-0,42 0,42-1,2 1,2-3,5 3,5-10
Par
ticl
e m
ass
con
cen
trat
ion
[µ
g/m
³]
0.0
0.1
0.2
0.3
0.4
0.5
0.6
0.7
0.8
0.9
0,05-0,14 0,14-0,42 0,42-1,2 1,2-3,5 3,5-10
Par
ticl
e m
ass
con
cen
trat
ion
[µ
g/m
³]Chloride
Results of BERNER-type-impactor measurements for all 13 measured days in Summerand 15 measured days in Winter (4)