Some possible interpretations from data of the CODALEMA experiment P. Lautridou, O. Ravel, A. Rebai, and A. Lecacheux Citation: AIP Conf. Proc. 1535, 99 (2013); doi: 10.1063/1.4807529 View online: http://dx.doi.org/10.1063/1.4807529 View Table of Contents: http://proceedings.aip.org/dbt/dbt.jsp?KEY=APCPCS&Volume=1535&Issue=1 Published by the American Institute of Physics. Additional information on AIP Conf. Proc. Journal Homepage: http://proceedings.aip.org/ Journal Information: http://proceedings.aip.org/about/about_the_proceedings Top downloads: http://proceedings.aip.org/dbt/most_downloaded.jsp?KEY=APCPCS Information for Authors: http://proceedings.aip.org/authors/information_for_authors Downloaded 29 May 2013 to 134.158.25.228. This article is copyrighted as indicated in the abstract. Reuse of AIP content is subject to the terms at: http://proceedings.aip.org/about/rights_permissions
Transcript
Some possible interpretations from data of the CODALEMA experimentP. Lautridou, O. Ravel, A. Rebai, and A. Lecacheux Citation: AIP Conf. Proc. 1535, 99 (2013); doi: 10.1063/1.4807529 View online: http://dx.doi.org/10.1063/1.4807529 View Table of Contents: http://proceedings.aip.org/dbt/dbt.jsp?KEY=APCPCS&Volume=1535&Issue=1 Published by the American Institute of Physics. Additional information on AIP Conf. Proc.Journal Homepage: http://proceedings.aip.org/ Journal Information: http://proceedings.aip.org/about/about_the_proceedings Top downloads: http://proceedings.aip.org/dbt/most_downloaded.jsp?KEY=APCPCS Information for Authors: http://proceedings.aip.org/authors/information_for_authors
Downloaded 29 May 2013 to 134.158.25.228. This article is copyrighted as indicated in the abstract. Reuse of AIP content is subject to the terms at: http://proceedings.aip.org/about/rights_permissions
Some possible interpretations from data of the CODALEMAexperiment
P. Lautridou∗, O. Ravel∗, A. Rebai∗ and A. Lecacheux†
∗SUBATECH, Univ. de Nantes-Ecole des Mines de Nantes-CNRS, 4 rue A. Kastler, 44307 Nantes, France.†LESIA, USN de Nançay, Obs. de Paris-Meudon-CNRS, 5 place J. Janssen, 92195 Meudon, France.
Abstract. The purpose of the CODALEMA experiment, installed at the Nançay Radio Observatory (France), is to study theradio-detection of ultra-high-energy cosmic rays in the energy range of 1016−1018 eV. Distributed over an area of 0.25 km2,the original device uses in coincidence an array of particle detectors and an array of short antennas, with a centralizedacquisition. A new analysis of the energy-reconstruction from radio data is presented for this system, taking into accountthe geomagnetic effect. Since 2011, a new array of radio-detectors, consisting of 60 stand-alone and self-triggered stations,has been in deployment over an area of 1.5 km2 around the original detection device. This new development leads to specificchallenges in terms of recognition of cosmic rays or wave-front analysis.
The radio-detection of ultra-high-energy cosmic rays(UHECR) may be considered as one of the future toolslikely to supplement the traditional measures of ex-tensive air showers (EAS) [1]. This method exploits,through antennas, the radio signal that accompanies thedevelopment of the EAS. Many results have highlightedits feasibility and its potential in reconstructing severalparameters, such as the arrival direction, the impact lo-cation, or the radio lateral-distribution function of theelectric field (RLDF) [2, 3, 4]. However, except for a re-cent study [5], the estimation of the energy through theradio technique has been only briefly discussed [6, 7], al-though this step is unavoidable if one really plans to usethis technique. Similarly, the radio wavefront characteris-tics remain poorly determined [8, 9, 10], although knowl-edge of them could be consider as one of the first stepsin retrieving information about the EAS itself. These is-sues motivate the development and the continuation ofdemonstrative experiments, such as CODALEMA [11].This paper summarizes some new results, especially re-garding the energy estimator [12] and the point source ofthe radio emission [13].
2. EXPERIMENTAL SETUPS
This study of the energy response with radio data in CO-DALEMA has been based on the original setup whichuses a centralized trigger [14]. It consists of two arraysof detectors (fig. 1): an antenna array of 24 short activedipoles distributed on a cross of 600×500 m and a par-
ticle detector array of 17 plastic scintillator plates spreadover a square grid of 340×340 m. The antennas operatein the frequency bandwidth 1− 200 MHz. Each scintil-lating detector is observed by 2 photomultipliers (one athigh gain, the other at low gain) so as to cover an overalldynamic range of 0.3 to 3000 vertical equivalent muons(VEM). The trigger system is provided by the coincident
FIGURE 1. Aerial view of the CODALEMA setup installedat Nançay. On the original system, the plastic scintillators arerepresented by blue circles, while yellow and orange circlesrepresent the dipole antennas, placed respectively in the EWand NS directions. The white squares show the locations of theautonomous stations of the new array in deployment (33 arecurrently in operation).
detection of the five central particle detectors, leading toa detection threshold around 1015.7 eV. For each trigger,all the sensor signals are digitized at a sampling rate of1 GS/s (snapshot of 2.56 μs).
5th International Workshop on Acoustic and Radio EeV Neutrino Detection ActivitiesAIP Conf. Proc. 1535, 99-104 (2013); doi: 10.1063/1.4807529
Downloaded 29 May 2013 to 134.158.25.228. This article is copyrighted as indicated in the abstract. Reuse of AIP content is subject to the terms at: http://proceedings.aip.org/about/rights_permissions
During the off-line analysis, each radio transient issearched in the radio waveform through the 24−82MHzbandwidth, from which the electric-field peak value andthe arrival time are extracted. If more than 3 radiotransients are detected in coincidence, the arrival direc-tion of the electric field (zenith angle θ , azimuth an-gle φ ) is reconstructed by considering a planar wave-front. Assuming a RLDF for the electric field of the formε0 exp(−d/d0) [15], four additional observables are de-rived: the electric field magnitude at the radio showercenter ε0, the slope parameter of the electric field d0,and the impact location of the radio shower center onthe ground (x0,y0). The standard deviation of the noiseon each antenna is used as the error on the electric fieldmeasurements. From Monte-Carlo simulations, an meanerror of 22 % is estimated for ε0. The timing error hasbeen evaluated to be 10 ns, leading to an angular accu-racy of reconstructed arrival directions in the range ofone degree.Meanwhile, the arrival direction of the particle front (as-sumed planar) is computed from the relative arrival timeof each particle detector, and an analytical NKG lateraldistribution [16] is adjusted on the measured particledensities in the shower frame. If the shower core posi-tion falls inside the particle detector array, the event is re-ferred to as “internal” and an adjusted NKG distributionis used to deduce the primary energy using the constant-intensity cut (CIC) method [17]. This processing leadsto a “particle” energy resolution of the order of 30 % at1017 eV.A coincidence below 100 ns in time and 20◦ in arrivaldirection with a “particle” event is used to identify a“radio” event as originating from an EAS. By select-ing the “radio” zenith angles below 60◦, and the ener-gies above 1016.7 eV for the events “particle”, 376 coin-cidences were available for studies of the “radio” energy,discussed in section 3.This study of the wavefront features has been based onthe new autonomous setup made of self-triggered an-tenna stations (see [18]). The latter are based both ontwo butterfy antennas and on embedded electronics. Thepurpose of this new array is to complete the initial con-figuration, providing finer measurements of the electricfield (with two polarized receivers per station: EW andNS), better SNR, and an increased range in energy, us-ing a larger area. 33 stations are currently in operationaround the original setup. Ultimately, this apparatus willcover an area of 1.5 km2, with the additional aim of en-suring that the technique is reliable and mature whenused with a large infrastructure. Up to now, efforts aremostly focused on the radio-sources observed using theself-triggering technique. The interpretations of these ob-servations are central to the fourth section of the contri-bution. The events are built from the time coincidencesbetween the stations using the GPS time.
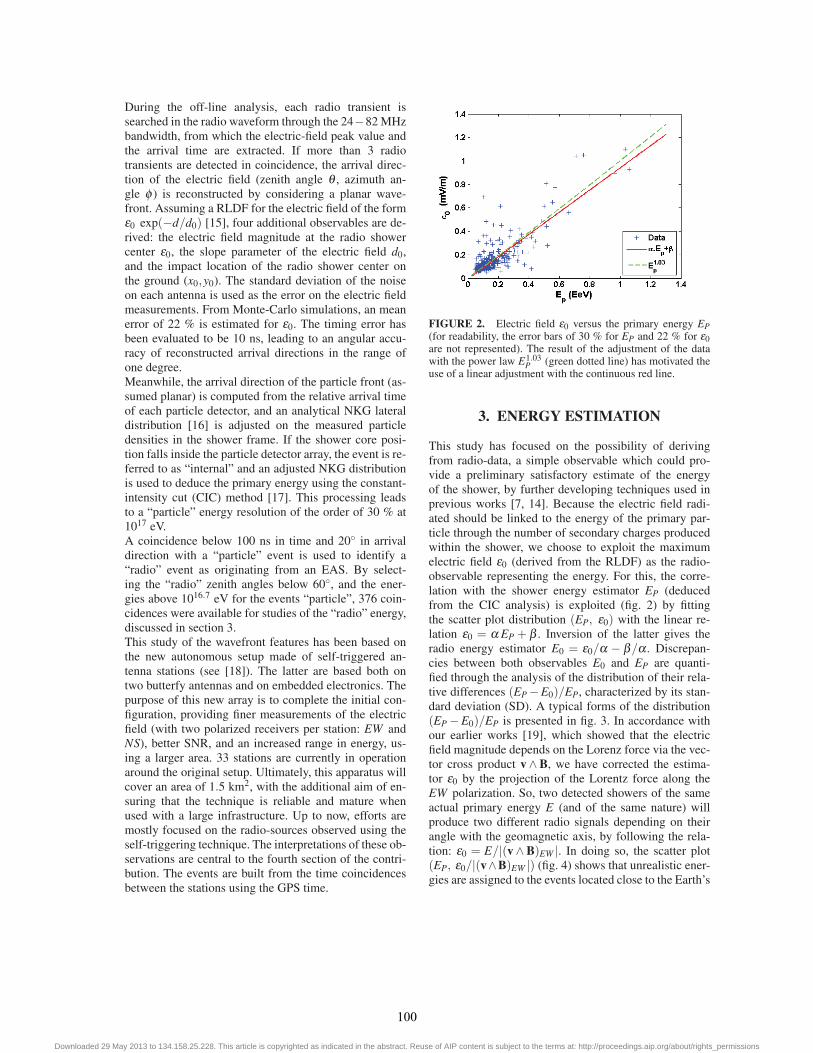
FIGURE 2. Electric field ε0 versus the primary energy EP(for readability, the error bars of 30 % for EP and 22 % for ε0are not represented). The result of the adjustment of the datawith the power law E1.03
P (green dotted line) has motivated theuse of a linear adjustment with the continuous red line.
3. ENERGY ESTIMATION
This study has focused on the possibility of derivingfrom radio-data, a simple observable which could pro-vide a preliminary satisfactory estimate of the energyof the shower, by further developing techniques used inprevious works [7, 14]. Because the electric field radi-ated should be linked to the energy of the primary par-ticle through the number of secondary charges producedwithin the shower, we choose to exploit the maximumelectric field ε0 (derived from the RLDF) as the radio-observable representing the energy. For this, the corre-lation with the shower energy estimator EP (deducedfrom the CIC analysis) is exploited (fig. 2) by fittingthe scatter plot distribution (EP, ε0) with the linear re-lation ε0 = α EP + β . Inversion of the latter gives theradio energy estimator E0 = ε0/α − β/α . Discrepan-cies between both observables E0 and EP are quanti-fied through the analysis of the distribution of their rela-tive differences (EP−E0)/EP, characterized by its stan-dard deviation (SD). A typical forms of the distribution(EP−E0)/EP is presented in fig. 3. In accordance withour earlier works [19], which showed that the electricfield magnitude depends on the Lorenz force via the vec-tor cross product v∧B, we have corrected the estima-tor ε0 by the projection of the Lorentz force along theEW polarization. So, two detected showers of the sameactual primary energy E (and of the same nature) willproduce two different radio signals depending on theirangle with the geomagnetic axis, by following the rela-tion: ε0 = E/|(v∧B)EW |. In doing so, the scatter plot(EP, ε0/|(v∧B)EW |) (fig. 4) shows that unrealistic ener-gies are assigned to the events located close to the Earth’s
100
Downloaded 29 May 2013 to 134.158.25.228. This article is copyrighted as indicated in the abstract. Reuse of AIP content is subject to the terms at: http://proceedings.aip.org/about/rights_permissions
FIGURE 3. Distribution (EP −E0)/EP obtained after cali-bration and for the full sample of events (blue crosses). Thestandard deviation is 31 % with c= 0.95 (see below). The solidline shows a Gaussian fit made in the interval [−1,1].
FIGURE 4. Scatter plot of the corrected electric fieldε0/|(v∧B)EW | versus the primary energy EP . The linear ad-justment is represented by the solid line. The arrows show someof the typical over-corrected events. The systematic analysis oftheir features indicates that all these events have arrival direc-tions near the earth’s magnetic field direction (|(v∧B)EW | <0.1). (These points are removed for the linear fit of the scatterplot).
magnetic field direction (|(v∧B)EW | < 0.1), while theirCIC energies show nothing unusual. The original distri-bution of (|(v∧B)EW | versus EP is presented fig. 5.To account for this, we hypothesized that the observedelectric field ε0 can also be proportional to the actualshower energy E (to produce observable signals, espe-cially when the Lorentz contribution becomes weak).This suggests modifying ε0 to ε0/(|(v ∧ B)EW | + c)where c is a scalar quantity. With the quantity |(v∧B)EW |ranging from 0 to 1, c = 0 corresponds to a purely geo-magnetic contribution, while a high c value (e.g. c > 6)
FIGURE 5. Distribution of |(v∧B)EW | versus the primaryenergy EP for the raw sample of events.
FIGURE 6. Evolution of the Standard Deviation of the dis-tribution (EP − E0)/EP with the correction factor 1/(|(v ∧B)EW |+ c) as a function of c and for several windows of|(v ∧ B)EW |. The blue line (with the crosses) represents thewhole sample of events. The stars located at c= 10 indicate thevalues of the SD without correction. The SD errors are given
by√2σ2/
√N−1 (N ≈ 70 for the subsets).
should represent the case for which the geomagneticemission becomes negligible compared to the second ef-fect. A high c value must induce a behavior similar tothat observed without correction. The figure 6 presentsthe standard deviation of (EP − E0)/EP as a functionof c and for several bins in |(v∧B)EW |. The observedvariations of the SD as a function of c (fig. 6) suggeststrongly that the radio signal is made of the mixtureof several emission effects. Because the observable ε0seemed sensitive enough to different contributions, itsassociation with another actual electric field componentwas then studied, for instance to an electric field com-ponent whose orientation would be linked to the radioshower axis. To examine this possibility, we changed the
101
Downloaded 29 May 2013 to 134.158.25.228. This article is copyrighted as indicated in the abstract. Reuse of AIP content is subject to the terms at: http://proceedings.aip.org/about/rights_permissions
FIGURE 7. Evolution of the Standard Deviation of the dis-tribution (E0 − EP)/EP with the correction factor 1./(|(v ∧B)EW |+c |sinθ sinφ |) as a function of c and for several valuesof |(v∧B)EW |. The blue line (with the crosses) represents thewhole sample of events. The stars located at c = 10 give thevalue of the SD without correction.
term c by: ε0 = E|(v∧B)EW |+E c|sinθ sinφ |. The ef-fect of this correction is depicted in fig. 7, which presentsthe standard deviation of (EP−E0)/EP as a function ofc and for the same windows as in |(v∧B)EW |. A worsestandard deviation is obtained, which leads us to excludethe scenario of a longitudinal contribution, relative to theshower axis.Some recent developments [4, 20, 21] indicate how-
ever that the simple correction with c could still be feasi-ble. For instance, the charge excess mechanism could bein qualitative agreement with the presented effects. In-deed, this emission depends on the charges produced inthe shower (and hence on the energy) and its weight inthe total emission process should increase when the ge-omagnetic contribution decreases. On the other hand, aCherenkov contribution in the frequency range of hun-dreds of MHz is also expected to produce a componentindependent of the geomagnetic angle, although our datado not suggest this contribution in the RLDFs. From an-other view, our result could also suggest a coherenceeffect modulated by the Lorentz force. The coherencemechanism should increase when the secondary parti-cles are less dispersed by the Lorentz force (i.e. at small|(v∧B)EW |) during their propagation.
4. SOURCE RECONSTRUCTION
Due to its potential link with the quantity Xmax, the re-construction of the apparent point source of the emissioncould be one of the significant key-points in the develop-ment of radio-detection [8]. Because the arrival timing oneach antenna is determined at the maximum amplitude of
FIGURE 8. Typical result of reconstruction of two entropicemitters at ground (black dots), observed with the stand-alonestations of CODALEMA (red circles), through a standard min-imization algorithm. Despite the spreading of the reconstructedpositions, both actual transmitters are stationary point sources.Such patterns are also commonly observed in others radio ex-periments [24].
the radio signal, itself dominated by the maximum of theshower [22], this observable should therefore be linked tothis part of the longitudinal development of the shower.The assumption of a spherical wavefront then gives, in anatural way, an efficient tool to find the position of thischaracteristic emission time. Moreover, the self-triggertechnique in radio can be subject to delicate limitationsin regard to UHECR recognition, due to noise-source in-terference (e.g. from human activities, lightnings duringstormy conditions). In this context, the identification ofthe positions of each source of emission is crucial. Forsources outside of the setup, this identification can onlybe achieved by using a curved wavefront.For a spherical wavefront, the commonly used tech-
nique to extract the curvature radius relies on the calcu-lation of the χ2 function, using the arrival times and thelocations of the antennas, by minimizing the quantity:
χ2(�rs, ts) = ∑i
[‖−→rs −−→ri ‖2− c2 (ts− ti)
2]2, with (−→ri , ti)
the location and reception time of the ith antenna; (−→rs , ts)the searched location and unknown instant of emissionof the emitting source; and c the wave velocity, here con-sidered constant.Figure 8 shows a typical reconstruction of sources ob-tained with CODALEMA, by invoking such a minimiza-tion of a spherical wave with a Levenberg-Marquardt(LVM) algorithm. The source positions are poorly re-constructed, although they are fixed and the number ofevents is high. Additional simulations showed that nomatter the samples (versus any distances and arrival di-rections of source, time resolutions, initial conditions,and detector configurations), different algorithms (LVM,Simplex, Line-search) lead to similar conclusions (seefig. 9). This suggests that the chosen chi-square functionis ill-adapted to the minimization algorithms.
102
Downloaded 29 May 2013 to 134.158.25.228. This article is copyrighted as indicated in the abstract. Reuse of AIP content is subject to the terms at: http://proceedings.aip.org/about/rights_permissions
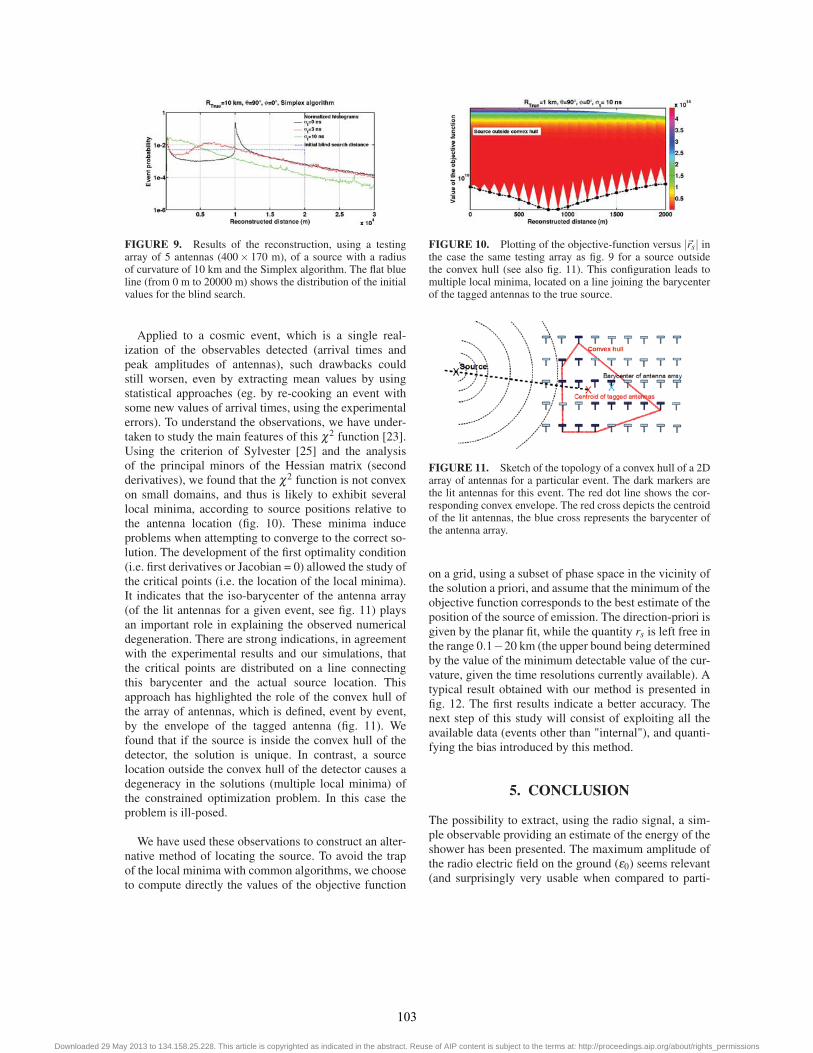
FIGURE 9. Results of the reconstruction, using a testingarray of 5 antennas (400× 170 m), of a source with a radiusof curvature of 10 km and the Simplex algorithm. The flat blueline (from 0 m to 20000 m) shows the distribution of the initialvalues for the blind search.
Applied to a cosmic event, which is a single real-ization of the observables detected (arrival times andpeak amplitudes of antennas), such drawbacks couldstill worsen, even by extracting mean values by usingstatistical approaches (eg. by re-cooking an event withsome new values of arrival times, using the experimentalerrors). To understand the observations, we have under-taken to study the main features of this χ2 function [23].Using the criterion of Sylvester [25] and the analysisof the principal minors of the Hessian matrix (secondderivatives), we found that the χ2 function is not convexon small domains, and thus is likely to exhibit severallocal minima, according to source positions relative tothe antenna location (fig. 10). These minima induceproblems when attempting to converge to the correct so-lution. The development of the first optimality condition(i.e. first derivatives or Jacobian = 0) allowed the study ofthe critical points (i.e. the location of the local minima).It indicates that the iso-barycenter of the antenna array(of the lit antennas for a given event, see fig. 11) playsan important role in explaining the observed numericaldegeneration. There are strong indications, in agreementwith the experimental results and our simulations, thatthe critical points are distributed on a line connectingthis barycenter and the actual source location. Thisapproach has highlighted the role of the convex hull ofthe array of antennas, which is defined, event by event,by the envelope of the tagged antenna (fig. 11). Wefound that if the source is inside the convex hull of thedetector, the solution is unique. In contrast, a sourcelocation outside the convex hull of the detector causes adegeneracy in the solutions (multiple local minima) ofthe constrained optimization problem. In this case theproblem is ill-posed.
We have used these observations to construct an alter-native method of locating the source. To avoid the trapof the local minima with common algorithms, we chooseto compute directly the values of the objective function
FIGURE 10. Plotting of the objective-function versus |�rs| inthe case the same testing array as fig. 9 for a source outsidethe convex hull (see also fig. 11). This configuration leads tomultiple local minima, located on a line joining the barycenterof the tagged antennas to the true source.
FIGURE 11. Sketch of the topology of a convex hull of a 2Darray of antennas for a particular event. The dark markers arethe lit antennas for this event. The red dot line shows the cor-responding convex envelope. The red cross depicts the centroidof the lit antennas, the blue cross represents the barycenter ofthe antenna array.
on a grid, using a subset of phase space in the vicinity ofthe solution a priori, and assume that the minimum of theobjective function corresponds to the best estimate of theposition of the source of emission. The direction-priori isgiven by the planar fit, while the quantity rs is left free inthe range 0.1−20 km (the upper bound being determinedby the value of the minimum detectable value of the cur-vature, given the time resolutions currently available). Atypical result obtained with our method is presented infig. 12. The first results indicate a better accuracy. Thenext step of this study will consist of exploiting all theavailable data (events other than "internal"), and quanti-fying the bias introduced by this method.
5. CONCLUSION
The possibility to extract, using the radio signal, a sim-ple observable providing an estimate of the energy of theshower has been presented. The maximum amplitude ofthe radio electric field on the ground (ε0) seems relevant(and surprisingly very usable when compared to parti-
103
Downloaded 29 May 2013 to 134.158.25.228. This article is copyrighted as indicated in the abstract. Reuse of AIP content is subject to the terms at: http://proceedings.aip.org/about/rights_permissions
FIGURE 12. Histogram of the minima obtained by comput-ing the values of the objective function over a grid, for the re-construction of a source located at 10 km and an antenna arrayidentical to that used in fig. 9.
cles detectors). We show that this observable is sensi-tive to different mechanisms causing the radio signal. Wedemonstrate that the only correction by the geomagneticeffect would lead to an over-evaluation of the energy ofthe EAS. We deduce that a further contribution is also atthe origin of the formation of the radio signal. In a firstinterpretation, effects like coherence, charge excess, orCerenkov emission could play a significant role in theobserved amplitude modulation. More data should obvi-ously improve the proposed approach, but given the re-sults, the radio signal may be sufficiently sensitive to thelongitudinal evolution of the shower to contain valuableinformation on the nature of the primary.In the second part, we addressed the problem of theapparent point of emission in radio, by reconstructingspherical wavefronts. Indeed, the experimental results in-dicated that the usual methods of minimization of spher-ical wavefronts could induce a mis-localization of theemission sources. The specific characteristics of the χ2function can lead to the formulation of an ill-posed prob-lem, in the sense of minimization methods under con-straints. The conventional algorithms can exhibit a de-generacy in the solutions, due to the presence of severallocal minima. To avoid possible traps in these minima,we tried a simple method. It is based on a grid calcu-lation of the function χ2 and the search for an absoluteminimum in a phase space fixed a priori. Further devel-opments and tests will undoubtedly still be needed to usethe method routinely.
ACKNOWLEDGMENTS
The authors acknowledge the support of the French“Agence Nationale de la Recherche” (grant ANR-NT05-2-42808), and the support of the “Région Pays de laLoire” (grant 2007/10135).
REFERENCES
1. UHECR2012 Symposium, CERN, Feb. 2012, Book ofabstracts, http://2012.uhecr.org.
2. D. Ardouin, et al., Astropart. Phys. 26, (2006), pp.341–350.
3. W. D. Apel, et al., Astropart. Phys. 32, (2010), pp.294–303.
4. V. Marin for the CODALEMA collaboration, “Chargeexcess signature in the CODALEMA data, Interpretationwith SELFAS2”, in Proc. of the 32nd ICRC (Beijing,China), 2011.
5. C. Glaser et al., “Energy Estimation for CosmicRays Measured with the Auger Engineering RadioArray”, in Proc. of the ARENA 2012 workshop(Erlangen, Germany), AIP Conference Proceedings, tobe published.
6. A. Horneffer, et al., “Primary Particle Energy Calibrationof the EAS Radio Pulse Height”, in Proc. of the 30thICRC (Mérida, mexico), 2007.
7. O. Ravel for the CODALEMA collaboration, Nucl. Instr.and Meth. A662, (2012), pp. S89-S94 .
8. S. Lafebre, et al., Astropart. Phys. 34, (2010), pp. 12–17.9. D. Ardouin et al., Astropart. Phys. 34, (2011), pp.
717–731.10. K. Weidenhaupt for the Pierre Auger Collaboration,
“AERA - The Auger Engineering Radio Array”, inXIV Vulcano Workshop (Vulcano, Italy), 2012, to bepublished in Acta Polytechnica.
11. D. Ardouin, et al., Nucl. Instr. and Meth. A555, (2005),148.
12. A. Rebai et al., arXiv:1210.1739v1, [astro-ph.HE], Oct.2012.
13. A. Rebai et al., arXiv:1208.3539v2, [astro-ph.IM], Sept.2012.
14. P. Lautridou for the CODALEMA collaboration, Nucl.Instr. and Meth. A604, (2009), pp. S13–S19.
15. H.R. Allan, “Progress in elementary particle and cosmicray physics”, ed. by J.G. Wilson and S.A. Wouthuysen,North Holland, 1971, pp. 169–302.
16. T. G. Gaisser, “Cosmic Rays and Particle Physics”,Cambridge University Press 1990.
17. A. A. Chilingarian, et al., “Investigation of extensiveair shower development using large slant depth ofatmosphere”, in Proc of the 27th ICRC (Hamburg,Germany), 2001.
18. P. Lautridou for the CODALEMA collaboration, Nucl.Instr. and Meth. A692, (2012), pp. 65–71.
19. D. Ardouin et al, Astropart. Phys. 31, (2009), pp.192–200.
20. K. D. de Vries, A. M. van den Berg, O. Scholten, K.Werner, Phys. Rev. Lett., 107:061101, (2011).
21. K. Werner, K. D. De Vries, and O. Scholten,arXiv:1201.4471v1 [astro- ph.HE], Jan. 2012.
22. V. Marin et al., Asptropart. Phys., ISSN 0927-6505,10.1016/j.astropartphys.2012.03.007.
23. J. F. Bonnans et al., “Numerical Optimization:Theoretical and Practical Aspects”, Springer-Verlag,Universitext, (second ed.) 2003.
24. L. Mohrmann, “Measurement of Radio Emission fromCosmic Ray induced Air Showers at the Pierre AugerObservatory with a Spherical Wave Reconstruction”,Masterarbeit in Physik, Univ. of Aachen, 2011.
25. R. A. Horn, C. R. Johnson, “Matrix Analysis”,Cambridge University Press, (first ed. 1985) 1999.
104
Downloaded 29 May 2013 to 134.158.25.228. This article is copyrighted as indicated in the abstract. Reuse of AIP content is subject to the terms at: http://proceedings.aip.org/about/rights_permissions


![Current status of the CODALEMA/EXTASIS experiments · EXTASIS, triggered by the CODALEMA scintillators, detects since 2016 the air shower electric eld in [1;6] MHz. We also expect](https://static.documents.pub/doc/80x56/60bad6563682363d04139d27/current-status-of-the-codalemaextasis-experiments-extasis-triggered-by-the-codalema.jpg)