1 Private Politics and Environmental Management** Sonam Gupta a and Robert Innes b,* a IMPAQ International, Philadelphia, PA, United States b Economics Department and Tony Coelho Chair of Public Policy, U.C. Merced, Merced, CA 95344, United States Abstract We study determinants and effects of two types of private political actions (PPAs) against S&P 500 companies: environmental boycotts and shareholder proxy proposals. We consider effects on the firms’ adoption of environmental management systems (EMS) and the environmental protocol, ISO 14001. We find that PPAs have a significant impact on firms’ environmental management decisions and, consistent with Baron (2009), that a company’s likelihood of experiencing a PPA is higher if it is a “receptive target” that has a reputation for social responsibility. Keywords: Environmental management, private politics, boycotts, proxy challenges, corporate social responsibility JEL Codes: Q53, D70 *Corresponding Author. FAX: (209) 228-4007. email address: [email protected](R. Innes).
Transcript
1
Private Politics and Environmental Management**
Sonam Guptaa and Robert Innesb,*
a IMPAQ International, Philadelphia, PA, United States
b Economics Department and Tony Coelho Chair of Public Policy, U.C. Merced, Merced, CA
95344, United States
Abstract
We study determinants and effects of two types of private political actions (PPAs) against S&P
500 companies: environmental boycotts and shareholder proxy proposals. We consider effects
on the firms’ adoption of environmental management systems (EMS) and the environmental
protocol, ISO 14001. We find that PPAs have a significant impact on firms’ environmental
management decisions and, consistent with Baron (2009), that a company’s likelihood of
experiencing a PPA is higher if it is a “receptive target” that has a reputation for social
This paper is motivated by two recent trends in corporate environmentalism. First is the
increasing use of private political tools and activism to promote environmental objectives. For
example, the number of on-going environmental and animal rights boycotts of companies and
organizations grew from twenty-seven at the end of 1990 (National Boycott News, Winter 1992-
93) to forty-three in 2011 (www.ethicalconsumer.org). Environmental proxy actions have also
been on the rise; the number of environment-related shareholder proposals increased from an
average of 26.7 per year in 1988-1990 to 67.3 per year in 2004-6.
Second is the growth in voluntary approaches to pollution management. Increasingly,
private sector firms voluntarily adopt environmental management practices not required by
regulators. One symptom of this phenomenon is company participation in an expanding array of
voluntary pollution control programs. Some programs are government-initiated (such as the
Environmental Protection Agency’s 33/50 and Green Lights programs). Others are sponsored by
private organizations of either activists (such as the Forest Stewardship Council) or industry
coalitions (such as Responsible Care) or both (such as the Marine Stewardship Council).
Each of these two trends has, individually, spurred recent academic interest and study. In
this paper, we examine both phenomena and links between them for a defined set of large firms
(the S&P 500). We focus on two private political tools, environment-related boycotts and
shareholder proxy proposals, and three indicators of environmental management. Two indicators
are based on adoption of Environmental Management Systems (EMS’s) as reported in surveys
by the Investor Responsibility Research Center (IRRC); the first is for adoption of any EMS
(including environmental audit programs and managerial compensation for environmental
progress); the second is for adoption of a specific EMS generally cited as the most
3
comprehensive program among those reported to the IRRC: Total Quality Environmental
Management (TQEM).1 These programs represent industry-sponsored initiatives from the early
1990’s. The remaining indicator is for certification under the environmental protocols of the
International Organization of Standards, ISO 14001, in the late 1990’s and early 2000’s. ISO
14001 is a rigorous set of environmental management standards designed and developed in 1996
by the ISO, an international organization of industry and government representatives. Both ISO
14001 and TQEM can be wide-ranging in their effects (Lave, et al., 1997; MPCA, 2009),
involving systematic changes to pollution control practices, staffing patterns, audit systems,
production processes, and internal operating protocols.
We address two main questions. What determines whether or not a firm is targeted for an
environmental boycott or shareholder proxy action? And what effect do these private political
actions (PPAs) have on firms’ decisions to adopt environmental management practices? The
first question concerns determinants of PPAs, and the second concerns effects of PPAs.
In addressing the first question, we study impacts of regulatory activity, local community
considerations, and perhaps most importantly, firms’ reputations for being “receptive” or
“resistant” targets, on boycott and proxy target selection. Do environmental organizations tend
to focus on socially progressive firms, those with reputations for socially responsible conduct,
whether due to consumer pressures or managerial preferences? Or do they tend to target less
progressive firms with poor reputations for Corporate Social Responsibility (CSR)? Baron
(2009) predicts that public interest / non-governmental organizations (NGOs) will tend to target
progressive firms that are more responsive to public pressure for environmental improvement.
1 Total Quality Environmental Management (TQEM) was first introduced in 1992 by the Global Environmental Management Initiative (GEMI), a coalition of 21 companies including IBM, AT&T and Kodak, formed in 1990. TQEM views pollution as a quality defect to be continuously reduced through the development of products and processes that minimize waste generation at source. See www.bsdglobal.com/tools/systems_TQEM.asp.
4
Such a strategy reflects an NGO concern for effects of private politics on environmental conduct,
as opposed to publicity, exposure and contributions.
An NGO may also target “receptive” firms in order to claim credit for pro-environmental
firm conduct that would occur even absent private political action. However, controlling for a
variety of firm attributes – including the reputation for CSR – we find that boycotts are a
significant spur to adoption of EMS systems (as reported to the IRRC), but also a significant
deterrent to ISO 14001 certification. Surprisingly, even though shareholder proxy proposals are
never successful in our data – not one of them passed a vote of the shareholders – we find that
these actions are a significant spur to both ISO 14001 and TQEM adoption.
A common theme in these results is that environmental PPAs affect firm-level
environmental management decisions. However, the nature of these effects can differ across
PPA media (boycotts vs. proxies) and across environmental practices (IRRC-reported practices
vs. ISO 14001). Different effects across media may be due to different actors, as well as
different levels of intensity and cost of the two types of PPA – both to targeted firms and for
targeting organizations. Proxy challenges are predominantly launched by religious
organizations, individuals, and investment funds, whereas boycott campaigns that are more
costly to wage are predominantly launched by public interest groups that have the resources and
skills to organize consumers and communities. Different effects of boycotts on IRRC-reported
practices vs. ISO 14001 may be due to evolving views of environmental NGOs toward industry-
sponsored environmental management programs from the time of the IRRC surveys (in the early
1990’s) to firms’ ISO 14001 decisions (between 1996 and 2003 in our data). By the time of the
ISO program, anecdotal evidence suggests that NGOs viewed ISO 14001 as not only a “weak
sword” (Potoski and Prakash, 2005), but tantamount to “greenwash” (ecologia.org, 2000). If so,
environmental boycotts by NGOs might be expected to divert a firm’s environmental efforts
5
away from ISO registration. Religious organizations and investment clienteles behind proxy
challenges are likely to be less skeptical of industry-sponsored initiatives (like ISO 14001) and
perhaps more pragmatic in their assessment of its potential benefits.
Despite a burgeoning theoretical literature on private politics,2 we build upon a
surprisingly small empirical literature on this subject.3 Most closely related to our work are
Eesley and Lenox (2006) and Lenox and Eesley (2009), who study a range of private political
actions, including proxy challenges, letter writing campaigns, boycotts, protests, and civil suits,
all with an environmental focus.4 Both papers study how these different political actions affect
firms’ decisions to accede to the specific demands of the targeting campaign. They find that, for
targeted firms, stronger tactics are more effective in achieving firm compliance; letter writing
campaigns are more effective than proxy challenges, and boycotts, protests and civil suits are all
more effective than letter-writing campaigns. In addition, stronger targeting organizations (for
example, NGOs vs. religiously affiliated groups) are more effective in eliciting compliance.
Lenox and Eesley (2009) also study determinants of targeting organizations’ choices of
tactics and determinants of whether – and how many times – a firm in a broad sample of firms
was targeted during their 1988-2003 sample period.5 In the latter estimation, Lenox and Eesley
(2009) do not distinguish between the different action types, rather aggregating them into the
number of all actions targeted to any given firm. They find that larger firms with larger toxic
emissions, and smaller levels of cash that could be used to fight a private political campaign, are
2 See, for example, Baron (2001, 2009), Feddersen and Gilligan (2001), Besley and Ghatak (2007), Innes (2006). 3 There are a number of event studies that examine whether boycott announcements lead to negative effects on targets’ stock prices. See , for example, King and Soule (2007) and Epstein and Schnietz (2002). The evidence is mixed, but generally supports the hypothesis that boycotts harm stock prices. 4 Another key paper is Baron, Harjoto and Jo (2011), who study relationships between social pressure, corporate social performance, and corporate financial performance, but do not focus explicitly on determinants and effects of specific private political actions. See also Fernandez-Kranz and Santalo (KL, 2010) and Siegel and Viataliano (SV, 2007), who study how Corporate Social Responsibility (as measured by KLD indices) is affected by industry competitiveness (KL) and the nature of goods for sale (SV). 5 Lenox and Eesley (2009) consider the overall set of firms in the Compustat dataset, encompassing 3338 firms, 273 of which were targeted for an environmental campaign during their 1988-2003 sample period.
6
more likely to be targeted for a campaign and, when targeted, to face stronger tactics.
Beyond differences in data, our paper is distinguished in several key ways. First, on the
effects of PPAs, we study impacts on broader environmental practices of targeted firms, rather
than compliance with specific demands of the campaign. For example, the intent of shareholder
environmental proxy proposals is not literally to succeed (which they never do); instead,
presumably, it is to influence managerial thinking about environmental practices, including the
IRRC-reported EMS systems and ISO 14001 that we and others study. Although these
indicators are intermediate measures of environmental performance, substantial empirical work
documents their effectiveness in achieving ultimate pollutant reductions. For example, two
papers (Anton, et al., 2004; Sam, et al., 2009) identify salutary effects of EMS systems (as
reported to the IRRC) on firms’ toxic pollutant releases. Two others (Arimura, Hibiki, and
Katayama, 2008; Potoski and Prakash, 2005) find salutary effects of ISO 14001 registration on
environmental performance.6 In part motivated by this evidence, a number of papers study
adoption incentives for IRRC-reported EMS systems (Khanna and Anton, 2002; Anton, et al.,
2004; Sam, et al., 2009) and ISO 14001 (King, et al., 2005; Grolleau, Mzoughi, and Thomas,
2007; Delmas and Montiel, 2008, 2009; Gonzalez and Gonzalez, 2008). The key distinction of
our study, relative to this literature, is its focus on the effects of private politics.7
Second, also on the effects of PPAs, we address the potential endogeneity of targeting
choices. For example, firms may be targeted with more harmful PPAs when they are more likely
to address complaints of the targeting organization, whether or not a PPA is launched. In order
6 A third paper (King, Lenox, and Terlaak, 2005) finds a negative relationship between past ISO 14001 registration and future environmental performance. However, this conclusion may potentially reflect correlation (with high emission firms having the most to gain from ISO adoption), rather than causation. 7 To our knowledge, the only paper to incorporate private political variables is Delmas and Montiel (2008) who find mixed effects of a country’s number of NGOs on its rate of ISO 14001 certification in a cross-national study.
7
to impute causal effects of a PPA therefore requires attention to identification. Our identification
strategy is discussed in detail in Section 2 below.
Third, on both effects and determinants of PPAs, we measure impacts of social reputation
on a firm’s propensity to be targeted for a PPA and to adopt an EMS. In the former (targeting
choice) regressions these impacts shed light on Baron’s (2009) theory of private political action.
In the latter (EMS adoption) regressions, these controls are potentially key drivers of EMS
adoption and PPA targeting decisions; their inclusion is therefore crucial to identification of how
the latter (PPAs) affect the former (EMS adoption).
Fourth, on determinants of PPAs, we focus separately on each type of political tactic,
boycotts and proxy proposals, rather than on tactic aggregates (Lenox and Eesley, 2009, Table
VII). This distinction enables us to pinpoint distinct drivers of the two actions, which typically
involve different players and involve different costs to both targeting organizations and targeted
firms. In making this distinction, we find both common and distinct drivers of targeting choices.
Both types of action are favored for larger firms with larger market shares, for firms that are
more intensively inspected for compliance with Clean Air laws, and for firms with strong
reputations for corporate social responsibility (CSR). However, proxy actions are also favored
against “resistant targets” with particularly sketchy reputations for CSR and for firms in more
competitive industries. Because they are launched at low cost by less adversarial investor
clienteles, proxies may be more effective than boycotts in nudging the environmental choices of
“resistant targets” and more attractive as a means to call the company’s attention to its weak
environmental practices. Larger costs of waging boycotts may limit these campaigns to targets
which are more likely to respond, namely, “receptive targets” with strong records of CSR.
2. Econometric Models
We have two types of dependent variables in this paper, both measured by zero-one
8
dummy variables for firms in the S&P 500: (1) private political actions (PPAs) (environmental
boycotts and shareholder proxy actions), and (2) adoption of environmental management systems
(EMS). The PPAs indicate whether a firm is targeted for a PPA in a given year. The EMS
variables indicate whether a firm adopted an EMS, defined in three different ways: (1) any EMS
practice as reported to the IRRC in 1994-95 (variable name: IRRC-EMS), (2) TQEM, also as
reported to the IRRC (variable name: IRRC-TQEM), and (3) registration under ISO 14001 during
either 1996-99 (variable name: ISO96-99) or 1996-2003 (variable name: ISO96-03). The latter
two periods reflect early ISO adoption and corresponding longer-run decisions.
2.1. PPA Models
Panel models of PPA targeting are estimated by Random Effects Probit, reflecting an
underpinning “target value index” for firm i in time t:
PPA *it = α0 + β’ Xit + vit (1)
where vit = αi + εit, αi = unobserved random (normal) firm effect, εit = random (normal) errors,
and Xit = vector of time t covariates for firm i; the standard restrictions are assumed to apply.8 A
higher “target value index” leads targeting organizations to launch a PPA against the firm:
1 if PPA *it ≥0
PPAit = (2) 0 if PPA *
it <0
Equations (1)-(2) are estimated by maximum likelihood.
The Xit covariates in equation (1) are time-varying when possible, but also include some
cross-section indicators. Determinants of PPAs include indicators of firm size, market power,
nature of goods produced (whether or not in a final goods market), industry market structure
(concentration), intensity of environmental regulation (inspections), pollutant emissions, local
liability statutes (strict vs. negligence liability), other local circumstances (including socio-
economic indicators and a measure of the local environmentalist constituency), and reputation
for Corporate Social Responsibility (CSR), as well as industry and year fixed effects.
2.2. EMS Models
Cross-section models of EMS adoption are estimated by Probit, reflecting the
underpinning firm i “adoption benefit index,”
EMS *i = α + β’ Xi +γ Bi + η Pi + εi (3)
where Xi = vector of firm covariates, Bi = zero-one indicator for whether firm i is targeted for an
environmental boycott (over 1988-95), Pi = zero-one indicator for whether firm i is targeted for
an environmental proxy action (over 1988-95), and εi is a normally distributed error with the
usual properties.9 A higher “adoption benefit index” leads to EMS adoption:
1 if EMS *i ≥0
EMSi = (4) 0 if EMS *
i <0
Key variables of interest in equations (3)-(4) are the environmental PPAs, Bi (Boycott)
and Pi (Proxy). To the extent that EMS adoption is viewed by the PPA-targeting community as a
progressive, pro-environment firm strategy, we expect that environmental PPAs will promote a
targeted firm’s adoption of the EMS. The PPA can raise consumer and community awareness of
the company’s environmental practices, and thereby increase company benefits of desired
practices, both in the marketplace for green consumers and for improved public relations. In
addition, experiencing a PPA may raise a firm’s perceived exposure to NGO scrutiny – and the
associated risk of a future PPA; if so, a PPA might increase company incentives for EMS
adoption as a strategy to deter future environmental PPAs. However, this logic is reversed if an
9 Standard properties are: E(εi│Xi) =0, E(εi
2│Xi) = σ2, and E(εiεj│Xi)=0 (j≠i). Following standard practice, the constant variance assumption is made in estimation, but robust standard errors are constructed.
10
EMS is not viewed favorably by the PPA-targeting community.
While the foregoing indicates possible causal effects of a PPA on EMS adoption, a key
issue in estimating these models is the potential endogeneity of the PPAs, Bi and Pi.
Unaddressed, endogeneity would confound the causal interpretation of estimated PPA
coefficients in the EMS equation (4). In principle, endogeneity may be due to reverse causation
or correlated unobservables. With our PPAs measured over 1988-95 and the IRRC-EMS and
IRRC-TQEM adoption decisions measured for 1994-95, reverse causation is possible if PPA and
EMS adoption choices occur at roughly the same time. Estimated PPA effects on EMS adoption
could then be biased downwards – if EMS adoption deters PPAs by signaling good
environmental performance – or upwards, if EMS adoption promotes PPAs by signaling that the
firm is a “receptive target.” Alternately, more progressive firms may be more likely to be
targeted for an environmental PPA (Baron, 2009) and to adopt an EMS, leading to a problem of
correlated unobservables. In this case, estimated PPA effects could be biased upwards.
To address the potential endogeneity of the PPAs, we identify Boycotts and Proxy,
respectively, with the instruments Other Boycotts and Other Proxy. The instruments are dummy
variables that take a value of one if the firm is in an industry that had a non-environmental (non-
labor) boycott / proxy. A firm’s industry is defined by its primary three-digit SIC code.
Three criteria are relevant to judge the merits of these instruments. First, are the
instruments prior to (or contemporaneous with) EMS adoption so that the identifying variation is
logically causal? The IRRC-EMS / IRRC-TQEM indicators are measured for 1994-95, with the
TQEM approach only first introduced to the world in 1992 (www.gemi.org). We therefore
construct the instruments over the prior period 1988-91 for the IRRC-EMS / IRRC-TQEM
estimations. ISO 14001 was first introduced in 1996; we therefore measure the instruments over
1988-95 for the ISO96-99 and ISO96-03 estimations.
11
Second, are the instruments highly correlated with the environmental Boycott and Proxy
regressors (Stock and Yogo, 2005)? We present evidence that they are.10 Intuitively, industries
reflect a range of attributes that drive PPA targeting decisions, including proximity to consumers,
availability of substitutes, and investor clienteles (Smith, 1990).
Third, are the instruments irrelevant to the generating process for EMS adoption, other
than via their impact on the environmental PPAs? The most plausible mechanism for
confounding correlation – when unobservables drive both non-environmental boycotts and EMS
adoption – is the following: If a firm is progressive (or not) for non-environmental issues –
making it a potential target for non-environmental PPAs – then perhaps it is also likely to be
progressive (or not) for environmental issues and therefore more or less likely to adopt an EMS.
To control for this channel of effect (and also measure the impact of firm reputations for
Corporate Social Responsibility), we explicitly control for a firm’s CSR reputation using KLD
data on past socially progressive practices and challenges (excluding environmental issues).11
Our estimation strategy uses an instrumental variable method, two-stage residual
inclusion (2SRI), sometimes called the control function approach. Unlike standard two stage
estimators which use stage 1 fitted values for endogenous regressors, 2SRI has been shown to be
consistent in general non-linear models (Terza, et al., 2008). The 2SRI approach involves a first
stage estimation of equations for the endogenous regressors that reflects non-linearities in their
generating processes. From these estimations, residuals are calculated. The “main” second stage
estimation (of the EMS equation in the present case) then includes both the endogenous
10 A referee suggested alternative instruments that measure PPA intensity by industry. We considered the number of PPAs in the industry per firm, and the number of PPAs in the industry per dollar of Sales. Lamentably, neither performed well in first stage estimations. 11 Another possible mechanism for endogeneity of the PPA variables is that activists may be more likely to focus environmental and non-environmental boycotts on heavy polluters, and these dirty firms also have more to gain from EMS adoption. However, this potential source of endogeneity is vitiated by our inclusion of lagged pollution outcomes as explanatory variables in our estimation of equations (3)-(4).
12
regressors and their fitted residuals to correct for potential endogeneity bias.
3. Data and Measurement
Merging financial, environmental and other databases yields a usable sample of 365 S&P
500 firms for our cross-section analyses and 458 firms in the proxy panel (1991-2003). Sample
firms are members of the S&P 500 as of 1988 and do not change over our sample intervals.
3.1 Dependent Variables: Private Political Actions
Boycotts. Our boycott data is collected from issues of National Boycott News and
Boycott Quarterly from 1988-1995. From these sources, we identified 129 non-labor boycotts
against traded U.S. companies over this period. Among these actions are 55 boycotts related to
environmental or animal rights issues against 40 firms in the S&P 500. The specific issues cited
captivity, pesticide use, oil drilling and oil spills, ozone-depleting chemicals, cattle grazing, and
damaging development. To our knowledge, this is the most comprehensive set of environmental
boycott data studied to date, with annual boycott numbers ranging from 16 in 1989 to 36 in
1993.12 Over 1988-95, 9.3 percent of sample firms were subject to environmental boycotts and
14.3 were in an industry that was subject to a non-environmental (non-labor) boycott.
Proxy Votes. Data on shareholder proxy proposals for firms in the S&P 500 was obtained
from Institutional Shareholder Services for the period 1988-2003. The proposals target issues
12 The numbers of S&P 500 environmental boycotts by year are 16 (1989), 20 (1990), 18 (1991), 19 (1992), 36 (1993), 34 (1994), and 35 (1995). Lenox and Eesley (2009) identify 76 environmental boycotts against traded U.S. companies over 1988-2003 based on newspaper searches. Out of 129 boycotts in our data, we have slightly more environmental boycotts (77) against traded U.S. companies in only the first half of this time period (1988-1995), including 24 on animal rights. 52 other boycotts concern a variety of other social issues, including racial equality, corporate accountability, family values, gay rights, womens rights, gun control, gun rights, abortion, cigarette addiction, human rights in Burma, and product safety. Twelve of the 40 S&P 500 companies experiencing environmental boycotts over our 1988-95 sample period experienced more than one, including three that experienced three boycotts.
13
ranging from executive compensation to restrictions on investments (avoiding South Africa, for
example) to a variety of environment-related actions. Environmental topics include opposition
to nuclear power, greenhouse gas controls, reporting requirements and safeguards to avoid oil
and chemical spills, endangered species preservation, recycling, investment in renewable energy,
genetically modified foods, old growth forests, drilling in the Alaska National Wildlife Refuge,
reducing toxic pollution, avoiding chemical pesticides, disclosure of environmental and
community hazards, and “smart growth.” From 1988-2003, there were 788 environment-related
proxy proposals by shareholders of the S&P 500. There are three primary types of filers:
religious organizations, socially responsible investment funds, and individuals.
Between 1988-1995, 15.6 percent of our sample firms were targeted for an environmental
proxy challenge, while 49.6 percent were targeted for a non-environmental public interest proxy
vote. During this period, there were 387 environment-related proxy proposals by S&P 500
shareholders, compared with 55 environment-related boycotts. In our proxy panel (1991-2003),
the average annual proportion of firms targeted for an environmental proxy is 9.1 percent –
roughly the same proportion of our cross-section sample that was subject to an environment-
related boycott over the 8-year span 1988-95. These statistics reflect the significantly greater
frequency of proxy proposals vs. boycott actions that are much more costly to launch.
3.2 Dependent Variables: Firms’ Adoption of Environmental Management Systems
The IRRC Data. During 1994 and 1995, the Investor Responsibility Research Center
(IRRC) surveyed all S&P 500 companies concerning their adoption of a variety of environmental
management practices (see Anton, et al., 2004). All respondents indicated adoption of at least
one key practice, and almost all adopted multiple practices, including written environmental
policies and codes of conduct, self-audits to assess compliance with environmental regulations,
and/or implementation of a “total quality environmental management” program (TQEM).
14
TQEM is widely viewed as a comprehensive approach to environmental management. Costs of
enacting TQEM are potentially substantial; for example, in a case study of a TQEM program of
Eastman Kodak’s utilities division, Lave, et al. (1997) indicate that “12% of HS&E (Health,
Safety and Environment) staff time was diverted to the program over its first two years.”
Potential rewards from environmental management are also large; in the Eastman Kodak case,
for example, Lave et al. (1997) cite the 1995 company expenditures on U.S. environmental
management and waste/pollution prevention activities of $106 million, with TQEM estimated to
reduce HS&E oversight cots by 25 to 40 percent.
ISO 14001. ISO 14001 registration data over 1996-2006 is provided by QSU Publishing
Co. (www.qsuonline.com). To be registered under ISO 14001, a firm must be certified by a third
party auditor for compliance with the environmental standard. Third party audits are rigorous,
but there is no obligation for public disclosure of the audit findings. However, for certification,
the firm must demonstrate compliance with a series of requirements, including documentation
and implementation of an environmental management system (EMS) that “checks” for
environmental problems, implements environmental controls and corrective actions for pollutant
releases, and involves management review (Arimura, et al., 2008; Gonzalez and Gonzalez, 2008;
www.iso.org). Registered participants must periodically review their EMS and update their
certification. Costs of ISO 14001 adoption and program maintenance can be substantial. MPCA
(2009) estimates initial costs (per facility) of $30,000 to $150,000, and annual costs of
maintaining registration of $6,000 to $30,000, depending upon facility size and excluding
internal costs. Bansel and Bogner (2002) estimate initial costs of between $10,000 (for small
facilities) and $250,000 (for larger ones), while Yirdoe et al. (2003) estimate average initial costs
of between 39,000 and 75,000 Canadian dollars. In terms of benefits, both document the
effectiveness of ISO 14001 in reducing firms’ toxic air releases, solid waste generation, and
15
wastewater emissions. Despite evidence that ISO 14001 reduces pollutant emissions (Potoski
and Prakash, 2005; Arimura, et al., 2008), the program is sometimes labeled “greenwash”–
“dirty” firms falsely claiming to be “green” – likely due to its limited enforcement teeth.13
3.3 Independent Variables
Firm-level Scale and Financial Indicators. Firms that are larger, more profitable, and
“newer” / more versatile are potentially more promising targets of private political action and in
a better position to adopt new environmental management systems. We measure a firm’s size
with its number of employees (Employees, a panel variable) or its annual sales revenue (Sales, a
panel variable).14 A profitability index is constructed as the ratio of net income to sales (Profit, a
panel variable). Following Khanna and Damon (1999) (see also Khanna and Anton, 2002), we
construct a measure of the age of firm assets as the ratio of gross to net assets (Age of Assets, a
panel variable); this variable ranges from a value of one – reflecting “newer” assets than have not
been depreciated – and higher values that reflect “older” assets that have been substantially
depreciated. All four variables are obtained from COMPUSTAT.
Firm-level Environmental Performance and Regulation Indicators. We construct two
measures of firm-level environmental performance. Both are based on pollutant emissions
reported to the U.S. Environmental Protection Agency’s (EPA’s) Toxic Release Inventory (TRI).
First, we measure each firm’s total releases (by weight) of 170 toxic chemicals regulated under
the Clean Air Act (CAA) and reported to the TRI throughout our study period (CAA Emissions, a
13 The following quote from ecologia.org (ecologia.org/ems/iso14000/resources/factsheets/iso14000.html, Autumn, 2000) illustrates the perception: “The ISO 14000 standards are not prescriptive and do not provide pollutant targets or limits; because of this flexibility, use of the ISO 14000 standards does not guarantee that an enterprise will pollute less or meet national environmental requirements. However, many enterprises can and do advertise their ISO 14001 certification as an indication of a commitment to better environmental performance. This may lead to corporate "greenwashing," which benefits companies that don't reduce pollution and fails to highlight the achievements of those enterprises that truly are improving their performance through EMS.” ISO 14001 is also associated with the much-derided Sustainable Forest Initiative of the logging industry () and examples of bad environmental actors such as RUSAL (www.fao.org/COCREP/ARTICLE/WFC/XII/1017-A5.html, www.boycottrussionaluminum.com). 14 We use Employees to measure scale in the regressions because labor resources can be important to adoption of EMS systems.
16
panel variable). Second, we measure each firm’s releases (by weight) of 143 non-CAA TRI air-
related chemicals reported consistently through our study period (Non-CAA Emissions, a panel
variable).15 In all estimations, releases are measured with a one-year lag.
To measure the intensity of government environmental enforcement, we use the EPA’s
Air Facility System (AFS) database to construct the annual number of CAA inspections of a
firm’s facilities (Inspect, a panel variable). To avoid any potential for endogeneity, inspections
are measured with substantial lag; for example, in the panel PPA regressions, inspections are
measured over the prior 3 to 7 years, while for the EMS regressions they are measured in 1988.
Emissions and inspections can have competing effects on private political action,
of pro-environment practices, as well as potentially greater intrinsic benefits of targeting the
“dirty firm.” Government environmental inspections are also likely to raise intrinsic benefits of
targeting the firm by elevating the firm’s profile as a bad actor. Conversely, high emission firms
may be tougher targets, reducing the likelihood of a successful campaign. Higher CAA
emissions and inspections also reflect greater regulatory intensity that may reduce the demand
for private political action. Higher unregulated non-CAA emissions, in contrast, may raise the
scope for private politics to affect environmental management because there is no regulation to
compel firm control of these releases.
Effects on incentives for EMS adoption can also be ambiguous. A firm may benefit more
from EMS adoption when it is more polluting and subject to more government inspections
because there is more to gain from meeting pollution standards and avoiding adverse regulatory
actions. However, less-polluting firms may face lower costs of implementing EMS programs.
15 Toxicity-weighted counterparts are problematic for broad emission aggregates such as ours (see Guerrero and Innes, 2013). We therefore report results using aggregate weights. However, as a robustness check, we also report results using toxicity-weighted counterparts to the two (CAA and non-CAA) emissions measures. We verified our list of CAA-regulated TRI chemicals for potential errors in TRI flags noted by Bui and Kapon (2013, note 5).
17
Firm-level Indicators for Corporate Responsibility. We use the KLD (Kinder,
Lydenberg, and Domini) data to construct two indices that measure a firm’s social progressivity
in any given year. To our knowledge, KLD is the best available source on firms’ pro-social
reputations (see Fernandez-Kranz and Santalo, 2010, p. 461). KLD data is available for most
S&P 500 companies from 1991 onwards. In the cross-section analyses, we use the 1991 values;
for panel analyses, we use the annual KLD values, which reflect lagged performance.
KLD measures firms’ social responsibility in terms of strengths (positives) and concerns
(negatives) for a number of issue categories. We focus on the non-environmental categories,
including Community, Diversity, Employee Relations, Product, and Corporate Governance.16
Each category has a set of zero-one sub-category indicators for strengths and concerns.
Restricting attention to the sub-categories that are consistently measured over our sample
periods, we construct the two (strength and concern) indices as follows:
Iz =
C
c
s
i
cz
1 1
[Iicz/scz] = index for z = (strengths, concerns) (5)
C is the number of categories, scz is the number of subcategories for category cz, and Iicz is the
zero-one indicator for subcategory icz (for a firm). Because “strengths” represent progressive
(internal) policy choices, whereas “concerns” generally represent (external) controversies, the
two measures capture distinct characteristics (Baron, et al., 2011; Chatterji, et al., 2009). We
present robustness checks using three variants of these two indicators: (1) a simpler composite
16 We exclude Human Rights because of the sparse nature of the data in this category, and the Environmental category because of the potential for endogeneity. Issues covered by the categories (strengths vs. concerns) include, for Community (charitable giving vs. community investment and local economic impact controversies), Corporate Governance (limited executive compensation and ownership of progressive companies vs. high executive compensation and ownership of socially controversial companies), diversity (women and minority representation in leadership and contracting, strong work/life benefits, and programs for the disabled vs. affirmative action controversies / litigation and demonstrably poor representation of women), employee relations (employee-favorable policies on benefits, health and safety, decision-making, and profit-sharing vs. workforce controversies and health / safety disputes), and product (company reputation for quality, R&D, and service to the economically disadvantaged vs. controversy/litigation concerning product safety, fraudulent advertising, contracting practices, or antitrust).
18
(simple sums of the Iicz indicators in equation (5) above); (2) weighted indices that distinguish
between “public” categories (community relations and diversity) and “private” categories
(employee relations, corporate governance and product quality) for both strengths and concerns,
following Siegel and Vitaliano (SV, 2007),17 and (3) unweighted analogs (simple sums) for the
SV public and private breakdown.
We interpret KLDStrengths as a “receptive target” indicator, because it measures the
strength of the firm’s reputation for social responsibility in non-environmental realms. Similarly,
we interpret KLDConcerns as a “resistant target” indicator. Firms do not line up exactly as
receptive or resistant. Indeed, the correlation between the two KLD variables is close to zero (-
0.019 in our cross-section dataset). Most of our sample firms have either strengths or concerns
and not both; however, 38 firms (roughly ten percent of our sample) have positive values for
both measures, and 17 (about 5 percent of our sample) have values that are close (with no more
than .1 difference between them).
Industry and Time Indicators. We include two-digit-level industry controls, the three-
digit-level Herfindahl index of industry concentration (Concentration, a panel variable
constructed from COMPUSTAT), each firm’s market share in its 3-digit industry (Market
Share), and the three-digit-level indicator for whether an industry produces a final good
(FinalGood).18 In all panel estimations, we include time fixed effects.
Fernandez-Kranz and Santelo (KS, 2010) identify links between industry competitiveness
and the tendencies for Corporate Social Responsibility (CSR), as measured by KLD indicators.
They find evidence that heightened competition promotes CSR, which supports the conjecture
that CSR is driven by firm efforts to obtain a competitive advantage in contested markets. If
17 SV also include the environmental and human rights categories under the “public” rubric. We exclude the environmental category to avoid endogeneity and the human rights category due to sparse data (note 16 above). 18 We are indebted to a referee for suggesting the inclusion of Market Share.
19
firms in competitive industries are more sensitive to CSR reputations (as KS suggest), then they
are also likely to be ripe targets for private political action. However, controlling for industry
concentration, larger firms with greater market share may nonetheless be the most cost-effective
targets of boycott and proxy campaigns; as industry leaders, changing practices of these firms
can do more to advance the social objectives of a targeting organization.
Following the logic of KS, firms in more competitive industries may also be more likely
to adopt EMS practices as a signal of corporate environmentalism. Conversely, firms in more
concentrated industries may anticipate more regulatory and public scrutiny, and accordingly
more prone to adopt environmental management practices that enable superior performance.
Again, the direction of effect is an empirical question.
Firms in “final good” industries are expected to be more prone to consumer action
(Smith, 1990; Innes, 2006). In principle, proxy challenges may also be intended to energize
consumer audiences and, therefore, more likely for companies in final good industries.
However, final good status may alter EMS adoption decisions via its effect on private political
action; firms in final good industries may respond only to the threat of a PPA and therefore be
less prone to EMS adoption in the absence of a targeting threat.
State Indicators. For a firm’s home (headquarters) State, we include a number of
indicators to capture local environmental, socio-economic, and political pressures.19 First is the
per-capita membership in the Sierra Club (Sierra, a panel variable). Local environmentalist
pressures may lead to an adversarial relationship with resident firms, alienating management and
thereby deterring EMS adoption. Alternately, they may increase resident firms’ environmental
awareness, increasing propensities for EMS adoption. Second are measures of State government
19 Because a number of our sample firms do not have CAA-regulated facilities, we cannot construct facility-weighted averages of the State measures. To control for the lack of CAA regulation of these firms, we include appropriate industry dummies in our estimations.
20
expenditures on environmental programs. For this we have the State spending on air quality
programs (Spendaqp, a 1988 cross-section variable) and, alternately, State spending on natural
resources programs (Nrexp, a panel variable obtained from annual U.S. Statistical Abstracts).
Third are indicators of the environmental liability environment faced by each firm in its home
State. For this purpose, we have the zero-one indicator for whether the State has strict (versus
negligence) environmental liability (Strict, a panel variable obtained from the Environmental
Law Institute), and the number of lawyers per capita (Lawpcap, a 1988 cross-section variable).
Stronger liability exposure (as reflected by strict liability and a larger fraction of lawyers) is
likely to deter adoption of EMS systems that can leave audit trails for assignment of
environmental liability. Finally, we have three indicators for the overall socio-economic and
political environment in a firm’s home State, income per capita (Income, a panel variable
obtained from www.eonomagic.com), the fraction of the population with a completed College
education (Education), and a zero-one indicator for whether a State has right-to-work statute
(RTW). The latter two are 1988 cross-section variables.20
4. Estimation and Results
Table 1 gives variable definitions and summary statistics, and the Appendix gives a
breakdown of our cross-section data by 2-digit industry. We note that 52 percent of our sample
firms adopted an IRRC-reported EMS, while 35 percent adopted TQEM (two thirds of the IRRC
survey respondents). Over the 1996-2003 period, 15.9 percent of our sample firms registered
under the ISO 14001. Most of these firms were late adopters; by the beginning of 2000, 6
percent of our sample of firms had registered under ISO 14001.
Table 2 breaks down summary statistics for several key variables between firms that were
(i) subject to an environmental boycott (in 1988-95) or not, (ii) subject to an environmental
20 We are indebted to John Maxwell and Tom Lyon for providing us with their 1988 cross-section data.
21
proxy action (in 1988-1995) or not, (iii) IRRC-EMS adopters or not (1994-5), and (iv) ISO
14001 registrants or not (1996-2003). These statistics are suggestive of relationships that we
explore much more carefully in the analysis to follow. Specifically, firms that are subject to an
environmental boycott are significantly larger (in terms of either the number of Employees or
Sales revenue), with larger pollution levels (CAA Emissions), subject to more environmental
inspections (Inspect), more likely to be either progressive (KLDStrengths) or resistant
(KLDConcerns), and more likely to adopt EMS and TQEM. Proxy targets exhibit similar
patterns. EMS and ISO 14001 adopters are also significantly larger (Employees/Sales), with
more inspections on average (Inspect) and higher levels of emissions (CAA Emissions and Non-
CAA Emissions). EMS adopters are more likely to be a boycott or proxy target (Boycott, Proxy),
come from States that have smaller environmental constituencies on average (Sierra), and
exhibit no clear differences in their reputations for corporate responsibility (the KLD variables).
ISO 14001 adopters are more likely to be less progressive (KLDConcerns).
4.1 The Boycott Equation
Table 3A reports our baseline results from estimation of the Boycott equation. We
present four panel (random effects Probit) models covering two different sample periods, 1989-
1995 and 1991-1995 (when we have KLD data). Models 1-2 use our full unbalanced panel. In
the first unbalanced panel (1989-1995), we have 448 firms and 3113 firm-year observations; in
the second (1991-1995), we have 381 firms and 1826 firm-year observations. The gaps in our
unbalanced panel are due to missing data for some of the variables in some years (mostly KLD
and emissions measures) and do not reflect entry and exit into the S&P 500 (for which we
control by restricting attention to a common set of firms). However, as a robustness check, we
also present estimations using balanced panels in Models 3-4. In the first balanced panel (1989-
95), we have 435 firms and 3045 firm-year observations; in the second (1991-95), we have 346
22
firms and 1730 observations. Table 3B presents two additional robustness checks. In Model 5,
we measure the emissions variables with toxicity weighted counterparts to the total weights used
in our base estimations. In Models 6-8, we consider three alternative KLD measures of non-
environmental Corporate Social Responsibility (CSR).
Our main result from Table 3 is the significant positive effect of the “receptive target”
measure, KLDStrengths, on the likelihood of boycott. These estimates confirm that NGOs favor
progressive firms, perhaps because they are more likely to respond in a positive way to private
political actions (Baron, 2009). The magnitude of the estimated effects is noteworthy. Doubling
a firm’s weighted KLDStrengths index (from the mean, representing slightly less than a one-
standard-deviation change) is estimated to increase the likelihood of boycott by 98 to 102 percent
in the baseline models (of Table 3A), as percentages of the sample mean boycott probability.
Corresponding effects of the alternate KLD measures (in Table 3B) range from 72 to 74 percent.
Beyond the KLD effects, Table 3 indicates that firm size is an important driver of
boycotts, with the scale measure (Employees) positive and significant in all models. The market
power indicator (Market Share) also has a positive effect that is statistically significant in all but
one model. Environmental inspections (Inspect) are estimated to promote Boycotts, suggesting
that boycotts and regulatory scrutiny are complements. This result may reflect NGOs’ ability to
amplify regulatory oversight with publicity and consumer pressure for desired environmental
practices. The Final Good variable has a positive estimated effect, but is statistically significant
only in the models that exclude the KLD indicators. Producing a final good appears to promote
boycotts primarily via its impact on a firm’s tendency for CSR. Finally, we find no significant
impacts of firm emissions or local environmental constituencies (Sierra) on environmental
23
boycott propensities.21 Environmental performance appears not to be a central driver of NGOs’
decisions on targeting of environmental boycotts.
4.2 The Proxy Equation
Table 4 reports estimation results from the shareholder environmental Proxy equation.
Eight models are presented, all panel (random effects Probit) estimations. The estimations cover
the sample period 1991-2003 (when we have KLD data). The first two models (in Table 4A) are
estimated with the full unbalanced panel and include one parsimonious specification (without the
State covariates) and one more complete specification (with State covariates). The next two
models (in Table 4A) are balanced panel analogs. The unbalanced panel contains 458 firms and
4022 firm-year observations. The balanced panel contains 211 firms and 2755 observations.
Due to the large loss of sample firms in the balanced panel (from missing observations), we
consider the unbalanced panel Model 2 as our “base” specification. For this model, Table 4B
presents robustness checks using toxicity-weighted (vs. unweighted) emissions and alternative
measures of the KLD indicators.
The Proxy estimations give further support for the Baron (2009) hypothesis: “receptive
targets” with higher values of the KLDStrengths index are favored for private political action.
Magnitudes of effect are remarkably stable across models. For example, doubling a firm’s
weighted KLDStrengths index (from the mean) is estimated to raise a firm’s likelihood of
environmental proxy by 25 to 33 percent of the sample mean proxy probability. In these
estimations, the driving component of the KLDStrengths variables is the Public (vs. Private/
internal) component of the firm’s CSR reputation (Models 7 and 8 in Table 4B).
In contrast to the Boycott results, the Proxy equation also reveals a sensitivity to the
21 We considered a variety of alternate specifications for the emission variables, including combined totals of CAA and Non-CAA releases and CAA releases in isolation. None of these specifications yields significant effects of the emission variables on boycott outcomes.
24
“resistant target” indicator KLDConcerns. For example, doubling a firm’s weighted
KLDConcerns index (from the mean) is estimated to raise the firm’s probability of an
environmental proxy challenge by 23 to 26 percent (of the mean proxy probability). There are
two differences between proxies and boycotts that may explain why the former are targeted to
low CSR companies and latter are not. First, proxy proposers are investor groups to whom
“resistant” targets may be more receptive vis-à-vis NGO adversaries. Second, proxy actions are
much less costly to launch. Environmental proxies may therefore by more effective in nudging
resistant firms to more environmentally responsible conduct, and also an inexpensive tool to call
attention to these firms’ poor practices.
Table 4 reveals that proxies are favored for firms that are larger (with more Employees),
with more market power (Market Share), in Final Good industries, and more facile (with newer
assets, Age of Assets).22 Consistent with arguments of Fernandez-Kranz and Santalo (2010), we
estimate that environmental proxies are more likely for firms in competitive industries (with less
Concentration) who may be more sensitive to their CSR reputations. Finally, as with boycotts,
we find that environmental proxies are favored for firms with more government enforcement
(Inspect), but not significantly affected by environmental performance (Emissions) or exposure
to local environmental constituencies (Sierra).23
4.3 The IRRC-EMS and IRRC-TQEM Equations
Tables 5 and 6 present results for the binary (Probit) IRRC-EMS and IRRC-TQEM
estimations, respectively. Our key regressors are the binary private political action (PPA)
22 It is perhaps surprising that Final Good is statistically significant in the unbalanced Proxy panel, but not in the corresponding Boycott panel. However, marginal effects are proportionally similar in the two estimations; for example, comparing Model 2 of Table 3 (Boycott) to Model 2 of Table 4 (Proxy), Final Good is estimated to raise the boycott probability by 52.0% (of the sample boycott mean in the panel, .0498) and to raise the proxy probability by 55.9% (of sample proxy mean, .0912). Moreover, the enhanced significance of this coefficient in the Proxy model is likely due to a greater number of observations and associated increase in precision. 23 We considered alternate Emission measures (note 21) and none was statistically significant.
25
variables, Boycott and Proxy. In each Table, we present seven models. Model 1 includes only
Boycott, not Proxy. Model 2 is our “base model” with both Boycott and Proxy. Models 3-7
provide robustness checks. Models 3-5 estimate with alternate emissions measures (toxicity-
weighted sums, in Model 3) and KLD indicators (in Models 4-5).24 Models 6-7 add the firm-
level non-environmental boycott and proxy dummies as a falsification exercise; Model 6 controls
for the environmental PPAs as well (our Boycott and Proxy regressors), while Model 7 does
not.25 We expect only a firm’s propensity for environmental PPAs to influence firm decisions on
environmental practices; therefore, the non-environmental counterparts should not be significant
explanators of EMS decisions.
The Tables report p-values for the identifying instruments in first stage (Probit)
estimations for Boycott and Proxy, respectively.26 The instruments generally perform well in the
sense that they are highly correlated with the endogenous regressors. We also test for exogeneity
of the potentially endogenous regressors (Boycott and Proxy); in most cases, we reject the null of
exogeneity at a five percent level.27
From Tables 5 and 6, we have a number of findings. First, environmental boycotts have
a positive and significant effect on the likelihood of both EMS and TQEM adoption. The size of
these effects is noteworthy. If subject to an environmental boycott, a firm’s likelihood of EMS
adoption is increased by an estimated 54 to 58 percent; for TQEM adoption, the effect is 69 to 71
24 Models with unweighted Public/Private KLD indicators perform similarly to the weighted counterparts of Model 5. 25 We thank a referee for suggesting these checks. 26 The p-values are for the test statistics for the null hypothesis of zero coefficients on the identifying instruments in the first stage estimations. Note that in all cases, our equations are exactly identified, so over-identifying restrictions tests (Hansen or Sargan, for example) cannot be done. 27 In the Table 6 IRRC-TQEM estimations, an additional econometric issue arises: We only observe TQEM adoption if an IRRC survey was returned. By estimating this equation using data on all firms – both those that returned surveys and those that did not – we are implicitly estimating the joint probability of TQEM adoption and survey return. If all TQEM adopters returned surveys, this will yield consistent estimates of the TQEM adoption probability. If not, we have a sample selection model. We estimated Heckman models of the IRRC-TQEM equation that account for sample selection, only one of which converged. In this estimation, coefficient estimates are almost identical to those without the selection correction, supporting the premise that TQEM adopters respond to surveys.
26
percent. In both cases, the estimated magnitudes are strikingly stable across models.
Higher estimated impacts of Boycott on TQEM adoption – vs. EMS adoption – may seem
puzzling at first blush, as the IRRC-EMS indicator equals one if a firm either adopts TQEM or
adopts another EMS practice or both. However, in decomposing the impacts on IRRC-EMS,
Boycott has four component effects: (1) it raises the likelihood of TQEM adoption (Table 6); (2)
we expect it also to raise the likelihood of adoption for other EMS practices; (3) the effect in (1)
is reduced to the extent that new adopters of TQEM already implement another EMS; and (4) the
effect in (2) is reduced to the extent that new adopters of other EMS practices already implement
TQEM. Table 6 estimates effect (1), while Table 5 estimates the sum of effects (1)-(4). The
difference between the estimated effects (going from Table 6 to Table 5) represents the sum of
effects (2)-(4), which has no clear sign even with a positive effect (2).
Second, environmental proxy challenges have positive estimated effects on TQEM
adoption, but not overall EMS adoption. The TQEM effects are generally weakly significant and
quite stable across models. Surprisingly, given the weak nature of proxy challenges, the size of
estimated Proxy effects is quite large in the TQEM equation, increasing estimated adoption
probabilities by 45 to 65 percent. Combined, the positive effect of proxies on TQEM and the
null effect on IRRC-EMS suggest that environmental proxies promote TQEM adoption primarily
for firms that already do some type of voluntary environmental management other than TQEM.
For these firms, costs of the incremental TQEM program – on top of other practices in place
(such as environmental policies and audit programs) – are likely to be smaller; as a result, the
small nudge from proxy challenges that impose rather little cost on targeted firms may be
sufficient to prompt these firms to upgrade their environmental programs to the more widely
27
recognized “gold standard” of TQEM. 28
Third, in the IRRC-EMS, IRRC-TQEM and ISO 14001 estimations to follow, we find a
significant negative effect of the FinalGood variable on the likelihood of program adoption.
This robust result suggests that the presence of private political activity leads firms that have the
potential to be direct targets, because they are final good producers, to await signals of private
political action before they adopt the environmental management programs that we study.
Fourth, regressive firms that have higher values of the KLDConcerns index are less likely
to adopt an EMS (Table 5). Perhaps more surprising, progressive firms that have higher values
of the KLDStrengths index are also less likely to adopt both EMS and TQEM (Tables 5 and 6).
Like final good producers, progressive firms appear to await private political action before
sinking resources in environmental management systems.
Fifth, both the EMS and TQEM adoption models pass the “falsification” checks in
Models 6-7. Firms targeted for non-environmental boycotts or proxies are not estimated to be
significantly different in their likelihood of EMS or TQEM adoption (see coefficients on Non-
Environmental Boycott and Proxy).
The IRRC-EMS estimations of Table 5 reveal a number of other results. Firms with
larger home state environmental constituencies (as measured by Sierra) are less likely to adopt
EMS. This suggests an adversarial relationship between local environmental constituencies and
local firm managers that deters voluntary EMS adoption, rather than a positive effect of
environmental constituencies due to an improved environmental awareness of local firms.
However, firms with larger unregulated (non-CAA) pollutant emissions are more likely to adopt
EMS. This suggests that firms tend to use some voluntary EMS practice to address pollution
28 We also estimated EMS/TQEM models that include interactions between the FinalGood / Sierra / Market Share variables and Boycott / Proxy to assess whether consumer or environmental pressure or firm market power enhance the effect of the PPAs. The interactions are generally insignificant.
28
issues that are not subject to regulation. Finally, consistent in all the EMS models are negative
effects of strict environmental liability and lawyers per capita. These results suggest that liability
considerations deter EMS adoption, most likely because these environmental management
approaches can provide documentation for potential environmental liability.
4.4 The ISO 14001 Registration Equation
Table 7 reports results for the ISO 14001 estimations. We report our base model for both
the “early adoption” period (1996-99, Model 1) and the full adoption period of our sample
(1996-2003, Model 2). Several robustness checks are presented: alternate emissions measures
(Model 3), alternate KLD measures (Models 4 and 5), and falsification checks (Models 6-7).
p-values for first stage test statistics on significance of the identifying instruments (the
non-environmental industry-level PPA dummies) are indicated at the bottom of each reported
estimation; in almost all cases, the instruments perform well, with p values generally less than
one percent. Tests of exogeneity of the private political regressors are also reported; in all cases
other than Model 1, we reject the null of exogeneity at a ten percent level.
Although environmental PPA’s (Boycott and Proxy) are not found to have a significant
impact on early adoption of ISO 14001 (during 1996-99), an environmental boycott is estimated
to have a significant negative impact on longer-run ISO adoption (over 1996-2003) in all models.
Estimated magnitudes of effect are quite stable across models, indicating reductions in ISO
adoption probabilities of 26 to 31 percent. Conversely, an environmental proxy challenge is
estimated to raise longer-run ISO adoption probabilities by 46 to 76 percent (Models 2-5).
The negative effect of boycotts on ISO adoption does not imply that NGOs target firms
for the purpose of deterring their adoption of ISO 14001. Indeed, the environmental boycotts in
our sample were prior to the launch of ISO 14001 in 1996, and none were targeted to this
program. However, our results suggest that firms perceive ISO adoption as a practice that will
29
not be rewarded by the community of environmental NGOs, perhaps due to negative NGO
commentary on ISO 14001 during the program’s early years. However, we stress that ours is an
empirical paper and we remain agnostic on the precise mechanisms underpinning the results.
Beyond the key PPA effects, a number of the ISO 14001 estimation results are consistent
with those for IRRC-EMS adoption (Table 5). In both cases, Final Good and lawyers per capita
(Lawpcap) have significant negative effects on adoption, while unregulated toxic emissions
(Non-CAA Emissions) have a significant positive effect. Regulated toxic air emissions (CAA
Emissions) have negative effects on adoption in both equations, but the effects are only
statistically significant in the ISO model. Like IRRC-EMS, ISO 14001 appears to be a
mechanism to address unregulated pollution in the market for green reputation, while adoption is
deterred by prospects for establishing a roadmap to liability.
Other results from the ISO estimation are distinct. For example, firms with higher
numbers of environmental inspections (Inspect) and in more concentrated industries
(Concentration) are more likely to adopt ISO 14001. Neither attribute has a discernable impact
on IRRC-EMS. For ISO 14001, firms in more concentrated industries and subject to more
regulatory scrutiny anticipate greater benefits of adoption in potential regulatory relief and public
relations. This conclusion need not be at odds with Fernandez-Kranz and Santalo (2010) who
argue that more competitive industries have greater propensities for Corporate Social
Responsibility (CSR). If ISO 14001 is not viewed favorably by the community of environmental
NGOs (as suggested by boycott effects on ISO adoption), firms in more competitive industries –
seeking competitive advantages in CSR – may not be inclined to adopt the ISO protocol.
5. Summary and Conclusion
Table 8 summarizes the estimation results from our six equations, two for the
determinants of the private political variables (Boycott and Proxy) and three for determinants of
30
environmental management decisions (IRRC-EMS, IRRC-TQEM, and ISO96-03). The two
central conclusions from these estimations are: (1) Private political actions (PPAs) have a
significant impact on environmental management; and (2) consistent with Baron’s (2009) theory
of private politics, environmental PPAs are more likely to be launched against receptive targets
with reputations for pro-social conduct. Both conclusions are broadly robust across a number of
alternative model specifications, including different measures of outcomes (boycotts vs. proxies,
IRRC-EMS vs. IRRC-TQEM vs. ISO 14001) and exogenous data.
Our results shed some light on the respective roles of the different varieties of pressure
for corporate environmentalism: regulation, liability, and private politics. We find little direct
effect of government environmental inspections on the EMSs that we study, with the exception
of ISO 14001. However, we find some evidence that regulation spurs PPAs (Table 8) and we
also know from prior work that regulation promotes participation in government-sponsored
voluntary pollution reduction programs (VPRs) (Innes and Sam, 2008). Both PPAs and VPRs
are, in turn, precursors to EMS adoption as reported to the IRRC (Table 8 and Sam, et al., 2009).
Regulation is expected to promote PPAs both because inspections alert activists to environmental
trouble and because firms subject to regulatory scrutiny are more receptive targets with added
motive (addressing regulatory pressure) to respond to PPAs by adopting environmental
management programs. Our results are consistent with this expectation in the early 1990’s.
Liability appears to be important in driving EMS adoption incentives. However, stronger
environmental liability – captured in our analysis by strict vs. negligence liability and a larger
number of lawyers per capita – acts as a deterrent to these programs. EMS adoption almost
always involves an environmental self-auditing program that provides a documentary roadmap
for potential assignment of liability; when the liability threat is greater, it is therefore expected
that incentives for this documentation are reduced. We find evidence of this effect in our broad
31
EMS measure (but not TQEM) and in our ISO14001 estimations.
At one level, our results suggest a salutary role for private politics in the promotion of
corporate environmentalism. Environmental boycotts are effective instruments for the
promotion of IRRC-EMS programs, and environmental proxy actions are effective instruments
for the promotion of ISO 14001 and TQEM adoption. Moreover, both boycotts and proxies are
favored for progressive firms that have an activist-friendly reputation to protect and are more
likely to respond to activist pressure. Combined, these results suggest that activists consider the
impact of their activities on corporate behavior when selecting the firms that they target.
However, this rosy picture of PPA effects is clouded by some of our other results. First,
firms that are more susceptible to consumer or NGO pressure appear to wait for a signal of this
pressure before they adopt EMSs. When pressured, firms respond, but absent pressure, they are
less likely to adopt. This conclusion is suggested by negative effects of our FinalGood and CSR
indicator (KLDStrengths) variables on adoption of environmental management programs,
combined with their positive effects on the likelihood of PPAs. Second, we find that boycotts
deter ISO 14001 adoption, despite substantial evidence that this program is effective in reducing
toxic pollution and solid waste (Potoski and Prakash, 2005; Arimura, et al., 2008). Finally, we
find that home state Sierra Club membership is negatively related to both EMS adoption as
reported to the IRRC, and early adoption of ISO 14001. Stronger local environmental
constituencies appear to have an alienating effect on firms’ EMS decisions.
Whether for good or bad, private politics are important determinants of corporate
environmental conduct. With tightening government budgetary constraints and growing public
sensitivity to environmental issues, this mechanism for corporate social responsibility promises
to be increasingly central to corporate environmental performance.
32
References
Anton, W., Deltas, G., Khanna, M.. 2004. Incentives for environmental self-regulation and
implications for environmental performance. J. Environ. Econ. Manage. 48, 632-54.
Arimura, T., Hibiki, A., Katayama, H. 2008. Is a voluntary approach an effective environmental
policy instrument? J. Environ. Econ. Manage. 55, 281-95.
Bansel, P., Bogner, W. 2002. Deciding on ISO 14001: economics, institutions, and context.
Long Range Planning 35, 269-90.
Baron, D. 2001. Private politics, corporate social responsibility, and integrated management
strategy. J. Econom. Manage. Strategy 10, 7-45.
Baron, D. 2009. A positive theory of moral management, social pressure, and corporate social
performance. J. Econom. Manage. Strategy 18, 7-43.
Baron, D., Harjoto, M., Jo, H. 2011. The economics and politics of corporate social
performance. Business & Politics 13.
Besley, T., Ghatak, M. 2007. Retailing public goods: The economics of corporate social
responsibility. J. Public Econom. 91, 1645-63.
Bui, L., Kapon, S. 2012. The impact of voluntary programs on polluting behavior: Evidence
from pollution prevention programs and toxic releases. J. Environ. Econ. Manage. 64, 31-44.
Chatterji, A., Levine, D., Toffel, M. 2009. How well do social ratings actually measure
corporate social responsibility? J. Econom. Manage. Strategy 18, 125-69.
Delmas, M., Montiel, I. 2008. The diffusion of voluntary international management standards:
Responsible care, ISO 9000 and ISO 14001 in the chemical industry. Policy Studies Journal
36, 65-93.
Delmas, M., Montiel, I. 2009. Greening the supply chain: When is customer pressure effective?”
J. Econom. Management Strategy 18, 171-201.
33
Eesley, C., Lenox, M. 2006. Firm responses to secondary stakeholder action. Strategic
Manage. J. 27, 765-81.
Epstein, M., Schnietz, K. 2002. Measuring the cost of environmental and labor protests to
globalization: An event study of the failed 1999 Seattle WTO talks. International Trade J.
16, 129-60.
Feddersen, T., Gilligan, T. 2001. Saints and markets: Activists and the supply of credence
goods. J. Econom. Manage. Strategy 10, 149-71.
Fernandez-Kranz, D., Santalo, J. 2010. When necessity becomes a virtue: The effect of product
market competition on corporate social responsibility. J. Econom. Manage. Strategy 19, 453-
87.
Gonzalez-Benito, J., Gonzalez-Benito, O. 2008. Operations management practices linked to the
adoption of ISO 14001: An empirical analysis of Spanish manufacturers. International J.
Production Econom. 113, 60-73.
Grolleau, G., Mzoughi, N., Thomas, A. 2007. What drives agrifood firms to register for an
Environmental Management System? European Rev. Agri. Econom. 34, 233-55.
Guerrero, S., Innes, R. 2013. Self-policing statutes: Do they reduce pollution and save
regulatory costs? J. Law, Econom. Organization 29, 608-37.
Innes, R. 2006. A theory of consumer boycotts under symmetric information and imperfect
competition. Econom. Journal 116, 355-81.
Innes, R., Sam, A. 2008. Voluntary pollution reductions and the enforcement of environmental
law: An empirical study of the 33/50 Program. J. Law Econom. 51, 271-98.
Khanna, M., Anton, W. 2002. Corporate environmental management: Regulatory and market-
based pressures. Land Econom. 78, 539-58.
34
Khanna, M., Damon, L. 1999. EPA's voluntary 33/50 program: Impact on toxic releases and
economic performance of firms. J. Environ. Econ. Manage. 37, 1-25.
King, A., Lenox, M., Terlaak, A. 2005. The strategic use of decentralized institutions:
Exploring certification with ISO 14001 management standard. Acad. Mgmt. J. 48, 1091-
1106.
King, B., Soule, S. 2007. Social movements as extra-institutional entrepreneurs: The effect of
protests on stock price returns. Administrative Science Quarterly 52, 413-44.
Lave, L., Conway-Schempf, N., Horvath, A. 1997. Eastman Kodak Case: Implementation of
TQEM at Kodak Park’s Utilities Division. World Resources Institute.
Lenox, M., Eesley, C. 2009. Private environmental activism and the selection and response of
firm targets.” J. Econom. Manage. Strat. 18, 45-73.
Potoski, M., Prakash, A. 2005. Covenants with weak swords: ISO 14001 and facilities’
environmental performance. J. Policy Analysis Manage. 24, 745-69.
Sam, A., Khanna, M., Innes, R. 2009. Voluntary pollution reduction programs, environmental
management, and environmental performance. Land Econom. 85, 692-711.
Siegel, D., Vitaliano, D. 2007. The empirical analysis of the strategic use of corporate social
responsibility. J. Econom. Manage. Strategy 16, 773-92.
Smith, N.C. 1990. Morality and the Market: Consumer Pressure for Corporate Responsibility.
Routledge, London.
Terza, J., Basu, A., Rathouz, P. 2008. Two-stage residual inclusion estimation: Addressing
endogeneity in health econometric modeling. J. Health Econom. 27, 531-43.
35
Yirdoe, E., Clark, J., Marrett, G., Gordon, R., Duinker, P. 2003. EMS standard registration
decisions among Canadian organizations. Agribusiness 19, 439-57.
36
Table 1. Selected Summary Statistics
Variable Name Variable Definition
BOYCOTT CROSS-SECTION (1988-1995) Mean Std. Dev.
Boycott Environmental boycott dummy = 1 if a firm is boycotted in 1988-95, 0 otherwise
0.0931 0.2910
EMS Binary = 1 if the firm adopts EMS in 1994-1995, 0 otherwise
0.5178 0.5003
TQEM Binary = 1 if the firm adopts TQEM in 1994-1995, 0 otherwise
0.3480 0.4770
ISO 14001 (1996-03)
Binary = 1 if the firm adopts ISO 14001 in 1996-2003, 0 otherwise
0.1589 0.3661
Proxy (1988-95) Environmental proxy dummy = 1 if a firm has proxy challenge in 1988-95, 0 otherwise
0.1562 0.3635
Employees Number of firm employees (1000s), annual 38.2676 66.2050 Sales Sales of firm ($100 million), annual 6.0532 11.3583 Profit Net Income/sales 0.0715 0.0630 Concentration Herfindahl index of industry concentration, 3-digit
SIC, annual 0.1661 0.1327
Market Share Market share of a firm in 3-digit SIC, annual 0.1354 0.1670 Age of Assets Ratio of gross to net assets, annual 1.0471 0.0214 Final Good Binary = 1 if firm sells a final product, 0 otherwise 0.3644 0.4819 Inspect Number of CAA inspections of firm, annual 4.1397 10.0324 CAA Emissions Firm emissions of TRI CAA chemicals (millions
lbs.), annual* 0.9587 3.6283
Non-CAA Emissions
Firm emissions of TRI Non CAA chemicals (millions lbs.), annual*
0.1689 0.7489
Sierra Sierra club membership in firm's home state (per 1000 population), annual
2.2875 1.5246
KLD Strengths KLD strengths (weighted), annual 0.1893 0.2458 KLD Concerns KLD concerns (weighted), annual 0.0822 0.1744 Income Average per capita income in firm home state, annual 15241.8 2337.76 Strict Binary = 1 if firms’ home state has a strict liability
statute, annual 0.7452 0.4363
Educ Percentage of college degrees in firm home state, 1988
20.9206 3.3610
RTW Binary = 1 if firms’ home state has a right-to-work statute, 1988
0.3041 0.4607
Spendaqp State expenditures on air quality programs in firms’ home state, $ million, 1988.
1.2737 0.7408
Lawpcap Number of lawyers per 1000 population in firms’ home state, 1988
3.2170 0.9961
PROXY PANEL (1991-2003)
Proxy Environmental proxy dummy = 1 if a firm has proxy challenge, 0 otherwise, annual
0.0912 0.2880
Sales Sales of firm ($100 millions), annual 10.9611 19.9719 Nrexp Home state expenditures on natural resource
programs, $ million, annual 0.5689 0.6502
KLDStrengths KLD strengths (weighted), annual 0.3158 0.3101 KLDConcerns KLD concerns (weighted), annual 0.3049 0.3249 No. of Obs.: Cross-Section 365, Panel 4022. *Sample statistics for TRI emitters.
Table 3. Boycott Equation (1988-1995) A. Base Regressions
Panel (Random Effects) Probit
Complete (Unbalanced) Panel Balanced Panel 1989-95 1991-95 1989-95 1991-95 Model 1 Model 2 Model 3 Model 4
Marg Effect Marg Effect Marg Effect Marg Effect
Employees 3.6e-04 (3.37)***
4.1e-04 (2.07)**
3.6e-04 (2.04)**
5.2e-04 (1.79)*
Profit
0.1881 (1.11)
0.1382 (0.69)
0.1144 (0.67)
0.1349 (0.56)
Concentration -0.1512 (-0.88)
-0.3047 (-1.37)
-0.1599 (-0.96)
0.0054 (0.02)
Market Share
0.2927 (2.75)***
0.4207 (2.59)***
0.2946 (2.35)**
0.2244 (1.22)
Final Good
0.1068 (3.05)***
0.0259 (0.67)
0.0845 (2.09)**
0.0114 (0.22)
Inspect+ 0.0011 (3.84)***
9.7e-04 (2.39)**
0.0011 (3.34)***
0.0013 (2.50)**
CAA Emissions++ -2.05e-04 (-0.76)
-5.88e-04 (-1.04)
-3.22e-04 (-0.86)
-7.07e-04 (-0.99)
Non-CAA Emissions++
2.83e-04 (0.38)
-2.09e-04 (0.12)
1.54e-03 (0.96)
1.20e-03 (0.54)
Sierra 8.7e-04 (0.09)
0.0037 (0.24)
-0.0046 (-0.33)
-0.0030 (-0.15)
KLDStrengths --- 0.1532 (3.55)***
--- 0.1892 (3.20)***
KLDConcerns ---
-0.0091 (-0.20)
--- -0.0291 (-0.52)
Education
0.0347 (2.60)***
0.0273 (1.78)*
0.0260 (2.03)**
0.0338 (1.68)*
No. of Groups 448 381 435 346 No. of Obs. 3113 1826 3045 1730 LogLikelihood -230.44 -184.11 -232.98 -166.69 Mean Dep Var 0.03919 0.04984 0.04007 0.05029
Dependent Variable: Boycott. Robust z statistics reported in parentheses. All Models include the additional State covariates: Strict, Spendaqp, Lawpcap, Income, and RTW, none significant except in Model 1. Marginal effects at average. *,**,*** indicate significant at a (two-sided) 10%, 5%, and 1% level. + Inspect measures CAA inspections in the three to seven years prior (in the panel). ++ Emissions are measured in 1989 (in the cross-section) and in the prior year (in the panel).
39
Table 3. Boycott Equation (1988-1995) (continued) B. Alternate Emissions and KLD Measures
Panel (Random Effects) Probit Tox. Weighted
Emissions Unweighted KLD St. & Conc.
Weighted KLD Public/Private
Unweighted KLD Public/Priv
Model 5 Model 6 Model 7 Model 8 Marg Effects Marg Effects Marg Effects Marg Effects Employees 3.50e-04
(1.72)* 3.60e-04 (1.98)**
4.73e-04 (2.30)**
4.06e-04 (1.99)**
Profit 0.1487 (0.74)
0.1570 (0.78)
0.1441 (0.70)
0.1316 (0.65)
Concentration -0.2968 (-1.35)
-0.2847 (-1.27)
-0.3089 (-1.36)
-0.3033 (-1.34)
Market Share
0.4079 (2.53)**
0.4314 (2.65)***
0.4198 (2.54)**
0.4271 (2.59)***
Final Good 0.0299 (0.77)
0.0279 (0.71)
0.0211 (0.54)
0.0219 (0.56)
Inspect 9.44e-04 (2.27)**
9.18e-04 (2.26)**
0.0010 (2.46)**
0.0010 (2.43)**
CAA Emissions -1.25e-06 (-0.40)
-5.69e-04 (-1.00)
-5.62e-04 (-0.98)
-5.65e-04 (-0.99)
Non-CAA Emissions
-1.49e-05 (-0.70)
9.84e-04 (0.61)**
9.96e-05 (0.06)
2.51e-04 (0.15)
Sierra 0.0033 (0.21)
0.0036 (0.24)
0.0041 (0.27)
0.0048 (0.31)
KLD Strengths Public
0.1504 (3.52)***
0.0278 (3.28)***
0.2116 (4.16)***
0.0411 (4.16)***
KLD Strengths Private
-0.0403 (-0.41)
-0.0010 (-0.47)
KLD Concerns Public
-0.0046 (-0.10)
0.0051 (0.38)
-0.0842 (-0.96)
-0.0023 (-0.08)
KLD Concerns Private
0.0156 (0.26)
0.0032 (0.20)
Educ
0.0260 (1.66)*
0.0275 (1.80)*
0.0285 (1.85)*
0.0277 (1.80)*
No. of Obs. 1826 1820 1826 1826 No. of Groups 381 380 381 381 LogLikelihood -184.27 -184.63 -181.19 -181.72
Dep. Var.: Boycott. Marginal effects at average. Robust z statistics in parentheses. Models mimic Table 3A, Model 4, except for the Emissions variables in Model 7, and except for the KLD variables in Models 8-10. Model 7 uses toxicity weighted emissions and weighted KLD Strengths and Concerns. Models 8-10 use alternative KLD indices and unweighted emission aggregates. Emissions measures are for the prior year. All Models include the additional State covariates: Strict, Spendaqp, Lawpcap, Income, and RTW, none significant. Industry and year effects included in all Models. *,**,*** indicate significant at 10%, 5%, and 1%..
40
Table 4. Proxy Equation (1991-2003) A. Base (Random Effects Probit) Estimations
Unbalanced Panel Balanced Panel Model 1 Model 2 Model 3 Model 4 Marg Effects Marg Effects Marg Effects Marginal Effects Employees 2.68e-04
(2.96)*** 2.85e-04 (3.13)***
2.79e-04 (2.61)***
2.85e-04 (2.66)**
Profit 0.090 (1.28)
0.096 (1.37)
0.054 (0.46)
0.067 (0.57)
Age of Assets 0.682 (1.70)*
0.687 (1.71)*
0.126 (0.24)
0.275 (0.53)
Concentration -0.250 (-2.54)**
-0.250 (-2.54)**
-0.215 (-1.90)*
-0.218 (-1.92)*
Market Share
0.249 (3.14)***
0.244 (3.06)***
0.198 (2.17)**
0.207 (2.28)**
Final Good 0.048 (2.53)**
0.051 (2.65)**
0.007 (0.31)
0.012 (0.52)
Sierra 2.090 (1.28)
1.970 (1.17)
2.590 (1.36)
2.580 (1.33)
Inspect 4.03e-04 (1.96)*
4.50e-04 (2.18)**
4.16e-04 (1.80)*
5.09e-04 (2.18)**
CAA Emissions 4.15e-04 (1.24)
3.97e-04 (1.19)
5.79e-04 (1.70)*
5.79e-04 (1.70)*
Non-CAA Emissions
7.79e-04 (0.64)
7.37e-04 (0.61)
-1.62e-03 (-0.91)
-1.51e-03 (-0.86)
KLD Strengths 0.089 (3.60)***
0.093 (3.70)***
0.087 (2.70)***
0.085 (2.61)***
KLD Concerns 0.077 (3.48)***
0.078 (3.54)***
0.077 (2.64)***
0.080 (2.71)***
Educ
--- 0.012 (1.82)*
--- 0.010 (1.00)
Income
--- -0.020 (-2.21)**
--- -0.021 (-1.51)
State Covariates No Yes No Yes No. of Obs. 4022 4022 2755 2755 No. of Groups 458 458 211 211 LogLikelihood -949.32 -945.92 -761.64 -758.65 Mean Dep. Var. 0.0912 0.0912 0.1100 0.1100
Dep. Var.: Proxy. Robust z statistics reported in parentheses. Additional State Covariates are Strict, RTW, Nrexp, and Lawpcap, none significant. Industry and year effects included in all Models. Marginal effects at average. Estimation method: Random Effects Probit. Inspect measures CAA inspections in the three to seven years prior. Emissions measures are for the prior year.
41
Table 4. Proxy Equation (1991-2003) (continued) B. Alternate Emissions and KLD Measures
Tox. Weighted
Emissions Unweighted KLD St. & Conc.
Weighted KLD Public/Private
Unweighted KLD Public/Priv
Model 5 Model 6 Model 7 Model 8 Marg Effects Marg Effects Marg Effects Marg Effects Employees 2.96e-04
(3.24)*** 2.80e-04 (3.13)***
2.79e-04 (3.07)**
2.76e-04 (3.07)***
Profit 0.096 (1.36)
0.100 (1.41)
0.106 (1.48)
0.107 (1.49)
Age of Assets 0.718 (1.78)*
0.683 (1.70)*
0.755 (1.87)*
0.738 (1.83)*
Concentration -0.253 (-2.55)**
-0.243 (-2.48)**
-0.246 (-2.49)**
-0.242 (-2.46)**
Market Share
0.248 (3.09)***
0.241 (3.03)***
0.241 (3.03)***
0.240 (3.01)***
Final Good 0.051 (2.64)***
0.050 (2.60)**
0.050 (2.61)***
0.049 (2.57)***
Sierra 1.940 (1.16)
1.840 (1.15)
1.900 (1.12)
1.900 (1.12)
Inspect 5.46e-04 (2.90)***
4.23e-04 (2.06)**
4.66e-04 (2.26)**
4.46e-04 (2.16)**
CAA Emissions 1.35e-06 (1.49)
3.99e-04 (1.20)
4.13e-04 (1.24)
4.12e-04 (1.24)
Non-CAA Emissions
3.38e-06 (0.40)
7.27e-04 (0.60)
6.05e-04 (0.50)
6.40e-04 (0.53)
KLD Strengths Public
0.095 (3.77)***
0.018 (3.82)***
0.114 (3.59)***
0.021 (3.61)***
KLD Strengths Private
0.067 (1.49)
0.014 (1.42)
KLD Concerns Public
0.075 (3.42)***
0.026 (3.95)***
0.031 (0.87)
0.012 (0.95)
KLD Concerns Private
0.115 (3.73)***
0.032 (3.92)***
Educ
0.012 (1.85)*
0.012 (1.83)*
0.012 (1.83)*
0.012 (1.86)*
Income
-0.021 (-2.24)**
-0.020 (-2.21)**
-0.021 (-2.25)**
0.021 (-2.26)**
State Covariates Yes Yes Yes Yes No. of Obs. 4022 4022 4022 4022 No. of Groups 458 458 458 458 LogLikelihood -946.08 -943.86 -943.98 -942.77
Dep. Var.: Proxy. Robust z statistics reported in parentheses. Additional State Covariates are Strict, RTW, Nrexp, and Lawpcap, none significant. Marginal effects at average. Model 5 uses weighted KLD Strengths and Concerns. Models 6-8 use unweighted emissions measures. Industry and year effects included in all Models.
42
Table 5. IRRC-EMS Adoption Equation
Base Models Alternative Specifications Falsification Exercises Boycott
Only Boycott + Proxy
Tox Wted Emissions
Unwghted KLD
Wtd KLD Pub/Priv
Model 1 Model 2 Model 3 Model 4 Model 5 Model 6 Model 7 Marg Eff Marg Eff Marg Eff Marg Eff Marg Eff Marg Eff Marg Eff Environment Boycott (binary)
Dep Var: EMS adoption/response (0-1). Mean Dep Var: 0.5178. Robust z-statistics in parentheses. All equations include Industry effects, and the additional covariates, Profit, Age of Assets, Concentration, Market Share, Educ, Income, and Spendaqp, none significant. All Models estimated by 2SRI (Probit) with Environmental Boycott and Environmental Proxy treated as endogenous. Identifying instruments are industry-level (3-digit SIC) dummies for a non-environmental boycott and proxy (respectively) in 1988-91. Emissions are measured with unweighted totals except in Model 3. KLD variables are measured with weighted Strengths and Concerns except in Models 4-5. 1st Stage instrument tests give p-values for identifying instruments in the respective 1st stage estimations.
43
Table 6. TQEM Adoption Equation
Base Models Alternative Specifications Falsification Exercises Boycott
Only Boycott + Proxy
Tox Wted Emissions
Unwghted KLD
Wtd KLD Pub/Priv
Model 1 Model 2 Model 3 Model 4 Model 5 Model 6 Model 7 Marg Eff Marg Eff Marg Eff Marg Eff Marg Eff Marg Eff Marg Eff Environment Boycott (binary)
Dep Var: TQEM Adoption (0-1). Mean Dep Var: 0.348. Robust z-statistics in parentheses. All equations include Industry effects, and the additional covariates, Profit, Age of Assets, Concentration, Market Share, Educ, Income, and Spendaqp, none significant. All Models estimated by 2SRI (Probit) with Environmental Boycott and Environmental Proxy treated as endogenous. Identifying instruments are industry-level (3-digit SIC) dummies for a non-environmental boycott and proxy (respectively) in 1988-91. Emissions are measured with unweighted totals except in Model 3. KLD variables are measured with weighted Strengths and Concerns except in Models 4-5. 1st Stage instrument tests give p-values for identifying instruments in the respective 1st stage estimations.
44
Table 7. ISO 14001 Registration Equation Base Models Alternate Specifications: 1996-2003 Falsification
Exercises (1996-2003)
1996-1999
1996-2003
Tox. Wtd. Emissions
Unweight. KLD
Wtd. KLD Pub./Priv.
Model 1 Model 2 Model 3 Model 4 Model 5 Model 6 Model 7 Marg Eff. Marg Eff. Marg Eff. Marg Eff. Marg Eff. Marg Eff. Marg Eff. Environment Boycott (binary)
Dep Var: ISO Registration (0-1). Mean Dep Var (ISO96-03): 0.1589. Robust z-statistics in parentheses. All equations include Industry effects, and the additional covariates, Profit, Age of Assets, Market Share, Income, Strict,, and Spendaqp, none significant (except Spendaqp in Model 1). All Models estimated by 2SRI (Probit) with Env. Boycott and Env. Proxy endogenous. Identifying instruments are industry-level (3-digit SIC) dummies for a non-environmental boycott and proxy in 1988-91. Emissions measured with unweighted totals except in Model 3. KLD variables measured with weighted Strengths / Concerns except in Models 4-5. + Final Good dropped in Model 1 due to collinearity.
45
Table 8. Summary of Results
A) Determinants of Environmental Boycotts and Proxies
Boycott Proxy Employees + + Final Good +? +? Concentration 0 - Market Share +? + Inspect + + Emissions 0 0 Sierra 0 0 KLDStrengths + + KLDConcerns 0 + Education + +? Income 0 -?
Sierra - 0 0 Inspect 0 0 + KLDStrengths - - 0 KLDConcerns - 0 0 Strict - 0 0 Lawpcap - 0 - +, - indicate consistent signs with significant coefficients in multiple models. Question marks indicate that the effects are insignificant in multiple models. “0” indicates no consistent and significant sign of effect.
46
Appendix Table: 2-Digit Industries in Sample Industry SIC Code Sample Proportion Chemicals and Allied Products 28 0.0849 Industrial and Commercial Machinery and Computer Equipment
35 0.0712
Electric, Gas and Sanitary Services 49 0.0658 Depository Institutions 60 0.0575 Electronic and Other Electrical Equipment and Components


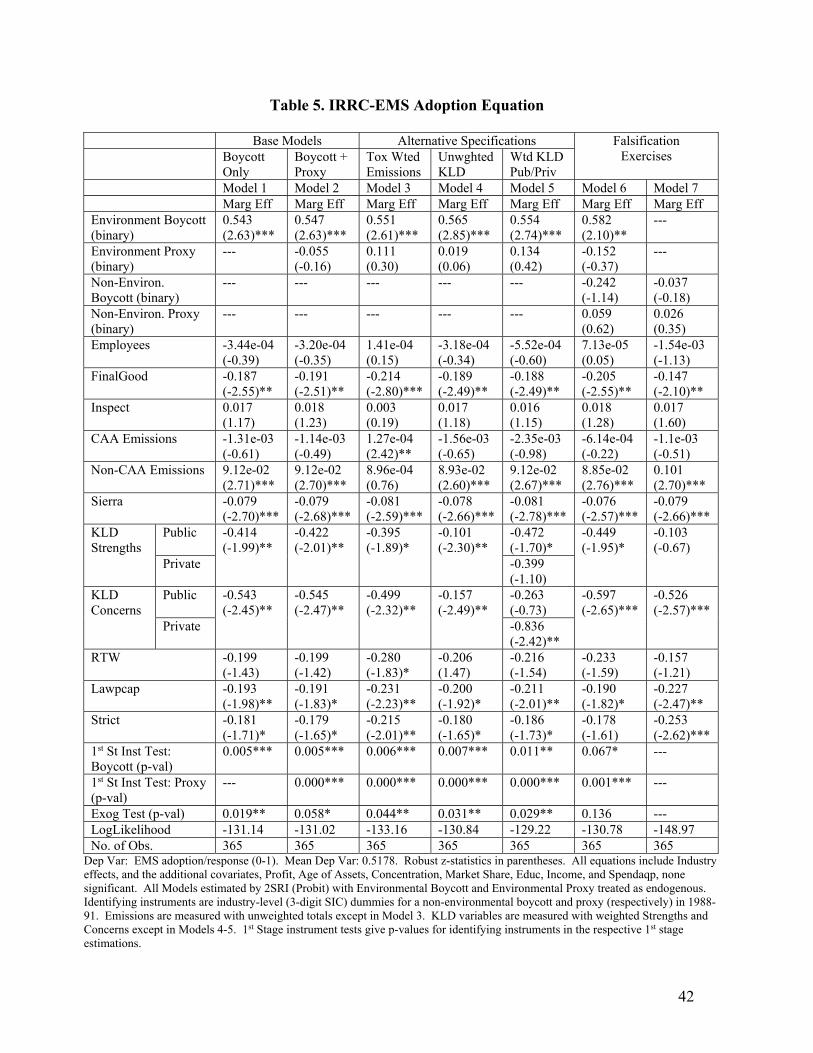


![SONAM TERM1[1]](https://static.documents.pub/doc/80x56/577d24b01a28ab4e1e9d1bc4/sonam-term11.jpg)
