SORBITOL CLEARANCE AND ITS EFFECTS ON FEEDLOT PERFORMANCE AND CARCASS CHARACTERISTICS OF STEERS by DENNIS WELDON BOYLES, JR., B.S., M.S. A DISSERTATION IN ANIMAL SCIENCE Submitted to the Graduate Faculty of Texas Tech University in Partial Fulfillment of the Requirements for the Degree of DOCTOR OF PHILOSOPHY Approved December, 1993
Transcript
SORBITOL CLEARANCE AND ITS EFFECTS ON FEEDLOT PERFORMANCE
AND CARCASS CHARACTERISTICS OF STEERS
by
DENNIS WELDON BOYLES, JR., B.S., M.S.
A DISSERTATION
IN
ANIMAL SCIENCE
Submitted to the Graduate Faculty of Texas Tech University in
Partial Fulfillment of the Requirements for
the Degree of
DOCTOR OF PHILOSOPHY
Approved
December, 1993
M
ACKNOWLEDGMENTS C7^^ ""
J) 1 would like to express my gratitude to Dr. C. Reed
Richardson for his support during my graduate studies. He
has helped instill in me a deep appreciation of the
metabolic processes involved in nutrition.
I am grateful to have had distinguished men serve on my
committee. A sincere thank you goes to Drs. R. L. Preston,
R. C. Albin, D. Oberleas and N. A. Cole for their support
and encouragement.
I would like to thank Dr. G. S. Cameron (Texas Tech
Health Sciences Center, Department of Dermatology) for his
vital service to me while laboring through this research.
His guidance, assistance, friendship and the use of his
laboratory are deeply appreciated. I would also like to
thank the staff at the Burnett Center, Victor M. Montalvo-
Lugo and fellow graduate students for their assistance and
friendship.
The support of family and close friends is acknowledged
and appreciated. But the support and years of sacrifice
unselfishly supplied by my wife Janie and our children,
Colton, Caylen and Kaycie, have made the completion of this
II. EFFECTS OF SORBITOL ON FEEDLOT PERFORMANCE AND CARCASS CHARACTERISTICS OF STEERS FED A STEAM-FLAKED GRAIN SORGHUM BASED DIET 9
Abstract 9
Introduction 10
Materials and Methods 10
Results and Discussion 12
Implications 14
III. EFFECTS OF PROTEIN SOURCE AND SORBITOL SUPPLEMENTION ON PERFORMANCE OF INCOMING FEEDLOT STEERS 28
Abstract 28
Introduction 28
Materials and Methods 29
Results and Discussion 30
Implications. 31
• • •
111
IV. EFFECTS OF SORBITOL ON SODIUM DEPENDENT AND SODIUM INDEPENDENT GLYCINE AND LEUCINE UPTAKE BY CULTURED BOVINE KIDNEY CELLS 38
Abstract 38
Introduction 38
Materials and Methods 40
Results and Discussion 4 3
Implications 44
V. CLEARANCE OF INTRAVENOUSLY
ADMINISTERED SORBITOL IN STEERS 49
Abstract 49
Introduction 50
Materials and Methods 51
Results and Discussion 53
Implications 57
VI. INTEGRATED SUMMARY 66
LITERATURE CITED 69
APPENDIX
A. CELL SUBCULTURE TECHNIQUE 75
B. CELL FREEZING TECHNIQUE 77
C. EXPERIMENTAL PROCEDURE FOR TREATMENT OF
CELLS IN COSTAR CLUSTER WELLS 78
D. PROCEDURE FOR PROTEIN DETERMINATION 80
E. CONSTRUCTION OF EXPERIMENTAL WASH TRAYS 81
F. CONSTRUCTION OF EXPERIMENTAL UPTAKE TREATMENT TRAYS 82
G. FRUCTOSE DETERMINATION IN BOVINE PLASMA 83
IV
LIST OF TABLES
2.1 Composition of initial backgrounding diet 15
2.2 Composition of second backgrounding diet 16
2. 3 Composition of third backgrounding diet 17
2.4 Composition and analysis of final basal diet 18
2.5 One hundred-nineteen day feedlot performance 19
2.6 Initial twenty-eight day feedlot performance 20
2 .7 Initial fifty-six day feedlot performance 21
2.8 Initial eighty-four day feedlot performance 22
2.9 One hundred-twelve day feedlot performance 23
2 .10 Carcass characteristics 24
2.11 Carcass quality grades by treatment 25
3.1 Composition of basal diet 33
3.2 Treatment means for twenty-eight day feedlot performance 34
4.1. Effect of sorbitol on sodium dependent and independent glycine uptake by bovine kidney cells 45
4.2. Effect of sorbitol on sodium dependent and independent leucine uptake by bovine kidney cells 46
5.1. Composition and analysis of basal diet 58
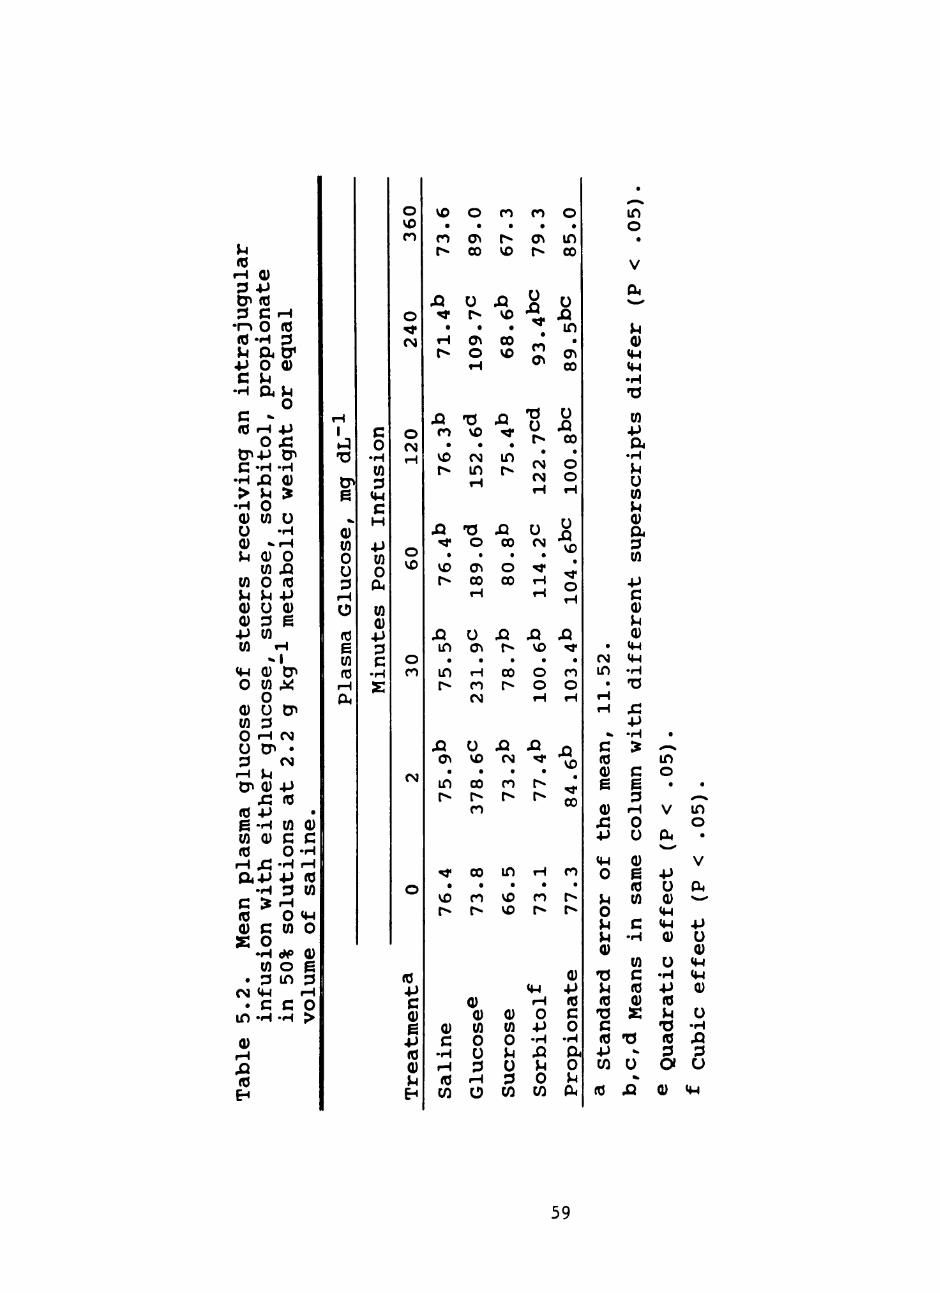
5.2. Mean plasma glucose of steers receiving an intrajugular infusion of either glucose, sucrose, sorbitol or propionate in 50% solutions at 2.2 g kg"^ metabolic weight or equal volume of saline 59
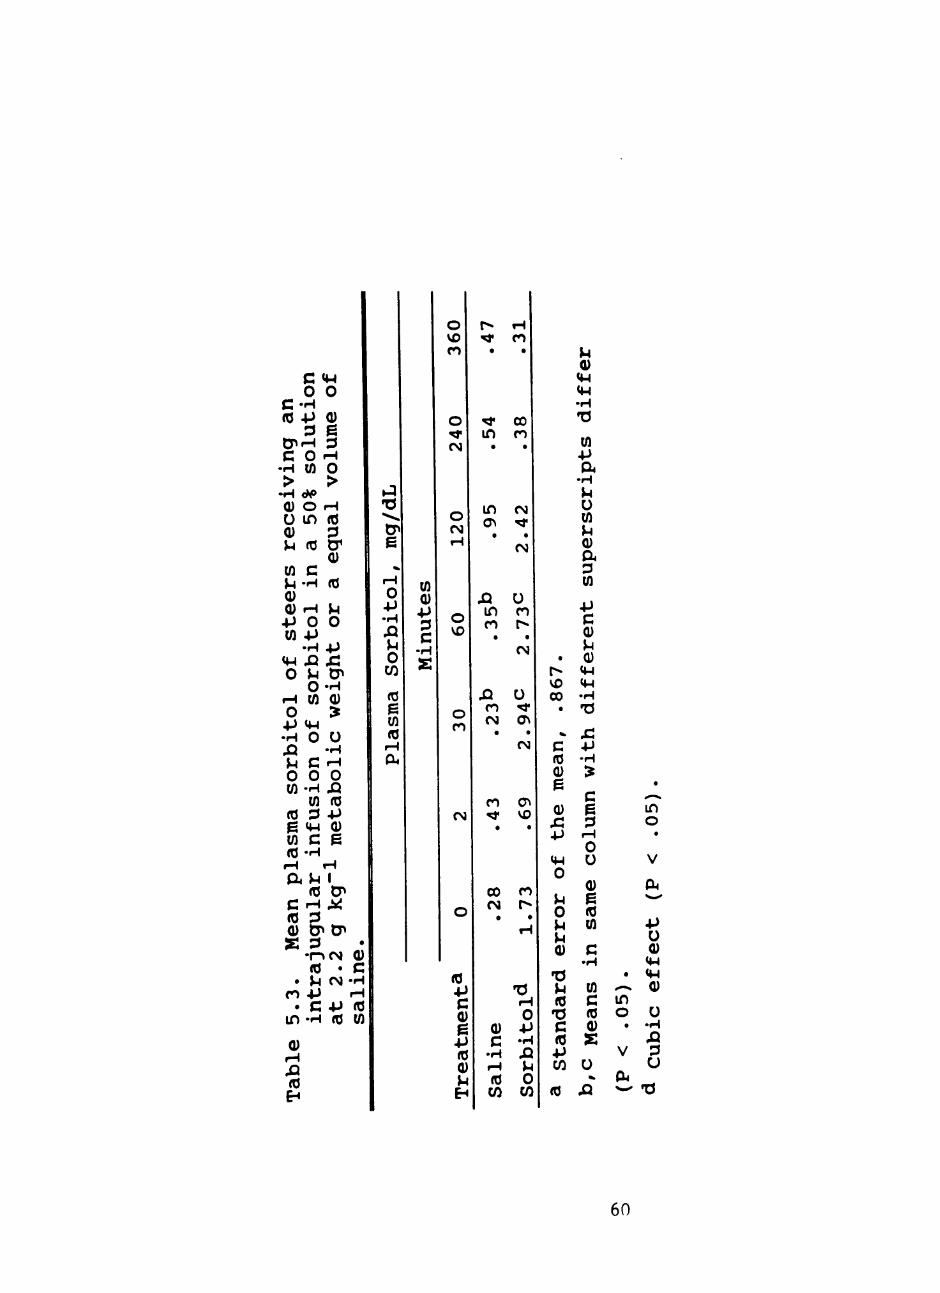
5.3. Mean plasma sorbitol of steers receiving an intrajugular infusion of sorbitol in a 50% solution at 2.2 g kg"^ metabolic weight or equal volume of saline 60
5.4. Mean plasma fructose of steers receiving an intrajugular infusion of sorbitol in a 50% solution at 2.2 g kg"l metabolic weight or equal volume of saline 61
VI
LIST OF FIGURES
2.1. Gain efficiency of steers fed for 119 d 26
2.2. Average daily gain of steers fed for 119 d 27
3.1 Dry matter intake of steers fed either low ruminally degradable protein (LD Protein) mixture or readily ruminally degradable protein (RD Protein) supplement 35
3.2. Average daily gain of steers fed either low ruminally degradable protein (LD Protein) mixture or readily ruminally degradable protein (RD Protein) supplement 3 6
3.3. Gain efficiency of steers fed either low ruminally degradable protein (LD Protein) mixture or readily ruminally degradable protein (RD Protein) supplement 37
4.1. Effects of sorbitol on glycine uptake by cultured bovine kidney cells in the presence of sodium (glycine NA) or in the absence of sodium (glycine WO) 47
4.2. Effects of sorbitol on leucine uptake by-cultured bovine kidney cells in the presence of sodium (leucine NA) or in the absence of sodium (leucine WO) 48
5.1. Plasma glucose levels of steers receiving an intrajugular infusion of either glucose, sucrose, sorbitol or propionate in 50% solutions at 2.2 g kg~^ metabolic weight or equal volume of saline 62
5.2. Plasma glucose levels of steers receiving an intrajugular infusion of either sucrose, sorbitol or propionate in 50% solutions at 2.2 g kg~^ metabolic weight or equal volume of saline 63
5.3. Plasma sorbitol levels of steers receiving an intrajugular infusion of sorbitol in a 50% solution at 2.2 g kg"^ metabolic weight or equal volume of saline 64
Vll
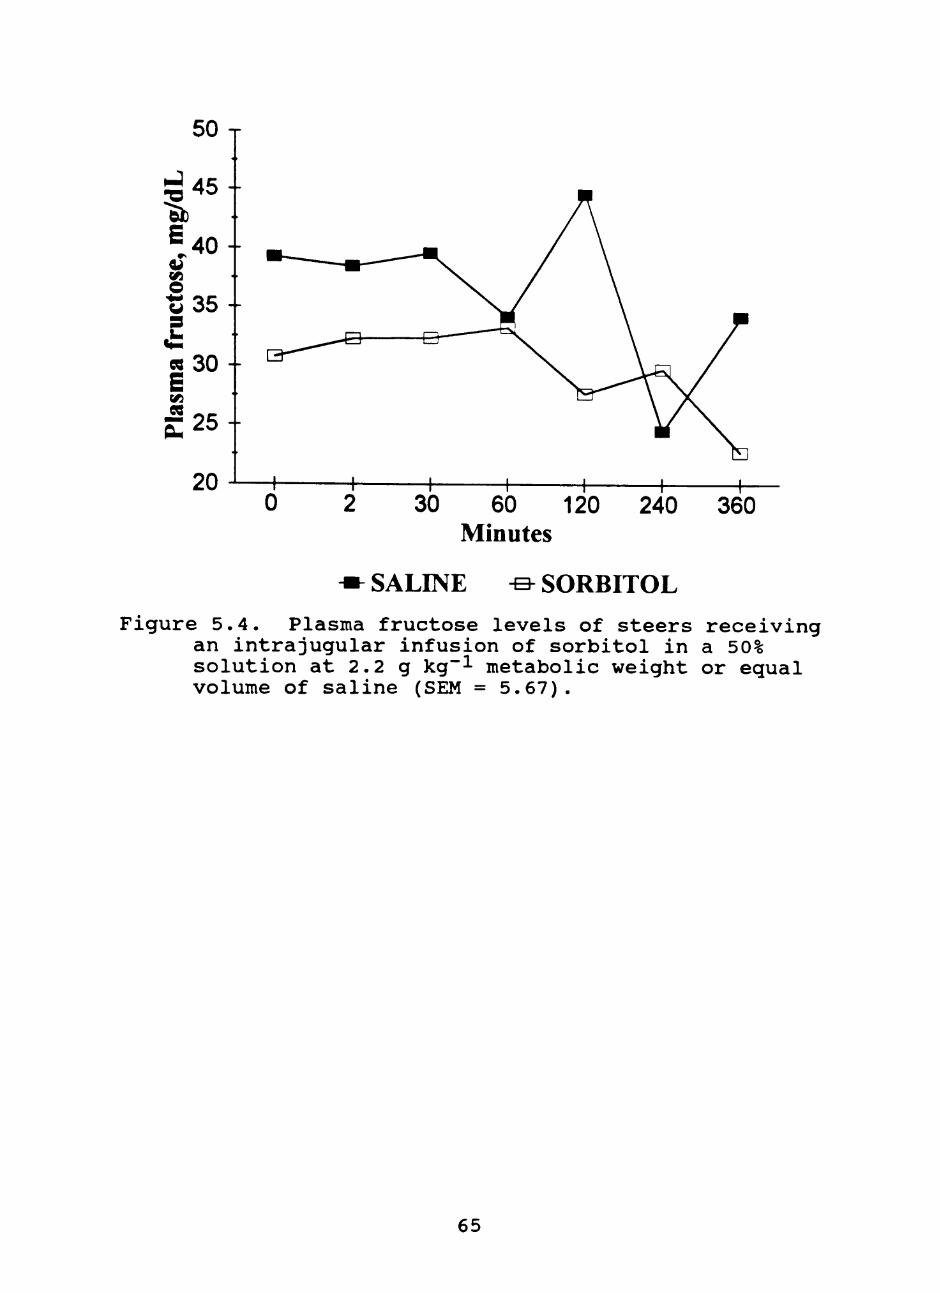
5.4. Plasma fructose levels of steers receiving an intrajugular infusion of sorbitol in a 50% solution at 2.2 g kg~^ metabolic weight or equal volume of saline 65
Vlll
LIST OF ABBREVIATIONS
ADG Average daily gain
BRSV Bovine respiratory syncytical virus
BVD Bovine viral diarrhea
Ca Calcium
cm Centimeters
CP Crude protein
CV Coefficient of variation
d Day(s)
DMI Dry matter intake
DM Dry matter
F:G Feed to gain ratio
g Grams
G:F Gain efficiency (g of gain / kg of feed)
h Hour(s)
HCWT Hot carcass weight
IBR Infectious bovine rhinotracheitis
K Potassium
kg Kilogram(s)
Meal Megacalories
w^5 Metabolic weight (body weight in kg*^5)
NEg Net energy for gain
NEm Net energy for maintenance
P Phosphorus when referring to diet composition
P Probability when referring to statistics
PI3 Parainfluenza
REA Ribeye area
SEM Standard error of the mean
VFA Volatile fatty acid(s)
IX
CHAPTER I
REVIEW OF LITERATURE
Introduction
Sorbitol, a natural six-carbon polyalcohol, is found in
various human foods such as cherries, plums, pears and
apples (Merck, 1989). It is also used as a sweetener. This
compound is regarded as safe for human consumption and is
classified as GRAS (generally recognized as safe) by the
Food and Drug Administration.
Supplementation of sorbitol has been shown to improve
performance of veal calves (Thivend, 1982; Bauchart et al.,
1985). Sorbitol addition to a corn silage-based diet has
also been shown to improve feedlot performance of steers and
bulls. Fontenot and Huchette (1993) reported improvements
in feed efficiency by steers without improved daily gains
after Geay et al. (1992) described improvements in both feed
efficiency and daily gains by bulls. Since cattle feeders
use feed additives and implants to improve animal
performance, sorbitol could be viewed as a natural, safe
compound that could be used as a livestock feed additive
provided it increases profits.
Animal Performance
When orally administered to ruminants, sorbitol has
been shown to improve feed efficiency in calves from birth
to three weeks of age (Daniels et al., 1981) and between 8
and 16 weeks of age in veal calves (Thivend, 1982; Bauchart
et al., 1985). Thivend et al. (1984) have reported an
increase in biliary organic matter flow of young calves when
consuming sorbitol. Improvements in feed efficiency when
supplementing sorbitol to ruminants used for beef production
has also been documented in two reports. Geay et al. (1992)
reported that sorbitol supplied at a concentration of 50 g
d~^ improved ADG and feed efficiency by finishing bulls.
Recent feedyard performance trials conducted by Fontenot and
Huchette (1993) have shown that feeding 20 to 4 0 g of
sorbitol d~^ to finishing steers improves feed efficiency
while not affecting ADG, in two of three studies, with no
marked effect on carcass characteristics. Supplementary
studies conducted by Fontenot and Huchette (1993) indicate
that the improvement in feed conversion by ruminants is not
due to differences in rate of passage or digestibility.
Bauchart et al. (1985) reported a 7% improvement in feed
efficiency from sorbitol supplementation to young veal
calves with no differences in digestibility.
Recent work conducted in France (Fostier, 1992) has
shown that large doses (one kg per animal) of sorbitol given
orally via the drinking water reduced the incidence of dark
cutting carcasses from Holstein cows (n = 2000) by 30%.
Also increased muscle glycogen concentrations in the
longissimus muscle of bulls was reported following sorbitol
consumption. Sorbitol's involvement in muscle glycogen
metabolism has been shown earlier by Johnston and Deuel
(1943) using rats.
Metabolism of Sorbitol
The metabolism of sorbitol is closely related to that
of fructose and glucose (Bye, 1969). Sorbitol dehydrogenase
and aldose reductase are the two enzymes involved in the
metabolism of sorbitol. Large amounts of sorbitol
dehydrogenase are found in hepatocytes and in very low
concentrations in other tissues (Blakley, 1951; Bye, 1969;
Seeberg et al., 1955). Aldose reductase is largely located
in the kidney (Stribling et al., 1989) and plays a minor
role in sorbitol metabolism (Bye, 1969). Early research
indicated that sorbitol dehydrogenase is highly specific for
D-sorbitol, but more recent reports suggest that other
polyols are metabolized by sorbitol dehydrogenase (Malone
and Lowitt, 1992). Sorbitol dehydrogenase catalyses the
following reactions in the presence of NAD or NADH
(Bergmeyer, 1974):
D-Sorbitol 4-> D-Fructose
L-Iditol <-> L-Sorbose
Ribitol 4-> D-Ribulose
Xylitol <^ D-Xylulose Allitol <- D-Allulose
L-Gala-D-glucoheptide <-> L-Galaheptulose
D-Altro-D-glucoheptide <- D-Altroheptulose.
This enzymatic activity involving other polyols could
possibly be related to the improvement in cattle feedlot
performance when cattle consume carrots that contain
mannitol (Richardson, 1993).
Evidence that fructose is the primary intermedate of
hepatic sorbitol oxidation leading to glucose production was
reported by Embden and Greesbach (1914). The enzymatic
oxidation of sorbitol to fructose leading to glucose
production was confirmed by Blakley (1951) in rats.
Sorbitol was rapidly oxidized by rat liver slices;
therefore, Blakley (1951) concluded that in liver slices the
oxidation of sorbitol to fructose with subsequent conversion
of fructose to glucose proceeded much more rapidly than
other hexose oxidation. Chemical reactions involved include
two pathways (Lehninger, 1982). The major pathway in
muscles and the kidney is as follows: sorbitol <-> fructose
closely related to sorbitol differentially affect amino acid
transport. It has not been determined if sorbitol affects
amino acid transport.
The mechanism and(or) mechanisms involved, associated
with sorbitol, in improving performance of ruminants is
presently unknown. Therefore, it was the intent of the
following research to determine the effects of sorbitol
supplementation to a steam-flaked grain sorghum-based diet
fed to steers; to determine the effects of sorbitol on amino
acid uptake by cultured bovine kidney cells; and to
determine sorbitol clearance in steers.
8
CHAPTER II
EFFECTS OF SORBITOL ON FEEDLOT PERFORMANCE
AND CARCASS CHARACTERISTICS OF
STEERS FED A STEAM-FLAKED
GRAIN SORGHUM-BASED DIET
Abstract
A feedlot experiment with growing/finishing steers was
conducted to determine the effects of supplementing a steam-
flaked grain sorghum-based diet with sorbitol on voluntary
feed intake, rate of gain, feed efficiency and carcass
characteristics. One hundred twelve crossbred steers
(Angus/Hereford; average initial shrunk weight = 337.3 ±
17.4 kg) were randomly assigned to treatment and fed a
steam-flaked grain sorghum-based diet with or without
sorbitol. Treatments were: A - control (basal diet); B -
basal diet plus 30 g sorbitol steer"^ d"^; C - basal diet
plus sorbitol at a variable rate (20 g sorbitol steer"^ d~^
first 28 d, 30 g second 28 d, then 40 g until termination of
the study); D - basal diet for first 69 d then addition of
30 g of sorbitol steer"^ d~^ until termination of the study.
Supplementation of sorbitol did not statistically improve
steer feedlot performance (P > .05) over the 119 d feeding
period. However, throughout the feeding period,
supplementing steers with 30 g of sorbitol d"^ showed a 3.4%
numerical increase in ADG and a 4.0% numerical improvement
in feed efficiency over steers receiving no sorbitol.
Steers receiving sorbitol only for the final 50 d had lower
dressing percent (P < .002) than other steers. Furthermore,
the carcass lean color tended (P = .16) to be altered by a
treatment effect . Steers receiving 30 g of sorbitol d"^
appeared to exhibit a more youthful bright cherry red color
of the carcass lean (P = .03). In summary, sorbitol
supplementation to a steam-flaked grain sorghum-based diet
did not improve feedlot performance of steers in this study.
However, steers fed 30 g of sorbitol d~l for the last 50 d
did exhibit (P < .002) lower dressing percentages.
Furthermore, steers receiving 30 g of sorbitol d~^ appeared
to exhibit (P = .03) a more youthful bright cherry red color
of carcass lean.
Introduction
Sorbitol, a natural six-carbon alcohol found in many
fresh fruits, has been reported to improve feed conversion
in calves (Daniels et al., 1981; Thivend, 1982; Bauchart et
al., 1985) and in finishing bulls (Geay et al., 1991). Two
of three feedlot experiments reported by Fontenot and
Huchette (1993) have shown improvements in feed efficiency
by finishing steers when sorbitol was supplemented to a corn
silage-based diet alone or in combination with monensin.
Thus, the objectives of this study were to determine the
effect of sorbitol supplementation to a steam-flaked grain
sorghum-based diet with monensin on feedlot performance and
carcass characteristics of growing/finishing steers.
Materials and Methods
One hundred and twelve crossbred steers (Angus/
Hereford; average initial shrunk weight = 337.3 ±17.4 kg)
were randomly assigned to treatment and fed a steam-flaked
grain sorghum-based diet with or without sorbitol.
Treatments were: A - control (basal diet); B - basal diet
plus 30 g sorbitol^ steer"^ d~^; C - basal diet plus
sorbitol at a variable rate (20 g sorbitol steer"! d~! first
1 Neosorb^Sorbitol supplied by Roquette Corporation, Gurnee, IL 60031-2392.
10
28 d, 30 g second 28 d, then 40 g until termination of the
study); D - basal diet for first 69 d then addition of 30 g
of sorbitol steer"! d"! until termination of the study.
Upon arrival at the research facility steers were all
weighed, ear tagged, and vaccinated against BVD, BRSV, IBR,
PI32, and Clostridium perfringens Types C and D^. Steers
were gradually placed on the final basal diet using three
diets over 28 d by decreasing roughage source and increasing
the amount of steam-flaked grain sorghum. Each
backgrounding diet (Tables 2.1, 2.2 and 2.3) was fed for at
least five d. The steers were implanted with Synovex-S^ at
the start of the experiment and at d 56. Steers were
weighed initially and at 28 d intervals through 112 d.
Steers reached market weight by 112 d and remained on
treatment an additional 7 d until slaughter was scheduled.
At the beginning and end (119 d) of the feeding period two
consecutive weights were taken to obtain full and shrunk
weights. Shrunk weights were obtained after 24 h without
feed and overnight without water. Additionally, steers fed
sorbitol starting on d 70 (treatment D) were weighed on d 69
before the morning feeding.
All diets were formulated to meet or exceed NRC (1984)
recommended requirements for CP, Ca, P and K. The final
basal diet is shown in Table 2.4. Sorbitol was added (via a
premix using ground grain sorghum as the carrier) to the
diets at 1% of diet DM. The amount of sorbitol premix was
2 Horizon IV. Bovine Rhinotracheitis-Virus Diarrhea-Parainfluenza3-Respiratory Syncytial Virus Vaccine, Modified Live and Killed Virus, Diamond Scientific, Company, Des Moines, lA.
3 Clostridium perfringes Types C & D, Coopers Animal Health, Inc., Kansas City, KS 66103.
4 Syntex Animal Health, 4800 Westown Parkway, W. Des Moines, lA 40265.
11
adjusted daily if needed to ensure proper sorbitol
consumption. Steers were maintained on treatment for 119 d.
Two steers were removed from the experiment; one steer on
treatment D died from bloat 22 d after initiation of the
study, and the other steer was removed from treatment B due
to hoof injury on d 84. Carcass data were obtained at a
commercial beef packing plant by trained university meat
science personnel. Livers were scored using the Elanco
abscessed liver classification system^.
There were four replications (pens) of seven steers
pen"! on each of the four treatments. Pens of steers served
as the experimental units in a completely randomized design.
The model included treatment and data were analyzed by
analysis of variance using the General Linear Model
procedure of SAS (1990). Treatment means were separated by
Tukey's Studentized Range test.
Results and Discussion
Supplementation of sorbitol over the 119 d feeding
period tended to alter gain efficiency (g of gain kg"! of
feed; P = .09; Table 2.5) of steers while DMI (P = .59) and
ADG (P = .19) were not affected. Numerical improvements
were exhibited by steers fed 30 g of sorbitol d"! (treatment
B) throughout the feeding period in G:F (P > .05; Figure
2.1) and ADG (P > .05; Figure 2.2) compared to steers fed no
sorbitol (treatment A) (175 vs. 168 [4.0 %] and 1.46 vs.
1.51 [3.4 % ] ; G:F and ADG; A and B, respectively; Table
2.5). Data summarized throughout the feeding period (Tables
2.6, 2.7, 2.8 and 2.9) indicate the numerical improvements
in steer performance from supplementing 30 g of sorbitol.
Steers receiving sorbitol at the variable rate (treatment C)
5 Liver Abscess Technical Information. Elanco Products Company, Cattle Products Marketing, Lilly Corporate Center, Indianapolis, IN 46285.
12
had lower ADG (P < .05) and G:F (P < .05) for the initial 28
d when fed 20 g of sorbitol d"! (Table 2.6), and thereafter
their performance appeared to be adversely affected (P >
.05), as exhibited in Tables 2.6, 2.7, 2.8 and 2.9.
Carcass data are shown in Table 2.10. Steers receiving
sorbitol only after 69 d (treatment D) had lower dressing
percentages (P < .002) than steers receiving the three other
diets. Dressing percent (hot carcass weight/live weight x
100) pertains to the carcass yield. It is a function of
gastrointestinal fill and carcass fat; therefore, fatter
cattle will usually dress higher (Romans et al., 1985). The
steers in this study were managed in the same manner, so it
was unlikely that fill was a factor. Carcass data such as
ribeye area and fat measurements did not show strong
differences that would help explain why the steers fed 30 g
of sorbitol d"! for last 50 d had lower dressing
percentages.
Quality grades were similar (P = .60). When observing
the quality grades (Choice, Select or Standard) assigned to
carcasses within each treatment as shown Table 2.11, it
appears that steers fed sorbitol had fewer carcasses that
graded Choice. Overall, the percentage of carcasses that
graded choice was 19% which is undesirable. Based on
carcass value, the target set for carcasses grading Choice
is at least 60%. The genotype and weight of these steers
would indicate a higher percentage of carcasses grading
Choice. The reason for the low percent of carcasses grading
Choice in this experiment is unclear. An overall treatment
effect tended (P = .16) to alter the color of carcass lean
tisssue. Steers supplemented sorbitol at a constant rate of
30 g d"! (treatment B) appeared to exhibit (P = .03)
carcasses with a more youthful bright cherry red color of
lean tissue.
13
As shown in Table 2.10 sorbitol tended to affect the
severity (P = .17) and the incidence of liver abscesses
(P = .11) of steers. An important note to realize when
considering the liver abscess data in this experiment is the
absence of antibiotic formulated into the diets as requested
by the funding agency.
In conclusion, the addition of sorbitol to steam-flaked
grain sorghum-based diets when fed to growing/finishing
steers in this experiment did not improve feedlot
performance of the steers. This is in contrast to results
reported by Fontenot and Huchette (1993) when finishing
steers were fed a corn silage-based diet supplemented with
sorbitol. However, steers fed 30 g of sorbitol d"! for the
last 50 d did exhibit (P < .002) a lower dressing
percentage. Also steers receiving 30 g of sorbitol d~! for
119 d exhibited (P = .03) a more youthful bright cherry red
color of carcass lean.
Implications
Supplementing sorbitol to steam-flaked grain sorghum-
based diets in this experiment did not improve feedlot
performance of steers. This is in contrast to data reported
by Fontenot and Huchette (1993) and Geay et al. (1992).
They reported that feedlot performance was improved when
sorbitol was supplemented to high corn silage-based diets.
Carcass characteristics were not altered except for (1)
steers fed 30 g of sorbitol d"! for the last 50 d had lower
dressing percentages (P < .002), and (2) steers receiving 30
g of sorbitol d~! for 119 d appeared to exhibit (P = .03) a
more youthful bright cherry red color of carcass lean.
Except for these two carcass characteristics, carcass data
exhibited in this study support earlier work reported by
Fontenot and Huchette (1993) and Geay et al. (1992).
14
Table 2.1. Composition^ of initial backgrounding diet.
Item Percent
Corn silage 56.40
Cottonseed hulls 31.00
Cottonseed meal 7.11
Urea .16
Molasses, cane 2.50
Animal/vegetable fat 1.20
Calcium carbonate .36
Dicalcium phosphate .20
Sodium chloride .16
Trace mineral premix^ .17
Vitamin A premix^ .21
AS700 premix^ .53
^ As-fed basis.
b Contained (ppm) I 1,232, Mn 8,069, Zn 8,409, Cu 827, Co
51, Fe 4,056.
c Contained 660,000 lU vitamin A kg"!.
^ Contained 6.16 g aureomycin and sulfamethazine kg"!.
15
Table 2.2. Composition^ of second backgrounding diet.
Item Percent
Corn silage 40.00
Steam-flaked grain sorghum 20.60
Cottonseed hulls 25.00
Cottonseed meal 7.77
Urea .25
Molasses, cane 3.30
Animal/vegetable fat 1.20
Calcium carbonate .65
Dicalcium phosphate .15
Sodium chloride .11
Trace mineral premix^ .22
Vitamin A premix^ .25
AS7 00 premix^ :_50
^ As-fed basis.
b Contained (ppm) I 1,232, Mn 8,069, Zn 8,409, Cu 827, Co
51, Fe 4,056.
c Contained 660,000 lU vitamin A kg"!.
^ Contained 6.16 g aureomycin and sulfamethazine kg"!.
16
Table 2.3. Composition^ of third backgrounding diet
Item Percent
Steam-flaked grain sorghum 62 . 05
Cottonseed hulls 23.47
Cottonseed meal 6.63
Urea .56
Molasses, cane 3.85
Animal/vegetable fat 1.12
Calcium carbonate .99
Dicalcium phosphate .04
Sodium chloride .21
Potassium chloride .09
Trace mineral premix^ .24
Vitamin ADE premix^ .33
Rumens in premix^ .42
^ As-fed basis.
^ Contained (ppm) I 1 232, Mn 8 069, Zn 8 409, Cu 827, Co
51, Fe 4056.
^ Contained (lU/kg) Vitamin A acetate 634,480; Vitamin D 63,448; Vitamin E 1,813.
^ Contained monensin at 3,044.8 mg/kg.
17
Table 2.4. Composition^ and analysis of final basal diet.
Item Percent
Steam-flaked grain sorghum 73.65
Cottonseed hulls 9.34
Cottonseed meal 7.47
Urea .37
Molasses, cane 3.27
Animal/vegetable fat 2.12
Calcium carbonate 1.27
Sodium chloride .17
Trace mineral premix^ .24
Vitamin ADE premix^ .33
Rumensin premix^ .84
Control premix® .93
Sorbitol premix^ .00
Analysis^
DM, % 83.03
CP, % !3.03
.67
.32
.67
Ca, %
P, % K, % NEm, Meal/kg 3.78
NEg, Mcal/kg !'25 ^ As-fed basis. b Contained (ppm) I 1,232, Mn 8,069, Zn 8,409, Cu 827, Co 51, Fe 4056. c Contained (lU/kg) Vitamin A acetate 634,480; Vitamin D 63,448; Vitamin E 1,813. ^ Contained monensin at 3,044.8 mg/kg. e Contained 2.0% mineral oil and 98.0% ground grain sorghum f Contained 2.0 % mineral oil, 23.6% ground gram sorghum and 74.4% sorbitol. g Analyzed, except for NEm and NEg, which were calculated, on a DM basis except for DM.
18
Table 2.5. One hundred-nineteen day feedlot performance^
Treatment
A B C
Item
Variable Start 30
Control 30 g/d rate g on d 70 SEM^ P
Initial
wt^, kg
DMI, kg
ADG, kg
G:F^
F:Ge
Final
wt, kg
340.5
8.68
1.46
168
5.93
514.2
338.6
8.65
1.51
175
5.73
518.3
330.9
8.39
1.38
164
6.08
495.1
334.5
8.48
1.46
172
5.80
508.2
8.68
.174
.040
2.71
.094
16.15
.35
.59
.19
.09
.09
.19
^ 119 d performance using shrunk weights.
^ Standard error of the mean.
^ Average initial shrunk weight after one d off feed and
without water overnight.
^ Gain efficiency = g of gain kg"! of feed.
® Feed to gain ratio.
19
Table 2.6. Initial twenty-eight day feedlot performance^.
Item
DMI,
ADG,
G:F®
F:Gf
kg
kg
A
Control
8.09
2.39C
295C
3.39C
Tr€
B
30 g/d
7.94
2.35C
296C
3.37C
jatment
C
Variable
rate
7.62
1.95^
256^
3.91^
D
Start 30
g on d 70
7.79
2.I2C
272Cd
3.5lCd
SEM^
.159
.111
9.08
.115
P
.25
.04
.02
.02
^ 28 d performance summary.
^ Standard error of the mean.
C/d Means in same row with different superscript differ.
® Gain efficiency = g of gain kg"! of feed.
^ Feed to gain ratio.
20
Table 2.7. Initial fifty-six day feedlot performance^
Treatment
A B C D
Item
DMI,
ADG,
G:FC
F:G^
kg
kg
Control
8.50
1.97
232
4.32
30 g/d
8.33
1.97
236
4.23
Variable
rate
8.04
1.81
225
4.44
Start :
g on d
8.15
1.90
233
4.30
30
70 SEM^
.143
.049
4.77
.089
P
.16
.13
.45
.45
^ 56 d performance summary.
^ Standard error of the mean.
^ Gain efficiency = g of gain kg"! of feed.
^ Feed to gain ratio.
21
Table 2.8. Initial eighty-four day feedlot performance^
__ ^ ^ __ ^ Treatment
A
Item Control
B C D
Variable Start 30
30 g/d rate g on d 70 SEM
DMI,
ADG,
G : F C
F:G^
kg
kg
8 . 6 6
1 . 7 2
1 9 9
5 . 0 4
8 . 5 1
1 . 7 7
2 0 8
4 . 8 1
8 . 2 7
1 . 5 9
192
5 . 2 0
8 . 2 9
1 . 6 6
2 0 0
5 . 0 0
. 1 6 5
. 0 5 6
3 . 8 7
. 0 9 7
. 3 2
. 1 8
. 1 0
. 1 0
^ 84 d performance summary.
^ Standard error of the mean.
^ Gain efficiency = g of gain kg"! of feed.
^ Feed to gain ratio.
22
Table 2.9. One hundred-twelve day feedlot performance^
Treatment
A B C D
Item Control
Variable Start 30
30 g/d rate g on d 70 SEM
DMI,
ADG,
G : F C
F:G^
k g
k g
8 . 7 0
1 . 6 7
1 8 8
5 . 3 2
8 . 6 7
1 . 6 8
194
5 . 1 5
8 . 3 8
1 . 5 4
1 8 3
5 . 4 7
8 . 4 7
1 . 5 8
1 8 5
5 . 3 6
. 1 7 5
. 0 4 2
3 . 8 0
. 1 0 8
. 5 3
. 1 3
. 2 9
. 2 9
^ 112 d performance summary.
^ Standard error of the mean.
^ Gain efficiency = g of gain kg"! of feed.
^ Feed to gain ratio.
23
Table 2 . 1 0 . Carcass c h a r a c t e r i s t i c s .
Treatment B
Item Variable Start 30 g
Control 30 g/d ra te on d 70 SEM^
HCWT^*, k g
Dress ing % REA®, cm2
B a c k f a t ^ ,
cm
KPH, %
Y i e l d
graded
Marbling
score^
Quality
grade^
Lean
colorD
Liver
score^
318.4
62.1^
74.5
1.30
1.75
3.1
316.0
61.5C
76.5
1.24
1.69
2.9
307.2
61.9^
75.5
1.22
1.85
2.9
452.8 437.5 444.5
10.7
4.7
.70
10.3
5.3
.80
10.5
5.0
1.17
312.6
59.8«i
79.4
1.09
1.76
2.6
434.5
10.3
4.9
.64
4.91
.287
2.23
.102
.059
.199
11.7
.218
.165
.170
34.5 9.40
43
0004
49
85
36
44
,70
60
16
17
11
Liver abscess incidence!, %
39.3 38.6 66.7 ^ Standard error of the mean. ^ Hot carcass weight. C/d Means in same row with different superscript differ. ® Ribeye area in square, cm. f Backfat thickness, cm. g Calculated using USDA yield grade equation. h Marbling score; slight = 400; small = 500. i Quality grade; Choice"= 12; Select"*"=ll; Select"=10. J Lean color; light = 8; dark = 1. ^ Liver score using the Elanco abscess liver classification system. ! Liver abscess incidence by treatment; percent of steers with at least one liver abscess.
24
Item
Choice"
Select"*"
Select"
Standard"*"
A
Control
32.1
10.7
50.0
7.2
B
Treatment
30 g/d
15.4
15.4
57.7
11.5
C
Variable
rate
15.4
26.9
53.8
3.9
D
Start 30 g
on d 70
14.8
7.4
74.1
3.7
^ Percent of carcasses in each grade by treatment.
Figure 2.1. Gain efficiency of steers fed either basal diet (Control), 30 g sorbitol steer"! d"! (30 g/d), variable rate (Variable) (20 g first 28 d. 30 g second 28 d, then 40 g of sorbitol steer"! (j-l until termination) , or 30 g sorbitol steer"! j-l only after 69 d (30 g/d last 50 d) (SEM = 2.71).
Figure 2.2. Average daily gain of steers fed either basal diet (Control), 30 g sorbitol steer"! ^-1 (30 g/d), variable rate (Variable) (20 g first 28 d, 30 g second 28 d, then 40 g of sorbitol steer"! ^-1 until termination), or 30 g sorbitol steer"! d"! only after 69 d (30 g/d last 50 d) (SEM = .040).
27
CHAPTER III
EFFECTS OF PROTEIN SOURCE AND SORBITOL
SUPPLEMENTATION ON PERFORMANCE
OF INCOMING FEEDLOT
STEERS
Abstract
A 28 d experiment was conducted to evaluate the
effects of protein source and level of sorbitol
supplementation on performance of incoming crossbred steers
(262 ±21.7 kg; n = 260) using a randomized block design
with a 2 X 3 factorial arrangement of treatments. Protein
source was either a low ruminally degradable (LD) mixture or
a readily ruminally degradable (RD) protein supplement.
Sorbitol was fed at either 0, 30 or 60 g steer"! d"!.
Feedlot performance measures (DMI, ADG, gain efficiency,
G:F, g of gain kg"! feed) were not improved by feeding LD
protein or by sorbitol supplementation during- the 28 d
receiving period. However, there was a tendency (P = .18)
for an interaction between protein source and level of
sorbitol for gain efficiency.
Introduction
Sorbitol has been reported to improve feed conversion
in calves and finishing steers (Fontenot and Huchette, 1993)
and finishing bulls (Geay et al., 1992) when supplemented in
corn silage-based diets. Geay et al. (1992) fed sorbitol
(50 g d"!) plus low ruminally degradable protein to
finishing bulls and reported increased ADG (+ 18%) and feed
efficiency (+ 14%). However, when supplementing sorbitol to
a steam-flaked grain sorghum-based diet only numerical
improvements in feed efficiency and daily gains by finishing
steers have been reported (Boyles and Richardson, 1993).
28
Cattle arriving at feedlots are usually stressed
because of transport and from being without feed; thus these
animals are depleted of nutrients. This problem is
confounded by the low DMI of these cattle during the
receiving period. Thus, it is important to formulate
receiving diets properly to restore lost body nutrients.
Eck et al. (1988) suggested that incoming feedlot cattle
have a requirement for low ruminally degradable protein.
Therefore, because of the benefit of supplementing sorbitol
to veal calves, steers and bulls in conjunction with
evidence for improved 28 d performance of cattle fed a
source of low ruminally degradable protein, it seemed
fitting to conduct a 28 d receiving study to evaluate the
effects of protein source and level of sorbitol
supplementation on performance of incoming crossbred steers.
Materials and Methods
A 28 d study was conducted to evaluate the effects of
protein source and level of sorbitol supplementation on
performance of incoming crossbred steers! (262 ± 21.7 kg; n
= 260) using a randomized block design with a 2 x 3
factorial arrangement of treatments. Pen location within
the feedlot served as blocks. Protein source was either a
low ruminally degradable (LD) protein mixture (Preston and
cottonseed meal, 22%; hydrolyzed feather meal, 33%; and meat
and bone meal, 22%) or a more readily ruminally degradable
(RD) source (soybean meal). Sorbitol was supplemented at 0,
30 or 60 g steer"! (j-l. Upon arrival at the Texas Tech
feedlot, steers were weighed, ear tagged, dewormed^ and
! Source: Oklahoma City Livestock Auction, OK.
2 ivomec-F, MSD-AGVET, Division of Merck and Company, Inc., Pathway, NJ 07065.
29
immunized against BVD, BRSV, IBR, PI33 and Clostridium
perfringens type C and D^. Steers were fed a steam-flaked
grain sorghum, cottonseed hull-based diet (Table 3.1) for 28
d. Sorbitol^ (granular form) was supplemented via a premix
with ground sorghum used as the carrier. Sorbitol premix
(85% sorbitol, 13% ground grain sorghum plus 2% mineral oil)
and a control premix (contained 98% ground grain sorghum
plus 2% mineral oil and no sorbitol) were adjusted daily if
needed based on pen feed intake to insure proper sorbitol
consumption.
There were five replications (pens) of eight or nine
steers pen"!, on each of the six treatments. One pen of
nine steers fed LD protein plus 30 g sorbitol d"! were
removed from analysis because the diet was inadvertently
changed to LD protein without sorbitol seven d after
initiation of the experiment. Pens of steers served as the
experimental units in a randomized block design with a 2 x 3
factorial arrangement of treatments. Pen location served as
the blocks. The model included blocks, protein source,
sorbitol level and protein source*sorbitol level
interaction. Data were analyzed by analysis of variance
using the GLM procedure of SAS (1990).
Results and Discussion
No interactions existed between protein source and
level of sorbitol for DMI (P = .75; Figure 3.1). There was
3 Horizon IV. Bovine Rhinotracheitis-Virus Diarrhea-Parainfluenza3-Respiratory Syncytial Virus Vaccine, Modified Live and Killed Virus. Diamond Scientific, Company, Des Moines, lA.
4 Clostridium perfringens Types C & D, Coopers Animal Health, Inc., Kansas City, KS 66103.
5 Neosorb^ Sorbitol supplied by Roquette Corporation, Gurnee, IL 60031-2392.
30
a tendency for an interaction between protein source and
level of sorbitol for ADG (P = .20; Figure 3.2) and gain
efficiency (P = .18; Figure 3.3). The low ruminally
degradable protein mixture tended to lower DMI, not affect
ADG and tended to improve G:F (Table 3.2; 8.0 vs. 8.21, P =
.20; 2.09 vs. 2.06, P = .69; 262 vs. 250, P = .21; DMI, ADG,
and G:F for LD vs. RD, respectively). Feedlot performance
of steers was not improved by sorbitol supplementation
(Table 3.2; 7.96, 8.30, 8.04, P = .27; 2.02, 2.16, 2.04, P =
.44; 254, 260, 255, P = .90; DMI, ADG and G:F, for 0, 30 and
60 g of sorbitol, respectively).
The overall means and corresponding coefficients of
variation (CV) for DMI, ADG and G:F were 8.11, CV = 5.58%;
2.01, CV = 11.16%; and 256, CV = 8.95%, respectively. The
average DMI of steers in this receiving study was 2.8% of
body weight (body weight = average of initial and 28 d
weights). Dry matter intake of this magnitude for incoming
steers is quite good. Therefore, a possible explanation for
the lack of statistical effect found in this experiment
could be associated with the DMI of these steers during the
28 d receiving period.
In conclusion, performance of steers during the 28 d
receiving period was not improved by feeding a low ruminally
degradable protein mixture or by sorbitol supplementation at
either 3 0 or 60 g steer"! day"!; however, there was a
tendency for an interaction between protein source and
sorbitol level for feed efficiency.
Implications
Under stressful conditions when cattle usually lower
their feed intake, a feed additive such as sorbitol,
theoretically should benefit the animal. Likewise, low
ruminally degradable protein has been shown to improve 28 d
31
incoming performance of cattle. However, this study did not
produce data supporting a benefit of sorbitol
supplementation or a low ruminally degradable protein source
to incoming feedlot steers. The lack of response by steers
^ Dry matter basis. b Contained (ppm) I 1,232, Mn 8,069, Zn 8,409, Cu 827, Co 51, Fe 4,056. c Contained 660,000 lU kg"! vitamin A. ^ Contained 6.16 g aureomycin and sulfamethazine kg"!. 6 Contained 15 % blood meal, 8 % corn gluten meal, 22 % cottonseed meal, 33 % hydrolyzed feather meal, and 22 % meat and bone meal. f Contained 2.0 % mineral oil, 23.6 % ground grain sorghum and 74.4 % sorbitol. g Contained 2.0 % mineral oil and 98.0 % ground grain sorghum. h DM basis except for DM.
33
.
a) o c <c s u 0
<Mh
Q)
4-> 0
i H
feed
> <o
43 tr •H
1
• P
c 0)
*• u 0
(M
to c (0 0) S i r
.nally
rotein
rumi
le p:
^ 4 2 ^ <0
S« 1 ^ «-§
c • H
> . < " . ^ • P Zi 0
0)1 ^ TJ g 1 ^ (0
4J (0 0) v^ EH
• CM
. ro
0) f H A
Hi
^ & 0)
•0
to Q) 3
i H
>
(I4
T3
"5
0 -p • H
4:3 ^ 0 in
43 t/D
X
04
Sorb
4J 0 U a*
(d
w W
0 VO
0 CO
0
0 VO
0
en
0
g 0)
4-> H
•^ ' t
cn
n ^
^ CO
CO
CM
0 H
265.6
60.7
r
"(t •
H VO CM
• CM VO CM
in •
00 in CM
CM
CM
tn 0 r-i X u (d (1) T H «-
Si -P 6 -H 4J ;3 c :? a H
in
•
r CM
•
0 CM
•
0 CM CM
•
8.08
0 'St
.
CO
VO
8.1
0 0
. 00
0 CM
• 00
VO
• r
tr M
^ H
s Q
0 CM
•
^
•
OS VO
•
in CM H
• 1.92
in H
. CM
0
2.1
VO H
• CM
VO H
• CM
in OS
•
H
T3 •0 0)
t r 0) >J <w
• t
* C tJ -H Q (C < 0
00 H
•
0 ON
•
H CM
•
• H H
238
256
1 ^
in CM
H t^ CM
VO CM
H in CM
tJ> ^ ' ^ 0>
^ r^ H
•
4.20
H ON
.
0
3.9
0 t^
. en
0 00
n
00 OS
• m
0) c
rH 00
* CM H
319.4
20.9
n
CM •
0 CM
0
• n CM n
0 •
ON H
00 •
H CO
^ .
•H 4J (d IS 0 • • i H
TJ <d &* 0) c ^ 0) -H CL, (i<
. C <0 0) g
Q) 43 4->
0
V4 0 u u 0)
73 U (d
•0 c (d -p CO
<d
ion.
4J 0 Id
nte
• H
i H 0) > Q)
r H
r-i 0
4J • H 43 U 0 (0
X
Q) 0 M
SOU
c • H
Q) -P 0 VH CI4
43
• to
• H to
i H <d c (d
0 ^
(M
T3 0) > 0 g 0) VH
0)
0) :^
eers
+J to
ine
c < 4 - l
0.-
c 0) cu
4-> C 0) s +J (d (U
4->
U Q) a to u Q) 0)
+J to
0
^ 0)
43 g 3 ^
0
• 73 0) (1)
0
H 1 tr ^
c • H (d tp
0
tJN
^ > 1 0 c 0)
•H 0
• H (M (M Q)
C • H
<d 0
TJ
• 0
•H 4J (d
•H (d 0 • •
TJ 0) (U ELI
(U
3A
8.40
8.30
8.20
^ 8 . 1 0
^ 8.00
7.90
7.80
7.70 1 30
Sorbitol, g/d 60
LD Protein » RD Protein
Figure 3.1. Dry matter intake of steers fed either low ruminally degradable protein (LD Protein) mixture or readily ruminally degradable protein (RD Protein) supplement (SEM = .220).
35
2.5 -r
2.3 --
^2.1 I
< 1-9 +
1.7 --
1.5 30 60
Sorbitol, g/d
LD Protein » RD Protein
Figure 3.2. Average daily gain of steers fed either low ruminally degradable protein (LD Protein) mixture or readily ruminally degradable protein (RD Protein) supplement (SEM = .125).
36
275 J
-O 270 --
^ 265 --o 260 +
^
•1 255 +
•S250 +
^^245 +
O 240 --
: : 235 1 30
Sorbitol, g/d 60
LD Protein * RD Protein
Figure 3.3. Gain efficiency of steers fed either low ruminally degradable protein (LD Protein) mixture or readily ruminally degradable protein (RD Protein) supplement (SEM = 11.1).
37
CHAPTER IV
EFFECTS OF SORBITOL ON SODIUM DEPENDENT
AND SODIUM INDEPENDENT GLYCINE AND
LEUCINE UPTAKE BY CULTURED
BOVINE KIDNEY CELLS
Abstract
A series of in vitro experiments were conducted in the
presence or absence of sodium to determine if sorbitol at
concentrations ranging from 10"^ to 10"!^ molar affects
glycine and leucine uptake by cultured bovine kidney cells.
Sorbitol tended (P = .094) to improve glycine uptake by
cultured bovine kidney cells when sodium was present in the
incubation media. However, addition of sorbitol when sodium
was absent improved (P = .0001) glycine uptake under these
experimental conditions.
Concentrations of sorbitol ranging from 10"^ to 10"!^
molar did not alter sodium dependent (P = .36) leucine
uptake by cultured bovine kidney cells. But as was seen
with glycine, the addition of sorbitol in the absence of
avoid unstirred aqueous layers. The uptake incubation was
terminated at exactly two minutes by decanting uptake medium
and immediate addition of one mL of ice-cold phosphate
buffered saline twice for 15 seconds. To facilitate rapid
washing and treatment application, construction of wash
trays and treatment application trays were done according to
procedures of Vadgama (1989) (Appendices E and F).
The intracellular labeled amino acid was extracted
from the cell layer in each well with 220 |iL of 5%
trichloroacetic acid for one hour and 200 |iL of the extract
was counted in 5.0 mL of scintillation fluid in a liquid
scintillation counter. The protein content was determined
using a modification of the methodology of Lowery et al.
(1957) (Appendix D).
Data from 6 experiments for each amino acid were pooled
and analyzed in a randomized block design using the GLM
procedure of SAS (1990) for both the sodium dependent
(sodium present) groups and the sodium independent (sodium
absent) groups. Days in which the 6 experiments were
conducted served as the blocks. The model included blocks
and sorbitol level. Treatment means were separated by the
42
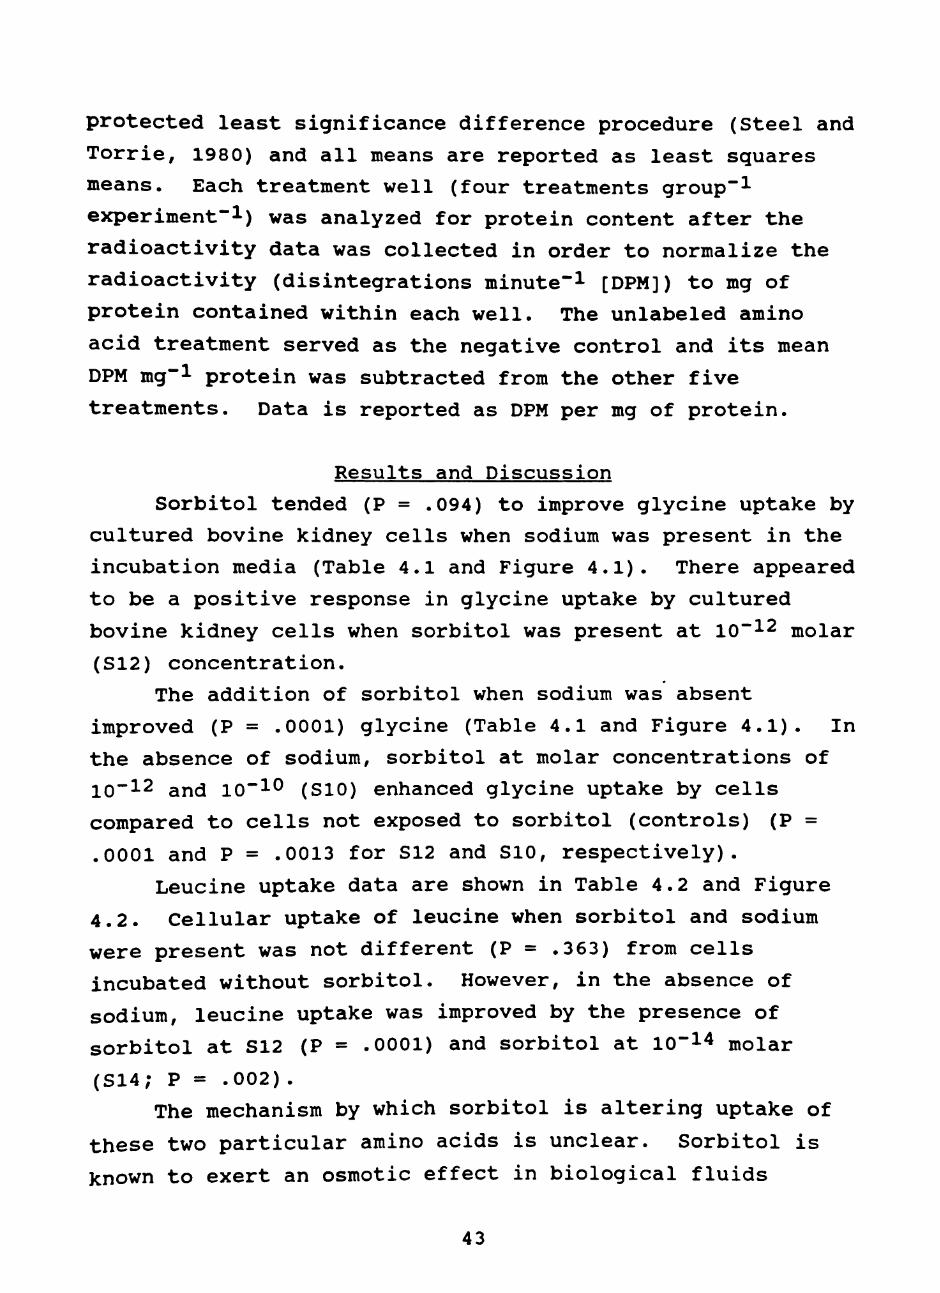
protected least significance difference procedure (Steel and
Torrie, 1980) and all means are reported as least squares
means. Each treatment well (four treatments group"!
experiment"!) was analyzed for protein content after the
radioactivity data was collected in order to normalize the
radioactivity (disintegrations minute"! [DPM]) to mg of
protein contained within each well. The unlabeled amino
acid treatment served as the negative control and its mean
DPM mg"! protein was subtracted from the other five
treatments. Data is reported as DPM per mg of protein.
Results and Discussion
Sorbitol tended (P = .094) to improve glycine uptake by
cultured bovine kidney cells when sodium was present in the
incubation media (Table 4.1 and Figure 4.1). There appeared
to be a positive response in glycine uptake by cultured
bovine kidney cells when sorbitol was present at 10"!2 molar
(S12) concentration.
The addition of sorbitol when sodium was absent
improved (P = .0001) glycine (Table 4.1 and Figure 4.1). In
the absence of sodium, sorbitol at molar concentrations of
10~!2 and 10"!^ (SIO) enhanced glycine uptake by cells
compared to cells not exposed to sorbitol (controls) (P =
.0001 and P = .0013 for S12 and SIO, respectively).
Leucine uptake data are shown in Table 4.2 and Figure
4.2. Cellular uptake of leucine when sorbitol and sodium
were present was not different (P = .363) from cells
incubated without sorbitol. However, in the absence of
sodium, leucine uptake was improved by the presence of
sorbitol at S12 (P = .0001) and sorbitol at 10"!^ molar
(S14; P = .002).
The mechanism by which sorbitol is altering uptake of
these two particular amino acids is unclear. Sorbitol is
known to exert an osmotic effect in biological fluids
43
(Merck, 1989) until it is metabolized. Sorbitol is most
likely exerting some osmotic effect. This may partially
explain the response elicited by sorbitol at concentrations
above 10"!0 molar on glycine and leucine uptake as exhibited
in Figures 4.1 and 4.2. Perhaps the presence of sorbitol in
the range of 10"!2 molar alters the sodium gradient or
membrane potential, thereby modifying glycine and leucine
transport.
In conclusion, data indicate that the presence of
sorbitol increases sodium independent cellular uptake of
glycine and leucine by cultured bovine kidney cells under
these experimental conditions. Further research is needed
to elucidate the effect exhibited by sorbitol concentration
at 10"!2 molar on glycine and leucine uptake.
Implications
The possibility exists based on these data that
sorbitol alters glycine and leucine transport by cultured
bovine kidney cells. Bender (1985) states that mammalian
amino acid transport is assumed to be similar in other
tissues as it is in the renal epithelium. Therefore, it may
be possible that sorbitol increases skeletal muscle uptake
of glycine and leucine in vivo.
44
C • H O > i
rH tJ^
4J C 0)
T3 C (U CI4 (U
c • H
TJ C (d
+> c (U
TJ C 0) 0)
:3 • H •P • o<d to to
a*
43
s CO
c 0 *
0 4J •H
tH Q) U
>i
0) C
^ -o }-l •H 0 ^ to (M 0
4J
Q) C •H > 0
0 43
u (d
iH
o
to c o
• H 4-) (d
4J C 0) o c o o
o 4J • H
u o w
«w >J <M 4 3 U
(1) • X
H (d
. 4J
rH
(d
CM
o
O iH I O H
00 I
o H
V O I
o
I
o
6 0) 4J
ON O
cn CM
g :3
• H
o
^ ^
00 00 00
n CM V O iH
O O
00 CM VO
OS m V O
o O N in
O 4J c Q)
C Q)
0) • H T3 O to
o o o
o V O
0) T3 in O N 00
H C>J CM
00 CJN O N
o O N 00
Q)
CTN 00
0
ON
OS
VO CO CO
4J
c 0)
TJ C 0) CM Q)
T3
c •H
to +) c (U
•H
0) (d & Q)
Q)
X • H to
Q) 43 4J
g 0 u «4-l
(d 4J (d T3
T3 (U iH 0 0
0
u 0 M U Q)
-0 M (d •0 c (d +>
c • H 0) +) o
in o
V
u <4-l <t-l • H
to +> •H U o to
0)
a to +> c 0) M Q) (M (M •H 73
H 43 I 4J ON -H
I
c • H
to c o
•H 4J (d u t7
o
0) g (d to
c •H
to c 0) (d 0)
cu CO
4J
c •H to (M
•H » O (U
rd 43 0 T3
45
0) c
• H O 0)
4J C 0) TJ C 0) (X Q)
T3 C
• H
T3 C (d
+J c <u C 0) cu
e • H TJ O • tO(d
to C rH O r
0) .H O o
+J >1 • H Q) 43 C U TJ O -H to X
<4H 0 )
o c • H
+J >
^ 2 0) 13
(M <tH >i H 43
Q) CM <d
. +> :3
0) rH 43 (d
EH
cu
43 X H (0
^ tH
1
m so n •
CM • ID CM SO
C^ CD 00
O O O •
cn •
^ CD in
9 CM so m
CM
U (0
>H
o E
a c o
•H
«
c 0) o c o u
o -H i3
o (0
00 I o
so I o
I o
E
4J
CM
o in
CM
00
cn
H as in
0) •o in in CM
o n o
CM
SO
o
CM
00
00
CN
CM
CM
•o o
so OS
•o in so
T3
o
OS
E 3
• H T3 O M
U
c 0)
T3 C
s. •o
E •H TJ 0
CO
4J c 0)
•o c
8L 0) •o c
to +) c Q> g
•H
o (d cu Q) X g (U
X •H to g o
<4H
(d +J (d
T3
T3 Q)
r-i o o
j : : 4J
4H o
o u u 0)
T3 M <d
T3 c (d +)
cu CO
c •H
o u
c • H g
in o
V
cu
u Q)
(M (M •H TJ
to 4J a •H
0
to u Q) CU to 4J
c (U »H
0) 0) 4 J <4H
«4H • H
CU 73 H i : I +> DN - H g >
O
g (d to
to c o
•H 4J (d M tr 0)
c • H to <4H
• H » Q 0)
C •H
to c (d 0)
(d A O TJ
46
4 6 8 10 12
[Sorbitol], lO-molar
•- glycine NA -B- glycine WO
Figure 4.1. Effects of sorbitol on glycine uptake by cultured bovine kidney cells in the presence of sodium (glycine NA; SEM =123.4) or in the absence of sodium (glycine WO; SEM = 60.1).
47
14000 X
13000 --
2 12000 +
E 11000 --
10000 --
9000 6 8 10
[Sorbitol], lO-molar 12 14
-•- leucine NA -B- leucine WO
Figure 4.2. Effects of sorbitol on leucine uptake by cultured bovine kidney cells in the presence of sodium (leucine NA; SEM = 625.2) or in the absence of sodium (leucine WO; SEM = 584.3).
48
CHAPTER V
CLEARANCE OF INTRAVENOUSLY
ADMINISTERED SORBITOL
IN STEERS
Abstract
Ten crossbred steers (365 ± 17 kg) were used to
determine the effect of intravenous administration of
sorbitol. Steers were fed a steam-flaked grain sorghum,
cottonseed hull based diet for 14 d prior to receiving an
intravenous infusion. Steers were not offered feed 24 h
prior to receiving intravenous injections in each of two
experimental periods. Steers were randomly allotted to
treatments (two steers per treatment) and were intravenously
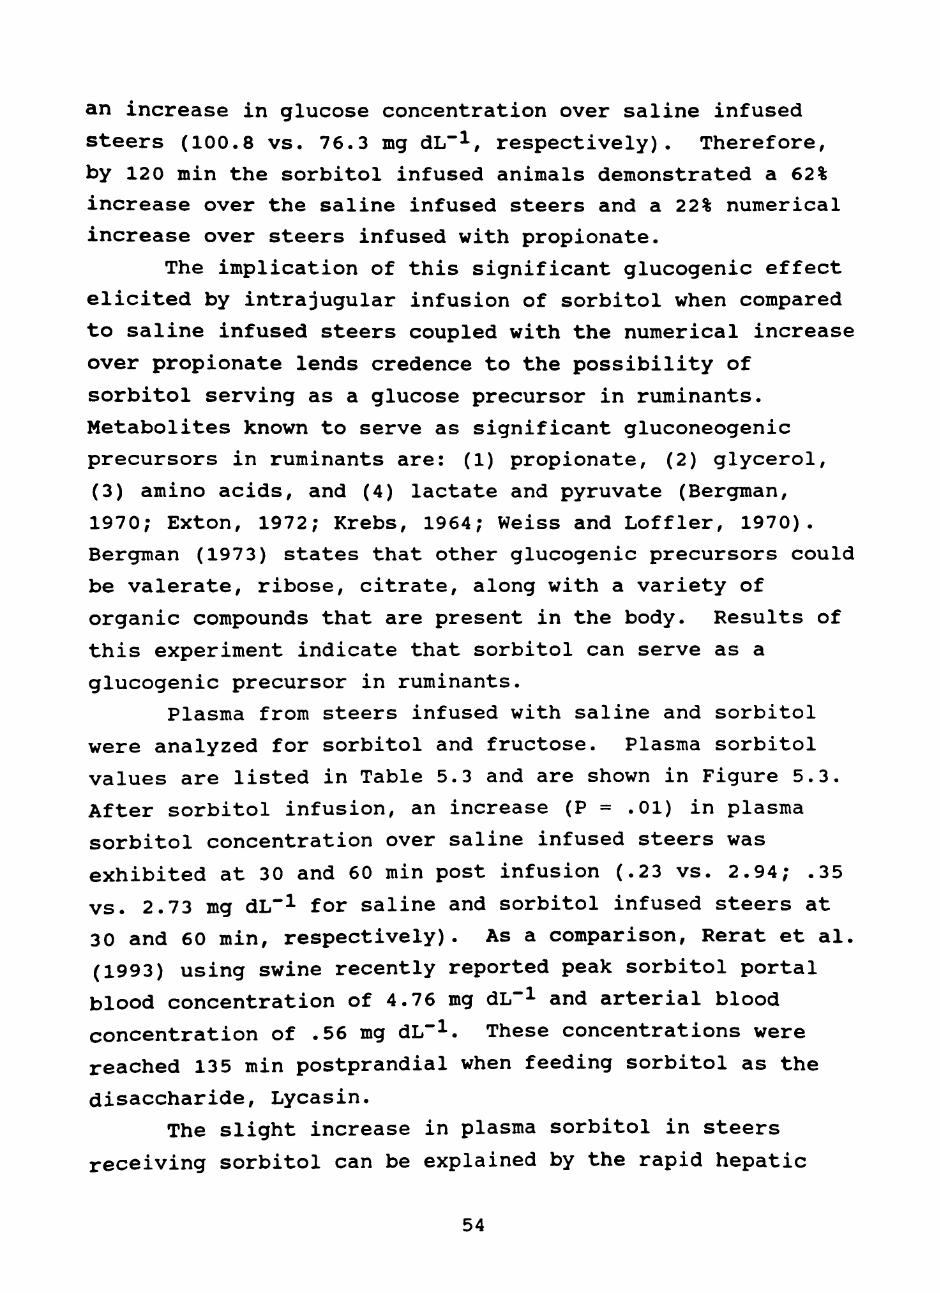
concentrations found in lactating dairy cows (Willett,
1993), the fructose baseline concentration of 35.1 mg dL"! ±
2.88 could be attributing to the difference in total blood
reducing sugar and glucose. Further investigation is needed
to adequately document steer plasma fructose concentrations
in this experiment.
Plasma fructose levels were similar for saline and
sorbitol infused steers until 120 min post infusion (Table
5.4). At 120 min the plasma fructose of saline infused
steers were higher (P = .002) than steers that received
sorbitol (44.6 and 27.7 mg dL"!, respectively). At 240 min
plasma fructose were similar (P = .31, 24.5 and 29.8 mg
dL"!; for saline and sorbitol infused steers, respectively).
Then by 360 min post infusion, steers that received saline
possessed higher (P = .03) plasma fructose levels than those
steers infused with sorbitol (34.2 and 22.7, respectively).
In conclusion, only glucose and sorbitol when
intravenously administered produced statistical increases (P
< .05) in steer plasma glucose. Sorbitol was rapidly
cleared and elicited an increase in plasma glucose.
Therefore, data indicates that sorbitol possesses a
gluconeogenic property in steers.
Implications
Intravenous administration of sorbitol in beef steers
increases plasma glucose concentrations. These data support
56
earlier work of Bye (1969) in humans, Seeberg et al. (1955)
in rabbits and Todd et al. (1939) in dogs and also exhibits
that sorbitol when infused intrajugularly in steers
increases plasma glucose. Results of this experiment
indicate that sorbitol can serve as a glucogenic precursor
in ruminants.
57
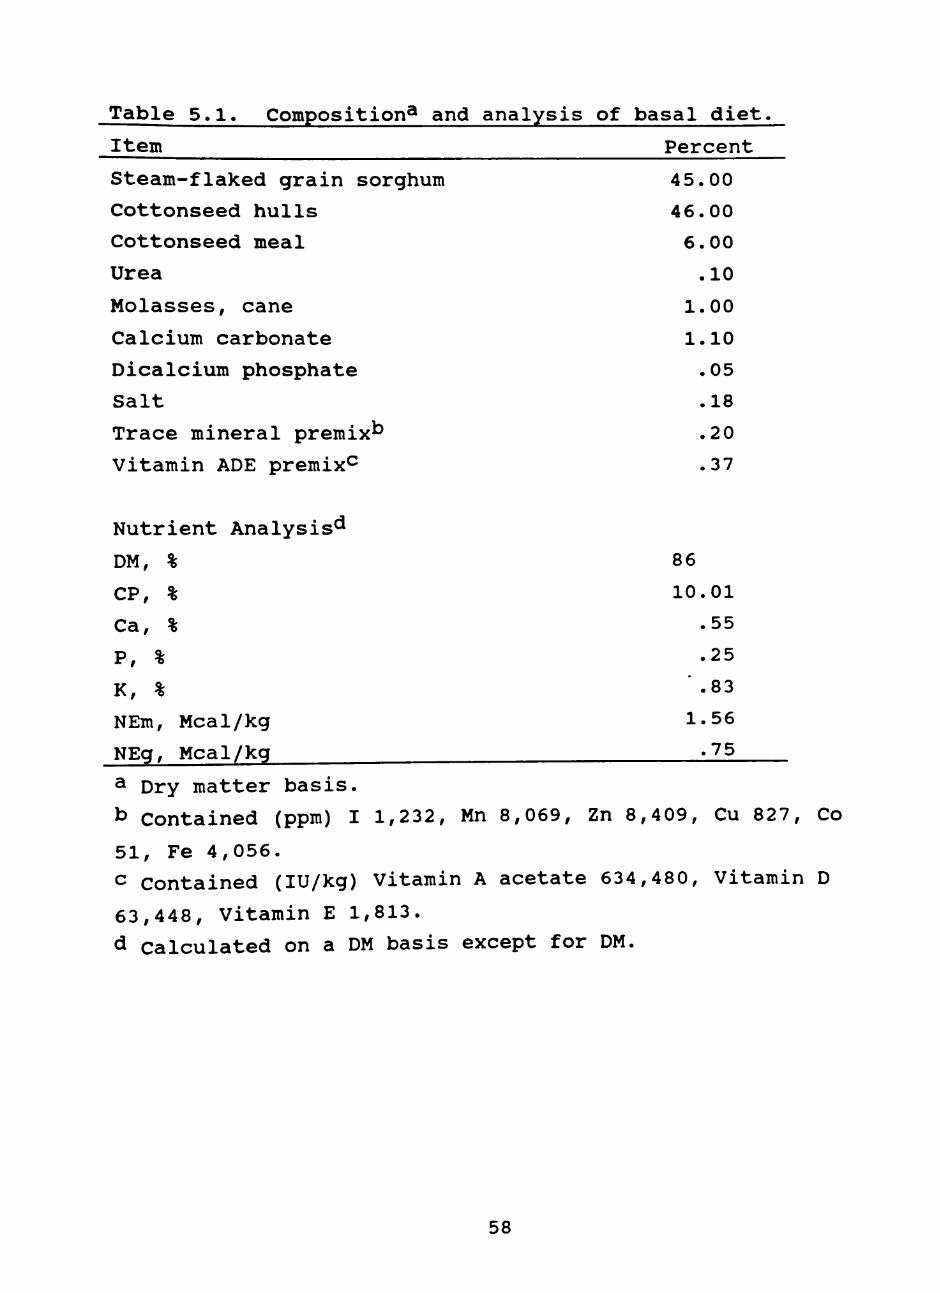
Table 5.1. Composition^ and analysis of basal diet.
Item Percent
Steam-flaked grain sorghum 45.00
Cottonseed hulls 46.00
Cottonseed meal 6.00
Urea .10
Molasses, cane 1.00
Calcium carbonate 1.10
Dicalcium phosphate .05
Salt .18
Trace mineral premix^ .20
Vitamin ADE premix^ .37
Nutrient Analysis^
DM, % 86
CP, % 10.01
Ca, % .55
P, % .25
K, % *.83
NEm, Mcal/kg 1.56
NEg, Mcal/kg -75
^ Dry matter basis.
b Contained (ppm) I 1,232, Mn 8,069, Zn 8,409, Cu 827, Co
51, Fe 4,056. c Contained (lU/kg) Vitamin A acetate 634,480, Vitamin D
63,448, Vitamin E 1,813.
d Calculated on a DM basis except for DM.
58
u fH tl)
tJN (d :3 c
't-y O (d -H ^ 0*
4-> c
•H
o u 0*
<d iH o
tJN4-> C - H
•H 43 > U
•H O Q) to O 0) -U Q)
to to O U U 0) u
4-> to to
<d 3 tr 0)
o
43 tr •H 0)
o •H •H O Si <d
0)
g
^1
o to o
<D 0 tJN to 3 0 ^ u 3
f H
CT
V
rg •
fNj
t r (U 4-> 43
<d + J g to <d
•H 0)
•-ixi
<d
to c o •H
D44-> 4 J
c (d 0) S
* OJ
• in
0) rH 43 (d EH
•H ^
C 0
:3 rH
• o c •H
iH (d to
O <4H to
• H d B to O p in (H
c •H c:
•H
0
0) g 3
rH 0 >
•J
tJN
g
O to O U rH
o <d g to fO
iH CU
c O
•H to
c M
4-> to O CU to 0) 4J
c •H
o VO
o <N
O
O VO
O n
CM
<d
c o g (d 0)
VO
n t^
43 ' I '
* H t^
43
• VO
43 ^
• VO t^
43 in
in t^
43 ON
• in r-
^
VO t^
0) c -H
r-{ (d t/3
O
OS CO
0 t^
• OS O rH
T3 VO
.
15
2
73 o
• OS 00 H
0 OS
H n <N
0 VO
. 00 r-cn
00
m r
Q) tu to 0 U 3
rH
o
cn
t^ VO
43 VO
• 00 VO
43
• in
43 00
t
o 00
43 t^
00 r
43 CM
• cn t^
in
VO VO
0) to 0 u 0 3 tn
cn
<JN t^
0 43
• cn ON
T3 0
12
2.
u CM
• ^ H H
43 VO
o O H
43 ^
• r t^
H
cn
((H rH 0 4J •H 43 U 0 Ui
o in 00
0 43 in
• ON CO
0 43 00
10
0.
u 43
VO
10
4.
43 •^
cn o H
43 VO
CO
cn
t^ t^
4J Id c 0
•H a 0 u cu
in o
• CM in
• H H
^ c (d 0) g (U 43 4J
<H 0
u 0 u u 0)
T3 V4 (d •0 c (d 4-> t/3
^ Q) ((H (M •H T3
to +J Q
•H V4 u to M 0) a 3 to
4-> c (U u 0) IM I4H •H T3
x: •H >
c uin
r-{ 0 0
(U g (d to
c •H
to c <d 0) s
TJ ^
0
. ^-^ in o
•
V
cu
4J 0 0)
((H (M 0)
0 •H +J Id u TJ (d P a
•
in o
•
V
cu
4J U 0)
<M <4H 0)
o •H 43 3 U
Id 43 0) «4H
59
g iH o >
C (M
o o C - H (d -P 0) DN rH C O
•H to >
•H cX» Q) O rH o in Id Q) P
>H Id t r
to c >H -H (d 0) 0) rH 4J O to 4-)
•H 4J <W ^ 43 o VJ tr
O -H rH to <D
o > 4-J (H •H O U
•H C r-i O O
to -H ^ to Id
Id 3 -P g SH Q) to c g Id -H
V4 o
43 U O
(d
Id t r rH M
0) tr tr •I-NCM Q) Id * c
. >-( CM -H cn 4J r
. C 4J Id in -H Id to
0) rH 43 Id
tr g
o 4J •H 43 VH O to
Id g to Id fH
cu
to 0)
4-> 3 C
• H
O VO cn
o CM
o CM
t^
o VO
in ON
o cn
CM
Id
c 0) g 4J Id
cn
^ 00 in cn
0)
c • H
CM
CM
43 U in n cn t ^
* . CM
43 0 cn ' t CM ON
CN
c n ON ^ VO
CO cn CM r*
O +J •H 43
f-i U to o
CO CO
u 0)
(M (4H • H
to
•H
u to u (U a 3 to
4J C 0)
v^
VO <4H 00 -H
. 73
Id
g
Q) 43 4J
MH O
o u u 0)
43 4-» • H
g 3
H
o 0
0) g Id to
c • H
T3 U (d
73 c Id +J CO 0
to
(d Q)
Id A
in o
V
4J O 0) (M <4H Q)
o •H 43
V 3 U
CU w no
in o
60
c
C <M 0
• H Id +J
3 DNrH
c • H >
o (U g 3
0 r^ to
• H <^ 0) U <D U
to ^ 0)
O in
Id
c • H
Q) rH 4J 0 to 4->
0 >
rH Id 3
0)
Id
V4 0
•H 4J <W 43 43 o (U to
U 0 to
O <M 4J O 3 U
(M
(d
0
tr •H (U IJ
0 • H
C tH 0 0
•H 43 to Id 3 4J
g <H to Id
tH
C • H
1
0) g
H Cu U 1
c Id (U
s •
•«;r •
in
(U r-\ Xi Id
H
Id rH 3
tr ;^
tr tr 3 •
•»-\CM Q) Id M 4J
• c CM ' H
rH c 4-> Id
• H Id to
•-3
tri g 0) to o
4-> U 3 ^ Cm
Id g to Id rH CU
to
3 c •H
o VO
cn
o CM
O CM H
O VO
O cn
CM
O
Id +J c 0) g
4J Id 0) u tH
0 CM
• ^ cn
in •
CM
u VO
• ^ '^
CM •
^ en
VO •
ON cn
in •
CO cn
en •
ON cn
Xi 0) c
•H rH Id CO
•0 r • CM CM
00 •
ON CM
T3 t^
• t^ CM
cn •
cn cn
^ •
r» cn
cn •
CM m
00 •
o cn
XI tH 0 4J • H 43 U 0 CO
• CO CO VO
• in
^
c Id 0) g 0 4: 4-»
(M 0
u 0 u u <u T3 u Id T3 c Id +J CO
Id
. .«~« in o
•
V
cu ^-'
+J 0 (U
<4H <4H 0)
0 •H 43 3 O
A
V4 0) (M dH •H TJ
to +> CU
•H ^ 0 to u 0) cu 3 to
4J c 0) ^ 0) ((H <M •H 13
43 4J •H ^
C g 3
rH 0 U
0) g Id to
c •H .
to ^ C in Id o Q) £
V T3
- CU 0 ^
61
400 T
30 60 120 Minutes
240 360
SALINE SORBITOL
GLUCOSE O SUCROSE PROPIONATE
Figure 5.1. Plasma glucose levels of steers receiving an intrajugular infusion of either glucose, sucrose, sorbitol or propionate in 50% solutions at 2.2 g kg~^ metabolic weight or equal volume of saline (SEM = 11.52).
62
130 T
NJ 120
g110 +
2 100 o Tr 90
e 80
S- 70
60 0 30 60 120
Minutes 240 360
SALINE SORBITOL
oSUCROSE -^ PROPIONATE
Figure 5.2. Plasma glucose levels of steers receiving an intrajugular infusion of either sucrose, sorbitol or propionate in 50% solutions at 2.2 g kg~^ metabolic weight or equal volume of saline (SEM = 11.52). Same data as Figure 5.1 except glucose infusion data are not shown.
63
20 T
"51,15 E
o CA
E CA C9
10 --
5 -
60 120 Minutes
•m- SALINE -& SORBITOL
Figure 5.3. Plasma sorbitol levels of steers receiving an intrajugular infusion of sorbitol in a 50% solution at 2.2 g kg~^ metabolic weight -or equal volume of saline (SEM = .867).
64
50 T
^
E ^ CA
o "^l*
^ 9 u
sma
08
£
45 --.,
40 --< •
35 -
30 --• •
25 -
20 30 60 120
Minutes 240 360
SALINE SORBITOL Figure 5.4. Plasma fructose levels of steers receiving
an intrajugular infusion of sorbitol in a 50% solution at 2.2 g kg~^ metabolic weight or equal volume of saline (SEM = 5.67).
65
CHAPTER VI
INTEGRATED SUMMARY
Sorbitol, a polyhydroxy alcohol generally regarded as
safe (GRAS) by the FDA, has been reported to increase feed
efficiency by veal calves, finishing bulls, and steers. The
mode of action which elicits this effect in ruminants has
not been clearly defined. Therefore, it was the intent of
this research to identify the mechanism of action of
sorbitol in ruminants.
Two feedlot performance studies were conducted to
examine if various levels of sorbitol affected the feedlot
performance of steers fed a steam-flaked grain sorghum-based
diet. The initial feedlot study examined the effect of
supplementing sorbitol over a prolonged feeding period (119
d; n = 112; 337.3 ± 17 kg). Sorbitol was fed at various
levels: basal (no sorbitol), 30 g steer"^ d"^; a variable
rate (20 g first 28 d, 30 g second 28 d; then 40 g steer"^
d~^ the remaining time on feed); and 30 g steer'^ d~^ only
over the 119 d feeding period. However, throughout the
feeding period, supplementing steers with 30 g of sorbitol
d"^ showed a 3.4% numerical increase in ADG and a 4.0%
numerical improvement in fed efficiency over steers
receiving no sorbitol. Steers receiving sorbitol only for
the final 50 d had lower dressing percent (P < .002) than
other steers. Furthermore, an overall treatment effect
tended (P = .16) to alter the carcass lean color. Steers
receiving 30 g of sorbitol d"l appeared to exhibit (P = .03)
a more youthful bright cherry red color of the carcass lean.
A subsequent 28 d feedlot receiving trial was conducted to
determine the response by newly received steers fed either
66
0, 30 or 60 g sorbitol steer"^ d~l in combination with
either a low ruminally degradable protein source or a more
readily ruminally available protein supplement. Performance
of incoming feedlot steers (262 ± 21.7 kg; n = 260) during a
28 day experiment was not improved by feeding a low
ruminally degradable protein or by sorbitol supplementation
at either 30 or 60 grams steer"^ day~l. However, there was
a tendency (P = .18) for an interaction between protein
source and level of sorbitol for gain efficiency.
Sorbitol has been documented to be glucogenic in
humans, rabbits, dogs and rats. Therefore, the possible
glucogenic property in steers was investigated. Sorbitol
intravenously infused in steers produced a 62% increase in
plasma glucose 120 minutes post infusion compared to saline
infused steers and a 22% numerical increase over steers
infused with propionate. Sorbitol was cleared and produced
a slight increase in plasma sorbitol concentration to a peak
of 2.94 mg dL~^ 30 min post infusion.
Reports that sorbitol improved feed efficiency and
daily gain of bulls when fed a low ruminally degradable
protein coupled with the magnitude of improvement shown in
steers fed a corn silage-based diet lead to the hypothesis
that sorbitol could be involved in protein metabolism.
Therefore, glycine and leucine uptake by cultured bovine
kidney cells was studied. Alterations in the sodium
independent uptake of these amino acids were exhibited by
the presence of sorbitol. Data indicate that the presence
of sorbitol at a concentration of 10~^2 molar increases
sodium independent cellular uptake of glycine and leucine by
cultured bovine kidney cells under these experimental
conditions.
In summary, sorbitol did not improve 119 d feedlot
performance of steers fed a steam-flaked grain sorghum-based
diet. However, steers receiving sorbitol only for the final
67
50 d had lower dressing percent (P < .002) than other
steers. Furthermore, steers receiving 30 g of sorbitol d"^
for 119 d appeared to exhibit (P = .03) a more youthful
bright cherry red color of the carcass lean when compared to
steers not fed sorbitol. The significant increase in steer
plasma glucose produced by intravenously infused sorbitol
points to a mode of action of sorbitol in energy
utilization. This may partially explain the improvements in
performance by ruminants when fed lower energy dense high
corn silage-based diets when compared to higher energy dense
diets based on steam-flaked grain sorghum. Sodium
independent uptake of glycine and leucine by cultured bovine
kidney cells was enhanced by sorbitol at a molar
concentration of 10~^2. therefore, sorbitol could possibly
increase skeletal muscle uptake of these two amino acids.
In conclusion, the mode of action of sorbitol includes
energy utilization and a possible role in amino acid
metabolism.
68
LITERATURE CITED
Adcock, L.H., and C. H. Gray/ 1956. Metabolism of sorbitol. Nature 177:329.
Alvarado, F. 1968. Amino acid transport in hamster small intestine; site of inhibition by galactose. Nature 219:276.
Anderson, R. A., J. M. Reddy, C. Oswald and L. J. D. Zaneveld. 1979. Enzymatic determination of fructose in seminal plasma. Clin. Chem. 25(10):1780.
Asada, M. , and J. T. Galambos. 1963. Sorbitol dehydrogenase and hepatocellular injury: An experimental and clinical study. Gastro. 44:578.
Bass, L., and K. Winkler. 1980. A method of determining intrinsic hepatic clearance from the first pass effect. Clin. Exp. Pharmacol. 7:339.
Bauchart, D. , B. Aurousseau, and E. Auclair. 1985. Addition of sorbitol to a milk-substitute for veal calves. I - Effect on health, growth and feed conversion. Reprod. Nutr. Dev. 25:399.
Bender, D. A. 1985. Amino Acid Metabolism. (2nd Ed.). John Wiley and Sons, New York.
Bergman, E. N. 1973. Glucose metabolism in ruminants as related to hypoglycemia and ketosis. Cornell Vet. 63:341.
Bergman, E. N. 1970. Disorders of carbohydrate and fat metabolism. In: Duke's Physiology of Domestic Animals, (Ed.) M. J. Swenson. Cornell Univ. Press, Ithaca, NY.
Bergmeyer, H. U., W. Gruber and I. Gutmann. 1974. D -Sorbitol: In Methods of Enzymatic Analysis. 2 New York.
Blakley, R. L. 1951. The metabolism and antiketogenic effects of sorbitol. Sorbitol dehydrogenase. Biochem. 49:17.
69
Blood, D. C., and J. A. Henderson. 1974. Diseases characterized by nervous system involvement. In: Veterinary Medicine (4th Ed.). D. C. Blood and J. A. Henderson (Eds.). Lea and Febiger, Philadelphia, PA., p. 924.
Boerner, P., and M. H. Saier, Jr. 1982. Growth regulation and amino acid transport in epithelial cells: Influence of culture conditions and transformation on A, ASC, and L transport activities. J. Cell. Physiol. 113:240.
Boyles, D. W., and C. R. Richardson. 1993. Effect of sorbitol on feedlot performance and carcass characteristics of steers fed a steam-flaked grain sorghum based diet. J. Amin. Sci. 71(Suppl. 1):294 (Abstr.).
Bye, P.A. 1969. The utilization and metabolism of intravenous sorbitol. Brit. J. Surg. 56:653.
Crossely, J. N., and I. Macdonald. 1970. The influence in male boboons, of a high sucrose diet on portal and arterial levels of glucose and fructose. Nutr. Metabol. 12:171.
Daniels, L. B., R. L. Peterson, E. L. Piper, and J. M. Rakes. 1981. Sorbitol in diet of young dairy calves. J. Dairy Sci. 64:449.
Eck, T. P., S. J. Bartle, R. L. Preston, R. T. Brandt, Jr., and C. R. Richardson. 1988. Protein source and level for incoming feedlot cattle. J. Anim. Sci. 66:1871.
Edson, N. L. 1936. Ketogenesis-Antiketogenis. IV. Substrate competition in liver. Biochem. J. 30:1862.
Embden, G. , and W. Griesbach. 1914. Z. Physiol. Chem. 91:251.
Exton, J. H. 1972. Gluconeogenesis. Metabolism. 21:945.
Fontenot, J. P., and H. M. Huchette. 1993. Feeding sorbitol alone or in combination with monensin to finishing cattle. J. Anim. Sci. 73:545.
Fostier, B. 1992. Reduction of DFD carcass percentage by supply of sorbitol before slaughtering. 38th ICoMST, Clermont-Ferrand France.
70
Gabbay, K. H. 1973. The sorbitol pathway and the complications of diabetes. N. Eng. J. Med. 288:831.
Geay, Y., E. Richet, S. Ba, and P. Thivend. 1992. Effect of feeding sorbitol associated with different sources and amounts of nitrogen, on growth, digestion and metabolism in young bulls. Anim. Feed Sci. Technol. 36:255.
Gianpaolo, M. 1991. The functioning liver mass. Res. Clin. Lab. 21:9.
Griem, W., and K. Lang. 1960. Klin. Wschr. 38:336
Hundal, H. S., M. J. Rennie, and P. W. Watt. 1989. Characteristics of acidic, basic and neutral amino acid transport in the perfused rat hindlimb. J. Physiol. (London), 408:93.
Johnston C., and H. J. Deul. 1943. Studies on ketosis XXI. The comparative metabolism of the hexitols. J. Biol. Chem. 149:117.
Kaufmann, E. 1929. Klin. Wschr. 8:66.
Krebs, H. A. 1964. Gluconeogenesis. Proc. Royal Soc. 159:545.
Kurz, M. M. and L. B. Willett. 1992. The clearance of carbon-14-fructose, carbon-14-glucose, and carbon-14-sorbitol by calves at birth and 7 days of age. J. Dairy Sci. 75:236.
Lehninger, A. L. 1982. Principles of Biochemistry. Worth Publishers, Inc., New York.
Lowery, C , J. Rosebrough, N. Farr, and R. Randall. 1957. Protein measurement with the Folin phenol reagent. J. Biol. Chem. 193:265.
Maynard, L. A., J. K. Loosli, H. F. Hintz, and R .G. Warner. 1979. The proteins and their metabolism. In: Animal Nutrition (7th ed.). McGraw-Hill., Inc. New York.
Merck Index. 1989. Sorbitol. In: The Merck Index (11th Ed.). Merck and Co., Inc., Pathway, NJ, p 1375.
Molino, G., A. Cavanna, P. Avagnina, M. Ballari, and M. Torchio. 1987. Hepatic clearance of D - sorbitol. Noninvasive test for evaluating functional liver plasma. Dig. Dis. Sci. 32:753.
71
Morgan, T. B., and J. Yudkin. 1957. The vitamin-sparing action of sorbitol. Nature 180:543.
NRC. 1984. Nutrient Requirements of Beef Cattle (6th Ed.). National Academy Press, Washington, DC.
Preston, R. L., and S. J. Bartle. 1989. Quantification of rumen escape protein and amino acid needs for new feedlot cattle. Texas Tech Univ. Agri. Sci. Rep. No. T-5-283. p 17.
Reiser, S., and J. Hallfrish. 1987. Metabolic Effects of Dietary Fructose. CRC Press, Inc., Boca Raton, FL.
Reiser, S., and P. A. Christiansen. 1971. The properties of the preferential uptake of L-leucine by isolated intestinal epithelial cells. Biochim. Biophys. Acta. 225:123.
Reiser, S., O. E. Michaelis, IV, and J. Hallfrish. 1975. Effects of sugars on leucine and lysine uptake by intestinal cells from rats fed sucrose and stock diets. Proc. Soc. Exp. Biol. Med. 150:110.
Reiser, S., and J. Hallfrish. 1977. Stimulation of neutral amino acid transport by fructose in epithelial cells isolated from rat intestine. J. Nutr. 107:767.
Reiser, S., and P. A. Christiansen. 1969. Intestinal transport of amino acids as affected by sugars. Am. J. Physiol. 216:915.
Rice, F. A. H. 1953. J. Amer. Chem. Soc. 75:2262.
Richardson, C. R. 1993. Personal communication. Dept. Anim. Sci. and Food Techn. Texas Tech Univ., Lubbock, Texas.
Romans, J. R., K. W. Jones, W. J. Costello, C. W. Carlson, and P. T. Ziegler. 1985. Cattle Slaughter. In: The Meat We Eat (12th Ed.). The Interstate Printers and Publishers, Inc. Danville, IL, p. 139.
SAS. 1990. SAS User's Guide: Statistics (Version 6). SAS Inst. Inc., Cary, NC.
Sato, H., T. Ishii, Y. Sugita, and S. Bannai. 1991. Induction of cationic amino acid transport activity in mouse peritoneal macrophages by lipoplysaccharide. Biochim. Biophys. Acta 1069:46.
72
Schriener, R. L., J. A. Lemons, and E. L. Gresham. 1981. Metabolic and hormonal responses to chronic maternal fasting in the ewe. Ann. Nutr. Metabol. 25:38.
Siimes, A. S. I., and R. K. Creasy. 1980. Maternal and fetal metabolic responses to ritodrine in the sheep. Acta. Obstet. Gynecol. Scand. 59:181.
Seeberg, V. P., E. B. McQuarrie, and C.C. Secor. 1955. Metabolism of intravenously-infused sorbitol. Proc. Soc. Exp. Bio. Med. 89:303.
Shaw, F. D. 1974. Sorbitol dehydrogenase in the diagnosis of liver disease of ruminants. Aust. Vet. J. 50:277.
Smith, C. R., and R. L. Hamlin. 1977. Regional Circulation. In: Duke's Physiology of Domestic Animals, (Ed.) M. J. Swenson. Cornell Univ. Press, Ithaca, NY.
Steel, R. G. D., and J. H. Torrie. 1980. Principles and Procedures of Statistics: A Biometrical Approach (2nd Ed.). McGraw-Hill Book Co., New York.
Stetten, M. R., and D. Stetten. 1951. J. Biol. Chem. 193:157.
Stribling, D. , F. M. Armstrong, and H. E. Harrison. 1989. Aldose reductase in the etiology of diabetic complications: 2. Nephropathy. J. Diabetic Compl. 2:70.
Taruvinga, M. , A. A. Jackson, and M. H. N. Golden. 1979. Comparison of ^^N-labeled glycine, aspartate, valine and leucine for measurement of whole body protein turnover. Clin. Sci. Molecular Med. 57:281.
Thivend, P. 1982. Influence du sorbitol dans 1'alimentation du veau de boucherie. Bull. Tech CRZV Theix, INRA, 50:47.
Thivend, P. M. Debarre, J. Lafaivre, and R. Toullec. 1984. Influence of sorbitol on biliary secretion in the preruminant calf. Can. J. Anim. Sci. 64(Suppl.):102.
Thomas, E. L., and H. N. Christensen. 1971. Nature of the cosubstrate action of Na"*" and neutral amino acids in a transport system. J. Biol. Chem. 246:1682.
73
Thomas, E. L., T. S. Shao, and H. N. Christensen. 1971. Structural selectivity in interaction of neutral amino acids and alkali metal ions with cationic amino acid transport system. J. Biol. Chem. 246:1677.
Todd, W. R., J. Myers, and E. S. West. 1939. On the metabolism of sorbitol and mannitol. J. Biol. Chem. 127:275.
Vadgama, J. V. 1989. Design of simple devices to measure solute fluxes and binding in monolayer cell cultures. Methods in Enzymology. 171:133.
Waldstein, S. S., and R. A. Arcilla. 1958. Measurement of hepatic blood flow by clearance methods. Am. J. Dig. Dis. 3:137.
Weiss, L. and G. Loffler. 1970. Interrelationship between adipose tissue and liver: gluconeogenesis and ketogenesis. Hormone and Metabolic Research. (Suppl. 2):196, NY: Academic Press.
Wiesner, I. S., H. M. Rawnsley, and F. P. Brooks. 1965. Sorbitol dehydrogenase in the diagnosis of liver disease. Am. J. Dig. Dis. 10:147.
Willett, L. B. 1993. Personal communication. Dep. Dairy Sci. Ohio State Univ. Ohio Agri. Res. Devel. Center, Wooster 44691.
Winkler, K., L. Bass, S. Keiding, and N. Tygstrup. 1979. The physiologic basis for clearance measurements in hepatology. Scand. J. Gastroenterol. 14:439.
Winkler, K, S. Keiding, and N. Tygstrup. 1973. Clearance as a quantitative measure of liver function. In: The Liver. Quantitative Aspects of Structure and Function. (Eds.) G. Paumgartner, R. Preisig. Basel, Karger, pp. 144-155.
Wheeler, K. P., and H. N. Christensen. 1967. Role of Na"*" in the transport of amino acids in rabbit red calls. J. Biol. Chem. 242:1450.
Yoshika, S., S. Saitoh, S. Seki, and K. Seki. 1984. Concentrations of non-glucose poloys in serum and cerebrospinal fluid from apparently healthy adults and children. Clin. Chem. 30:188.
74
APPENDIX A
CELL SUBCULTURE TECHNIQUE
1. Remove growth media from culture flasks with pipette.
2. Wash (rinse) twice with phosphate buffered saline (5 mL)
3. Add 2 mL Trypsin-EDTA solution to slightly cover bottom
of dish.
(a) Gently swirl the dish.
(b) Cells will become suspended by gently tapping on
side of dish. Be careful of the incubation time or
the Trypsin-EDTA will damage the cell membranes.
4. Add growth media (10 mL) when cells are off dish to stop
Trypsin-EDTA's action of dispersing cells.
(a) Draw and dispense solution several times.
5. Remove contents (cells and growth media) and place in 50
mL centrifuge tube.
(a) Draw and dispense several times to suspend cells.
6. Add additional growth media (5 mL) to solution in
centrifuge tube to aid in wash.
7) Centrifuge (180 x g) for ten minutes at 4 °C.
8) Pour off media.
9) Resuspend in new growth media.
(a) Remove aliquot (400 |il) to count cells.
10. For subculturing into flasks, add 15 mL growth media to
each flask to allow for 4 to 5 days growth of cells.
(a) To each flask add 2 mL of cell/growth media
solution.
(b) Gently swirl.
(c) Observe cells under microscope. Cells should
appear suspended and floating in solution.
11. Place culture dishes in a water-jacketed incubator at
37 °C in 95% O2 with a constant injection of 5% CO2.
75
12. For subculturing into 24 well Costar flasks plate out enough cell-growth media solution to give 250,000 cells mL~^ well-1.
76
APPENDIX B
CELL FREEZING TECHNIQUE
1. Remove growth media from culture flasks with pipette.
2. Wash (rinse) twice with phosphate buffered saline (5 mL).
3. Add 2 mL Trypsin-EDTA solution to slightly cover bottom
of dish.
(a) Gently swirl the dish.
(b) Cells will become suspended by gently tapping on
side of dish. Be careful of the incubation time or
the Trypsin-EDTA will damage the cell membranes.
4. Add growth media (10 mL) when cells are off dish to stop
Trypsin-EDTA's action of dispersing cells.
(a) Draw and dispense solution two or three times.
5. Remove contents (cells and growth media) and place in 50
mL centrifuge tube.
(a) Draw and dispense several times to suspend cells.
6. Add additional growth media (5 mL) to solution in
centrifuge tube to aid in wash.
7. Centrifuge (180 x g) for ten minutes at 4 °C.
8. Pour off media.
9. Mix new growth media plus 5% DMSO (dimethyl sulfoxide) to
equal 20 mL of solution: 19 mL growth media + 1 mL DMSO = 2 0
mL freezing media. Example: For 1:5 split, use only about
16 mL of freezing media to suspend cells. Use 3 culture
flasks.
10. Add 1 mL per chilled cryo-vial.
11. Place cryo-vials in freezing tank (cryo freezing tank
contains isopropyl alcohol at minus 70 °C, this lowers the
temperature 1 °C per minute.
(a) Freezing tank must be at room temperature.
(b) Place tank with vials in minus 70 °C freezing
container for more than 4 h.
(c) Store vials in liquid nitrogen.
77
APPENDIX C
EXPERIMENTAL PROCEDURE FOR TREATMENT
OF CELLS IN COSTAR CLUSTER WELLS
The incubation procedure is a modification of methodology
described by Vadgama (1989). Cells will be cultured in 24-
well Costar culture clusters. Once cells become confluent
the treatments will be administered. Krebs-Ringer Phosphate
buffer (KRP-buffer), pH 7.40 will be used as uptake medium.
The composition of this buffer will be as follows: KCl 6.0
mM, MgS04-7H20 1.2 mM, KHCO3 2.0 mM, CaCl2 0.5 mM, NaCl 118
mM, D-Glucose 5.5 mM, Na2HP04 25 mM. Analysis of sodium
independent uptake is facilitated by replacing sodium
chlorine and sodium hydrogen phosphate in the KRP-buffer
with choline chloride and choline hydrogen phosphate in
equal molarity.
Cells have been incubated in 24 well Costar cluster
flasks as described in Appendix A. Cells are washed with 1
mL choline Krebs ringer phosphate buffer (choline-KRP).
Before removing dishes from incubator two wash trays should
be filled with 2 mL of choline-KRP in each tube. Use one
tray to apply incubation solution (choline-KRP).
The above described steps will be conducted according
to the following steps:
(a) Pour off media in dishes.
(b) Wash one time with choline-KRP (1 mL).
(c) Incubate one hour at 37 °C with 1 mL choline-KRP.
This removes any free amino acids from cell by diffusion
(concentration gradient).
(d) Incubate with 250 ^L test solution for two minutes
while gently swirling the dishes.
(e) Wash twice with ice cold phosphate buffered saline
(one mL).
78
(f) Allow incubation wells to dry (15-30 minutes).
(g) Extract cells by applying 220 |iL 5 % (w/v)
trichloroacetic acid (TCA) for one hour.
(h) Pipette 200 jiL into scintillation tubes,
(i) Add 5 mL scintillation cocktail to each tube and
vortex.
(j) Count activity using scintillation counter.
In short:
1. Wash cells with one mL choline-KRP.
2. Incubate one hour at 37 °C with one mL choline-KRP.
3. Incubate with 250 |iL test solution for two minutes.
4. Wash twice with ice cold phosphate buffered saline (one
mL) .
5. Extract 22 0 |iL 5% (w/v) TCA for one hour.
6. Pipette 200 \xL and count.
79
APPENDIX D
PROCEDURE FOR PROTEIN DETERMINATION
The procedure used is a modification of the Lowery
method (1957) as described by Vadgama (1989). The 24-well
costar flasks were stored at 4 °C until protein
determination. The following methodology is based upon the
amount of protein contained in each well when the cells were
seeded at 250,000 cells per well and reached confluency in
two d.
1. To each well add 200 nL of 1 N sodium hydroxide.
The protein is completely dissolved in approximately 3 0
minutes. After 30 minutes, draw out 100 |iL of solution and
replace with 100 iiL of the 1 N sodium hydroxide thereby
making a 1:1 dilution.
2. Add one mL of Lowery Reagent to each well and
gently swirl the tray and allow to stand for 20 minutes.