POSIVA-96-23 Sorption of cesium, radium, protactinium, uranium, neptunium and plutonium POSIVA OY on rapakivi granite Tuula Huitti, Martti Hakanen Laboratory of Radiochemistry Department of Chemistry University of Helsinki Antero Lindberg Geological Survey of Finland December 1996 Annankatu 42 D. FIN-001 00 HELSINKI. FINLAND Phone (09) 2280 30 (nat.), (+358-9-) 2280 30 (int.)
Transcript
POSIVA-96-23
Sorption of cesium, radium, protactinium, uranium, neptunium and plutonium
POSIVA OY
on rapakivi granite
Tuula Huitti, Martti Hakanen Laboratory of Radiochemistry
Tuula Huitti, Martti Hakanen, University of Helsinki Antero Lindberg, Geological Survey of Finland
Nimeke- Title
Toimeksiantaja(t)- Commissioned by
Posiva Oy
Raportin tunnus - Report code
POSIV A-96-23
Julkaisuaika- Date
December 1996
SORPTION OF CESIUM, RADIUM, PROTACTINIUM, URANIUM, NEPTUNIUM AND PLUTONIUM ON RAPAKIVI GRANITE
Tiivistelma - Abstract
Study was made of the sorption properties of rapakivi granite at Hasholmen in Loviisa for nuclides of spent fuel. Rct values of cesium, radium, protactinium, uranium, neptunium and plutonium were determined and diffusion of water in the rapakivi was investigated.
The rock samples were taken by core drilling from the wall of the repository for operating waste and represented three different alteration stages: fresh, weathered and altered. The rock was crushed to grain size < 2 mm. Water used in the experiments was a brackish ground water from Hastholmen.
The rock material was characterized by determination of cation exchange capacities, specific areas (N2/BET) and volumetric porosities. The amounts of amorphous and crystalline iron oxides were also determined.
The sorption was studied by batch method and followed as a function of time and initial element concentration. Experiments were done under both aerobic and anaerobic conditions. The Rct values of rapakivi were compared with values of the rock/water systems at the three other investigation sites for spent fuel disposal (Kivetty in Aanekoski, Olkiluoto in Eurajoki and Romuvaara in Kuhmo). No major differences were found between the sorption on rapakivi and on the other rocks in brackish or in saline water.
The effective diffusion of tritiated water increased with the porosity of the rock. The measured and calculated porosity values were almost the same for the different rock types.
ISBN ISSN ISBN 951-652-022-7 ISSN 1239-3096
Sivumaara- Number of pages Kieli - Language 57 + Appendices English
Tuula Huitti, Martti Hakanen, Helsingin yliopisto Antero Lindberg, Geologian tutkimuskeskus
Nimeke- Title
Toimeksiantaja(t)- Commissioned by
Posiva Oy
Raportin tunnus- Report code
POSIV A-96-23
Julkaisuaika- Date
Joulukuu 1996
CESIUMIN, RADIUMIN, PROTAKTINIUMIN, URAANIN, NEPTUNIUMIN JA PLUTONIUMIN SORPTIO RAPAKIVIGRANIITTIIN
Tiivistelma - Abstract
Hastholmenilla Loviisassa esiintyvan rapakivigraniitin sorptio-ominaisuuksia tutkittiin kaytetyn polttoaineen nuklideille. Cesiumin, radiumin, protaktiniumin, uraanin, neptuniumin ja plutoniumin RI-arvot maaritettiin ja veden diffuusiota rapakivigraniitissa tutkittiin.
Kivinaytteet olivat kairansydamia VLJ-loppusijoitustilan seinasta. Naytteet olivat kolmea eri muuntumisastetta: muuttumatonta, rapautunutta ja muuttunutta rapakivea. Kivi oli jauhettu raekokoon < 2 mm. Naissa kokeissa kaytetty vesi oli Hastholmenin murtovetta.
Kivimateriaalin ominaisuuksia selvitettiin maarittamalla kationinvaihtokapasiteetti, spesifinen pintaala (N2/BET) ja tilavuushuokoisuus. Amorfiset ja kiteiset rautaoksidit maaritettiin myos.
Sorptiota tutkittiin batch-menetelmalla seka hapellisissa etta hapettomissa olosuhteissa. Sorptiota seurattiin ajan ja kyseessa olevan aineen konsentraation funktiona. Rapakiven Rct -arvoja verrattiin kolmelta paikkatutkimusalueelta (Aanekosken Kivetty, Eurajoen Olkiluoto ja Kuhmon Romuvaara) saatuihin tuloksiin. Rapakiven ja muiden kivien sorptio-ominaisuuksille murtovedessa ja suolaisessa vedessa ei loydetty suuria eroja.
Tritioidun veden efektiivinen diffuusio kasvoi, kun kiven huokoisuus kasvoi. Huokoisuuden mitatut ja laskennallisesti saadut arvot eivat eronneet paljoa eri kivien valilla.
ISBN ISSN ISBN 951-652-022-7 ISSN 1239-3096
Sivumaara- Number of pages Kieli - Language 57 + liitteet Englanti
PREFACE
This study is a part of the investigation programme of Posiva Oy and was carried out in the
Laboratory of Radiochemistry, Department of Chemistry, University of Helsinki. The contact
persons at Posiva were Lauri PolHinen and Margit Snellman. The responsible researchers and
writers of the report were Tuula Huitti and Martti Hakanen from the Laboratory of
Radiochemistry. The rock samples were chosen and analysed for mineralogy by Antero
2.2. Crushed rock 5 2.3. Rock slices 5 2.4. Water 5 2.5. Radionuclides 7
3. METHODS 8 3.1. Characterization of sorption materials 8
3.1.1. Determination of cation exchange capacity (CEC) 8 3.1.2. Porosity determination 8 3.1.3. Determination of amorphous and crystalline iron in rocks 9 3.1.4. Detection of nuclides 9
3.2. Sorption 10 3.2.1. Sorption experiments with crushed rock 10
3.2.2. Calculation of Rd values 12 3.3. Diffusion 13
3.3.1. Diffusion cell 13 3.3.1. Diffusion in homogeneous matrix 14
4. RESULTS AND DISCUSSION 16 4.1. Cation exchange capacity, CEC values 16 4.2. Porosity of rock 17 4.3. Atnorphous and crystalline minerals 17 4.4. Rd values for the rock 18
5. SUMMARY OF THE RESULTS OF SORPTION AND DIFFUSION EXPERIMENTS 50
6. COMPARISON WITH RESULTS FOR OTHER INVESTIGATION SITES ROCKS 51 6.1. Cation exchange capacity 51 6.2. Redox-condition of the host rocks 51 6.3. Groundwaters 52 6.4. Sorption of cesium, strontium and radium 52 6.5. Sorption of redox sensitive elements 53 6.6. Effective diffusion of water 54 6.7. Conclusion 54
7. REFERENCES 57
APPENDIX I APPENDIX II
1
1. INTRODUCTION
This study is a part of the research programme on nuclear waste management being carried
out by Posiva Oy, the company which takes care of all Finnish spent nuclear fuel. With the
aim of constructing a repository deep in the Finnish bedrock, Posiva is carrying out
investigations at Kivetty, at Romuvaara, at Olkiluoto, near the TVO (Teollisuuden Voima
Oy) nuclear power plant, and since January 1997 also at Hastholmen in Loviisa.
The aitn of this study was to detennine the sorption of cesium, radiutn, protactinium,
uraniutn, neptuniutn and plutoniutn on rapakivi granite in the brackish groundwater of
Hastholmen. The studies were carried out under aerobic ( Cs, Ra, Pa, U, Np, Pu) and
anaerobic (Np, Pa, Pu and Tc) laboratory conditions. The cation exchange capacity was
determined for the rock and the diffusion properties were investigated by measuring the
effective diffusion of tritiated water in rocks of different degree of alteration. The sorption
and diffusion properties of the rocks are briefly compared with those of host rocks at other
sites under investigation by Posiva for the final disposal of spent fuel.
2
2. MATERIALS
2.1. Rock samples
Rapakivi granite from near the Hastholmen power plant was chosen for the sorption
experiments. Core sample YTS was taken from an almost horizontal drillhole 110 metres
below the groWld surface, frotn the repository Wlder construction for low- and intermediate
level reactor waste. Core length was 168 m and diameter 42 mm.
The dominant type of rapakivi at Hastholmen is pyterlite, which contains very coarse (100 -
120 tntn) phenocrysts of potassiutn feldspar in medium-grained (S - 10 mm) groWld mass.
The phenocrysts are typically angular and without a plagioclase mantle, but there are always
a few stnall phenocrysts with mantle. Ovoids, roWld phenocrysts with distinct plagioclase
mantle, are typical of the other rapakivi type, wiborgite. Even-grained varieties of rapakivi
commonly cut the older porphyritic and coarse-grained varieties. The drill core YTS contains
only narrow even-grained dikes.
Drill core YTS includes some fractures and densely fissured zones, where the rock is also
chemically altered and partly weathered. The most distinguishing feature of the altered rock
is the brownish colour of iron hydroxide (goethite) or iron oxide (hematite). Small (hair-like)
fissures, which are tight and partly coated with chlorite and epidote, characterize the altered
rock. In more highly weathered places, plagioclase has altered to clay (kaolinite) and the
pores of the rock are visible tnacroscopically. Three different samples were chosen for the
sorption experiments: fresh pyterlite (79.30 - 79.9S m), altered but still Wlbroken pyterlite
(164.90 - 16S.60 tn) and a weathered and fractured rock (100.00 - 100.80 m).
2.1.1. Sample YTS/79.3S
Sample YTS/79 .3S is a porphyritic rapakivi with slightly roWlded potassium feldspar
phenocrysts 1 to 8 ctn in diatneter. The groWldtnass consists of plagioclase, quartz, biotite,
potassiutn feldspar and hornblende of grain size 0.2 - S mm. In addition, in the study of a
3
thin section muscovite, chlorite, epidote, fluorite, apatite and opaques were observed as
accessory minerals. The mineral cotnposition is shown in Table 1.
The texture of this sample is undisturbed, with subhedral minerals, which means that the
fracturing of the bedrock (seen in other samples) was limited to certain zones. Quartz does
not show any undulatory extinction, for example. Some "normal" alteration, such as
sericitization of plagioclase and biotite formation on the borders of hornblende grains, was
observed.
2.1.2. Sample YT5/100.55
Satnple YT5/100.55 was taken as near a fracture zone as possible to get a 10 cm piece of
rock. The fracture zone is an old breccia with tnany both open and cemented fissures,
typically brown (hematite) and greenish (clay). Thin section study revealed crushed quartz
and bent biotite (chlorite) flakes. Potassium feldspar contains hematite as irregular spots.
Thin section study showed the main tninerals to be potassium feldspar (one large phenocryst),
plagioclase and quartz. Biotite is largely altered to chlorite, which is the most common
secondary mineral, but in Table 1 also clay minerals (kaolinite, for example), which cannot
be distinguished optically, are calculated as chlorite. Likewise the opaque minerals of this
sample are secondary, as segregation frotn altering mafic minerals. Accessory minerals
include fluorite, apatite, pritnary tnuscovite and possibly epidote.
2.1.3. Satnple YT5/165
Satnple YT5/165 is frotn a heavily fissured zone of the drill core, where hydrothermal
alteration has changed the colour of the rock to reddish brown and the porosity is easily
observed. Thin section study, indeed, showed that the feldspars are less altered than the
second sample (YT5/100.55). Plagioclase is slightly sericitized but not clayish; potassium
feldspar is fresh. Biotite is only slightly chloritized, but hornblende has entirely altered to
chlorite also in this satnple. Possibly the atnount of chlorite given in Table 1 includes some
4
clay mineral (kaolinite). Quartz is clear, and fractured but not recrystallized. A very dense
fissuring can be seen in the thin section and fissures are filled by hematite/goethite and clay.
The mineral composition of the thin section is dominated by a potassium feldspar grain (20
tnm in diameter). Other tninerals are plagioclase and quartz. Biotite is an accessory, as are
muscovite, epidote, opaques, carbonate, fluorite and apatite.
Table 1. Mineral compositions of thin sections from drill core YTS (vol.-%), calculated by point counting method (500 points/thin section). Hastholmen, Loviisa.
Remarks: 1) One large potassium feldspar grain (phenocryst) in the thin section. 2) "Chlorite" includes unidentified clay mineral(s). 3) Calcite or dolomite, only stnalltnassive grains between the main minerals. 4) Part of the opaques have been formed through hornblende alteration.
5
2.2. Crushed rock
The rock for the sorption experiments was crushed to grain size < 2 mm. The specific areas
of the crushed rock were measured for two-gram samples, using a Quantasorb or a Flowsorb
2300 II gas adsorption device, both based on BET -method. Measurements were repeated
three times and the specific area was the average of these values. The samples were
pretreated in nitrogen flow for one hour at 11 0°C.
Table 2. Specific area (m2 I g) of crushed rock.
Rock Specific area (mz/g) Specific area **) *)
YTS-1, fresh 0.30 0.31 av. 0.31 0.91
YTS-2, weathered 2.14 4.88 av. 3.51 2.00
YTS-3, altered 0.91 1.08 av. 1.00 1.36
*) specific area determination made before spiking (Helsinki University of Technology, Laboratory of Mineral and Particle Technology) **) specific area determination made after three weeks equilibration with groundwater (Tampere University of Technology, Engineering Geology)
2.3. Rock slices
Rock slices, 15 tnm thick, were cut from the drill cores with a low speed diamond blade saw.
The slices were washed in an ultrasound bath and dried in vacuum. The same slices were
used in the porosity detennination and the diffusion experiments.
2.4. Water
The groundwater from Hastholmen was taken from groundwater station LPV A2 from the
wall of the repository tmmel m1der construction for operating waste. The station is located
between piles 800 and 900 in the upper fracture zone. The groundwater station consists of a
15.7-tnetres-long borehole drilled from the tm1nel into the bedrock. The entrance of the hole
is sheltered with a tube, a tnanotneter and a valve. The drilled borehole is also fitted with
6
ntbber swelling plugs, which isolate the borehole section between 8 and 15.7 m and allow a
representative water sample to be taken. The water flow from the tube by its own pressure is
about 7.5 1/min. The water was taken in two lots (1995 and 1996) and analysed each time
(Table 3). Field measuretnents were begun about one week before water sampling. At
satnpling, the values of pH, conductivity, E.t and dissolved oxygen were 7.6 - 7.7, 1300
tnS/m, -50 m V and 0.005 mg/1, respectively. The water was filtered through a series of
filters, 0.8 j.lm, 0.45 ~-tm and 0.22 ~-tm, before analysis. Because of the large amount of iron
(almost 6 mg/1) the water was unstable under aerobic conditions; before use, therefore, it was
equilibrated with atnbient atmosphere for one week and filtered through 0.22 ~ Millipore
filter. The laboratory analyses done before and after the equilibration indicated no difference
in concentration of the tnajor cations (Appendix I). The iron concentration of the normal
atmospheric equilibrated water decreased to 0.08 tng/1 in 1995 and 0.82 mg/1 in 1996
(Table 3).
Table 3. Main components of the groundwater from station LPVA2 used under aerobic conditions (analysed after 1 week equilibration and filtration at 0.45 ~-tm; analysis in detail in Appendix I).
Parameter LPVA2 1995 LPVA2 1996
Na, mg/1 2080 1990
Mn, tng/1 3.1 2.4
Mg, tng/1 239 230
K, tng/1 29 26.8
Ca, mg/1 785 760
Ba, mg/1 <0.5 <0.8
Cl, tng/1 5060 4800
S04, mg/1 510 491
U-234/U-238 2.12 2.11
dissolv. C02 mg/1* 51 58.1
Fetot' tng/1 0.08 0.82
Br, mg/1 17 17
pH 7.5 7.74
TDS, tng/1 8700 8300
* Analysed dissolved inorganic carbon calculated as total C02•
7
With the help of an inert atmosphere glove bag, the water for the anaerobic experiments was
taken directly from the water line tube into the sample vials, in the field. For the desorption
experiments the water was taken into a dark glass bottle and preserved in nitrogen
atmosphere. The amount of iron, Fe(II), in the water used in anaerobic experiments was
5.0 mg/1.
2.5. Radionuclides.
The spiking solutions for batch experitnents were either prepared in groundwater and added
straight to the sample (Cs, Ra) or, if they were acid solutions (all other elements), they were
evaporated to dryness on teflon strips and the strips were added to the samples.
In diffusion experiments, tritium was added to groundwater in the reservoirs.
Table 4. Characteristics of spiking nuclides.
Nuclide Half-life Cone. mol/1
Cs-134 2.1 a 1o-8
Ra-226 1600 a <10-7, Ba cone.
Pa-233 27 d 1o-13
U-233 1.6 x 10⁵ a 1o-s
Np-235 1.1a 1o-13
Pu-236 2.8 a Io-13
Tc-99 2.1 x 10⁵ a 10-8
H-3 12.3 a 1o-u
To increase the elemental concentrations of protactinium, uranium, neptunium and plutonium,
the isotopes Pa-231, U-238, Np-237, Pu-242 were used in addition to the tracer nuclides. For
cesium and radium CsCl, and BaC12 were used.
8
3. METHODS
3 .1. Characterization of sorption materials.
3.1.1 Determination of cation exchange capacity (CEC).
The cation exchange capacity was determined by replacing the exchangeable cations of the
rock sample with silver-thiourea complex. One gramme of crushed rock and 25 ml of AgTU
solution were placed in a 50-ml polypropylene centrifuge tube (Sorvall). Samples were
shaken continuously for 18 hours and then centrifuged (6500 G, 30 min). Ag+ and the
exchangeable cations, Ca2+, Mg2+, K+ and Na+, in solution were measured by atomic
absorption spectrophotometry (AAS).
The CEC values were derived from the equation:
where Ci = concentration of the exchangeable cation i (g/ml)
vi = volutne of the water (ml)
zi = charge of the ion
tni = mass of the crushed rock (g)
Mi = molecular weight of the cation i (g/mol)
3.1.2. Porosity determinations
(1)
Porosities were determined for the rock slices used in the diffusion experiments. After drying
under vacuum at 80°C for five weeks, the slices were impregnated with water for 17 days.
When rocks were weighed after 10 and 17 days, the hg values differed for the fresh rock by
~3.0% and for the weathered and altered rock by ~1.4%. Slices were dried with a paper and
then by blowing; weighing was done one minute after the slice was removed from the water.
9
The volumetric porosity was calculated with the equation:
(2)
where fl. g = difference between dry and wet (0 and 17 days) weight (g)
V= volume of the rock slice (cm3)
3.1.3. Detennination of atnorphous and crystalline iron in the rocks.
Atnorphous and crystalline iron were separated from the crushed rock by the reagents of
Tamm and Mehra & J ackson /1/ and the solutions were analysed for Fe by atomic absorption
spectrophotometry, AAS.
3.1.4. Detection of nuclides.
Cs-134 was measured by gatntna spectrotnetry with a Wallac Ultrogamma 1280 (Nal(Tl)
detector. Ra, Pa, U, Np and Pu were tneasured with a liquid scintillation counter (LSC
Wallac Rackbeta, LSC Wallac Quantulus). Before Ra-226 was measured the interfering
daughter nuclides were removed. The sample solutions were evaporated gently to dryness and
then dissolved in 0.02 M HCl solution for immediate LSC measurement.
When there was no detectable activity in water, an LLD (lower limit of detection) /2/ was
derived as the Rct value, and only a lower limit for Rd is given.
10
3.2. Sorption
3.2.1. Sorption experiments with crushed rock.
3.2.1.1. Spiking of satnple solutions.
Near neutral or slightly alkaline non-complexing solutions of Pa, U, Np and Pu might be
unstable. Use, instead, of acidic spiking solutions would necessitate neutralizing the pH of the
sample solutions with NaOH, which could cause harmful local precipitations of the elements.
To avoid pH adjustment, the acidic spiking solution was pipetted onto a teflon strip and
evaporated to dryness, and the spiked strips were added to the sample solution. The spike
was dried on a specific place tnarked onto the teflon strip. The marked place was measured
separately from the two ends of the strips in determining the dissolution of the spike. At the
end of the sorption experiment the strip was retnoved frotn solution and leached with 1 M
HCl which was then analysed for the tracer.
3.2.1.2. Aerobic conditions
The sorption of the tracer nuclides on cntshed rock was studied by a batch method.
Experiments in aerobic conditions were made at room temperature and ambient atmosphere.
For solid/water ratio of 1/10 the satnples were prepared by weighing 3.5 g of crushed rock
into a 50-ml polypropylene centrifuge tube and adding 35 ml of groundwater. After
equilibration with the rocks the Na, Ca, K and Mg concentrations in solution were
determined by AAS. A steady state was reached in 7- 10 days. TI1e pH of the equilibrated
water was 7.01 - 7.35, which was slightly lower than the pH in the field (7.6 - 7.7).
Four parallel samples were used in most experiments. TI1e samples were mixed continuously
for fifteen minutes each hour, for two or three weeks, to achieve equilibrium between the
crushed rock and groundwater. During equilibration the water was refreshed three or four
times. TI1e water was analysed for pH and the main cations to determine when equilibrium
was reached. Stable isotopes (Cs) or long-lived isotopes (Pa-231, Pu-242) of the measured
tracers were used to adjust the initial element concentration. Different Ra concentrations were
11
sitnulated by using Ba as a non-isotopic carrier. Cesium and radium spiking solutions were
added directly to sample solutions, while the other spikes were evaporated to dryness on
teflon strips and the strips were immersed in the sample solution. Changes in sorption were
determined as a function of time in one of four parallel samples. As soon as the sorption
steady state was reached, all samples were removed for the sorption measurements. The
teflon strips were analysed as described above (sect. 3.2.2.1.). Solid and solution were
separated by centrifuging the mixture with a high speed centrifuge (Sorvall, 6500G, 30 min).
For desorption studies, as much water as possible was removed, the centrifuge tube was
weighed to detennine the amount of water left in the sample, and 35 ml of groundwater was
added to the satnple. The satnples were put back to be shaken and the fourth sample was
used to follow the progress of the desorption.
3.2.1.3. Anaerobic conditions.
For the experiments under anaerobic conditions, 2.0 g of crushed rock was weighed into a
20-ml LSC glass vial. The vials were transferred through a vacuum chamber into an inert
attnosphere glove box, where oxygen concentration was <2ppm, and stored there overnight in
nitrogen attnosphere. The following day the sample vials were transported to the groundwater
station, LPV A2, and filled with water rmming from the groundwater sampling line under
nitrogen atmosphere. On the third day a teflon strip with the spike was added to the sample
vial in the laboratory glove box. When the sorption was presumed (on the basis of previous
experitnents) to be in equilibritun the water was sampled and pH and~ were measured. The
water subsample was filtered through a 0.22 ~m Millipore filter before radioactive assay. The
teflon strips were analysed as described above (sect.3.2.1.1). The filters were leached with
acid (1 M HCl, or in the case of Pa 4 M HC1+0.5 M HF).
In the desorption study pure groundwater was added to the sample and after equilibration the
activity in water was tneasured.
12
3.2.2. Calculation of Rd values.
The sorption percentages, S(%), were calculated from the measurements with equation:
where A.racer
Atrac~r A sample
vroral V S(%)- stJmple * 100%
Atraur --V total
= activity concentration in the spiking solution (Bq/1)
= total volume of the spiking solution (1)
= activity in the measured subsample (Bq/1)
= volume of the measured subsample (1)
When the teflon strip was used, the sorption percentage was calculated from the
tneasurements with equation:
Atracer -A~flon _ Asample
S(%) V V
total sample * 1 OO% Atracer -A~flon
vtotal
(3)
(4)
where A. en on = activity of spiking solution left on the teflon strip (Bq)
The sorption ratio, Rd, was calculated with equation:
R _ S(%) *V d 100-S(%) m
(5)
13
where S(%) = sorption percentage
V = volume of water in the sample (m3)
m = mass of the solid in the sample (kg)
The removal of the spiking solution is not complete; some spiking solution is left with the
solid phase and needs to be taken into account, especially in the case of low sorption. Thus
the S(%) in the desorption experiment, Scte(%), is calculated from the activities in subsamples
and sorption percentages, S, with equation:
where
V*A A A *S + r tracer *(1-S) ~punpk *V
tracer V V de.total
~racer
s
Ade,sample
vde,sample
vde,total
vs,total
s,total ~,.wmpiiJ * 1 OO% (6) V*A
A *S + r tracer *(l-S) tracer V
s,totJJI
= activity in the spiking solution
= sorption percentage/1 00 (from equation 4)
= volume of spiking solution left with the solid phase
= activity in the measured desorption subsample
= volume of the measured desorption subsample
= total volume of the desorption sample
= total volume of the sorption sample
The Rd value of desorption, Rd.de' can be calculated by the equation for Rd (equation 5).
The error of S% is described as an absolute error.
3.3. Diffusion.
3.3.1. Diffusion cell
The diffusion cell, which is made of acrylic, consists of two reservoirs, one for the HTO
spiked solution and one for collecting the tracer diffusing through. Separating the solution
14
reservoirs is the rock slice (the same slice used in the porosity determination), fixed in the
middle with silicone rubber. The volume of each reservoir was 15 - 19 ml. The rock was
equilibrated with groundwater during two weeks. A small amount of sodium azide was added
to prevent bacterial growth during the experiment.
The samples were taken after one, three and seven days and then once a week. First the
spiking solution and then the collecting solution was removed from the reservoir. Pure
groundwater was added to the collecting reservoir and finally the spiking solution was
transferred back to the spiking solution reservoir. The activity measurements were made from
an aliquot of the sample.
3.3.2. Diffusion in hotnogeneous matrix.
When diffusion takes place in the plane of a homogenous matrix /3/, the concentration C
depends on the distance, x, and time, t, and the diffusion equation, has the form
dC=D d2C
dt a axz (7)
where Dais the apparent diffusion factor. In the stationary state the equation has the form
(8)
If the diffusion factor Da is a constant in a planar sample with length 1 and the surface x=O
has concentration C1 and the surface x=l concentration C2, we obtain, by integrating,
(9)
15
where C is the concentration in the planar sample at a distance x. Concentration C changes
linearly from C1 to C2•
The quantity Qt (Bq/m2) is defined as the cumulative diffused activity A (Bq) divided by the
area of the plane A (m2). For the initial condition C = C2 = 0, when t = 0, Qt approaches the
stationary state according to the following equation:
(10)
where De is the effective diffusion coefficient and a, the capacity factor, is defined as
(11)
where E is the porosity and Q the density of the rock, and Rct is the mass distribution factor.
When t approaches infinity, the last term of the equation (10) vanishes and it follows that
Q,Z -=D (t-L) C e
1
(12)
where Lis the time lag /4/ and defined as the intersection of the asymptote on the taxis. The
apparent diffusion coefficient Da is related to the time lag as follows:
(13)
16
4. RESULTS AND DISCUSSION
4.1. Cation exchange capacity, CEC values
The cation exchange capacities /5/ of crushed rock samples, 0 < 0.2 mm, are given in Table
5. The numbers presented include both the total CEC values derived from changes in the Ag+
concentration and the CEC values calculated as a sum of the concentrations of the
exchangeable cations Ca+2, Mg+2
, K+ and Na+.
Table 5. Cation exchange capacities, CEC values (meq/100g), of the crushed rock samples measured by AgTU method. Values for three parallel samples and the average are given.
Rock Ag+ Ca2+ Mi+ K+ Na+ Total Ca+Mg+K+Na
YTS-1, fresh rock 1.3 0.50 0.089 0.33 0.33 1.2
0.74 0.50 0.089 0.31 0.33 1.2
1.0 0.51 0.089 0.31 0.37 1.3
av. 1.0 av. 1.2
YTS-2, weathered 3.9 3.0 0.91 0.36 0.76 5.0
rock 3.6 2.8 0.93 0.36 0.77 4.9
3.6 3.0 0.99 0.36 0.81 5.2
av. 3.7 av. 5.0
YTS-3, altered 1.5 2.1 0.79 0.33 0.41 3.6
rock 1.8 2.0 0.81 0.31 0.33 3.5
1.8 2.1 0.79 0.29 0.33 3.5
av. 1.7 av. 3.5
The atnount of exchangeable Ca2+ was relatively high in the weathered and altered rock: six
and four titnes that in the fresh rock. The amount of exchangeable N a was the same in fresh
and altered rock, and twice as large in weathered rapakivi granite. As the sum of cations
Ca+Mg+K+Na, the CEC values were in order fresh:altered:weathered 1:3:4; so the cation
capacity of the weathered rock was four times that of the fresh rock. For altered rock the
AgTU tnethod gave a lower CEC.
CEC values of the fresh and weathered rock corresponded with the specific area values. In
17
the altered rock the specific area value increased faster than the CEC values. The amount of
exchangeable N a in the AgTU solution equilibrated with the weathered rock was much
smaller than the value of exchangeable Na derived from porosity and groundwater Na
concentration. It seems that the pore water has been flushed either during drilling or at some
later stage in rock handling. For the other rocks, the influence of pore water is relatively
much smaller due to the smaller porosity.
4.2. Porosity of rock
Porosity of the rock was determined by the water impregnation method described in sect.
3.1.2. The results are given in Table 6.
Table 6. Porosity values of Rapakivi granite.
Rock Sample E (V%)
1 0.29
YT5-1, fresh 2 0.29
3 0.33 av. 0.30
4 3.9
YT5-2, weathered 5 3.1
6 3.5 av. 3.5
7 0.71
YTS-3, altered 8 0.75
9 0.61 av. 0.69
The variation in the porosity values for parallel samples is due to the inhomogeneity of the
rock slices. As expected, porosity was highest for the weathered rock and lowest for the fresh
rock.
4.3. Atnorphous and crystalline minerals.
The amorphous and crystalline iron oxides were determined in three parallel samples of
18
rapakivi by phase-selective extraction. Soluble salts and exchangeable ions were determined
as well, and the amount was <0.04 mg/g.
Table 7. Amount of Fe-oxides in the rocks. The range of results is given in parenthesis.
Rock Amorphous iron oxide Crystalline iron oxide
minerals, mg/g rock minerals, mg/g rock
YT5-1, fresh 1.3 (1.2-1.5) 0.17 (0.14-0.19)
YT5-2, weathered 0.96 (0.89-0.99) 3.0 (2.8-3.2)
YT5-3, altered 1.4 (1.2-1.5) 2.1 (2.1-2.2)
The amount of amorphous iron was similar in the fresh and altered rock, and slightly higher
than in the weathered rock. The atnotults of crystalline iron oxides in the altered and
weathered rock were, respectively, about 10 and 20 times the amount in fresh rock.
In the sorption experitnent (3.5 g crushed rock) the total amount of iron in the water (35 ml)
could thus range from 5 to 14 mg. Such an amount of iron will dominate the sorption of
many substances, when pH >7.
4.4. Rd values for the rocks.
4.4.1. Cesiutn
Cesium is an alkaline metal and in solution exists only in oxidation state + 1. The sorption of
cesium on geological media is tnainly a cation exchange process and depends on both the pH
and the ionic strength of the water. The sorption of cesium increases with pH and with
decreasing ionic strength. An increasing cation exchange capacity ( CEC) of the solid phase
generally enhances the sorption of cesium.
19
Table 8. The sorption (S%) and desorption (Sde%) and corresponding Rd values of cesium in aerobic conditions for rapakivi granite in groundwater. The contact time was 28 days in both sorption and desorption. In desorption pure groundwater was used, resulting in changes in concentrations.
The altered and weathered rapakivi granite showed the same sorption properties at different
Cs concentrations. The Rd values of the fresh rapakivi granite were one-fourth to one-third
those of the other rocks. Figure 1 shows the Rd values as a function of cesium concentration
and Figs.2 - 4 the Rd values as a function of time.
Ol ~ -M E
"0 a::
-e--- YT5-1
0.1
0.01
0.001 -8 -7
-+- YT5-2 -B- YT5-3
-6 -5 -4 -3 -2
log [Cs] mol/1
Fig. 1 The sorption of cesium on crushed rock with different concentrations of inactive cesium. YT -5 is fresh, YTS-2 is weathered and YTS-3 is altered rapakivi granite.
Fig. 3 Changes in sorption of cesium, on weathered rapakivi granite, YTS-2, from ground water with different Cs concentrations (mol/1).
Ol .Y. -M E
-o ([
0.1
0.01
0.001 0
,. _,_,a----"/ /
/ 121"/ /
c1'
.... .. ··•·············
6 12
22
-e- le-8
----- le-7 ________ -£]
-B- le-6
···•··· le-4
··································•
18 24 30
time, d
Fig. 4 Changes in sorption of cesium on altered rapakivi granite, YTS-3, from groundwater with different Cs concentrations (mol/1).
The figures indicate that alteration increases sorption of Cs, but increase in CEC due to
weathering is not followed by enhanced sorption of Cs. Sorption increases up to seven days.
It is difficult, however, to distinguish between increase in sorption due to diffusion of Cs into
mineral grains and that due to new surfaces exposed by abrasion.
4.4.2. Radium
Radiutn is an earth alkaline metal and in solution is in valence state +2. The sorption
tnechanism is presumed to be ion exchange. Chemically radium behaves much like barium,
which is often used as an analogue for radium.
23
Table 9. The sorption (S%) and desorption (Scte%) and corresponding "Rt values of radium in aerobic conditions for rapakivi granite in groundwater. The contact time was 21 days in both sorption and desorption.
Ba Sorption De sorption
Rock cone. (molfl) S% "Rt (m3/kg) sde% ~.de (m3/kg)
YT5-1 ~sao-7 99.7 ± 0.1 ~2.6 99.7 ± 0.1 ~2.3
fresh 99.8 ± 0.1 ~2.6 99.7 ± 0.1 ~2.2
99.9 ± 0.1 ~2.5 99.6 ± 0.1 ~2.2
99.9 ± 0.1 ~2.6 99.0 ± 0.2 ~2.2
1o-7 99.7 ± 0.1 ~2.5 99.4 ± 0.1 ~2.5
99.9 ± 0.1 ~2.6 99.1 ± 0.2 ~2.5
99.9 ± 0.1 ~2.6 99.7 ± 0.1 ~2.5
99.5 ± 0.1 2.1 100 ± 0.1 ~2.4
10-s 99.6 ± 0.1 ~2.6 99.9 ± 0.1 ~2.5
99.9 ± 0.1 ~2.6 99.9 ± 0.1 ~2.5
99.8 ± 0.1 ~2.6 99.7 ± 0.1 ~2.5
99.7 ± 0.1 ~2.6 99.9 ± 0.1 ~2.5
10-3 99.6 ± 0.1 2.5 99.7 ± 0.1 ~2.5
98.6 ± 0.2 0.74 99.7 ± 0.1 ~2.5
99.1 ± 0.2 1.2 98.3 ± 0.2 ~2.5
99.2 ± 0.1 1.2 99.9 ± 0.1 ~2.5
YTS-2 ~1o-7 99.9 ± 0.1 ~2.3 99.0 ± 0.1 ~1.6
weath. 99.9 ± 0.1 ~2.3 98.4 ± 0.1 ~1.7
99.9 ± 0.1 ~2.3 98.2 ± 0.1 ~1.6
99.9 ± 0.1 ~2.3 98.1 ± 0.2 ~1.7
10-7 99.9 ± 0.1 ~2.3 99.5 ± 0.1 ~2.2
99.9 ± 0.1 ~2.3 99.8 ± 0.1 ~2.1
99.9 ± 0.1 ~2.3 99.7 ± 0.1 ~2.2
99.9 ± 0.1 ~2.3 99.9 ± 0.1 ~2.2
1o-s 99.6 ± 0.1 ~2.3 99.6 ± 0.1 ~2.3
99.6 ± 0.1 ~2.3 99.6 ± 0.1 ~2.3
99.9 ± 0.1 ~2.3 99.9 ± 0.1 ~2.3
99.9 ± 0.1 ~2.3 99.8 ± 0.1 ~2.3
10-3 98.3 ± 0.3 0.61 99.9 ± 0.1 ~2.3
97.3 ± 0.5 0.37 99.9 ± 0.1 ~2.3
98.1 ± 0.3 0.54 99.9 ± 0.1 ~2.3
97.6 ± 0.4 0.44 99.7 ± 0.1 ~2.3
YTS-3 ~ao-7 99.6 ± 0.1 ~2.3 98.7 ± 0.2 ~2.2
altered 99.9 ± 0.1 ~2.3 98.0 ± 0.4 ~2.2
99.9 ± 0.1 ~2.3 97.4 ± 0.4 ~2.2
99.9 ± 0.1 ~2.3 98.8 ± 0.2 ~2.2
1o-7 99.4 ± 0.1 1.9 99.9 ± 0.1 ~2.2
99.9 ± 0.1 ~2.4 99.9 ± 0.1 ~2.2
98.8 ± 0.1 0.88 99.9 ± 0.1 ~2.2
99.4 ± 0.1 1.7 99.9 ± 0.1 ~2.2
1o-s 99.8 ± 0.1 ~2.3 99.8 ± 0.1 ~2.2
99.9 ± 0.1 ~2.3 99.9 ± 0.1 ~2.2
99.3 ± 0.1 1.4 99.6 ± 0.1 ~2.2
99.9 ± 0.1 ~2.3 99.9 ± 0.1 ~2.2
to-3 97.7 ± 0.3 0.44 99.9 ± 0.1 ~2.2
98.4 ± 0.2 0.65 99.7 ± 0.1 ~2.2
96.9 ± 0.4 0.33 99.9 ± 0.1 ~2.2
98.2 ± 0.3 0.56 99.9 ± 0.1 ~2.2
24
The removal of Ra from solution is very fast. In fresh rapakivi there was no great difference
in sorption for the different Ba concentrations; in altered and weathered rapakivi granite,
however, sorption was similar for the three lowest concentrations, and clearly lower, 0.5
m3/kg, at the initial Ba concentration of 10-3 mol/1. At other Ba concentrations Rct values were
higher than 2.3 m3 /kg. Figure 5 presents the Rct values of radium as a function of Ba
concentrations, and Figs.6- 8 show the Rct values as a function of equilibration time.
Fig. 5 The sorption of radium on crushed rock with different Ba concentrations. YT5-1 is fresh, YT5-2 is weathered and YT5-3 is altered rapakivi granite. For [Ba] < 10-3 mol/1 the lower limit of Rct is indicated.
O'l :Y. -(Y)
E
25
10 ~----------------------------------~
0.1 ~----~----~----~----~------~--~
0 5 10 15 20 25 30
time, d
--e-- <1e-7
-+- 1e-7
-B- 1e-5
···•··· 1e-3
Fig. 6 Changes in the sorption of radium on fresh rapakivi granite, YTS-1, from groundwater with different Ba concentrations, mol/1.
Fig. 8 Changes in the sorption of radium on altered rapakivi granite, YTS-3, from groundwater with different Ba concentrations, mol/1.
The original ground water was near saturation with respect to CaSO 4• The solubility of BaSO 4
(10-10 mol/1) was much lower than that of CaS04• At all elevated concentrations, of BaS04
however, and coprecipitation of Ra with BaSO 4 cannot be excluded the solution becomes
theoretically oversatured with BaSO 4 • Because Ba and Ra are effectively sorbed on minerals
/6/, sorption is nevertheless expected to be the main mechanism to remove Ra from solution.
This is suggested by the lowest sorption for the highest added Ba concentration and high
sorption at the lowest Ba concentration.
4.4.3. Protactiniutn
Protactinium is an actinide with two valency states, +5 and +4. Pa(V) is stable, while Pa(IV)
in solution, is readily oxidized to Pa(V) by oxygen in the atmosphere. Pa(IV) behaves much
like U(IV), and fonns a large number of crystalline compounds. In turn, Pa(V) resembles
U (V) in its chemical properties /7/. Protactinium was studied in aerobic and anaerobic conditions.
27
Table 10. The sorption (S%) and desorption (Sde%) and corresponding Rd values of protactinium in aerobic conditions for rapakivi granite in groundwater. The contact time in sorption was 31 days and in desorption 18 days.
Pa Sorption De sorption
Rock cone. (mol/1) Undissolv. S% Rd (m3/kg) sde% Rd,de(m3/kg) %
* after 3 days contact time, other samples after 31 days contact time
The sorption of protactinium was about the same in altered and weathered rapakivi granite:
Rd values were 0.59 - 0.72 m3/kg (Fig. 9 - 12). In the fresh rock the sorption was slightly
higher, and Rd was 1.0 m3/kg. The sorption is fast. There was no difference in Rd values for
the different concentrations. During the sorption experitnent pH values were constant.
28
Table 11. The solubility of protactinium in anaerobic conditions for rapakivi granite from groundwater. The contact time was in sorption 45 days and in desorption 15 days.
Rock Sample Undissolv. %
YT5-1 41 86±8
fresh 42 97±10
43 90±9
YT5-2 44 81±8
weath. 45 85±8
46 97±10
YT5-3 47 92±9
altered 48 84±8
49 93±9
Most of the protactinium remained undissolved in anaerobic conditions on the teflon strips
and thus no sorption or desorption values were obtained.~ and pH values were constant
during the experiment. In a sample consisting only of a teflon strip in groundwater, no tracer
was dissolved.
-B---- YT5-I -+- YT5-2 -a- YT5-3
10 ~------------------------------------------~
0.1 ~------~--------~------~--------~------~
-14 -13 -12 -I I -10 -9
log [Pa] mol/1
Fig. 9 The sorption of protactinium on crushed rapakivi granite with different Pa concentrations in groundwater in aerobic conditions.
Fig. 10 Changes in the sorption of protactinium on fresh rapakivi granite, YTS-1, from groundwater in aerobic conditions. Pa concentrations in moVl.
10~----------------------------------~
Ol .:Y -e- 1e-13 .......... .. (Y)
E - ---- - 1e-10
""0 rr
0.1 0 5 10 15 20 25 30
time, d
Fig. 11 Changes in the sorption of protactinium on weathered rapakivi granite, YTS-2, from groundwater in aerobic conditions. Pa concentrations in moVl.
Fig. 12 Changes in the sorption of protactinium on altered rapakivi granite, YT5-3, from groundwater in aerobic conditions. Pa concentrations in mol/1.
4.4.4. Uranium
Uranium may exist in valence states +6, +5, +4 and +3. Under oxidizing conditions the
hexavalent state U(VI) is dominant and uranium exists as the uranyl ion, UO/+. Under oxic
granite groundwater conditions in the presence of carbonate (2*10-3 mol/1), the species
U02(C03) 22- and U02(C03)/-dominate /8/. The main oxidation state under reducing conditions
is U(IV) /9/. The presence of Fe(II) in solution, from magnetite/pyrite or Fe(II)silicate
minerals, decreases the oxygen in the water and uranium might be reduced predominantly to
the tetravalent state at intermediate or low carbonate concentrations.
The sorption of hydroxide complexes under oxic carbonate-free conditions appears to be
highest in the pH range 5- 8.5, and shows some concentration dependence under both
oxidizing and reducing conditions /12/.
Under reducing conditions the solubility of U02 ((U40 9):U02,25) is about 2-4*10-8 mol/1 /10/.
The sorption of uranium, U (IV), is comparable to that of neptunium, Np(IV), and plutonium,
Pu(IV) /11/. The anionic carbonate complexes of uranium are soluble and can migrate as fast
as water and penetrate deep into the rock matrix when the sorption onto rock is low /13/.
Uranium was studied only in aerobic conditions.
31
Table 12. The sorption (S%) and desorption (Scte%) and corresponding Ru values of uranium in aerobic conditions for rapakivi granite from groundwater. The contact time was in sorption 26 days and in desorption 28 days.
u Sorption De sorption
Rock cone. (mol/1) S% Ru (m3/kg)*10-3 sde% ~ (m3/kg)*10-3
Fig. 16 Changes in the sorption of uraniutn on altered rapakivi granite, YTS-3, in groundwater, in aerobic conditions. U concentrations in mol/1.
4.4.5. Neptunium
Nepttu1ium has three stable oxidation states, IV, V and VI, in natural waters. Np(III) is stable
only at low pH in reducing conditions. Under aerobic conditions Np(V) is dominating. In
natural waters Np(V) exists as Np02+ or it forms hydroxy and carbonate complexes and
exhibits strongly pH-dependent sorption behaviour. The neptunyl cation, Np02+, is strongly
sorbed on many minerals. Under anaerobic groundwater conditions, Np(V) is reduced to
Np(IV) in the presence of suitable reducing agents, and the fast removal of neptunium from
solution is caused by fast surface-tnediated reduction of NpO/ to Np(IV)/14/.
The sorption of neptunium was studied in aerobic and anaerobic conditions.
35
Table 13. The sorption (S%) and desorption (Sde%) and corresponding Rd values of neptunium in aerobic conditions on rapakivi granite from groundwater. The contact time in sorption was 40 days for concentrations 10-7 and 10-9 mol/1 and 28 days for concentration 10-13 mol/1. The desorption contact time was 20 days.
Sorption De sorption
Rock Cone. (mol/1) S% Rd (m3/kg) sde% Rd. de (m 3 /kg)
Fig. 20 Changes in the sorption of neptunium on altered rapakivi granite, YT5-3, in groundwater in aerobic conditions. Np concentrations in mol/1.
Table 14. The sorption (S%) and desorption (Scte%) and corresponding Rct values of neptunium on rapakivi granite under anaerobic conditions. The contact time was 31 days in sorption and 49 days in desorption.
Rock Sample Undissolv. S% Rct (m3/kg) sde% Rd,de(m3/kg) %
YT5-1 1 19±1 100±1 ~1.4 100±1 ~1.5
fresh 2 25±1 100±1 2::1.3 100±1 2::1.4
3 13±1 99±1 ~1.6 100±1 ~1.6
YTS-2 4 10±1 100±1 ~1.6 100±1 ~1.7
weath. 5 17±1 99±1 ~1.5 99±1 ~1.5
6 8.4±0.4 99±1 2::1.6 99±1 ~1.7
YT5-3 7 24±1 99±1 ~1.4 99±1 ~1.4
altered 8 20±1 100±1 ~1.4 100±1 ~1.5
9 15±1 100±1 ~1.5 100±1 21.6
39
Table 15. The sorption (S%) and desorption (Sde%) and corresponding Rd values of neptunium under anaerobic conditions on rapakivi granite. The contact time was 77 days in sorption and 49 days in desorption.
Under anaerobic conditions the dissolution of neptunium from the strip is not complete. In
reducing anaerobic conditions the sorption is nearly 100% and the Rd values exceed
1.1 m3/kg.
~was clearly higher during the shorter contact time (31 days) than the longer contact time
(77 days) and the desorptions. When the rock is in contact with the water for a longer time,
the rock has an obvious reducing effect. pH values were between 7.22 and 8.52 and ~ values
correspondingly -28 to -178 m V (Appendix 11, Tables 2 and 4). In the sample where pure
m1filtered grom1dwater was in contact with the teflon strip, the amount of undissolved tracer
was 34% (for shorter contact time) and 15% (for longer contact time); after desorption,
measurement of the activity showed that 38 - 48% of the dissolved neptunium tracer was in
the precipitate of Fe-hydroxides.
Although the~ values do not point to strong reducting conditions, the behaviour of
technetium /14/ indicates that the conditions were reducting enough to give Np in redox state
Np(IV). More is said about the sorption of technetium in section 4.4.7.
40
4.4.6. Plutonium
Plutonium has four relatively stable oxidation states, +3, +4, +5 and +6. Under aerobic condi
tions at pH 5 - 6, the dominating form is Pu(V), and in natural waters at pH 6 - 9 it is
Pu(VI). At high carbonate concentration, Pu(V) carbonate complexes dominate if the pH is
high, >8. Under anaerobic conditions, Pu(III) carbonate and sulphate complexes dominate at
low pH, and if the pH is high, Pu(IV) hydroxides dominate /15/.
The most important factors to affect the solubility of plutonium in natural waters are redox
conditions, the oxidation state, pH, hydrolysis and complexing ions. In natural waters the
solubility reaction of plutoniutn is hydrolysis. The sorption increases when pH increases the
stage the hydrolysis occupies. The hydrolysis products are in dynamic state, nonstable in
water and easily adsorbed on the surfaces of minerals and natural colloids. The formation of
complexes with carbonate ions is very important in aerobic conditions /16/. The forms of
reduced plutonium Pu(III) and Pu(IV) are strongly sorbed on surfaces, while the oxidized
fonns Pu(V) and Pu(VI) are only weakly sorbed /17/.
The sorption of plutonium generally decreases in more oxidizing conditions /15/. Under
aerobic conditions Pu sorbs more strongly on calcite, CaC03, than on hornblende. This is due
either to surface complexation of Pu (IV) carbonate on calcite or to the fact that the sorbing
plutoniutn is in oxidized form, which sorbs on calcite. Under anaerobic plutonium does not
sorb to calcite or hornblende from granite groundwater, but there is strong sorption to both
frotn bentonite water /18/, a water with high carbonate content simulating the interaction
between grotu1dwater and bentonite (Na-montmorillonite).
The sorption of plutonium was studied under aerobic and anaerobic conditions.
41
Table 16. The sorption (S%) and desorption (Scte%) and corresponding Rct values of plutonium in aerobic conditions on rapakivi granite from groundwater. The contact time was 21 days in sorption and 47 days in desorption.
Fig. 21 Sorption of plutonium on crushed rapakivi granite in groundwater under aerobic conditions.
Ol .Y_ -(Y)
E
43
10 .-----------------------------------~
.. -• ........
/
/ -· / --....... / -_y---
0.1 ~----~----~----~----~------~--~
0 5 10 15 20 25 30
time, d
-e- 1e-13
- •- 1e-11
-a- 1e-9
Fig. 22 Changes in the sorption of plutonium on fresh rapakivi granite, YTS-1, in groundwater under aerobic conditions. Pu concentrations in mol/1.
Ol .Y_ -(Y)
E
10 .-----------------------------------~
-e- 1e-13
_-0 ?--,
I ' 'a------e-- - •- 1 e-11
-a- 1e-9
0.1 ~----~----~----~----~~----~--~
0 5 10 15 20 25 30
time, d
Fig. 23 Changes in the sorption of plutonium on weathered rapakivi granite, YTS-2, in groundwater under aerobic conditions. Pu concentrations in mol/1.
Ol .Y .......... (Y)
E
44
10 ~----------------------------------~
_.....8-__ _-El
./ ---- ------/0'/ --e-[3"'
• / ..... /
• /
/
/ /
/ /
/ /
/ /
0.1 ~----~----~----~----~----~----~
0 5 10 15 20 25 30
time, d
--e- 1e-13
----- 1 e-11
-a- le-9
Fig. 24 Changes in the sorption of plutonium on altered rapakivi granite, YTS-3, in groundwater under aerobic conditions. Pu concentrations in mol/1.
Under anaerobic conditions the amount of undissolved plutonium spike was between
29 and 83 %. There is no systematic pattern in the values. The sorption is fast. The Pu
activities in solutions were at the detection limit and only lower limits could be derived. The
amounts of dissolved plutonium affected the lower limit values of Rd: the lower the amount
dissolved, the lower the minimum for Rd.
The plutonium spike on the teflon strip remained undissolved in the samples of pure
unfiltered groundwater.
The~ values (+1 - -118 mV) and pH values (7.19- 8.37) were constant during the
experiment (Appendix II, Table 6).
45
Table 17. The sorption (S%) and desorption (Sde%) and corresponding Rd values of plutonium in anaerobic conditions on rapakivi granite from groundwater. The contact time was 73 days in sorption and 49 days in desorption.
The fission product 99Tc is a redox sensitive radionuclide. Under aerobic conditions the
teclmetium occurs as pertechnetate, TcO 4- and under reducing conditions the valence state +4
prevails. Tc(VII) is nearly non sorbing as Tc04- anion in oxic groundwater. Vandergraaf et al.
/19 I have noticed that teclu1etium is removed from anoxic solutions by iron oxides but not
by minerals containing ferrous iron as an integral part of their crystal lattice. Haines et al.
/20/ have demonstrated that the reaction between Tc04- and magnetite occurs via surface
mediated reduction to Tc(IV) and precipitation of Tc02 on the Fe30 4 surface /21/.
Teclmetium was studied only under anaerobic conditions. In fact, we used technetium to
confinn that reducing conditions prevailed.
46
Table 18. The sorption (S%) and desorption (Sde%) and corresponding Rd values of technetium in anaerobic conditions on rapakivi granite. The contact time was 31 days in sorption and 49 days in desorption.
Rock Sample Undissolv. S% Rd (m3/kg) sde% Rd,de(m3/kg) %
YT5-1 21 4.2±0.2 99±1 ~0.88 100±1 ~0.55
fresh 22 4.2±0.2 99±1 ~0.87 100±1 ~0.56
23 3.9±0.2 99±1 ~0.88 100±1 ~0.55
YT5-2 24 3.5±0.1 100±1 ~0.88 100±1 ~0.56
weath. 25 3.9±0.2 100±1 ~0.87 100±1 ~0.56
26 3.5±0.2 99±1 ~1.2 99±1 ~0.55
YT5-3 27 3.6±0.2 100±1 2=:0.88 100±1 2=:0.56
altered 28 4.3±0.2 100±1 2=:0.88 100±1 ~0.56
29 4.2±0.2 99±1 2=:0.87 100±1 2=:0.56
Table 19. The sorption (S%) and desorption (Sde%) and corresponding Rd values of teclmetium in anaerobic conditions on rapakivi granite. The contact time was 77 days in sorption and 49 days in desorption.
Rock Sample Undissolv. S% Rd (m3/kg) sde% Rd,de(m3/kg) %
YT5-1 30 ::;1 99±1 2=:0.59 100±1 ~0.56
fresh 31 ::;1 97±1 2=:0.58 100±1 ~0.55
32 ::;1 100±1 2=:0.59 98±1 2=:0.58
YTS-2 33 :::;1 95±1 ~0.59 99±1 ~0.55
weath. 34 ::;1 100±1 2=:0.59 87±1 2=:0.58
35 ::;1 100±1 2=:0.59 100±1 ~0.58
YT5-3 36 ::;1 98±1 2=:0.59 99±1 2=:0.57
altered 37 ::;1 98±1 2=:0.59 100±1 ~0.56
38 ::;1 100±1 ~0.59 95±1 ~0.58
In sorption during the shorter contact time (31 days), 13% of the technetium from the teflon
strip was dissolved when there was pure groundwater in the sample. When the contact time
47
was longer (77 days) the dissolved fraction was 94%. After desorption the activity of the
precipitate of Fe-hydroxides was measured and about 30% of dissolved technetium was found
in the precipitate.
Although the measured values for ~ did not point to reducing conditions they were reducting
enough for technetium and neptunium /14/ (Appendix II, Tables 1 and 3).
4.5. Diffusion experiments
Figures 25 - 27 display curves of the mass flow of tritium, Ql/C, versus time. A stationary
state for tritium was achieved in the rapakivi samples. Table 21 presents the ratio of
cumulative breakthrough activity (A) to the total atnount of tracer (~), diffusion coefficients
De and Da and porosities (calculated and measured).
Fig. 25 The cumulative mass flow of tritiated water for fresh rapakivi granite, YT5-1. 6. =sample 1, ... = sample 2, 0 = sample 3. The time lag values are in Table 21.
Fig. 26 The cumulative mass flow of tritiated water for weathered rapakivi granite, YTS-2. • = sample 4, o = sample 5, D = sample 6. The time lag values are in Table 21.
Fig. 27 The cumulative mass flow of tritiated water for altered rapakivi granite, YTS-3. + = satnple 7, v = satnple 9. The titne lag values are in Table 21.
49
Table 21. Diffusion characteristics of rapakivi granite. YT5-1 is fresh rapakivi and 1,2 and 3 are parallel samples. YT5-2 is weathered rapakivi and 4, 5 and 6 are parallel samples. YT5-3 is altered rapakivi and 7, 8 and 9 are parallel samples. Sample 8 began to leak after 20 days.
Sample NAo Time lag, L, De Da DjDa c (V%) % d 10-13 m2/s 10-11 m2/s %
YT5-1-1 2.19 7.5 4.6 7.3 0.63 0.29
YT5-1-2 2.03 7.5 3.5 6.3 0.56 0.29
YT5-l-3 1.45 8.8 2.6 5.3 0.49 0.33
YT5-2-4 21.06 3.5 39 13 3.0 3.9
YT5-2-5 18.96 3.5 36 14 2.6 3.1
YT5-2-6 12.12 3.5 36 14 2.6 3.5
YT5-3-7 2.68 8.8 4.6 4.9 0.94 0.71
YT5-3-8 3.89 7.2 0.75
YT5-3-9 2.55 7.5 5.3 7.1 0.75 0.61
The measured, c, (sect.4.2) and calculated, DjD3 , values of porosity in rapakivi granite are
closely similar. The De values are ten times as great in weathered rapakivi granite as in fresh
and altered rapakivi granite, and the Da values are twice as great. Apparently the weathered
rapakivi granite was much more porous than the others.
50
5. SUMMARY OF THE RESULTS OF SORPTION AND DIFFUSION EXPERIMENTS
The sorption material (rapakivi rock) was characterized with respect to cation exchange
capacity, the amount of Fe-oxides and the porosity. The cation exchange capacity increased
in order fresh, altered and weathered rock. The amount of amorphous Fe-oxides was less in
weathered rock than in the more or less similar fresh and altered rock. The amount of
crystalline Fe-oxides decreased in the order weathered, altered and fresh rock. The values of
the volume porosity indicated that the weathered rock was clearly more porous than the
altered and the fresh rock. The values of De for tritiated water increased in the order fresh,
altered and weathered rock.
At low concentration the sorption of cesiutn was similar in weathered and altered rock and
weeker in fresh rock. When the concentration of cesiutn increased the sorption was the same
for all rocks. In the case of radium the Rct values were tnostly large. At the highest
concentration of radium, 10-3 tnol/1, the sorption was strongest for fresh rock. Much weaker
sorption of radiutn was recorded for the weathered and altered rock. Under anaerobic
conditions only 10% of the protactinium tracer dissolved. The sorption was similar on
weathered and altered rock and greater on fresh rock.
Uranium was studied only in aerobic conditions and there was no difference between the
rapakivi rocks. The sorption was independent of concentration and was not quite reversible or
else it was kinetically slow. In aerobic conditions the sorption of neptunium was not
dependent on concentration and there was no difference between rapakivi rocks. In anaerobic
conditions the sorption was high on all rocks and only the minimum for Rct could be
determined. The sorption of plutonitun was also high in aerobic conditions. There was no
clear dependence of sorption on concentration at low concentrations oo-l3 - 10-11 mol/1), but
the sorption was larger at concentration 10-9 mol/1 than at lower concentrations. Under
anaerobic conditions the tracer was dissolved only partly, however. The sorption was high
and only the tninitnum for Rct could be detennined.
The sorption of technetium was studied tu1der anaerobic conditions, and also was of interest
to check the reducing conditions in the glove box. The sorption was high and thus the system
was reducing enough for technetium, as also concluded from the~ and pH values.
51
6. COMPARISON WITH RESULTS FOR OTHER INVESTIGATION SITES ROCKS
Sorption onto rapakivi granite is here compared with that onto rocks at the Posiva
investigation sites at Olkiluoto, Kivetty and Romuvaara. The basis for the comparison is the
cation exchange capacities of the rocks and the sorption of cesium, strontium and radium. As
well the redox properties of the host rocks at Hastholmen are compared with those at the
other investigation sites.
6.1. Cation exchange capacity
The cation exchange capacities ( CEC) of the rocks at the other sites /22/ were derived on the
basis of mineral compositions and of literature CEC values for the minerals /23/. The CEC
value for the unaltered rapakivi granite is about the same as for other unaltered granite rocks,
largely because high capacity minerals are present in about the same amounts. The rapakivi
granite at Hastholmen is sequentially layered rock of different degrees of alteration. The CEC
value of the altered and weathered granite increases with the increasing amounts of clays and
other high capacity alteration minerals. The CEC value of the altered rapakivi is slightly
higher than that of the tonalites investigated and only slightly lower than that of mica
gneisses. In addition to the high CEC capacity of the clays, they are favourable in sorption
because, thanks to their small mineral grain size, the sorption sites are readily accessible.
Rapakivi and some parts of the granites at Kivetty are red because of the hematite contained.
The iron oxide minerals are efficient sorbents, especially for transition elements and certain
actinides. Hydrothermal iron oxides are fom1d in some tonalites, too, but are rare deep in the
Olkiluoto mica gneiss.
6.2. Redox condition of the host rocks
Theoretically the reduction capacity of a rock can be derived from its Fe(II) content. Mica
gneisses and granodiorites of the bedrock at the investigation site contain clearly more of
these minerals (biotite, chlorite, hornblende) than do the granites. On the other hand, it has
52
been shown that the Fe(II) bound to mineral structure is not necessarily readily available for
oxidation. Small crystalline tninerals (e.g. chlorite) may be more important reducers at least
in the short run. The chlorite content of unaltered rapakivi is higher than the average in
granites, and the chlorite contents of altered and weathered granites are even higher. Of the
rocks studied, the Olkiluoto mica gneiss (YD1) has the highest chlorite content.
6.3. Groundwaters
The TDS (total dissolved solids) values for the Romuvaara and Kivetty investigation sites,
TDS <1000 mg/1, indicate only fresh waters. Values of Cl 9200 mg/1 and TDS 35000 mg/1
have been measured in some saline waters at Olkiluoto. The TDS values at the bottom (792
m) of the KR1 hole at Olkiluoto (17000 - 30000 mg/1) indicate saline groundwater. In the
Hastholmen rapakivi region, the maximum salinity measured at depths down to 200 m is
about 10 000 mg/1 (TDS), and the waters are mainly brackish (1000 mg/1 < TDS < 10 000
mg/1).
The pH values of the groundwaters in regions of acidic rocks at the investigation sites have
been about the same, taking into consideration that the values include some inaccuracy due to
the satnpling teclmique used. The value for Hastholmen region does not deviate from the
average.
Redox electrode measuretnents at all the investigation sites have hinted at "reducing"
groundwater/bedrock conditions. Reducing conditions have been most clearly demonstrated in
high sulphide (Olkiluoto) and high Fe(II) (Hastholmen) waters. In conclusion, the pH~
values of the Hastholmen groundwater are about the same as in "reducing" waters in the
other granitic region (Kivetty).
6.4. Sorption of cesium, strontium and radium
Sorption of alkaline and earth-alkaline elements to silicate minerals is mainly by cation
exchange and thus inversely proportional to ionic strength of the water. The Rct values of Sr
53
for Olkiluoto mica gneiss in OLKRS water (TDS 13000 mg/1) and for the Kivetty granite
host rock system are 0.3 *10-3 m3/kg and 6 * 10-3 m3/kg. The corresponding values for Ra are
0.2 m3/kg and 1.5 m3/kg /6/. The values for Olkiluoto mica gneiss would be slightly lower in
the OLKR1 water (TDS 23 000 mg/1) than in the OLKRS water. The Rd values of Sr and Ra
for the Hastholmen conditions were 0.6 - 1-0 * 10-3 m3/kg /22/ and 0.9 - 2.6 m3/kg (see sect.
4.4.2.).
The Rd values of cesium in the Hastholmen conditions were 0.1 m3/kg for the unaltered rocks
and 0.45 - 0.49 m3/kg for the altered and weathered rock (this work). The value for an
unaltered Skoldvik tnica gneiss containing the satne amount of biotite as the Olkiluoto mica
gneiss was 0.34 - 0.4 m3/kg /24/. Sorption of Cs to unaltered rock is nearly linearly
proportional to biotite content of the rock /25/. It can be estimated that sorption of cesium to
Olkiluoto mica gneiss in Olkiluoto water is about the same as to unaltered rapakivi in
Hastholmen water. Sorption of cesium to rocks is much higher in Kivetty and Romuvaara
conditions than in saline waters. Rd values higher than 1.0 m3/kg have been measured for
Olkiluoto tonalite and rapakivi in fresh groundwater /25/.
The Cs sorption capacity of rapakivi granite is the same as that for ultramafic homblendite
from Syyry.
In conclusion, sorption of elements reacting mainly by cation exchange is higher in brackish
Hastholmen groundwater conditions than in saline Olkiluoto groundwater conditions but
lower than in Kivetty and Romuvaara fresh water conditions.
6.5. Sorption of redox-sensitive elements
Sorption of neptuniutn and uranium on rocks is lower in aerobic saline waters containing
carbonate than in fresh waters. The Rd values of uranium for Kivetty granodiorite in fresh
water and for rapakivi in brackish Hasthohnen water were 0.05 m3/kg and 0.001- 0.0015
m3/kg /26, sect. 4.4.4/. For tnica gneisses in saline groundwaters of Olkiluoto and brackish
groundwater of Hastholmen the values were 0.002- 0.004 m3/kg and 0.006- 0.020 m3/kg
/27/.
54
The anaerobic groundwater conditions at Olkiluoto, Kivetty and Hastholmen are reducing for
Np(V) and Tc(VII) /15, 28, this work/. At Romuvaara there were some technical difficulties
in sampling of representative groundwater for anaerobic laboratory experiments. In an earlier
experiment, however, U(VI) was in part reduced to U(IV) in RO-KRS water /29/. The same
was found for OL-KRS water /14/. In RO-KRS water, Tc(VII) was in part reduced to Tc(IV),
while in Hastholmen water the reduction to Tc(IV) was complete /28, this work/, which
suggests the Hastholmen water to be more reducing.
Relative to the conditions in the tonalite-, granodiorite areas at Romuvaara, the redox
conditions at Hastholtnen and Olkiluoto have been more clearly demonstrated to be reducing,
especially at sampling depths where sulphide has been found. Alterations in the measured ~
potentials due to teclmical probletns with the Kivetty groundwater make it difficult to
estimate the redox conditions.
Sorption of neptunium, technetium and uranium to rapakivi granite under anaerobic, very low
carbonate conditions is high and the same as that for Olkiluoto mica gneiss /14/.
6.6. Effective diffusion of water
The effective diffusion of tritiated water in rapakivi is about the same as in the other rocks
investigated. Diffusion of ionic species in rocks may be affected by anion exclusion and
enhanced diffusion of cations called "surface diffusion". Both these processes are weaker in
saline than in fresh waters. In this respect the host rocks at Olkiluoto and Hastholmen
resemble each other, as do the host rocks at Kivetty and Romuvaara.
6.7. Conclusions
In summary the sorption of the elements Cs, Sr, Ra, Np, Tc, U to rapakivi granite in
Hastholmen bedrock is at least as high as that to host rock in the saline groundwater area of
Olkiluoto. Sorption of cations is higher at Kivetty and Romuvaara, where groundwaters are
fresh, than in the brackish groundwater area of Hastholmen.
55
7. REFERENCES
1. Chao, T.T., Use of partial dissolution techniques in geochemical exploration, Journal of Geochemical Exploration, 20 (1984) 101-135
2. Currie, L.A., Limits for Qualitative Detection and Quantitative Determination, Application to Radiochemistry, Analytical Chemistry, vo1.40, no.3, March 1968, p 586
3. Crank J ., The Mathematics of Diffusion, second edition, Oxford Science Publications, 1989
4. Barrer R., Diffusion in and through Solids, Cambridge University Press, 1951
5. Chabra, R., Pleysier, J., Cremers, A.: The measurement of the cation exchange capacity and exchangeable cations in soils: A new method. Proc.Int.Clay Conf. 1075, Applied Publishing Ltd, Wilmele, Illinois 60091, USA
6. Kulmala, S., Hakanen, M., Sorption of alkaline-earth elements Sr, Ba and Ra from groundwater on rocks frotn TVO investigation areas, Report YTJ -95-03
7. E.S.Pal'shin, B.F.Myasoedov and A.V.Davydov, Analytical Chemistry of Protactinium Humphrey Science Publishers, Ann Arbor-London, 1970
8. Wanner, H., Forest, I., eds., Chemical Thermodynamics of Uranium. Chemical thermodynamics 1, OECD Nuclear Energy Agency, 1992, North Holland.
9. Cotten, F.A., Wilkinson, G., Advanced Inorganic Chemistry. 3rd ed., New York 1972, Wiley Interscience
10. Ollila, K., Solubility of unirradiated U02 fuel in aqueous solutions - comparison between experimental and calculated (EQ3/6) data. Helsinki 1995, Nuclear Waste Commission of Finnish Power Companies, Report YJT-95-14
11. Allard, B., Actinide solution equilibria and solubilities in geological systems. Stockholm 1983, Svensk Kan1bdinslesakerhet, SKB Technical Report 83-35
12. Allard, B., Anderson, K., Torstenfelt, B., The distribution coefficient concept and aspects on experimental distribution studies. Goteborg 1983, Svensk Kambranslesakerhet, SKB Teclmical Report 83-63
13. Kipatsi, H., Sorption Behaviour of Long-lived Fission Products and Actinides in Clay and Rock. Goteborg 1983, Thesis, Department of Nuclear Chemistry, Chalmers University of Technology, Goteborg
14. Hakanen, M., Lindberg, A., Teclmetium, neptunium and uraniutn in simulated anaerobic ground water conditions. Helsinki 1995, Nuclear Waste Commission of Finnish Power Companies, Report YJT-95-02
56
15. Allard, B., Olofsson, U. Torstenfelt, B., Kipatsi, H., Andersson, K., Sorption of actinides in well-defined oxidation states on geological media. Scientific Basis for Nuclear Waste Management V, New York 1982, W.Lutze (ed.) Mat.Res.Soc.Symp.Proc. 11, Elsevier Science Publishers Co., pp 775-782
16. Kim, J.l., The chemical behaviour of transuranium elements and barrier functions in natural aquifer systems. Scientific Basis for Nuclear Waste Management XVI. Mat.Res.Soc.Symp.Proc. 294. Pittsburg, Materials Research Society, pp 3-21
17. Penrose, W.R., Metta, D.N., Hylko, J.M. Rinckel, L.A., The reduction of plutonium(V) by aquatic sediments. J.Environ.Radioactivity, 5, pp 169-184, 1987
18. Kulmala, S., Hakanen, M., Review of the sorption of radionuclides on the bedrock of Hastholmen and on construction and backfill materials of a final repository for reactor wastes. Helsinki 1992, Nuclear Waste Commission of Finnish Power Companies, Report YJT-92-21
19. Vandergraaf, T.T., Ticknor, K.V., George, I.M., in Geological Behaviour of Radioactive Waste, G. Scott Bamey ed. Am. Chem. Soc. Symp. Ser. 246, 24 (1984)
21. Cui, D., Eriksen, T.E., Reduction of Tc(VII) and Np(V) in solution by ferrous iron. A laboratory study of homogeneous and heterogeneous redox processes. Stockholm 1996, Svensk Kan1branslehantering AB, SKB Teclu1ical Report 96-03
22. Hakanen, M., Holtta, P., Review of sorption and diffusion parameters for TV0-92. Helsinki 1992, Nuclear Waste Commission of Finnish Power Companies, Report YJT-92-14.
23. Allard, B., Karlsson, M., Tullborg, E-L., Larson, S.A., Ion exchange capacities and surface areas of some tnajor cotnponents and common fracture filling materials of igneous rock. Goteborg 1983, Svensk Kambdinslesakerhet, SKB Technical Report 83
24. Pitu1ioja, S., Hietanen, R., Alaluusua, M., Review of the sorption data of the main radionuclides in low and intennediate level nuclear wastes for Finnish bedrock. Helsinki 1986, Nuclear Waste Commission of Finnish Power Companies, Report YJT -86-02 (in Finnish with an English abstract)
25. Alaluusua, M., Hakanen, M., Lindberg, A., The sorption of cesium, strontium and cobalt on crushed rock produced by jaw crusher. Helsinki 1990, IVO/Nuclear Waste Studies, Work Report 90-2 (in Finnish)
26. Hakanen, M., Tuominen, S., Sorption and desorption experiments with crushed granite from Kivetty, University of Helsinki, Department of Radiochemistry, 1994, unpublished (in Finnish)
27. Kaukonen, V., Puukko, E., Hakanen, M., Lindberg, A., Diffusion of neptunium in Olkiluoto tnica gneiss and pegtnatite and Kivetty granite. TURV A-95-05 (in Finnish
57
with an English abstract)
28. Kulmala, S., Hakanen, M., Lindberg, A., Sorption of protactinium on rocks in ground waters from Posiva investigation sites, Nuclear Waste Commission of Finnish Power Companies, Report POSIVA-96-12
29. Hakanen, M., Lindberg, A., Sorption of uranium on rocks in anaerobic groundwater. Helsinki 1992, Nuclear Waste Commission of Finnish Power Companies, Report YJT-92-25.
LIST OF APPENDICES
Appendix I. Groundwater chemistry data from Hastholmen, LPV A2
Appendix II. Measured ~ and pH values at the end of the experiments.
1
APPENDIX I Table 1. Analysed components of the groundwater, physical and chemical parameters, cations and anions. (LPVA2, 3 January 1996)
Parameter Field measurements Lab.analyses (anal. after Lab.analyses (after 1 sampling) week equilibration and
0.22 !Jlll filtration)
pH 7.6 - 7.7 7.5 7.5
Conductivity, mS/m 1300 1300
Eh (Pt), mV -50
0 2, mg/1 0.005
Alkalinity, meq/1 1.25 1.2
Acidity, meq/1 0.28 0.07
Opacity, FTU 43
Colour, Pt mg/1 171
Particulate matter, mg/1 not found
KMn04, mg/1 0.7
Tot. hardness, 0 dH 193
DOC, mg/1 0.85
Si02, mg/1 9.4 9.4
Br, mg/1 17.6 17
F, mg/1 1.1 1.1
I, mg/1 0.071
P04, mg/1 <0.01 <0.01
S04, mg/1 550 510
S(-II), mg/1 <0.01
Cl, mg/1 4900 5060
AI, mg/1 0.006 0.001
Ba, mg/1 <0.5 <0.5
Ca, mg/1 780 785
Fetw mg/1 5.8 (5.6ortof) 0.08
Fe(II), mg/1 5.3
K, mg/1 29 29
Mg, mg/1 240 239
Mn, mg/1 3.1 3.1
Na, mg/1 2040 2080
Ni, mg/1 0.002 0.001
B, mg/1 0.25 0.20
2
Cs, mg!l 0.009 0.005
Li, mgll 0.10 0.14
Sr, mgll 6.1 6.0
Zr, mgll 0.01 0.02
Table 2. Analysed isotopes and gases. 3 January 1996.
Parameter Field measurements Lab.analyses (anal. after Lab.analyses (after 1 sampling) week equilibration and
0.22 !ID1 filtration)
H-3, TU <7.2
U-238, mBq/1 (filtrate) 83 ± 3
U-234/U-238 (filtrate) 2.12 ± 0.10
U-238, mBq/1 0.17 ± 0.05 and <0.13 (membranes)*
U-234/U-238 1.33 ± 0.62 and -(membranes)*
0-18, %o SMOW -8.22
H-2, %o SMOW -67.2
H-2, f.!l/1 not found
He, f.!l/1 115
N2, !Jl/1 17800
C02, f.!l/1 820
CO, !JI/1 not found
C2H4, f.!l/1 0.12
CH4, f.!l/1 29
C2H6, f.!l/1 0.16
Dissolv.tot C02, mgll 51
* The an10unt and quality of particulate matter vary in membranes.
The reliability of the analyses is estimated by charge balance calculations: E = [Cations(meqjl) -Anions (meqjl))/(Cations(meqjl)+ Anions(meq/1))] x 100 According to this the values of lab. analyses (both immediately after sampling and after one week equilibration) are reliable the charge balance errors are: -0.87% (after sampling) and -1.48% (after 1 week equilibration and filtration).
3
Table 3. Analysed components of the groundwater, physical and chemical parameters, cations and anions. (LPV A2, 13 August 1996)
Parameter Field measurements Lab.analyses (anal. after Lab.analyses (after 1 sampling) week equilibration and
0.22 fl1l1 filtration)
pH 7.73 7.12 7.74
Conductivity, mS/m 1300 1450 1460
Eh (Pt), mV -143
0 2, mg/1 0.0011
Alkalinity, meq/1 1.4 1.3
Acidity, meq/1 0.2 0.17
Free C02, mg/1 8.8
Aggressive C02, mg/1 2.42
Ammonium ion, mg/1 2.4
Opacity, FTU 55
Colour, Pt mg/1 210
Particulate matter, mg/1 17
KMn04, mg/1 1.5
Tot. hardness, 0 dH 171
DOC, mg/1 0.9
Si02, mg/1 9.7 9.0
Nitrate N03, mg/1 0.53
Br, mg/1 16 17
F, mg/1 1.1 1.1
I, mg/1 0.10
P04, mg/1 <0.01 <0.01
S04, mg/1 528 491
S(-11), mg/1 <0.01
Cl, mg/1 4890 4800
Al, mg/1 0.010 0.013
Ba, mg/1 <0.8 <0.8
Ca, mg/1 800 760
Fe1ov n1g/l 4.7(5.3ortof) 0.82
Fe(II), mg/1 5.0
K, mg/1 26.1 26.8
Mg, mg/1 240 230
4
Mn, mg/1 2.4 2.4
Na, mg/1 2080 1990
Ni, mg/1 0.12 0.12
B, mg/1 0.08
Cs, mg/1 0.040 0.034
Li, mg/1 0.05 0.04
Sr, mg/1 4.4 3.3
Zr, mg/1 <0.01 <0.01
Table 4. Analysed isotopes and gases. 13 August 1996.
Parameter Field measurements Lab.analyses (anal. after Lab.analyses (after 1 sampling) week equilibration and
0.22 !1111 filtration)
H-3, TU <6.6
U-238, mBq/1 (filtrate) 86 ± 4
U-234/U-238 (filtrate) 2.11 ± 0.15
U-238, mBq/1 <0.07 (membranes)*
U-234/U-238 -(membranes)*
0-18, %o SMOW -8.1
H-2, %o SMOW -63.0
H-2, !Jl/1 not found
He, !11/1 100
N2, !Jl/1 17500
C02, !Jl/1 2000
CO, !Jl/1 not found
C2H4, !1111 0.035
CH4, !11/1 25
C2H6, !11/1 0.04
Dissolv.tot C02, mg/1 58.1
* The amount and quality of particulate matter vary in membranes.
The reliability of the analyses is estimated by charge balance calculations: E = [Cations(meq/1) -Anions (meq/1))/(Cations(meq/l)+ Anions(meq/1))] x 100 According to this the values of lab. analyses (both immediately after sampling and after one week equilibration) are reliable, the charge balance errors are: 0.245% (after sampling) and -0.988% (after 1 week equilibration and filtration).
APPENDIX II
Table 1.
Table 2.
Table 3.
Table 4.
Table 5.
Table 6.
Table 7.
Table 8.
pH values at the end of the sorption experiment of protactinium under aerobic
conditions.
pH values at the end of the sorption experiment of uranium under aerobic
conditions.
pH values at the end of the sorption experiment of neptunium under aerobic
conditions.
pH values at the end of the sorption experiment of plutonium under aerobic
conditions.
~ and pH values at the end of the sorption and desorption experiments of
protactinium under anaerobic conditions (contact times 45 d and 15 d).
~and pH values at the end of the sorption and desorption experiments of
neptw1iutn under anaerobic conditions (contact times 31 d and 49 d).
~and pH values at the end of the sorption and desorption experiments of
neptw1ium under anaerobic conditions (contact times 77 d and 49 d).
~and pH values at the end of the sorption and desorption experiments of
plutonium under anaerobic conditions (contact times 73 d and 49 d).
Table 9. ~ and pH values at the end of the sorption and desorption experiments of
technetium under anaerobic conditions (contact times 31 d and 49 d).
Table 10. ~and pH values at the end of the sorption and desorption experiments of
teclmetium under anaerobic conditions (contact times 77 d and 49 d).
1
Table 1. Table 2. pH values of the samples after protactinium pH values of the samples after uranium sorption, sorption, aerobic conditions, contact time 31 d. aerobic conditions, contact time 26 d.
Table 3. Table 4. pH values of the samples after neptunium sorption, pH values of the samples after aerobic conditions, contact time 40 d plutonium sorption, aerobic conditions, (Np cone. 10-9 ja 10-7 mol/1) contact time 21 d.
Table 5. ~and pH values after sorption and desorption of protactinium, anaerobic conditions, contact time 45 d and 15 d.
sorption desorption
sample ~ pH ~ pH
YTS-1-41 +14 7.48 +34 7.68
YTS-1-42 +7 7.48 +6 7.69
YTS-1-43 -76 7.80 -1 7.70
YTS-2-44 -49 7.33 +29 8.15
YTS-2-45 -37 7.37 +79 8.18
YTS-2-46 -11 7.36 +100 8.08
YT5-3-47 -42 7.16 +114 8.20
YT5-3-48 -49 7.25 +20 7.77
YTS-3-49 -35 7.25 +24 8.20
Table 6. ~and pH values after sorption and desorption of neptunium, anaerobic conditions, contact time 31 d and 49 d.
sorption desorption
sample ~ pH ~ pH
YTS-1-1 +54 7.95 -74 7.68
YTS-1-2 +62 7.94 -65 7.65
YTS-1-3 +68 7.99 -67 7.70
YTS-2-4 +174 8.10 -24 7.41
YTS-2-5 +122 7.71 -14 7.22
YTS-2-6 +104 7.80 -17 7.26
YT5-3-7 +64 8.03 -45 7.64
YT5-3-8 +172 8.20 -39 7.65
YT5-3-9 +41 7.81 -39 7.54
4
Table 7. ~ and pH values after sorption and desorption of neptunium, anaerobic conditions, contact time 77 d and 49 d.
sorption desorption
sample ~ pH ~ pH
YT5-1-11 -65 7.80 -86 7.81
YT5-1-12 -65 7.76 -146 8.11
YT5-1-13 -69 7.66 -130 7.91
YT5-2-14 -42 7.40 -112 7.55
YT5-2-15 -28 7.35 -109 7.50
YT5-2-16 -34 7.22 -171 8.44
YT5-3-17 -61 7.76 -178 8.52
YT5-3-18 -40 7.80 -139 7.89
YT5-3-19 -41 7.61 -178 8.60
Table 8. ~ and pH values after sorption and desorption of plutonium, anaerobic conditions, contact time 73 d and 49 d.
sorption desorption
sample ~ pH ~ pH
YTS-1-51 -27 7.74 -106 7.71
YT5-1-52 -39 7.72 -114 7.79
YT5-1-53 -40 7.65 -109 7.68
YT5-2-54 -42 7.62 -86 7.43
YT5-2-55 +1 7.19 -82 7.33
YT5-2-56 -8 7.25 -73 7.39
YT5-3-57 -32 7.82 -118 7.65
YT5-3-58 -32 8.37 -73 7.70
YT5-3-59 -34 7.58 -109 7.53
5
Table 9. ~ and pH values after sorption and desorption of technetium, anaerobic conditions, contact time 31 d and 49 d.
sorption desorption
sample ~ pH ~ pH
YTS-1-21 +88 7.90 -51 7.73
YTS-1-22 +120 7.96 -74 8.11
YTS-1-23 +32 8.01 -63 7.64
YTS-2-24 +77 7.84 -75 8.38
YTS-2-25 +89 7.65 -31 7.20
YTS-2-26 +126 8.10 +3 7.35
YTS-3-27 +38 7.86 -35 7.57
YTS-3-28 +21 7.82 -45 8.31
YTS-3-29 +18 7.81 -49 7.65
Table 10. ~and pH values after sorption and desorption of technetium, anaerobic conditions, contact time 77 d and 49 d.
sorption desorption
sample ~ pH ~ pH
YTS-1-31 -86 7.80 -89 7.77
YTS-1-32 -64 7.74 -121 7.78
YTS-1-33 -74 7.80 -157 8.09
YTS-2-34 -49 7.42 -130 8.36
YTS-2-35 -31 7.22 -164 8.46
YTS-2-36 +1 7.21 -112 7.46
YTS-3-37 -34 7.76 -118 7.72
YTS-3-38 -48 7.70 -129 7.69
YTS-3-39 -49 7.63 -161 8.11
LIST OF REPORTS 1 (4)
LIST OF POSIV A REPORTS PUBLISHED IN 1996
POSIVA-96-01
POSIV A-96-02
POSIV A -96-03
POSIV A-96-04
POSIV A -96-05
POSIV A -96-06
Determination of U oxidation state in anoxic (N2) aqueous solutionsmethod development and testing Kaija Ollila VTT Chemical Technology June 1996 ISBN 951-652-000-6
Fault plane solutions of microearthquakes in the Loviisa region in south-eastern Finland Jouni Saari IVO International Ltd Ragnar Slunga Forsvarets Forskningsanstalt, Stockhom, Sweden June 1996 ISBN 951-652-001-4
Thermal optimisation of the final disposal of spent nuclear fuel Heikki Raiko VTTEnergia June 1996 (in Finnish) ISBN 951-652-002-2
On the origin and chemical evolution of ground water at the Olkiluoto site Petteri Pitkanen Technical Research Centre of Finland Margit Snellman Imatran Voima Oy Ulla Vuorinen Technical Research Centre of Finland June 1996 ISBN 951-652-003-0
Seismic emissions induced by the excavations of the rock repository in Loviisa Jouni Saari IVO International Ltd June 1996 ISBN 951-652-004-9
Geochemical modelling study on the age and evolution of the groundwater at the Romuvaara site Petteri Pitkanen Technical Research Centre of Finland Margit Snellman Imatran Voima Oy Ulla Vuorinen, Hilkka Leino-Forsman Technical Research Centre of Finland September 1996 ISBN 951-652-005-7
POSIV A -96-07
POSIV A-96-08
POSIV A-96-09
POSIVA-96-10
POSIVA-96-11
POSIVA-96-12
POSIVA-96-13
LIST OF REPORTS 2 (4)
Boring of full scale deposition holes using a novel dry blind boring method Jorma Autio, Timo Kirkkomaki Saanio & Riekkola Consulting Engineers November 1996 ISBN 951-652-006-5
Production methods and costs of oxygen free copper canisters for nuclear waste disposal Harri Aalto, Hannu Rajainmaki, Lenni Laakso Outokumpu Poricopper Oy October 1996 ISBN 951-652-007-3
Characterization of the excavation disturbance caused by boring of the experimental full scale deposition holes in the Research Tunnel at Olkiluoto Jorma Autio Saanio & Riekkola Consulting Engineers December 1996 ISBN 951-652-008-1
Gamma and neutron dose rates on the outer surface of the nuclear waste disposal canisters Markku Anttila VTTEnergy December 1996 ISBN 951-652-009-X
Criticality safety calculations for the nuclear waste disposal canisters Markku Anttila VTTEnergy December 1996 ISBN 951-652-010-3
Assessment of alternative disposal concepts Jorma Autio, Timo Saanio, Pasi Tolppanen Saanio & Riekkola Consulting Engineers Heikki Raiko, Timo Vieno VTTEnergy Jukka-Pekka Salo Posiva Oy December 1996 ISBN 951-652-011-1
Design report of the canister for nuclear fuel disposal Heikki Raiko VTTEnergy Jukka-Pekka Salo Posiva Oy December 1996 ISBN 951-652-012-X
POSIVA-96-14
POSIVA-96-15
POSIVA-96-16
POSIV A-96-17
POSIVA-96-18
POSIVA-96-19
POSIV A-96-20
LIST OF REPORTS 3 (4)
Final disposal of spent nuclear fuel in the Finnish bedrock, technical research and development in the period 1993-1996 Posiva Oy December 1996 (in Finnish) ISBN 951-652-013-8
The H yrkkoHi native copper mineralization as a natural analogue for copper canisters N uria Marc os Helsinki University of Technology Laboratory of Engineering Geology and Geophysics October 1996 ISBN 951-652-014-6
Final disposal of spent fuel in the Finnish bedrock, scope and requirements for site specific safety analysis Posiva Oy December 1996 (in Finnish) ISBN 951-652-015-4
Interim report on safety assessment of spent fuel disposal TILA-96 Timo Vieno, Henrik Nordman VTTEnergy December 1996 ISBN 951-652-016-2
Sorption of protactinium on rocks in ground waters from Posiva investigation sites Seija Kulmala, Martti Hakanen University of Helsinki Department of Chemistry Radiochemistry laboratory Antero Lindberg Geological Survey of Finland December 1996 ISBN 951-652-017-0
Final disposal of spent fuel in the Finnish bedrock, detailed site investigations 1993-1996 Posiva Oy December 1996 (in Finnish) ISBN 951-652-018-9
Suitability of Hastholmen Loviisa for final disposal of spent fuel -Preliminary study Posiva Oy December 1996 (in Finnish) ISBN 951-652-019-7
POSIVA-96-21
POSIV A-96-22
POSIV A-96-23
LIST OF REPORTS
Hydrogeochemistry of deep ground waters of mafic and ultramafic rocks in Finland
4 (4)
Timo Ruskeeniemi, Runar Blomqvist, Antero Lindberg, Lasse Ahonen Geological Survey of Finland Shaun Frape University of Waterloo December 1996 ISBN 951-652-020-0
Helium gas methods for rock characteristics and matrix diffusion Juhani Hartikainen, Kari Hartikainen University of JyvaskyHi, Department of Physics Aimo Hautojarvi VTTEnergy Kalle Kuoppamaki, Jussi Timonen University of Jyvaskyla, Department of Physics December 1996 ISBN 951-652-021-9
Sorption of cesium, radium, protactinium, uranium, neptunium and plutonium on Rapakivi granite Tuula Huitti Martti Hakanen University of Helsinki Antero Lindberg Geological Survey of Finland December 1996 ISBN-951-652-022-7


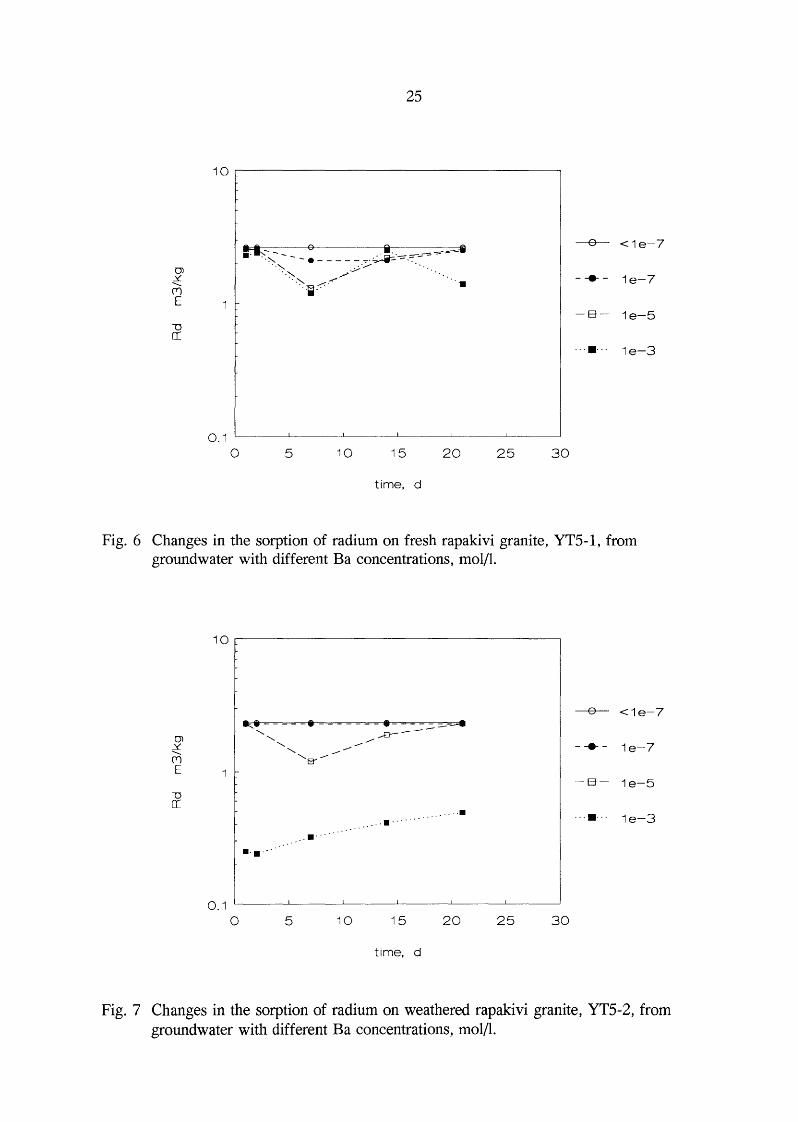
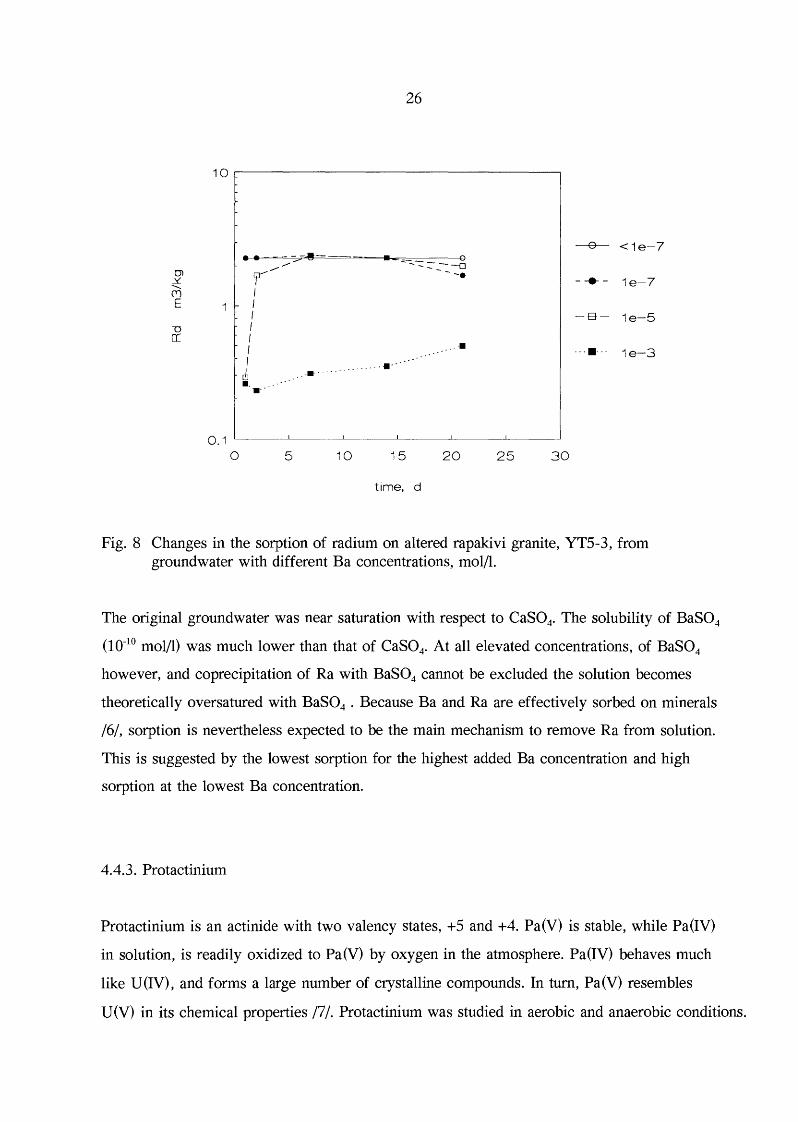
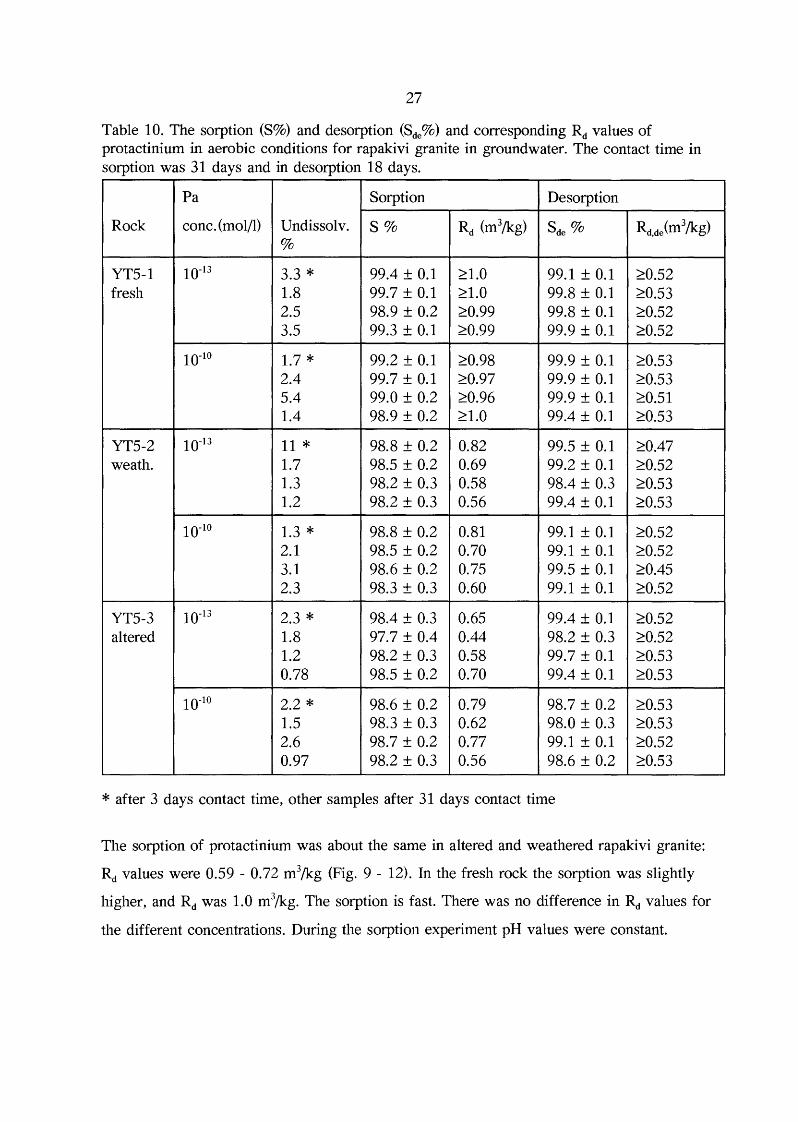
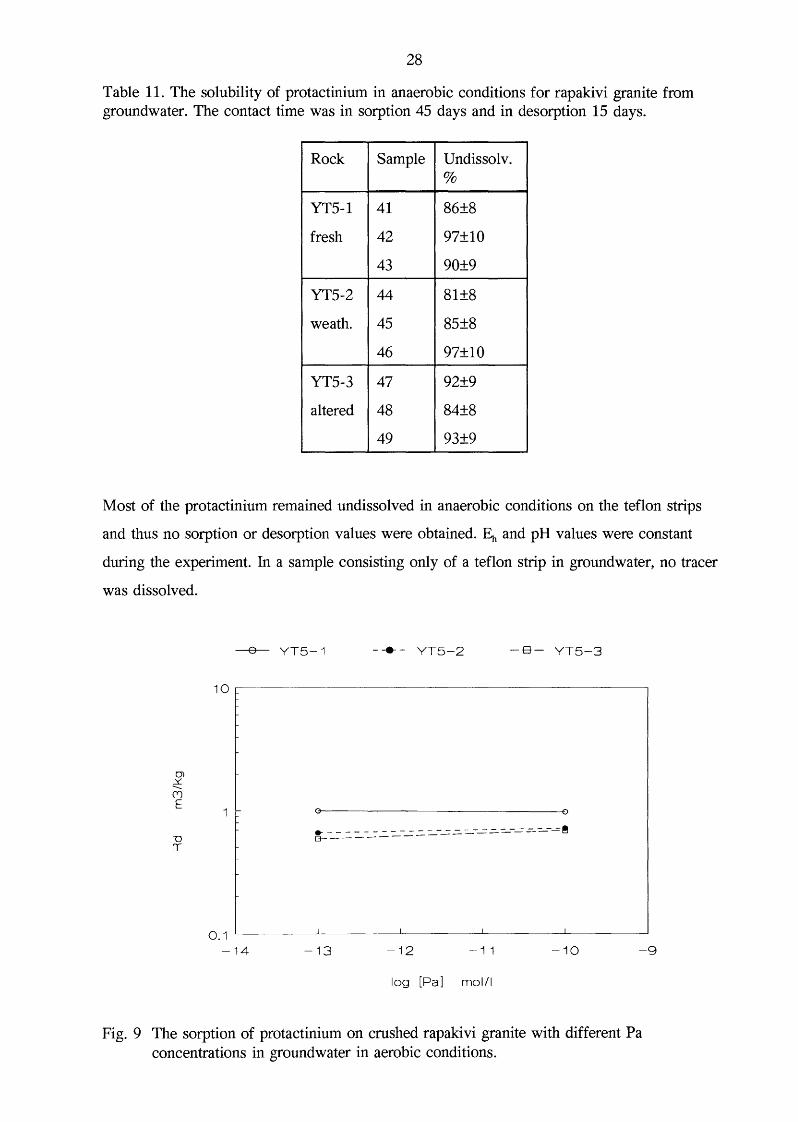

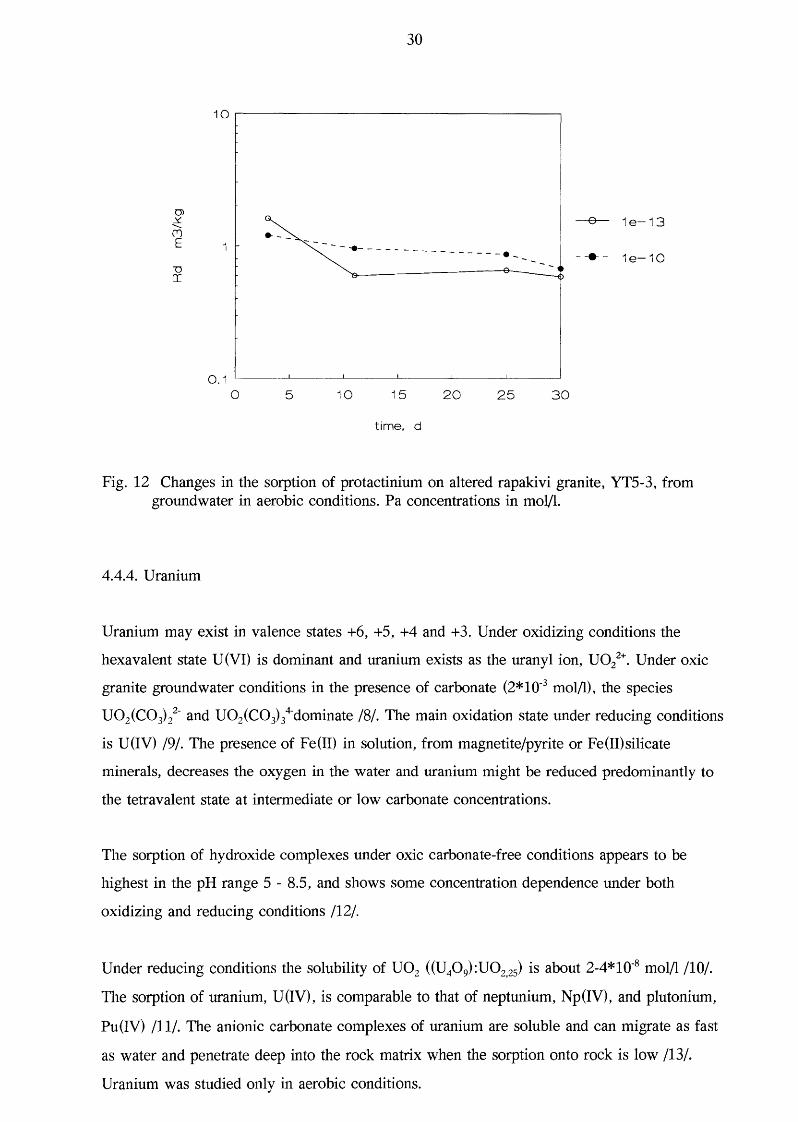


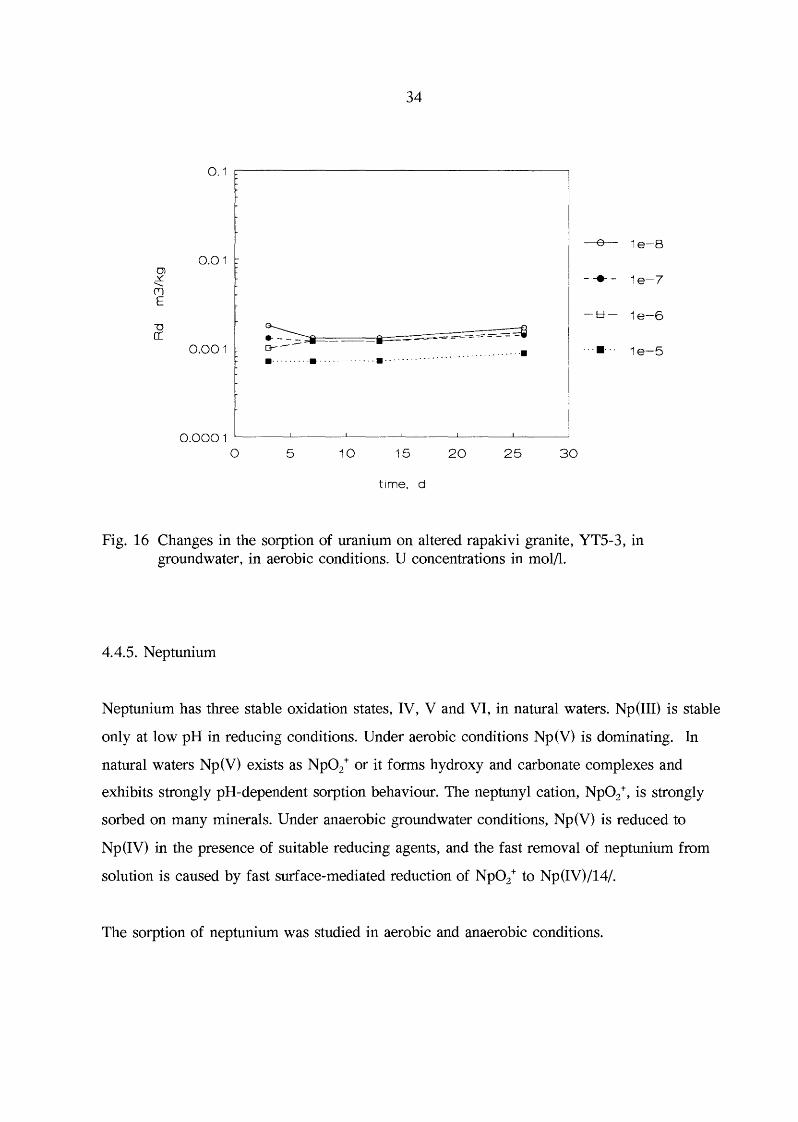

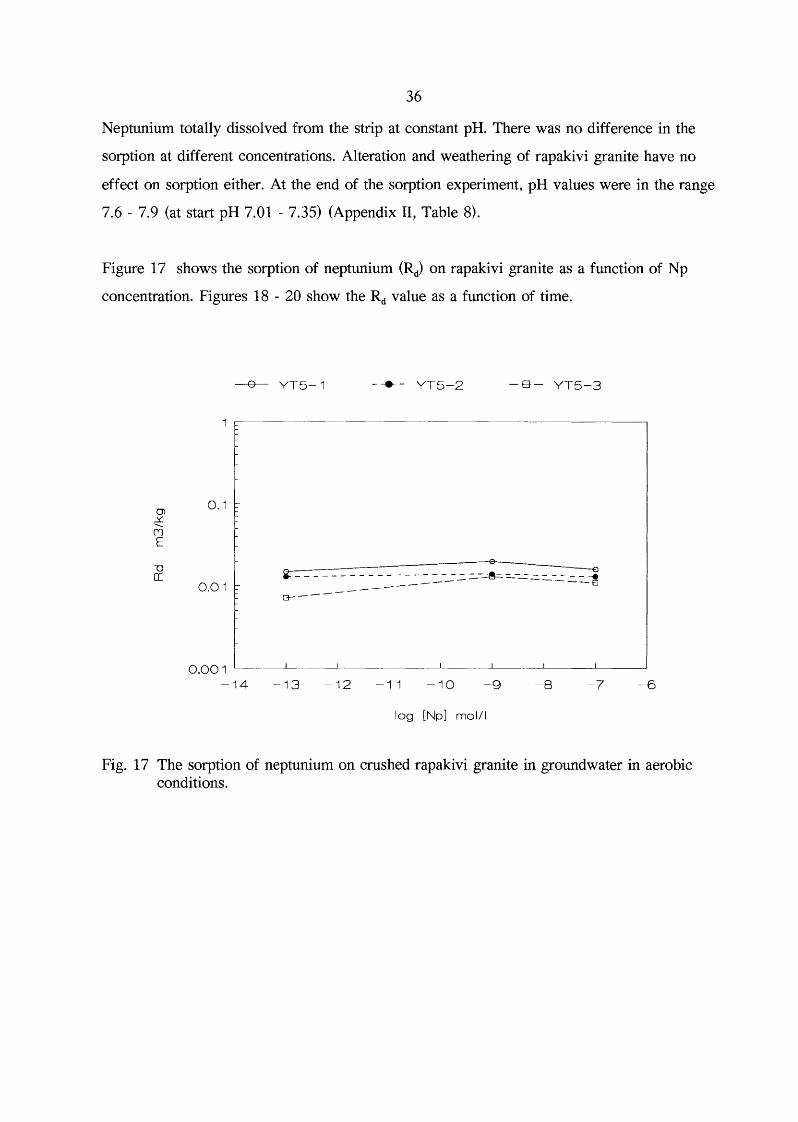

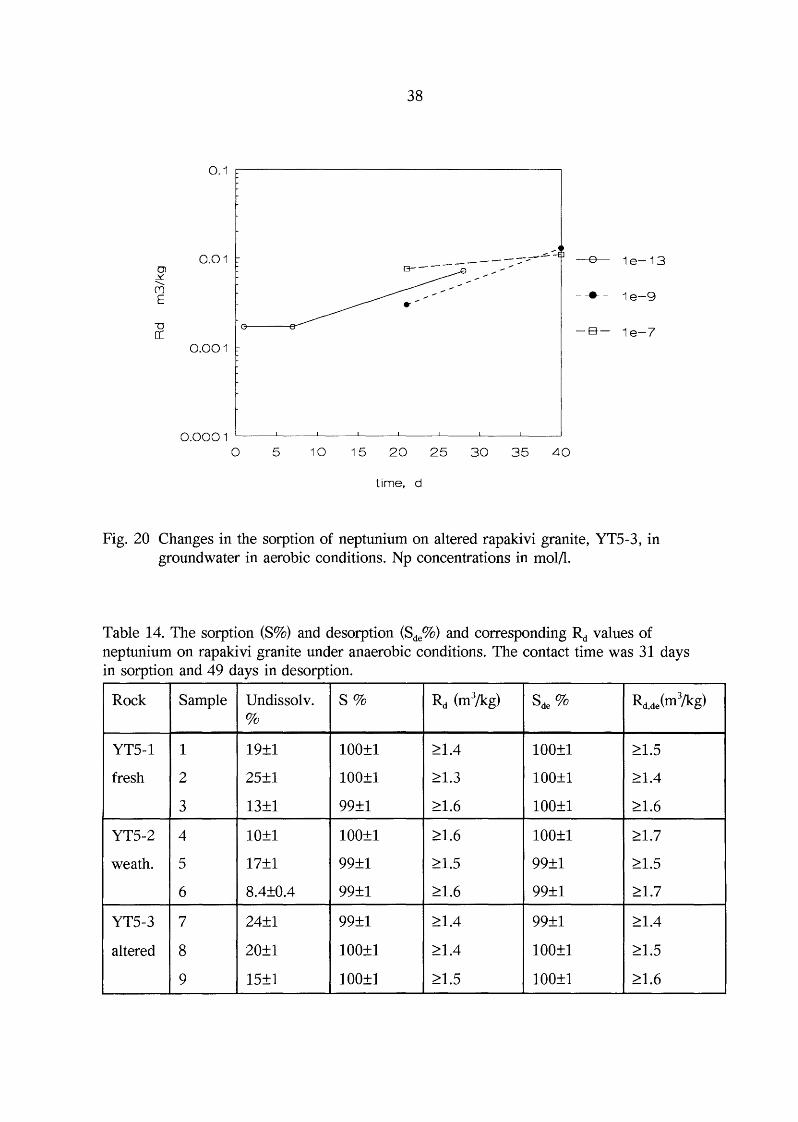
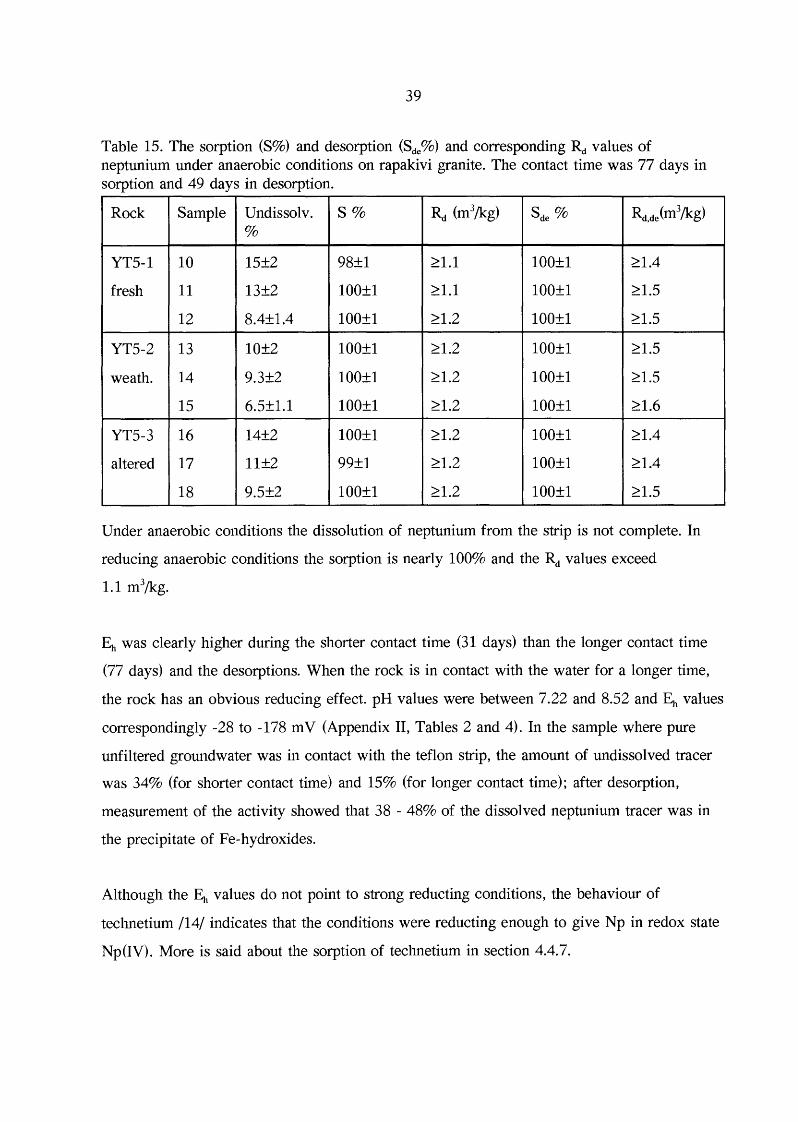

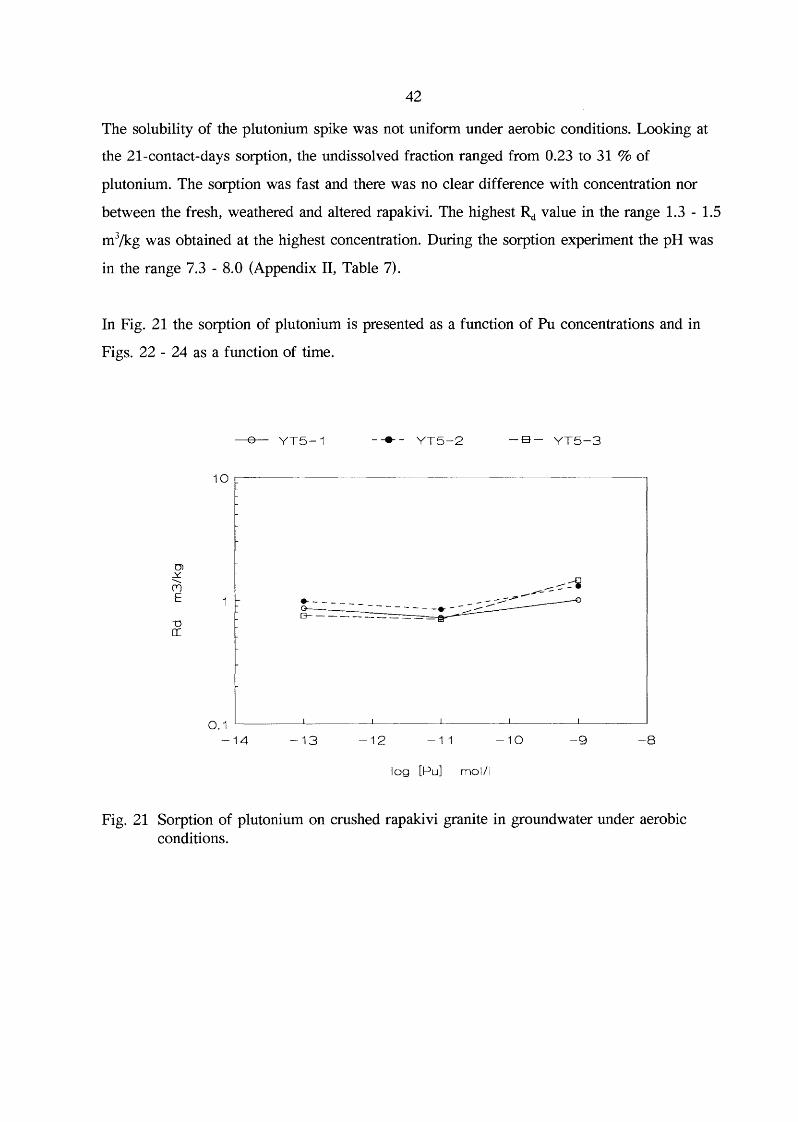
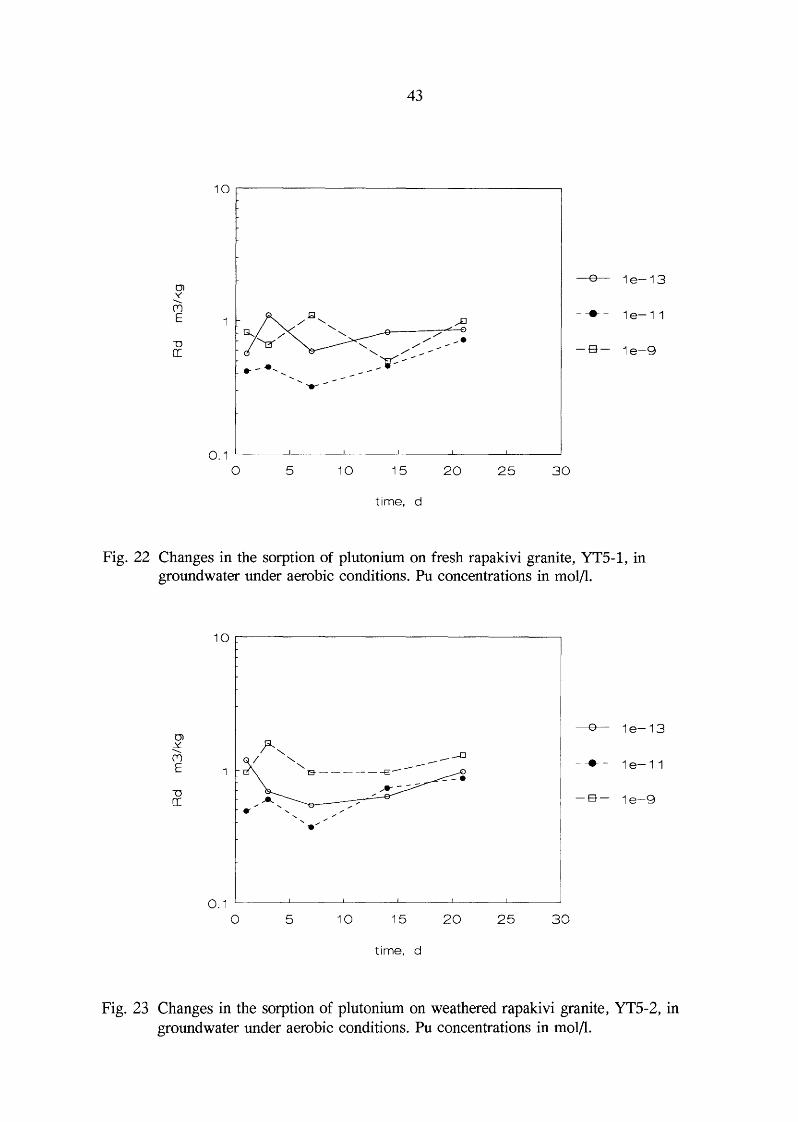
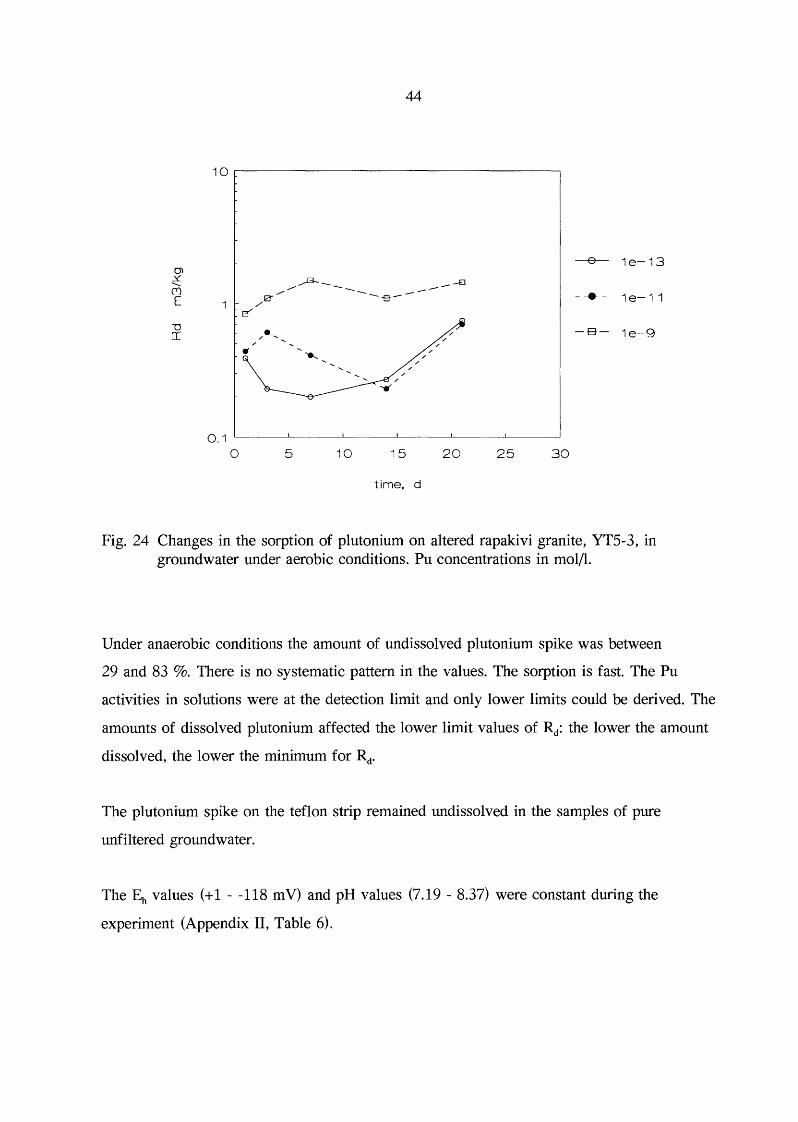

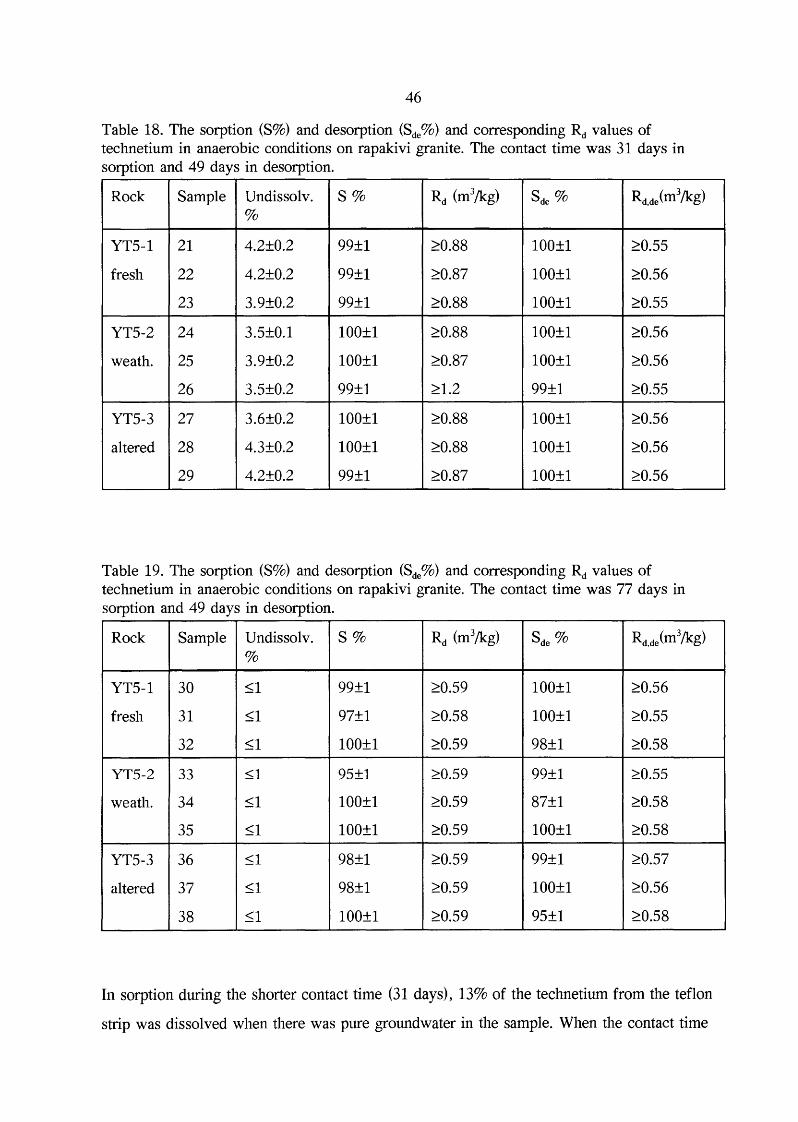


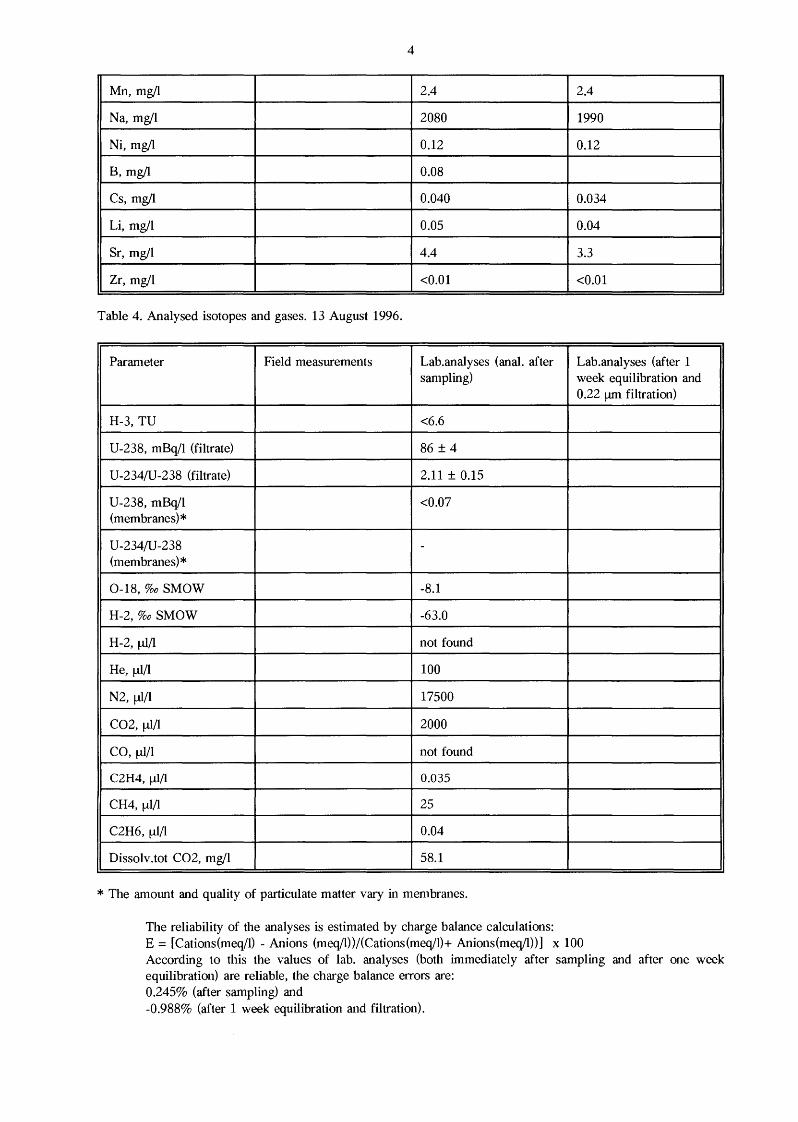

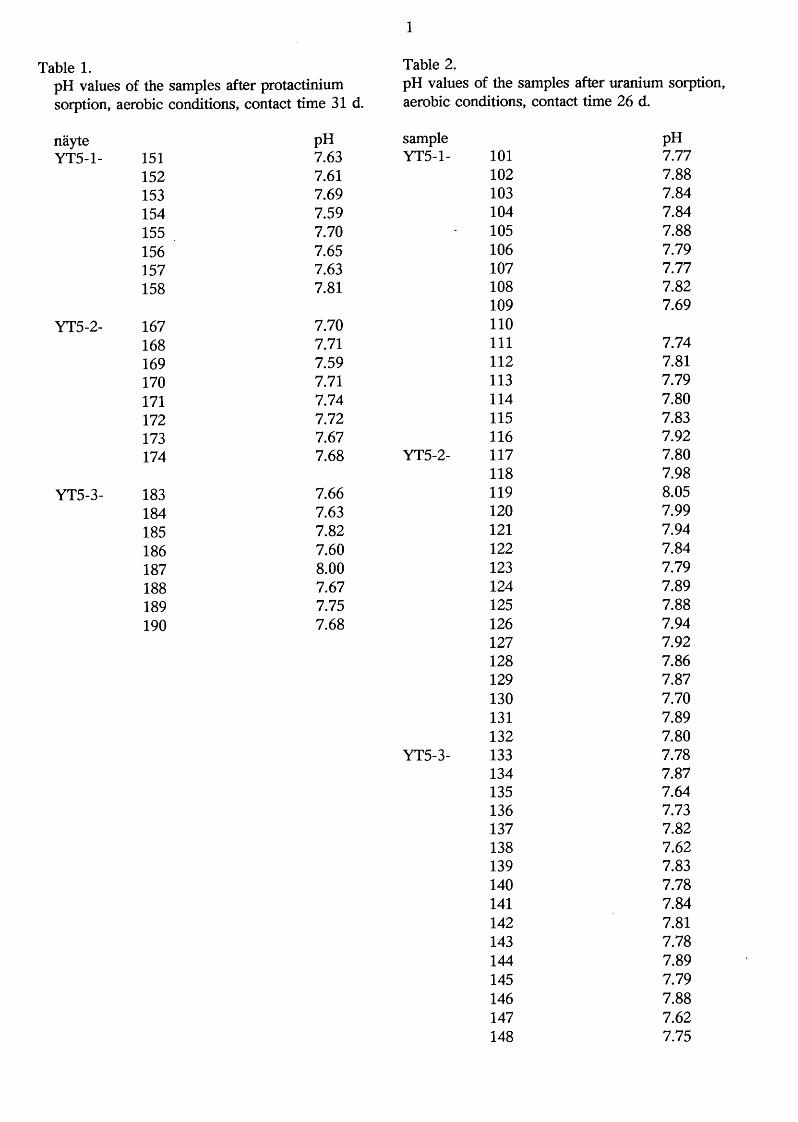


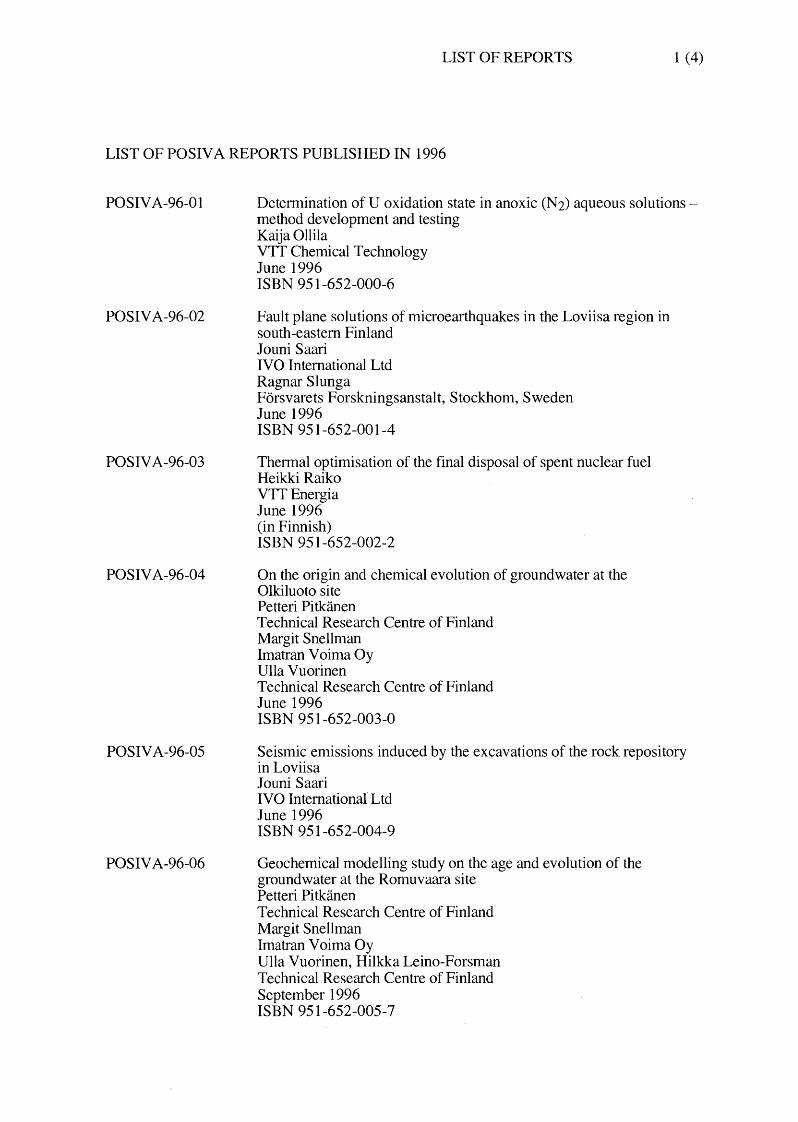
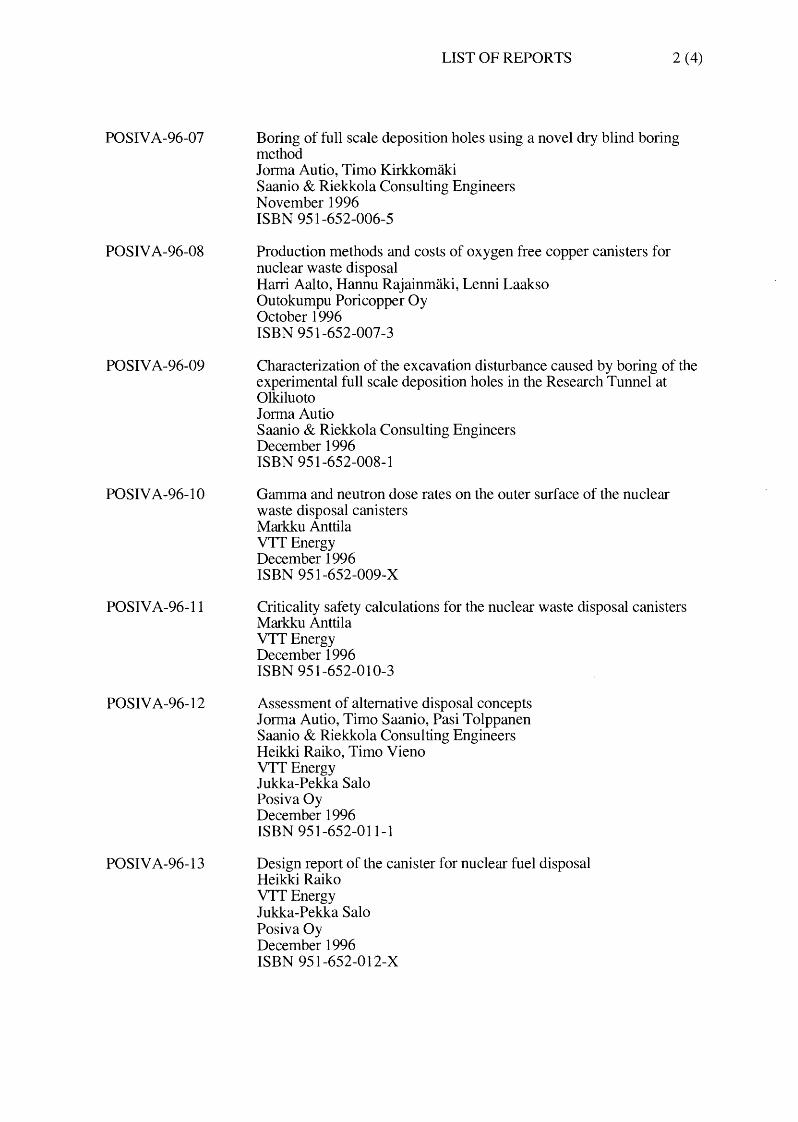


![Resort Municipality Initiative - Radium Hot Springs 2014 Annual RMI... · Resort nicipal Initiative Report for Year 2014 - Village of Radium Hot Springs - [1] Radium Resort Municipality](https://static.documents.pub/doc/80x56/5b880db67f8b9a3d028c72be/resort-municipality-initiative-radium-hot-2014-annual-rmi-resort-nicipal.jpg)


