30


Source: IRI/SPINS 52 MULO Grocery, Refrigerated, Frozen Weeks Ending 5/15/16
2
MARKETPLACE GROWTH

Millennials
Younger Consumer Market Influences
Gen Z
3

GENERATIONAL SIZES
Source: Pew Research Center, 2015
25%26% 21% 20%
8%
Source: US Census, July 2015
4

Gen Z(15 – 18)
Millennials at home
Millennials on own
Millennials w/children Gen X Boomers
Average Age 16.6 24.3 28.3 29.1 44.3 59.9
% Non-Caucasian 46% 27% 28% 27% 20% 17%
% Hispanic 25% 16% 13% 23% 15% 10%
% Married/LivingTogether/CU
7% 2% 35% 77% 71% 58%
AverageHousehold Size
4.0 3.3 1.8 3.9 2.9 2.2
% College Grad + 2% 22% 54% 37% 43% 44%
HH Income >$80K NA 10% 20% 25% 40% 40%
% EmployedFull-time
5% 27% 57% 43% 70% 40%
Millennials16. Qs S2, S7, S12, S14, S15, S16, S17, S18
Ethnicity/Cultural Heritage
DEMOGRAPHICS BY GENERATION
5
Source: THG Foodways Report 4.2016

MILLENNIALS
Ages 19 to 37
Live with
Parents
In College
On Their Own
Families
6

Nutrition Labels
Brands
Price & Proximity
Pantry Filling
Local
Digital
MILLENNIAL SHOPPERS
7
Source: THG Foodways Report 4.2016

Unborn
0-14
15-18
GEN Z
Ages Unborn (0) to 18
8

Current Living
Wired
Healthy Eating
Social Causes
Influential Generation
GEN Z SHOPPERS
9
Source: THG Foodways Report 4.2016

Shopping and home delivery
Easy shopping list creation
Recipe inspiration
Loyalty rewards
Coupons and specials
New product news
Ingredient lists
Nutrition details
REACHING THE YOUNGER CUSTOMER
10
Source: THG Foodways Report 4.2016

TRENDS
11

12
MACRO TRENDS IDENTIFIED IN MARKETPLACE
12

PERSONALIZED HEALTH & WELLNESS SERVICES DRIVES LOYALTY
13
Base: 1,914 internet users aged 18+ who shopped at a drug store in last 12 monthsSource: Lightspeed Mintel Drug Store Retailing February 2016

SHORT-TERM BENEFITS APPEAL TO YOUNGER CONSUMERS
14
Source: Mintel Vitamins, Minerals, & Supplements September 2015
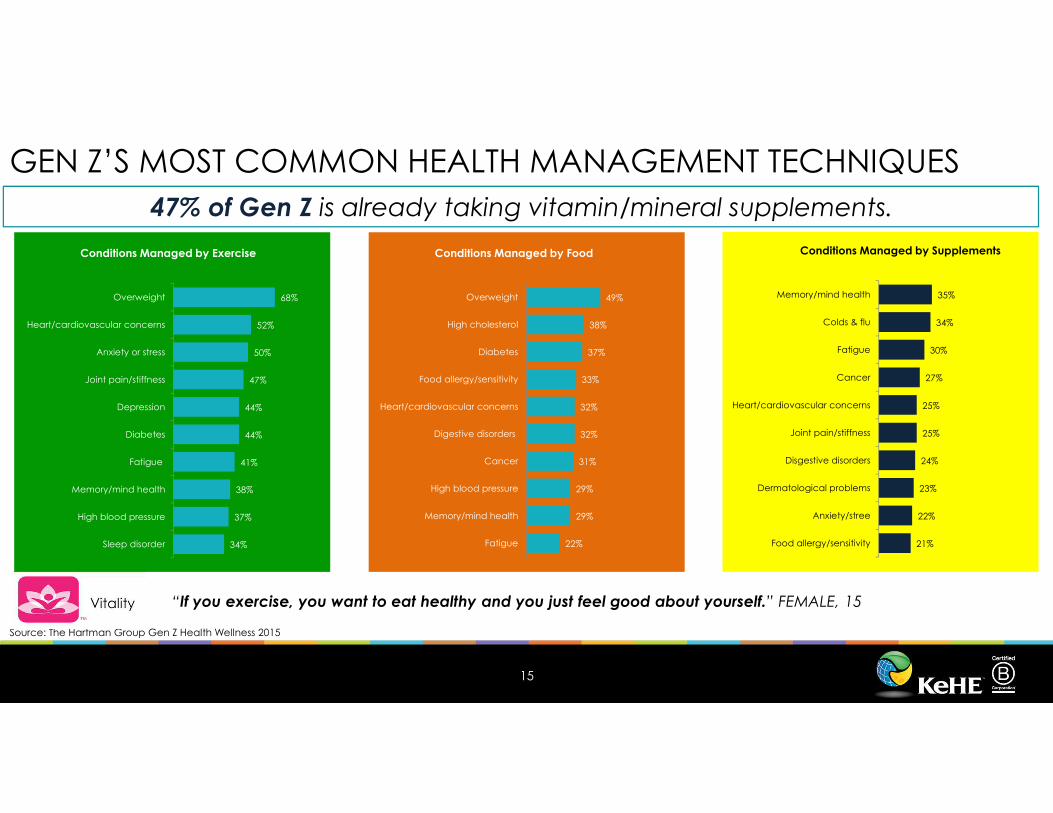
GEN Z’S MOST COMMON HEALTH MANAGEMENT TECHNIQUES
15
Source: The Hartman Group Gen Z Health Wellness 2015
68%
52%
50%
47%
44%
44%
41%
38%
37%
34%
Overweight
Heart/cardiovascular concerns
Anxiety or stress
Joint pain/stiffness
Depression
Diabetes
Fatigue
Memory/mind health
High blood pressure
Sleep disorder
Conditions Managed by Exercise
“If you exercise, you want to eat healthy and you just feel good about yourself.” FEMALE, 15
47% of Gen Z is already taking vitamin/mineral supplements.
49%
38%
37%
33%
32%
32%
31%
29%
29%
22%
Overweight
High cholesterol
Diabetes
Food allergy/sensitivity
Heart/cardiovascular concerns
Digestive disorders
Cancer
High blood pressure
Memory/mind health
Fatigue
Conditions Managed by Food
35%
34%
30%
27%
25%
25%
24%
23%
22%
21%
Memory/mind health
Colds & flu
Fatigue
Cancer
Heart/cardiovascular concerns
Joint pain/stiffness
Disgestive disorders
Dermatological problems
Anxiety/stree
Food allergy/sensitivity
Conditions Managed by Supplements
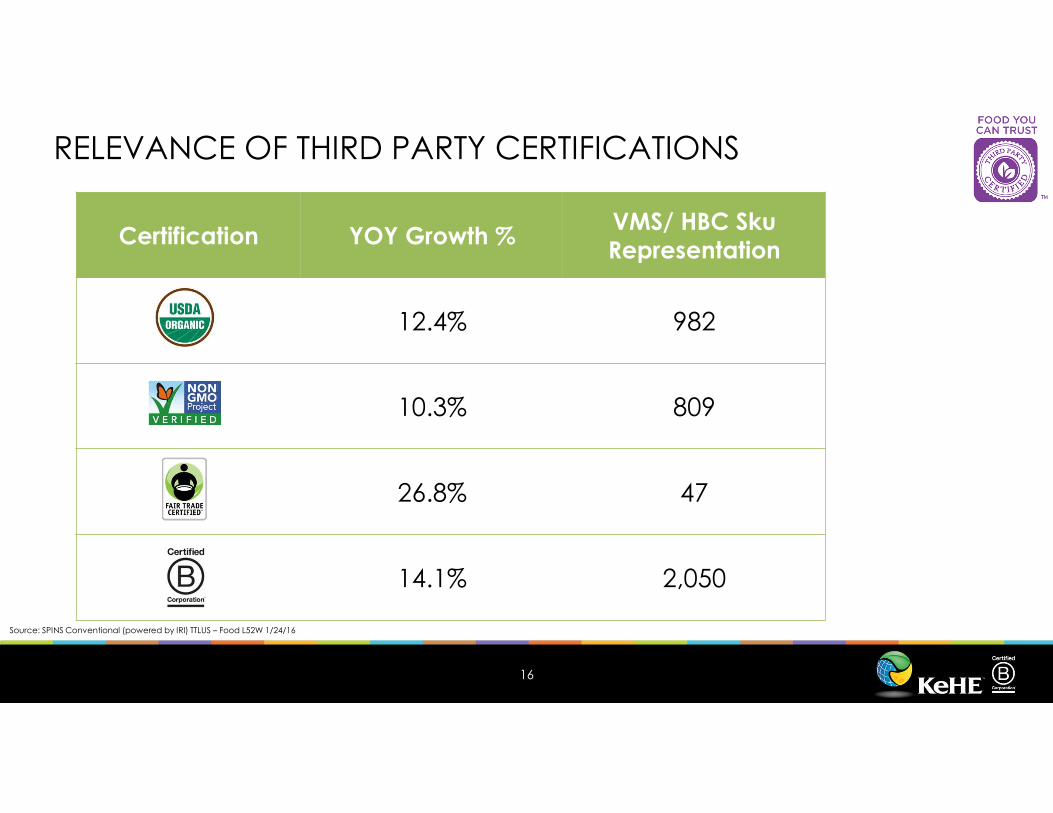
Certification YOY Growth %VMS/ HBC SkuRepresentation
12.4% 982
10.3% 809
26.8% 47
14.1% 2,050
16
RELEVANCE OF THIRD PARTY CERTIFICATIONS
Source: SPINS Conventional (powered by IRI) TTLUS – Food L52W 1/24/16
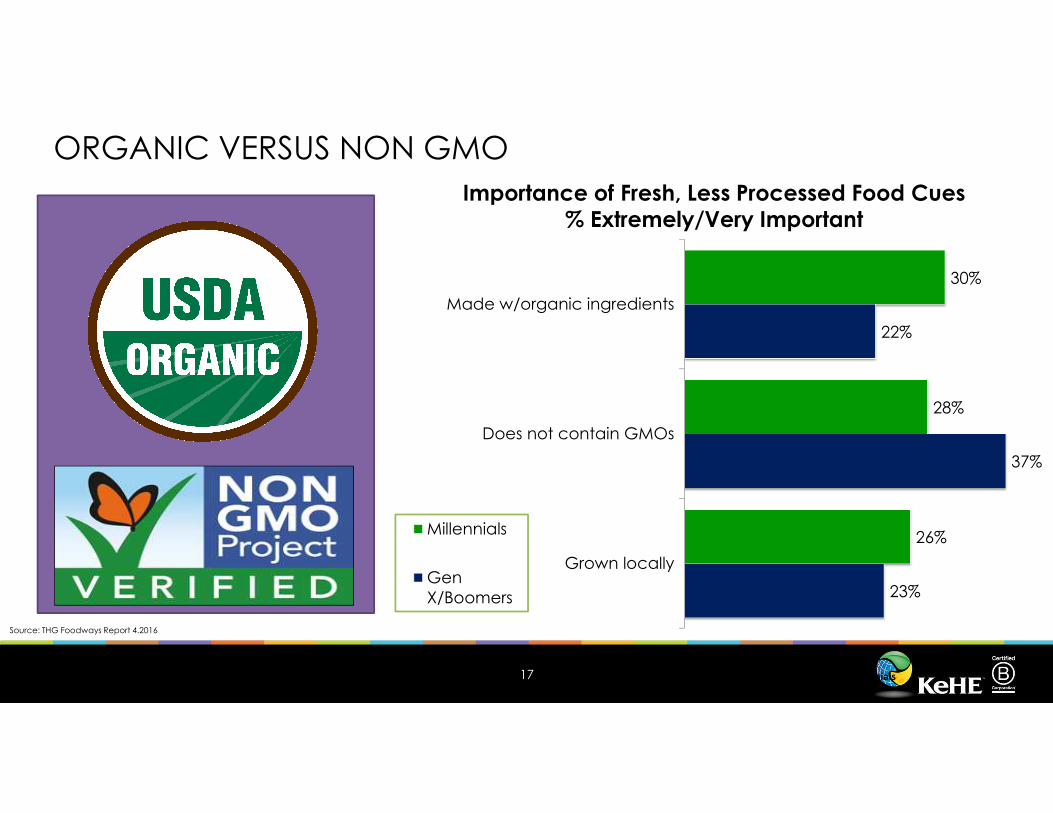
30%
28%
26%
22%
37%
23%
Made w/organic ingredients
Does not contain GMOs
Grown locally
Millennials
GenX/Boomers
Importance of Fresh, Less Processed Food Cues% Extremely/Very Important
Significantly different from Millennials
ORGANIC VERSUS NON GMO
17
Source: THG Foodways Report 4.2016

Trend Education Trend Data
Trend SpotlightTrend Implementation
HOT TREND: NON GMO
57% of consumers are unaware of the Non-GMO Seal• Feature an end cap solution for Non-GMO
month (October)• Execute through 4ft and 8ft planograms
available in public folders• Educate the consumer
FAQ Trifold
Rank Category UnitsUnit % Chg
Topline 2,288,382,816 8.8%
1 CHIPS PRETZELS & SNACKS 255,849,406 15.7%
2 REFRIGERATED NON-DAIRY BEVERAGES 239,649,816 5.8%
3 SHELF STABLE PASTAS 213,934,527 -3.9%
4 SWEETENERS 163,413,322 -1.8%
5 PACKAGED FRESH PRODUCE 158,709,509 31.4%
6 SHELF STABLE FRUITS & VEGETABLES 119,819,101 3.2%
7 REFRIGERATED JUICES & FUNCTIONAL BEVERAGES 106,272,589 32.1%
8 BEANS GRAINS & RICE 103,552,989 1.7%
9 COLD CEREALS 89,861,951 -1.1%
10 BABY FOOD 71,142,452 37.4%
Top 10 Categories by Unit Sales
Source: SPINS TPL L52W Ending 8/9/15
Natural & Conventional Channel +10%
“GMOs are organisms whose genetic material has been artificially manipulated in a laboratory through genetic engineering. This relatively new science creates unstable combinations of plant, animal, bacteria and viral genes that do not occur in nature or through traditional crossbreeding methods.”High Risk CropsAlfalfaCanolaPapayaZucchini & Yellow Summer Squash
SoySugar BeetsCorn
52% of consumers say they understand what GMOs are, yet less than one-third of
consumers say they know which crops are most likely to use GMO.
Source: Non- GMO Project Verified Organization & Mintel Natural Organic Report
Late JulySea Salt & Lime Madhava Honey
Sugar Coconut
Cascadian FarmGraham Crunch
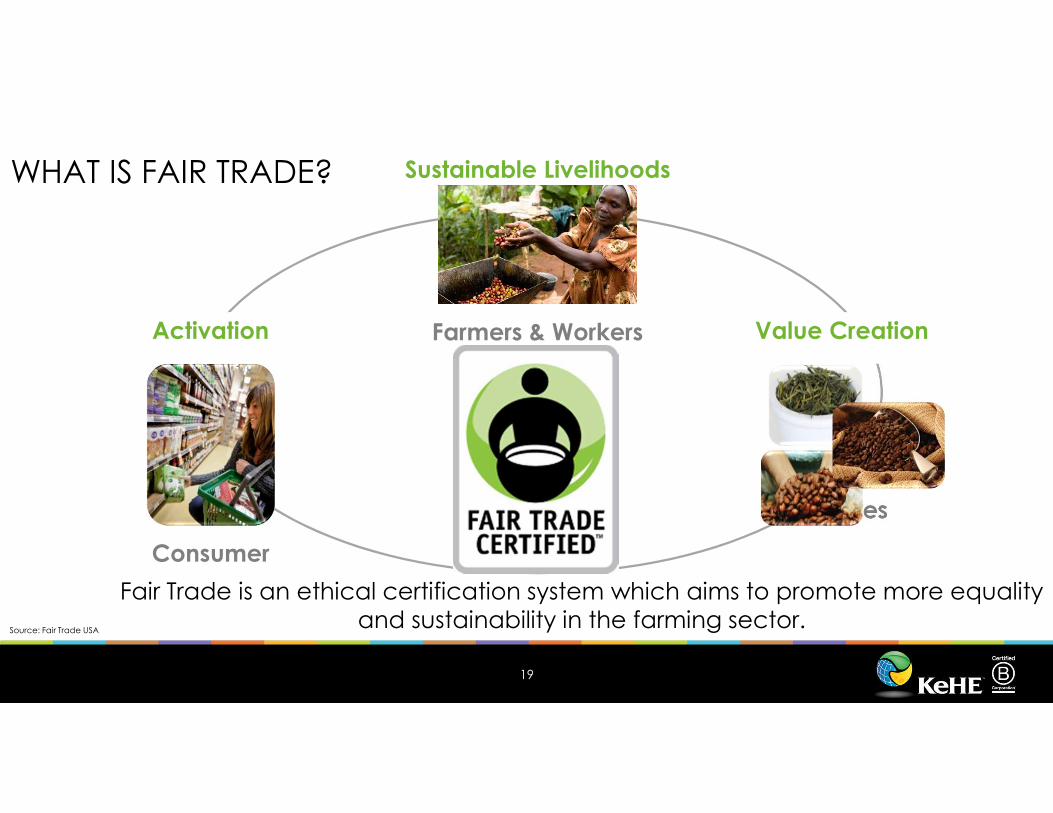
Businesses
Consumer
Farmers & Workers
Sustainable Livelihoods
Value CreationActivation
19
Fair Trade is an ethical certification system which aims to promote more equality and sustainability in the farming sector.
WHAT IS FAIR TRADE?
Source: Fair Trade USA
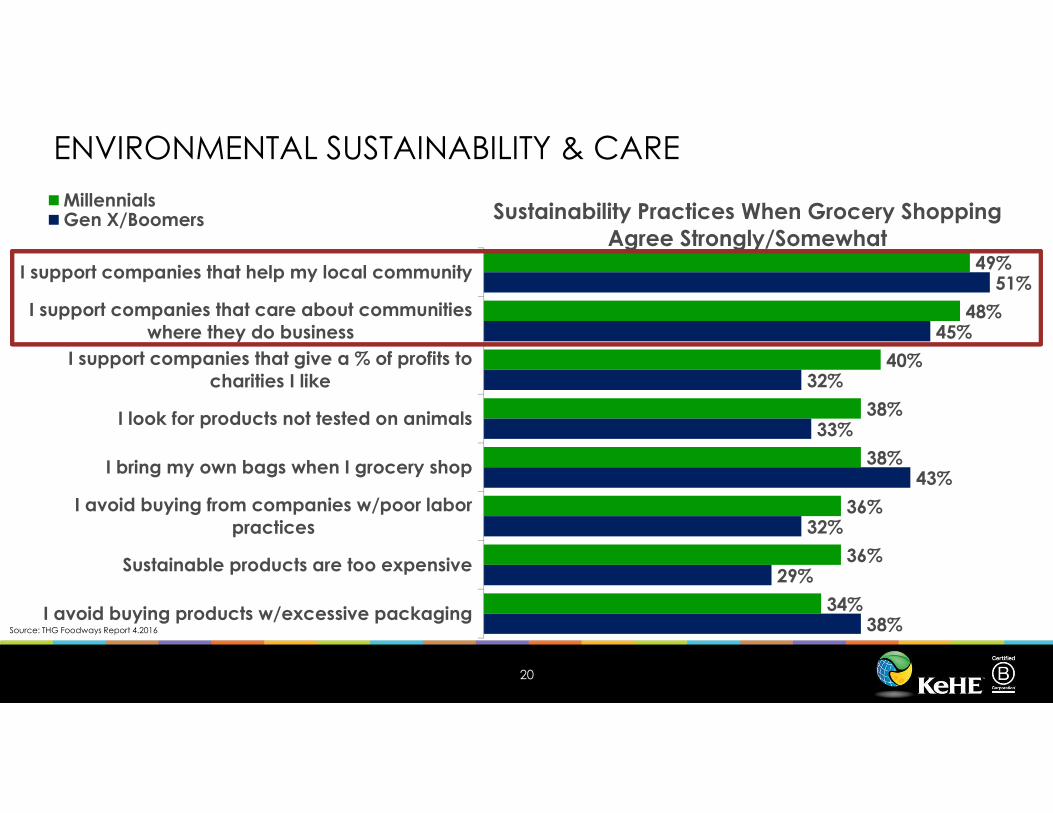
49%
48%
40%
38%
38%
36%
36%
34%
51%
45%
32%
33%
43%
32%
29%
38%
I support companies that help my local community
I support companies that care about communitieswhere they do business
I support companies that give a % of profits tocharities I like
I look for products not tested on animals
I bring my own bags when I grocery shop
I avoid buying from companies w/poor laborpractices
Sustainable products are too expensive
I avoid buying products w/excessive packaging
Sustainability Practices When Grocery ShoppingAgree Strongly/Somewhat
MillennialsGen X/Boomers
ENVIRONMENTAL SUSTAINABILITY & CARE
20
Source: THG Foodways Report 4.2016

Trend Education Trend Data
Trend SpotlightTrend Implementation
HOT TREND: FAIR TRADEFair Trade is a global trade model, and Fair Trade
certification allows shoppers to quickly identify products that were produced in an ethical manner.
For consumers, Fair Trade offers a powerful way to reduce poverty through their everyday shopping.
For farmers and workers in developing countries, Fair Trade offers better prices, improved terms of trade, and the business skills necessary to produce high-quality products that can compete in the global marketplace.
Globally, the Fair Trade network certifies coffee, tea and herbs, cocoa, fresh fruit and vegetables, sugar, beans and grains, flowers, nuts, oils and butters, honey and spices, wine and apparel. Source: www.FairTradeUSA.org
According to SPINS, the YOY dollar growth for Grocery products with a Fair Trade Claim or Fair Trade 3rd Party Certification was 12.8% for the US Food Channel.
Source: SPINS Total US Conventional TPL Grocery L52W ending 10-04-15
Point out Fair Trade products. Use shelf talkers and signage to highlight Fair Trade products. October is Fair Trade Month.
Provide KeHE’s Fair Trade National Planogram.
Educate the consumer on what Fair Trade means and why it is important. The Fair Trade USA website is a great place to start.
Wicked Joe Packaged Coffee
Endangered Species Chocolate
Wholesome Sweeteners

1,609 B Corporations
43 Countries
130 Industries
1 Unifying Goal
It’s a certification…
Like Fair Trade, but for the whole company that meets
the highest standards of verified performance,
transparency, and accountability.
It’s an approach…
For a better way to do business – better for workers,
communities and the environment.
It’s a community…
Of practice to increase our individual and collective
impact.
It’s a movement…
Of global leaders using business as a force for good.
22
WHAT IS A B-CORP?
Source: www.bcorporation.net

Source: Nielsen Global Corporate Social Responsibility Report June 2014
55% will pay extra for products from companies committed to sustainability
52% check packaging to ensure sustainable impact
52% purchased at least one product in the last 6 months from one or more socially responsible companies
23
CONSUMER BEHAVIOR

Trend Education Trend Data
Trend SpotlightTrend Implementation
HOT TREND: B CORPB Corp is to business what Fair Trade certification is to coffee or
USDA Organic certification is to milk.B Corps are for-profit companies certified by the nonprofit B Lab to
meet rigorous standards of social and environmental performance, accountability, and transparency.
B-Corp certified brands & products are up
L52W and are trending up L4W at
3 categories make up 30% of the B-Corp certified sales:
1) Vitamins & Minerals (+11.3%)2) Teas (+8.2%)3) Digestive Aids & Enzymes (+55.7%)
Source: SPINScan Natural TTL US L52W ending 1/24/2016
NutribladeWheatgrass
Bare FruitChips
Ethical Bean Coffee

ADDITIONAL TRENDS
25

Trend Education Trend Data
Trend SpotlightTrend Implementation
HOT TREND: BETTER BEV
Calories: 140Sugar: 39g
Calories: 0Sugar: 0g
The consumer shift away from full sugar and high calorie beverages are driving the surge in “better for you” beverages in both shelf stable and refrigerated formats.
All Better Bevs are growing!• Ref coconut & plant waters +22.9%
• Ref kombucha & fermented bev +16.9%• Ref rtd coffee & tea +73.4%• Shelf stable functional +17.2%• Soda (alternatively sweetened) +7.1% • Sports & isotonics +4.0%• Water +20.1%
Coconut Aloe Cactus Maple
Source: SPINScan Natural TTL US L52W ending 1/24/2016
Low Sugar Soda
Plant Water, Cold Pressed & HPP Kombucha
Energy, RTD Coffee & Tea
Flavored, Sparkling, Mineral, & Enhanced Water
Bucha LiveKombucha
GuruEnergy Beverage
WTRMLNJuice
RunaEnergy Drink

Trend Education Trend Data
Trend SpotlightTrend Implementation
HOT TREND: PLANT POWER
Flexitarianism is the act of conscious consumers cutting back on meat in their diet but still enjoying a good serving of animal protein when the timing is right
13% of consumers state that they
occasionally like to have a “meat-free”
day, such as “Meatless Mondays”
Source: FDA Report; Nutrition Business Journal 2015; Supermarket News; Mintel
60% of consumers believe they can obtain the necessary
amount of protein and nutrients from foods other than meat
90% 90%
88%
95%
Beef GroundTurkey
Pork Chops ChickenBreast
11% of meat alternative consumers are concerned with animal welfare
2 Door Refrigerated Meat & Cheese
Alternatives
Natural
Conventional
DaiyaCheddar Style Mac
Luna & Larry’s Coconut Bliss
OrgainPlant Based Powder

Trend Education Trend Data
Trend SpotlightTrend Implementation
HOT TREND: ALLERGEN FRIENDLY• 8 Common Allergens (+ Gluten Free)
• Allergy or Intolerance?o Food Allergy: exposure (even in trace amounts) produces
symptoms ranging from discomfort to life threatening.o Food Intolerance: may cause discomfort, but not life
threatening and immune system is not involved.• Opportunity is Increasing
o 1 in 50 (1990) → 1 in 9 (2016)o Food allergies and diets are becoming a way of life Source: Mintel
o Snack/Cereal/Energy Barso Sweet Biscuits/Cookieso Pastao Bread & Bread Products
8ft Allergen Friendly POG
o Establish relationships with food allergy groups
o Educational resources on shelves/shelf talkers
BeanfieldsBean & Rice Chips
Pico de GalloEnjoy Life
Pancake & Waffle Mix Bonavita
Elbow Pasta
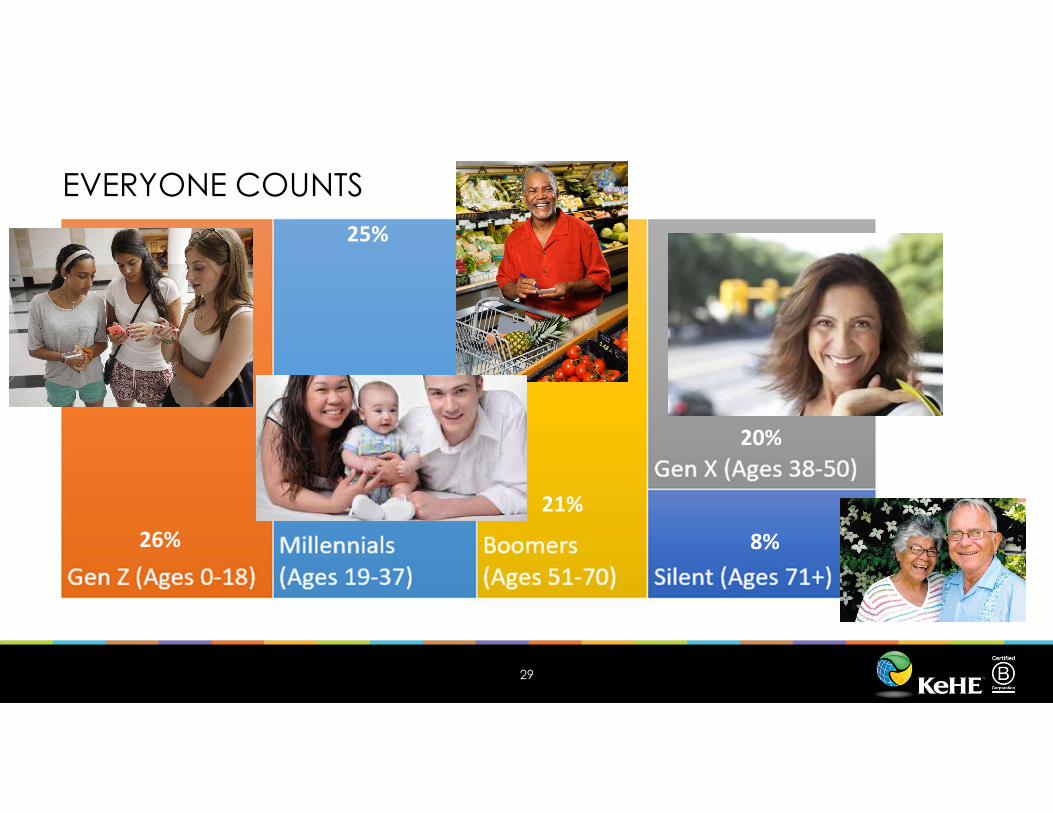
EVERYONE COUNTS25%
26%
21%
20%
8%
29

THANK YOU!
30
Lisa Burke l DirectorCustomer Insights & Growth Solutions


