SOURCE WATER ASSESSMENT AND PROTECTION REPORT Harford County Prepared by: Susquehanna River Basin Commission Watershed Assessment and Protection Program Contract Number: V00P1200457 This report was produced for the Maryland Department of Environment in accordance with the Source Water Assessment and Protection Plan May 30, 2003
Transcript
SOURCE WATER ASSESSMENT AND PROTECTION REPORT
Harford County
Prepared by: Susquehanna River Basin Commission
Watershed Assessment and Protection Program
Contract Number: V00P1200457
This report was produced for the Maryland Department of Environment
in accordance with the Source Water Assessment and Protection Plan
May 30, 2003
i
TABLE OF CONTENTS I. EXECUTIVE SUMMARY .................................................................................................... 1 II. INTRODUCTION .................................................................................................................. 2
A. Surface Water Source.......................................................................................................... 2 1. Description.................................................................................................................... 2 2. Political jurisdictions .................................................................................................... 2 3. Topography and climate................................................................................................ 4
B. Development of the Water Supply...................................................................................... 7 III. RESULT OF SITE VISITS ................................................................................................ 9
A. Intake Description............................................................................................................... 9 B. Operator Concerns .............................................................................................................. 9
IV. WATERSHED CHARACTERIZATION ........................................................................ 11 A. Source Water Assessment Area ........................................................................................ 11
1. Breakdown of subbasins ............................................................................................. 11 B. General Subbasin Characteristics...................................................................................... 11
1. Travel time information from subbasins to intake ...................................................... 14 C. Land Use Characteristics .................................................................................................. 18
1. Analysis of land use types for the assessment area..................................................... 18 2. Subbasin characteristics and trends............................................................................. 19
D. Localized Characteristics .................................................................................................. 21 1. Land ownership........................................................................................................... 21 2. Land use ...................................................................................................................... 21 3. Analysis of land use types........................................................................................... 22
E. Subwatersheds of Concern................................................................................................ 25 V. WATER QUALITY DATA.................................................................................................. 27
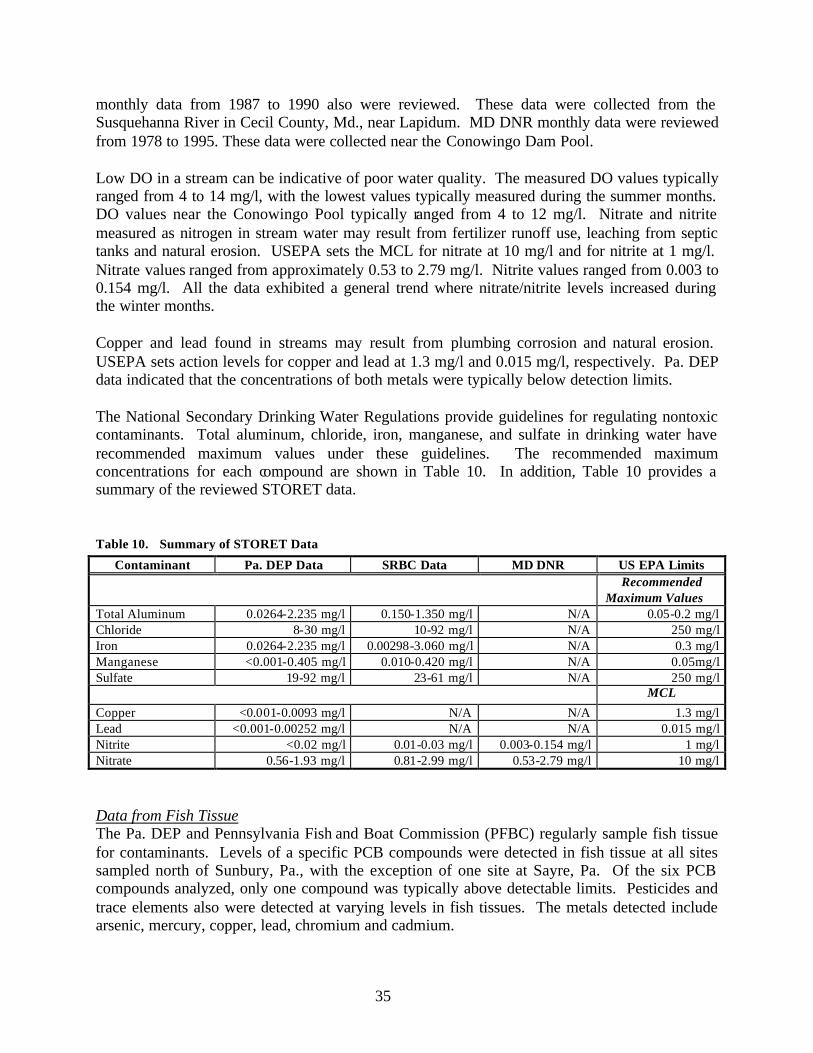
A. Review and Discussion of Existing Plant Data................................................................. 27 B. Review and Discussion of Current or Completed Studies in Watershed.......................... 28 C. Review and Discussion of Outside Sources of Data and Findings ................................... 34
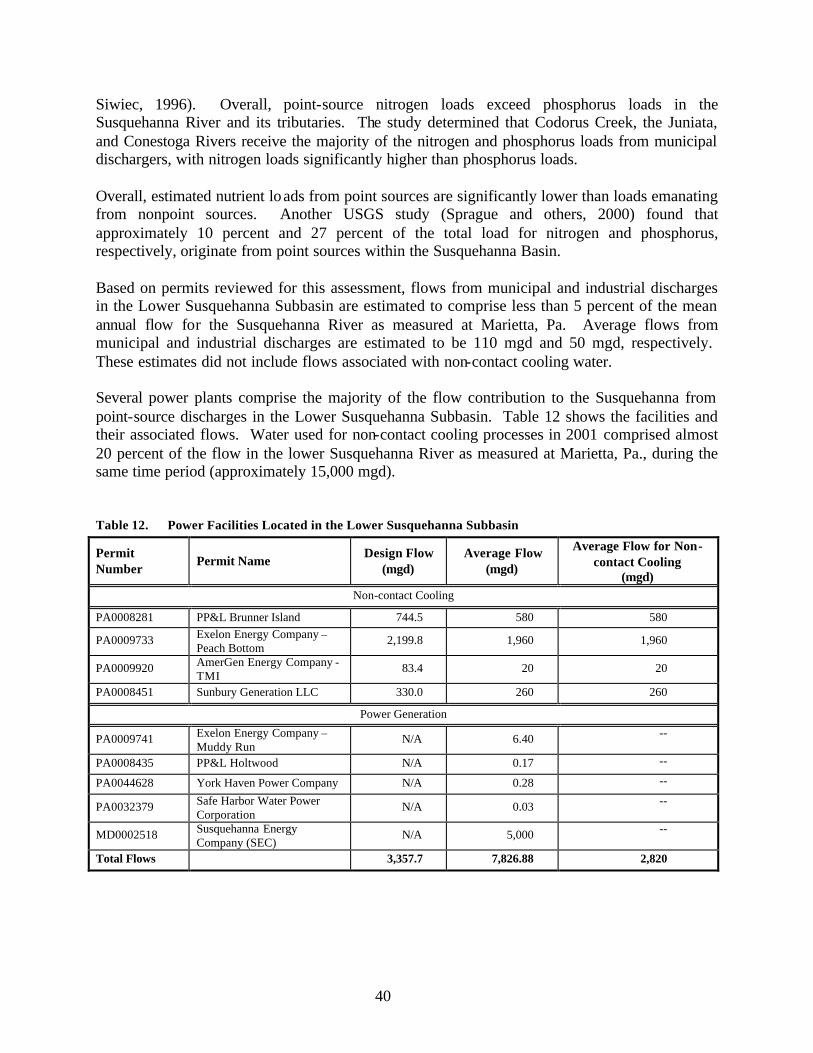
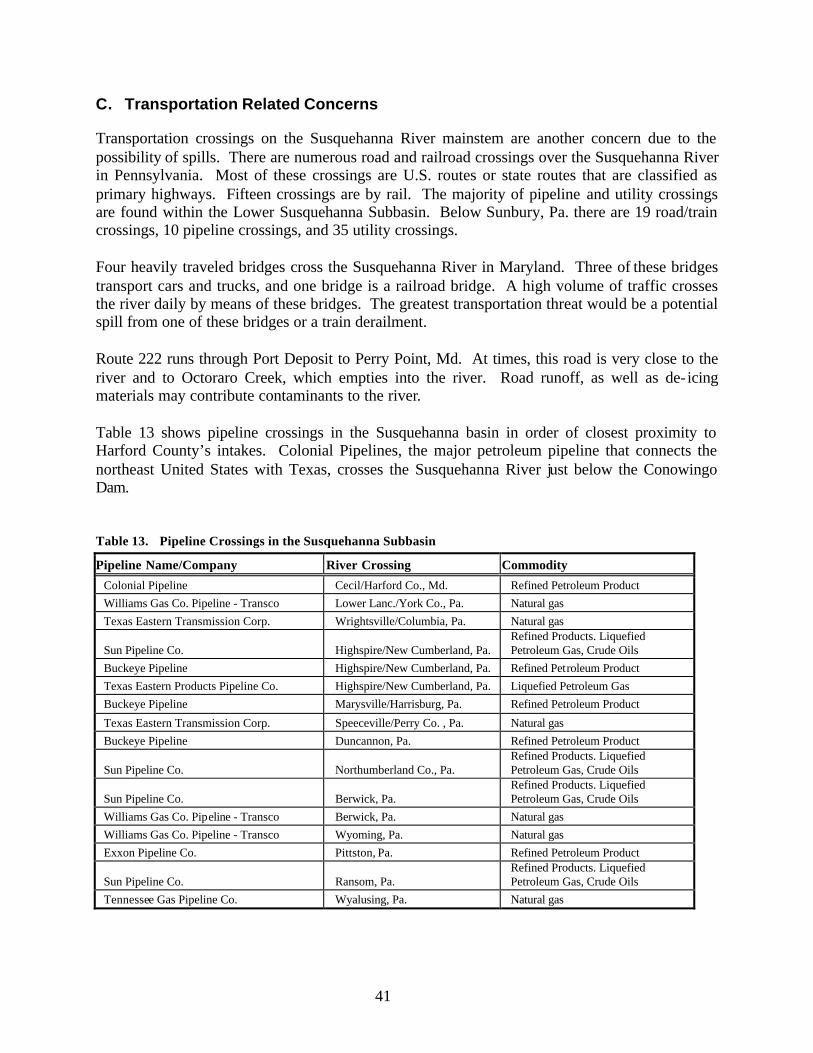
VI. SIGNIFICANT SOURCES OF CONTAMINATION ..................................................... 36 A. Nonpoint Source Concerns ............................................................................................... 36 B. Point Discharge Concerns ................................................................................................. 39 C. Transportation Related Concerns...................................................................................... 41 D. Land Use Planning Concerns ............................................................................................ 42
VII. SUSCEPTIBILITY ANALYSIS (FOR EACH CONTAMINANT CLASS)................... 44 A. Turbidity and Sediment ..................................................................................................... 44 B. Microbial Contaminants.................................................................................................... 44 C. Disinfection Byproducts ................................................................................................... 45 D. Inorganic Compounds....................................................................................................... 46 E. Volatile Organic Compounds and Synthetic Organic Compounds .................................. 47 F. Radionuclides.................................................................................................................... 47
VIII. RECOMMENDATION FOR SOURCE WATER PROTECTION PLAN ...................... 49 A. Increase Partne rships......................................................................................................... 49 B. Planning and Regulatory Activities .................................................................................. 49 C. Public Education and Outreach......................................................................................... 50 D. Monitoring ........................................................................................................................ 51
ii
E. Availability of the Assessment ......................................................................................... 51 REFERENCES ............................................................................................................................. 53
TABLES
Table 1. Annual Water Discharge, Calendar Year 2001............................................................2 Table 2. Summary for Annual Precipitation for Selected Areas in the Susquehanna River
Basin, Calendar Year 2001 ..........................................................................................7 Table 3. Time-of-Travel Information from Selected Locations in the Susquehanna River
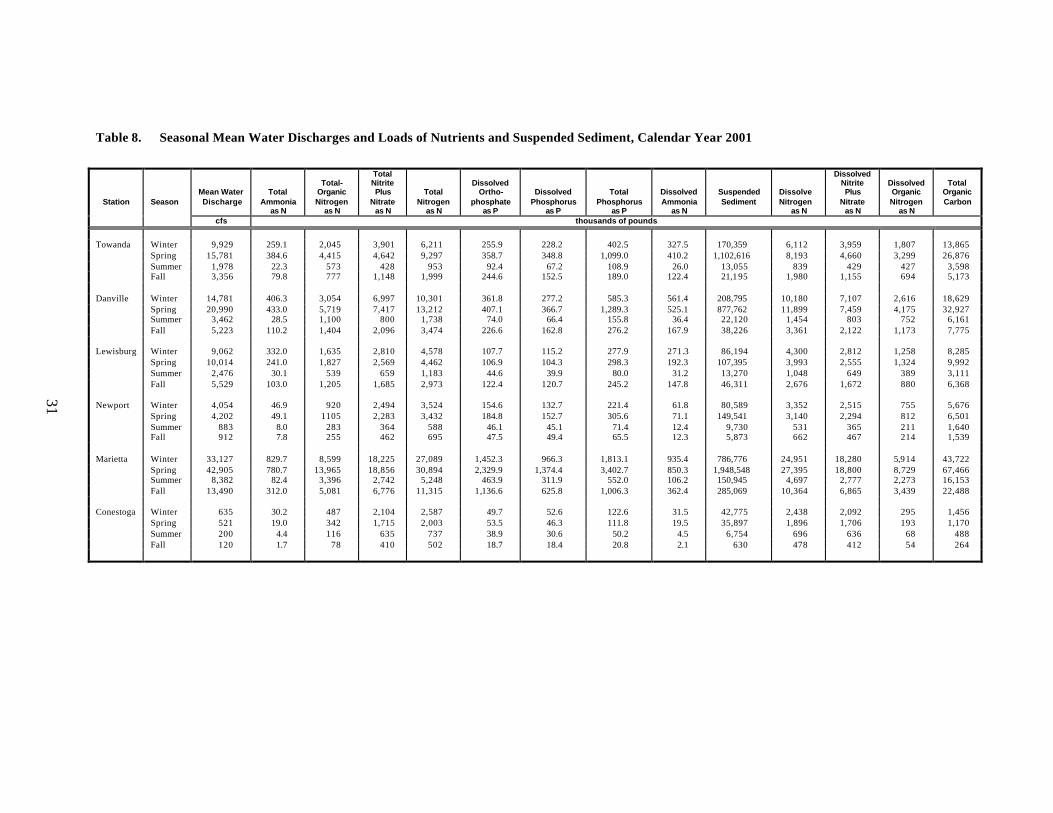
Basin...........................................................................................................................15 Table 4. Summary of Dye Trace Study Results at the Harford County’s Intakes ...................17 Table 5. Land Use for Major Subbasins in the Susquehanna River Basin ..............................18 Table 6. Land Use in the Susquehanna River Basin in Maryland ...........................................22 Table 7. Disinfection Byproducts Detected in the Distribution System during 2002..............28 Table 8. Seasonal Mean Water Discharges and Loads of Nutrients and Suspended Sediment,
Calendar Year 2001 ...................................................................................................31 Table 9. Organic Contaminants Detected at Conowingo Dam, 1994 ......................................33 Table 10. Summary of STORET Data .......................................................................................35 Table 11. Summary of Stream Assessments in the Susquehanna Basin....................................36 Table 12. Power Facilities Located in the Lower Susquehanna Subbasin.................................40 Table 13. Pipeline Crossings in the Susquehanna Subbasin ......................................................41
FIGURES
Figure 1. Location Map for the Susquehanna River Basin .......................................................... 3 Figure 2. Physiographic Provinces in the Susquehanna River Basin........................................... 5 Figure 3. Daily Turbidity Values at the Harford County Water Treatment Plant During 1996 10 Figure 4. Source Assessment Delineation Area ......................................................................... 12 Figure 5. Major Subbasins in the Susquehanna River Basin ..................................................... 13 Figure 6. Locations Used for time-of-Travel Estimates ............................................................. 16 Figure 7. Land Use in the Susquehanna River Basin. ................................................................ 19 Figure 8. Localized Land Use Pie Chart .................................................................................... 23 Figure 9. Map of Land Use in the Lower Susquehanna Subbasin in Maryland ..........................24 Figure 10. Animal Biomass Index for the Pennsylvania Portion of the Lower Susquehanna
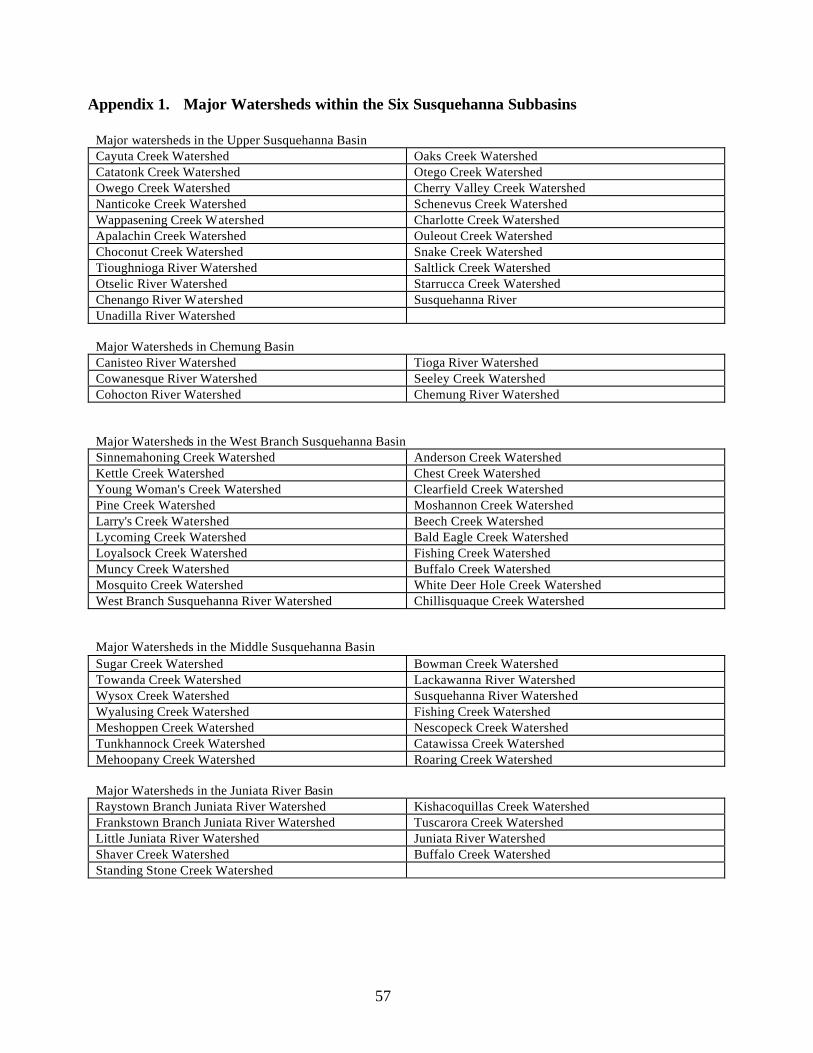
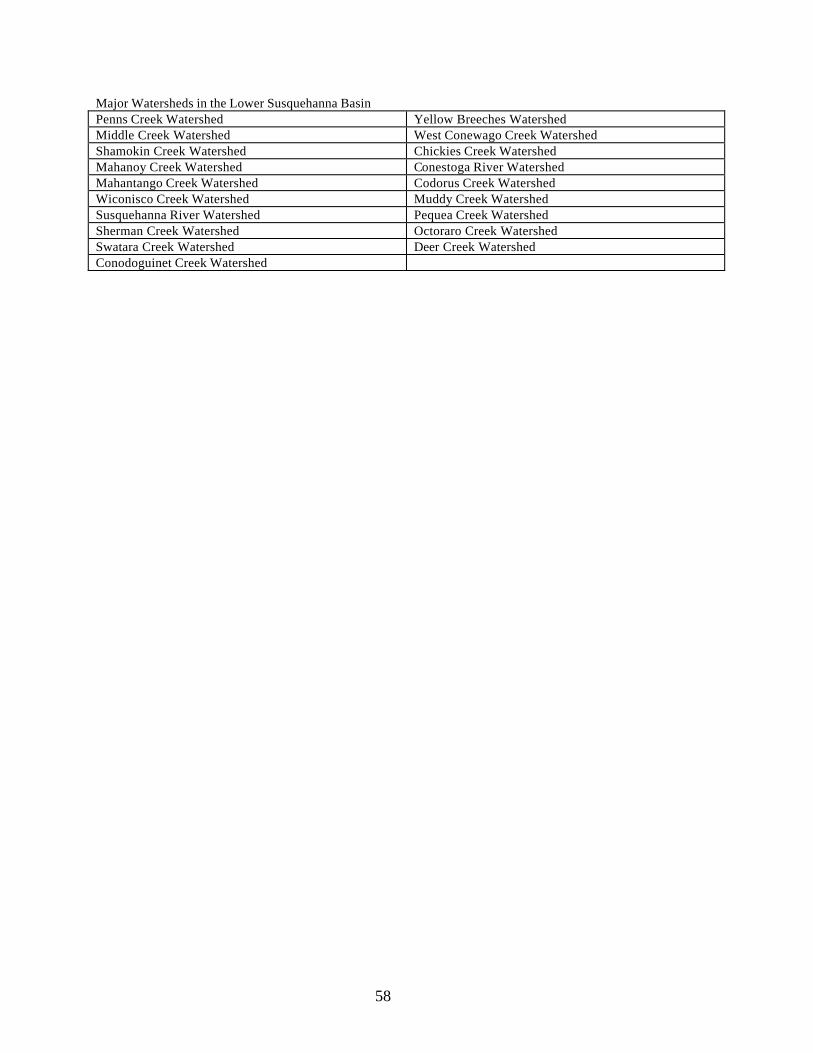
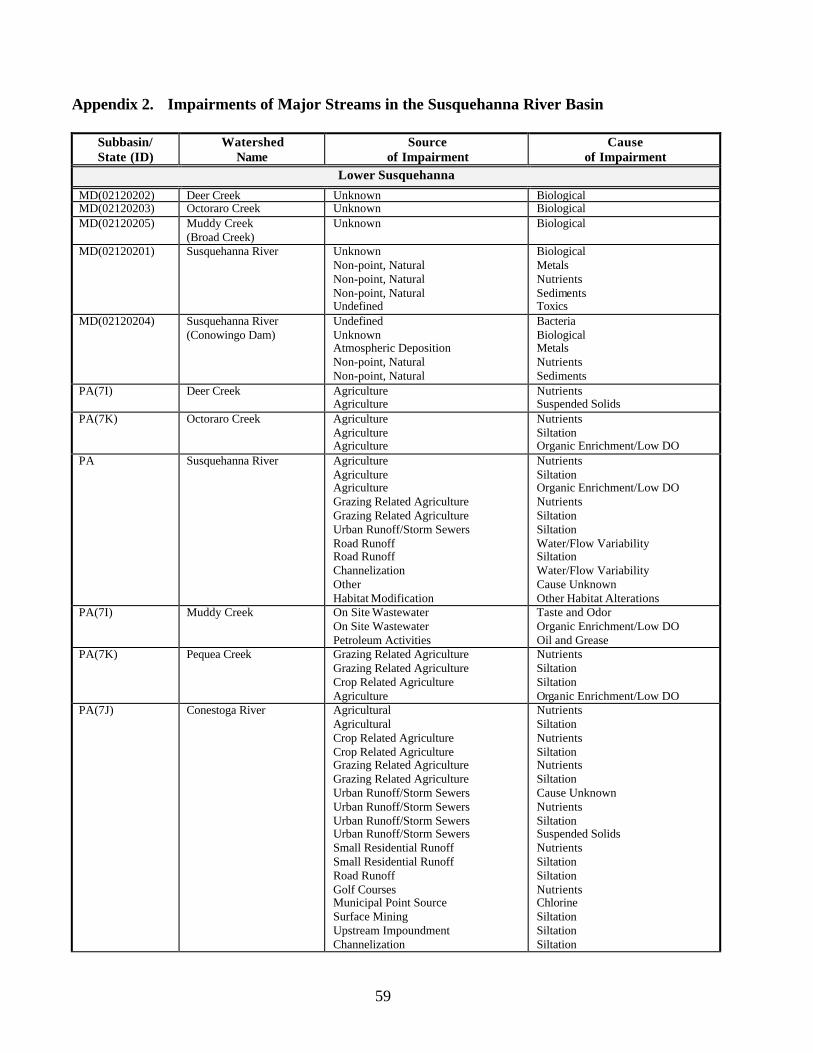
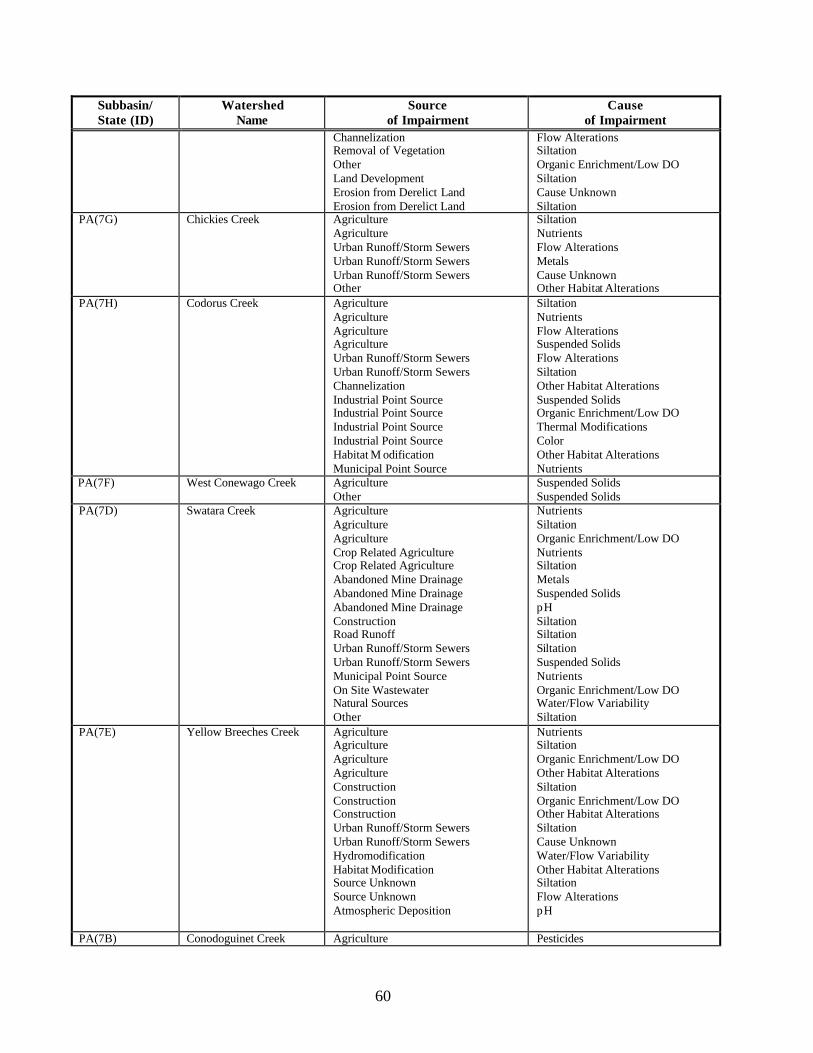
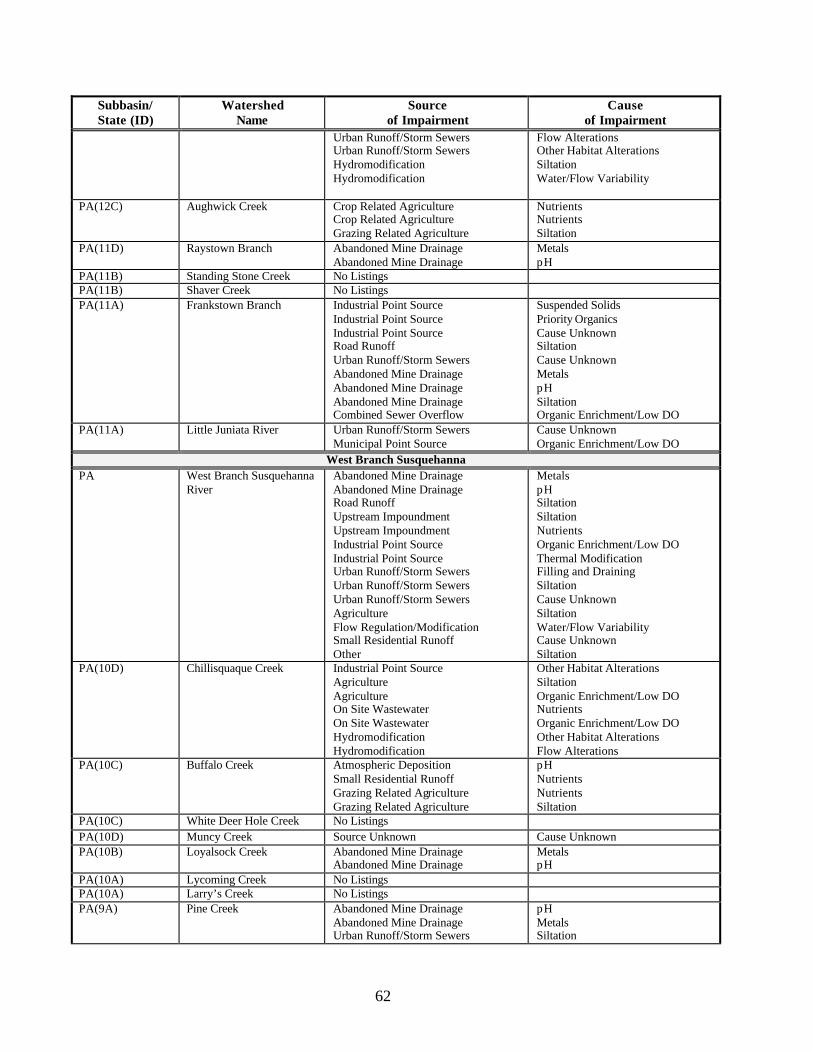
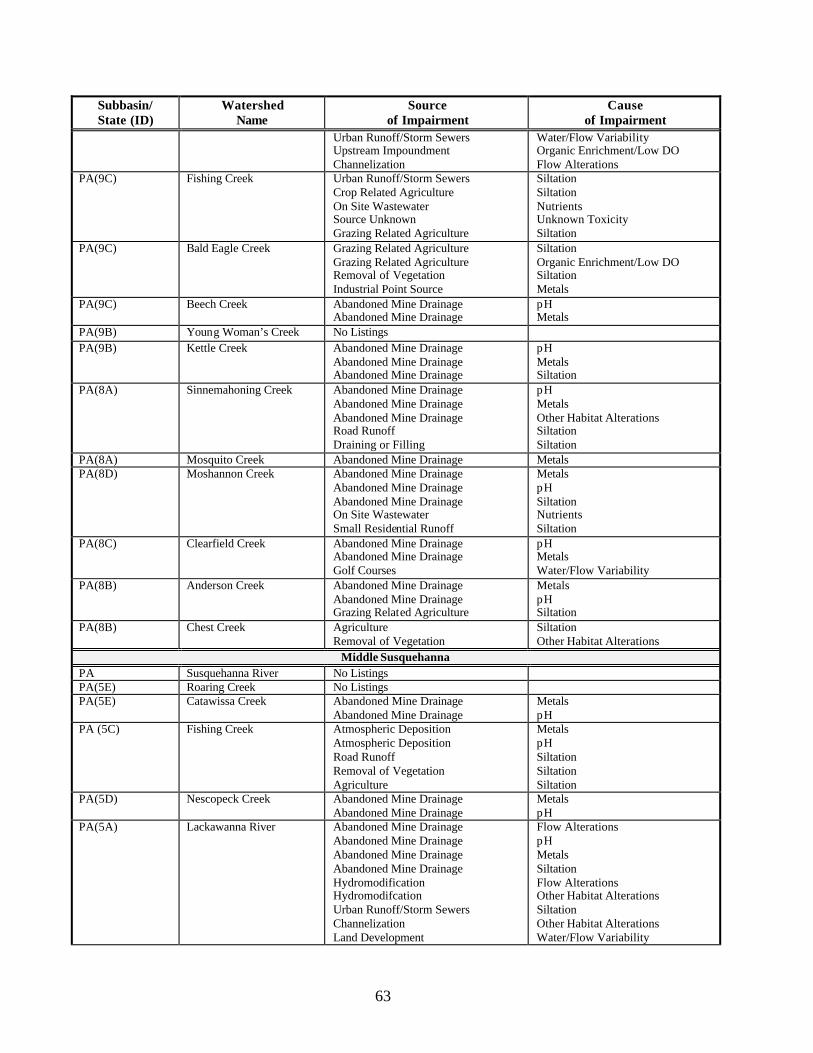
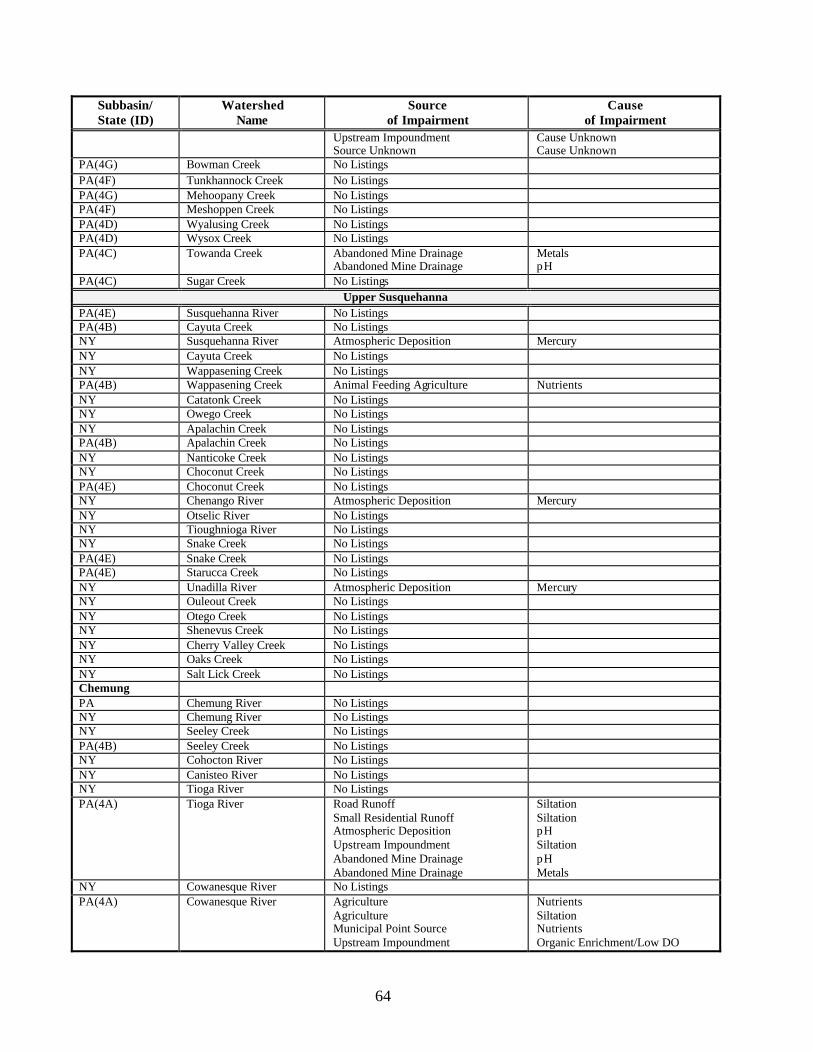
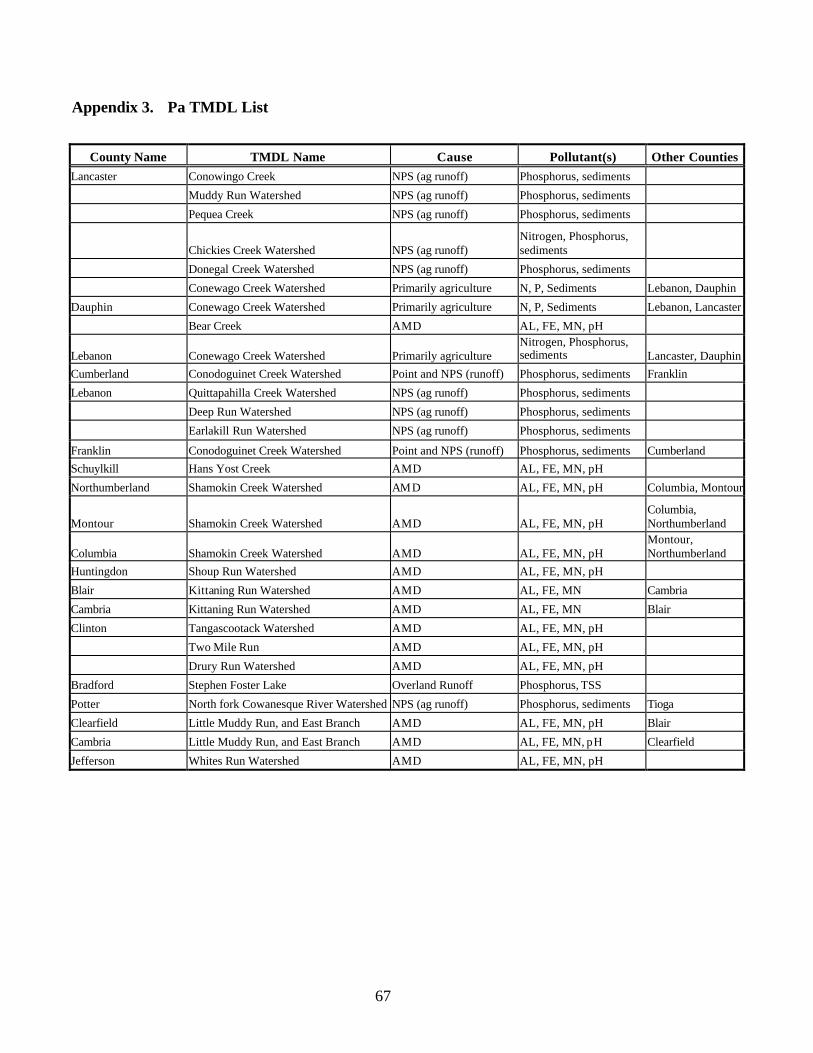
Appendix 1. Major Watersheds within the Six Susquehanna Subbasins ...................................57 Appendix 2. Impairments of Major Streams in the Susquehanna River Basin ..........................59 Appendix 3. Pa TMDL List ........................................................................................................67 Appendix 4. Large Format Map Attachments ............................................................................69
1
I. EXECUTIVE SUMMARY
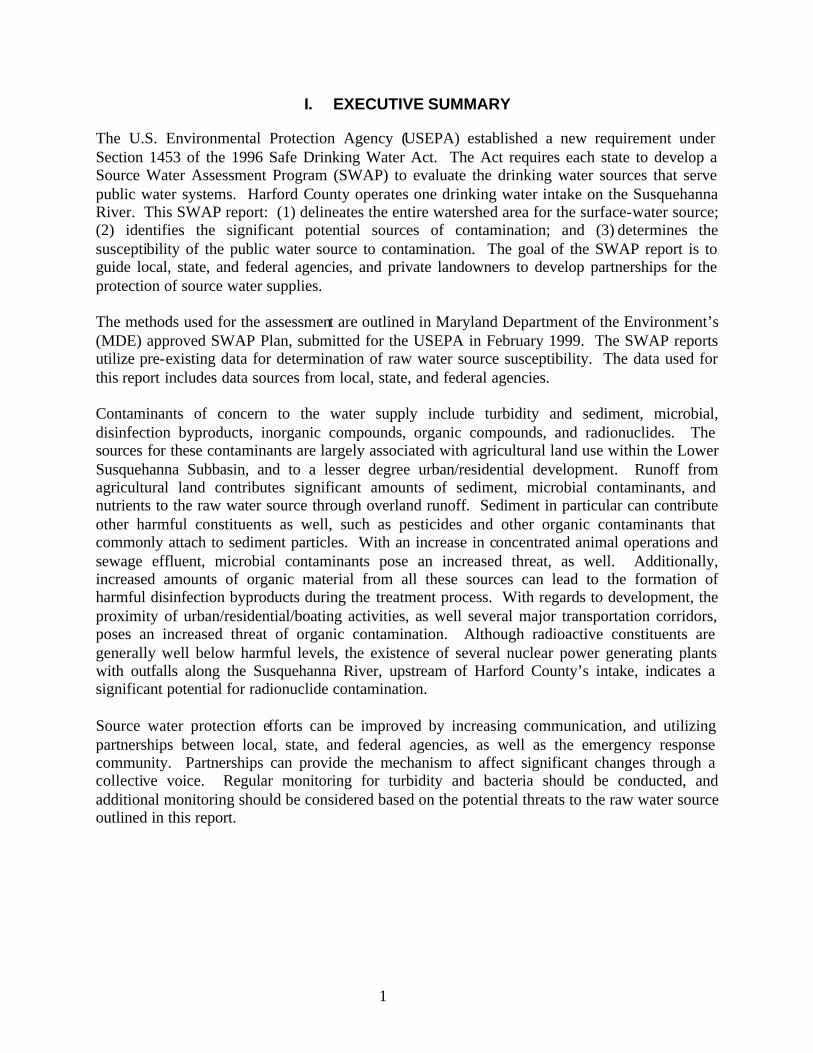
The U.S. Environmental Protection Agency (USEPA) established a new requirement under Section 1453 of the 1996 Safe Drinking Water Act. The Act requires each state to develop a Source Water Assessment Program (SWAP) to evaluate the drinking water sources that serve public water systems. Harford County operates one drinking water intake on the Susquehanna River. This SWAP report: (1) delineates the entire watershed area for the surface-water source; (2) identifies the significant potential sources of contamination; and (3) determines the susceptibility of the public water source to contamination. The goal of the SWAP report is to guide local, state, and federal agencies, and private landowners to develop partnerships for the protection of source water supplies. The methods used for the assessment are outlined in Maryland Department of the Environment’s (MDE) approved SWAP Plan, submitted for the USEPA in February 1999. The SWAP reports utilize pre-existing data for determination of raw water source susceptibility. The data used for this report includes data sources from local, state, and federal agencies. Contaminants of concern to the water supply include turbidity and sediment, microbial, disinfection byproducts, inorganic compounds, organic compounds, and radionuclides. The sources for these contaminants are largely associated with agricultural land use within the Lower Susquehanna Subbasin, and to a lesser degree urban/residential development. Runoff from agricultural land contributes significant amounts of sediment, microbial contaminants, and nutrients to the raw water source through overland runoff. Sediment in particular can contribute other harmful constituents as well, such as pesticides and other organic contaminants that commonly attach to sediment particles. With an increase in concentrated animal operations and sewage effluent, microbial contaminants pose an increased threat, as well. Additionally, increased amounts of organic material from all these sources can lead to the formation of harmful disinfection byproducts during the treatment process. With regards to development, the proximity of urban/residential/boating activities, as well several major transportation corridors, poses an increased threat of organic contamination. Although radioactive constituents are generally well below harmful levels, the existence of several nuclear power generating plants with outfalls along the Susquehanna River, upstream of Harford County’s intake, indicates a significant potential for radionuclide contamination. Source water protection efforts can be improved by increasing communication, and utilizing partnerships between local, state, and federal agencies, as well as the emergency response community. Partnerships can provide the mechanism to affect significant changes through a collective voice. Regular monitoring for turbidity and bacteria should be conducted, and additional monitoring should be considered based on the potential threats to the raw water source outlined in this report.
2
II. INTRODUCTION
A. Surface Water Source
1. Description
The Harford County Water Supply System treats water received from the Susquehanna River. The Susquehanna River Basin spans three states (New York, Pennsylvania, and Maryland), draining approximately 27,500 square miles, or 43 percent of the Chesapeake Bay's drainage area. The population within the basin is approximately 4.1 million people. The Susquehanna River flows 444 miles from its headwaters at Otsego Lake near Cooperstown, N.Y. to Havre de Grace, Md. where it meets the Chesapeake Bay. The river flows approximately 20 miles per day on average during summer. The average flow of the Susquehanna River is 34,450 cubic feet per second (cfs). The highest recorded flow was during June of 1972, when flows reached 1,020,000 cfs at Harrisburg, Pennsylvania. The lowest recorded flow was during the 1930 drought, when flows dropped to 1,700 cfs. Table 1 shows annual water discharge for 2001, as well as long-term annual mean flows, for selected sites located on the Susquehanna River. Table 1. Annual Water Discharge, Calendar Year 2001
Long-term 2001 Site Short Name Years of Annual Mean Mean Percent of
Record cfs1 cfs Long-Term Mean
Towanda 88 10,617 7,727 72.8
Danville 97 15,224 11,067 72.7
Lewisburg 62 10,809 6,749 62.4
Newport 102 4,305 2,499 58.0
Marietta 70 37,038 24,378 65.8
Conestoga 17 634 367 57.9 1 Cubic feet per second
2. Political jurisdictions
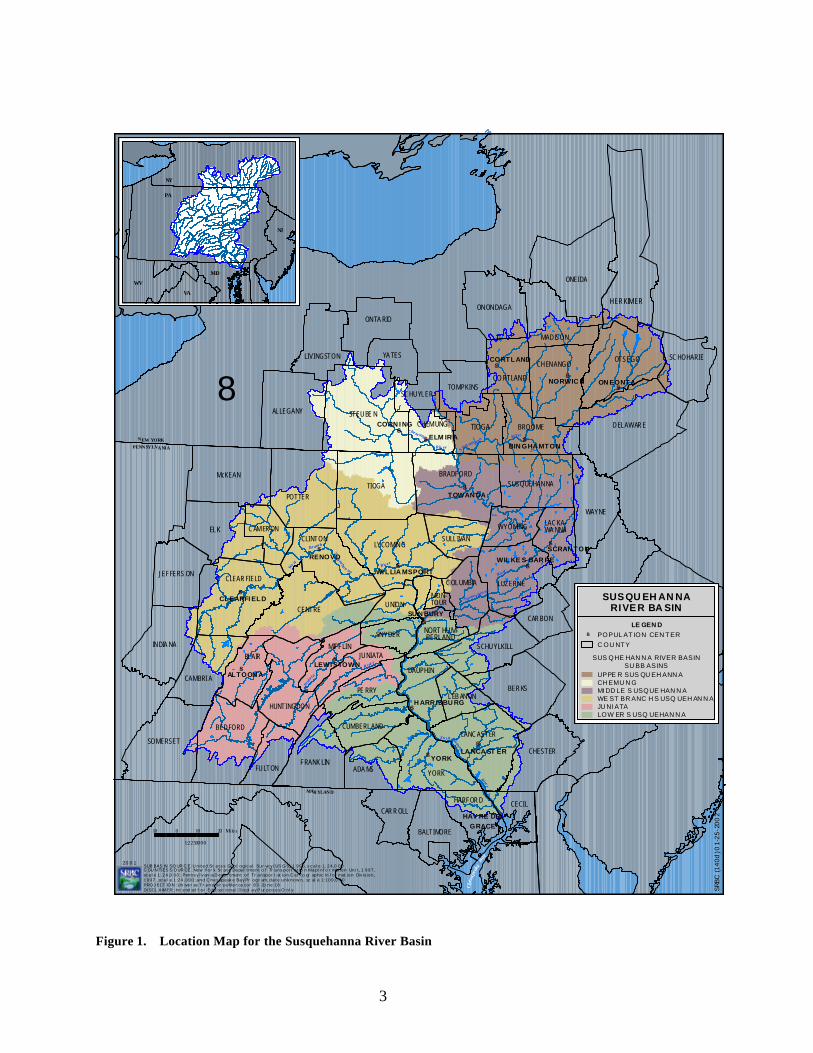
All three states in the Susquehanna River Basin have county level governments. In New York and Pennsylvania, political boundaries are further subdivided into urban and township units. Unlike the Maryland county system, most of the land use control is delegated down to the local level. Nineteen major population centers are located throughout the basin (Figure 1). At the headwaters in N.Y., Cortland, Norwich, Oneonta, and Corning represent the more populated areas. South of these cities, Elmira and Binghamton also are heavily populated areas in the Upper Susquehanna Subbasin.
3
#S
#S
#S
#S
#S
#S
#S
#S
#S
#S
#S
#S#S
#S
#S#S
#S
#S
#S
ELK
CO RTLAND
HERKIMER
NORT HUM-BERLAND
R iver
We st
Branch
R iver
Juni
a ta
R iver
Su sq ueha n na
S
usq ueh ann
Riv er
Chem ung
R i ver
R iver
S usqu ehan na
S u sq ueh an na
TIOGA
YORK
ELMIRA
RENOVO
CORNING
NORWICH ONEONTA
ALTOONA
TOWANDA
CORTLAND
SCRANTON
LANCASTER
LEWISTOWN
BINGHAMTON
HARRISBURG
CLEARFIELD
WILKES-BARRE
WILLIAMSPORT
HAVRE DE GRACE
TIOGA
ONEIDA
YORK
STEUBE N
CENTRE
POTTER
DELAWARE
BERKS
OTSEGO
McKEAN
LYCOMING
BEDFORD
INDIA NA
BRADFORD
WAYNE
CLINTON
SOMERSET
LUZERNE
ALLEGANY
CLEARFIELD
BLAIR
LANCASTER
PE RRY
CHESTER
BROOME
CHENANGO
FRANK LIN
CAMBRI A
ADA MS
ONTA RIO
MADISON
ONONDAGA
HUNTINGDON
SCHUYLKILL
DAUPHIN
CECIL
YA TES
JEFFERS ON
FULTON
SUSQUEHANNA
SCHOHARIE
MIFFLIN
LIVINGSTON
BALTIMORE
UNION
CARROLL
TOMPKINS
JUNIATA
COLUMBIA
SULLIVAN
CARBON
HARFORD
WYOMING
SNYDER
CHEM UNG
CAM ERON
CUMBERLAND
LEB ANON
LACKA-WA NNA
SCHUYLER
MON-TOUR
SUNBURY
8
DI SCL AIMER : In t e nd ed f o r Ed u ca t io n a l D is pl a y P ur p o s e s O n l y
SUB BAS IN SO UR C E: U n it e d St a t e s Ge o l o g ic a l Su r ve y (US G S), 1 9 9 6 , s c a l e 1 : 2 4 ,0 0 0 C OU N TI ES S O UR CE : Ne w Yo r k St a t e De pa r t me n t o f Tr a n s p o r t a t io n Ma p I n f o r ma t io n Un i t , 1 9 9 7 , sc a l e 1 : 2 4 ,0 0 0 ; Pen n s y l v an ia D e pa r t men t o f Tr a n sp o r t at io n C a r t o gr ap h ic In f o r mat io n Div is io n , 1 9 9 7 , sc a l e 1 :2 4 , 0 0 0 ; a n d C h e s ap e ak e Ba y Pr o g r am, d a t e u n k n o w n , sc al e 1 :1 0 0 ,0 0 0PRO J ECT IO N : Un ive r se Tr a n sv e r s e Me r ca t o r 8 3 Zo n e 1 8
10 0 10 20 Mile s
PA
MD
NJ
WV
VA
NY
SRBC
(140
d) 0
1-25
-200
2
20 0 1
C he s
apea
k e Ba y
NEW YORKPENNSYLVANIA
MARYLAND
1:2250000
SUS QHE HAN N A RIVER BASINSU BB ASINS
CH EMU N G
JU NI ATALOW ER S USQ UEHAN N A
MI DD LE S USQUE HAN N A
UPPE R SUS QU EH ANN A
WE ST BR ANC H S USQ UEH AN N A
C OU NT Y
#S POPUL AT ION CEN T ERLE GEN D
SUSQU EH AN NARIVER BA SIN
Figure 1. Location Map for the Susquehanna River Basin
4
In northern Pennsylvania, Towanda, Scranton, and Wilkes-Barre are population centers located in the Middle Susquehanna Subbasin. The West Branch of the Susquehanna River represents the most sparsely populated area of the basin and is comprised of a significant amount of state-owned lands. Clearfield, Renovo, and Williamsport are the largest population centers. Sunbury, Pa., is located at the confluence of the West Branch Susquehanna River and the mainstem of the Susquehanna River. It also hosts the uppermost dam on the mainstem of the Susquehanna River in Pennsylvania. The portion of the basin downstream of Sunbury comprises the Lower Susquehanna Subbasin, which is the primary focus of this assessment. The last major subbasin contributing to the lower Susquehanna is the Juniata Subbasin. The cities of Altoona and Lewistown are located within this subbasin. Raystown Lake, one of the largest impoundments in the Susquehanna basin, is located within the Juniata Subbasin. Representing the most densely populated region in the Susquehanna River Basin, the metropolitan areas of Harrisburg, York, and Lancaster are located in south-central Pennsylvania, within the Lower Susquehanna Subbasin. The Lower Susquehanna Subbasin empties into the Chesapeake Bay at Havre de Grace, Md.
3. Topography and climate
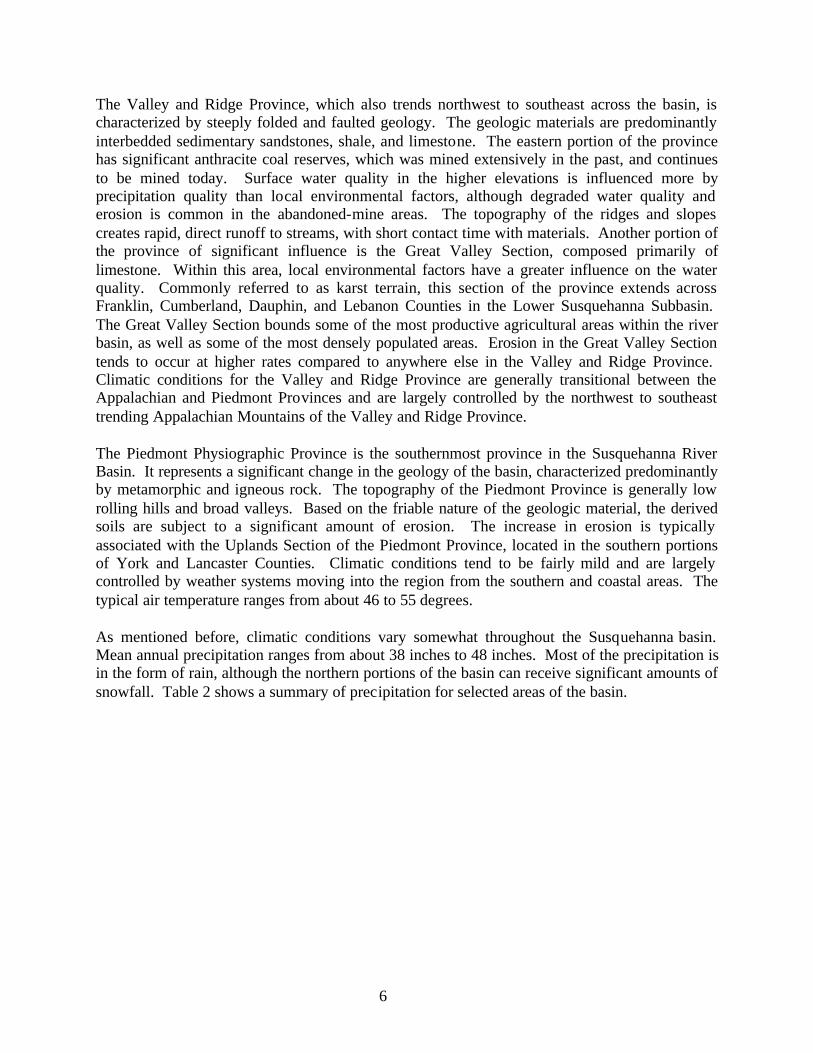
The Susquehanna River Basin is very diverse with respect to topography and climatic conditions. Within the basin, there are three predominant physiographic provinces (Figure 2). The characteristics of each of these provinces largely control factors such as weather patterns and ambient water quality conditions. The physiographic provinces in downstream order include the Appalachian Plateau, Valley and Ridge, and Piedmont. A small portion of the Blue Ridge Province extends into the southern extent of the basin. The highest elevations lie in New York and northern Pennsylvania. Elevations significantly decrease towards Sunbury, Pa., and then continue to decrease more gradually towards the mouth of the river at Havre de Grace, Md. The predominant physiographic province in the basin is the Appalachian Plateaus Province, which comprises about 40 percent of the Susquehanna River Basin. The province boundary trends southwest to northeast across the upper portions of the Susquehanna River Basin. Most of the province is characterized by flat- lying bedrock geology, primarily sedimentary rock. The western portion of the province in Pennsylvania contains bituminous coal reserves that have been mined extensively in the past and continue to be mined today. Weather patterns are primarily influenced by systems moving from the Midwest United States, and “lake-effect” systems moving across northwestern Pennsylvania from Canada.
5
#S
#S
#S
#S
#S
#S
#S
#S
#S
#S
#S
#S
#S
#S
#S#S
#S
#S
#S
YORK
ELMIRA
RENOVO
CORNING
NORWICHONEONTA
ALTOONA
TOWANDA
CORTLAND
SCRANTON
LANCASTER
LEWISTOWN
BINGHAMTON
HARRISBURG
CLEARFIELD
WILKES-BARREWILLIAMSPORT
HAVRE DE GRACE
SUNBURY
8NEW YORK
PENNSYLVANIA
MARYLAND
DIS TIN CTIVE A REAS H AVING COMM ON TO PO GRAP HY, ROCKTYPE S AND STRU CTURE , AND G EOL OGIC AND
GEO MOR PHIC HI STO RY
PHYSIOG RAPHIC SECTIONS
SUSQUEH AN N A RIVER BASINSUSQUEH AN N A RIVER BASIN
200 1
DISC L A IMER: In t en d e d f o r Ed u c a t io n a l D is pl a y Pur p o s e s O nl y
SOU RC E: Un it ed St a t e s Ge o l o g ic a lSur ve y, 1 9 6 4 , s c a l e 1 :7 ,0 0 0 ,0 0 0ROJ EC TIO N : U n iv er s e T ra n s ve r s eMe r c at o r 8 3 Zo n e 1 8
SRBC
(140
e) 0
1-2
5-2
002
Al l eghen y Mo u nt a in
C at s ki l l Kan aw haSo ut her nN ew Yo r k
APPALAC H IAN PLAT EAUS
Embayed
N o r t her nBL UE RID GE
C OAS TAL PLAIN
PIED MO NT
Piedmo nt Upl an ds
Piedmo ntLo w l an ds
M iddl eVALLEY AN D RID GE
1:2000000
20 0 20 Miles
Figure 2. Physiographic Provinces in the Susquehanna River Basin
6
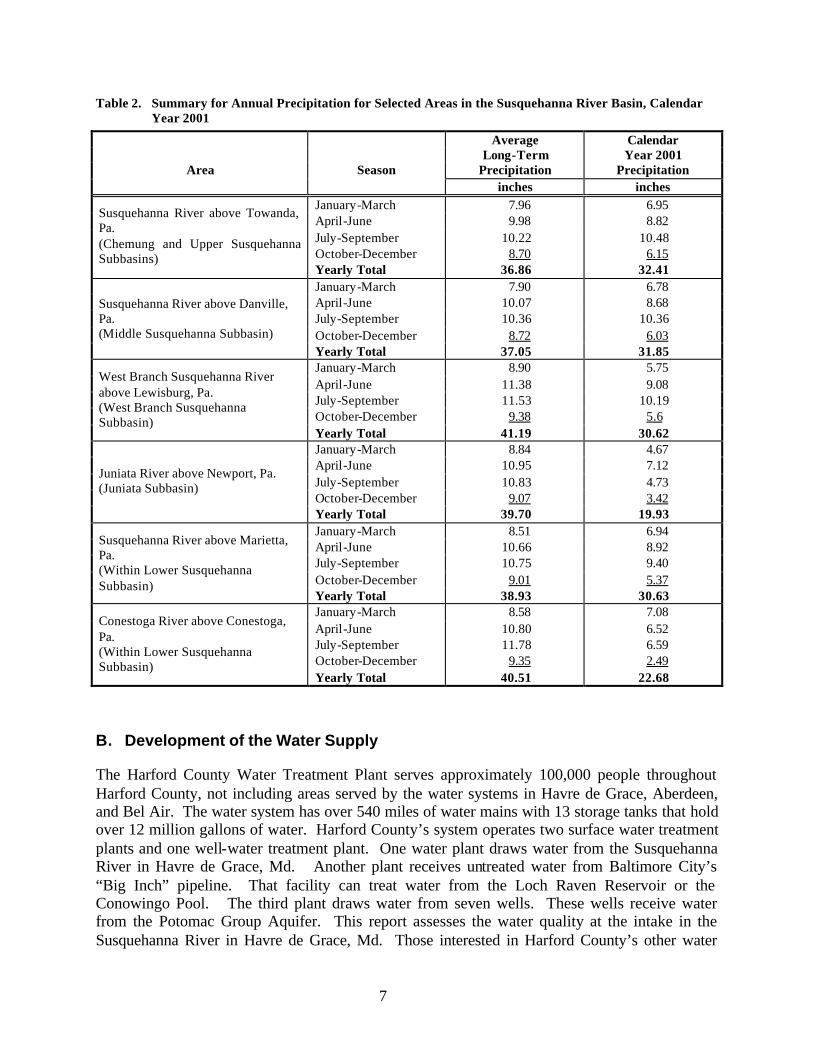
The Valley and Ridge Province, which also trends northwest to southeast across the basin, is characterized by steeply folded and faulted geology. The geologic materials are predominantly interbedded sedimentary sandstones, shale, and limestone. The eastern portion of the province has significant anthracite coal reserves, which was mined extensively in the past, and continues to be mined today. Surface water quality in the higher elevations is influenced more by precipitation quality than local environmental factors, although degraded water quality and erosion is common in the abandoned-mine areas. The topography of the ridges and slopes creates rapid, direct runoff to streams, with short contact time with materials. Another portion of the province of significant influence is the Great Valley Section, composed primarily of limestone. Within this area, local environmental factors have a greater influence on the water quality. Commonly referred to as karst terrain, this section of the province extends across Franklin, Cumberland, Dauphin, and Lebanon Counties in the Lower Susquehanna Subbasin. The Great Valley Section bounds some of the most productive agricultural areas within the river basin, as well as some of the most densely populated areas. Erosion in the Great Valley Section tends to occur at higher rates compared to anywhere else in the Valley and Ridge Province. Climatic conditions for the Valley and Ridge Province are generally transitional between the Appalachian and Piedmont Provinces and are largely controlled by the northwest to southeast trending Appalachian Mountains of the Valley and Ridge Province. The Piedmont Physiographic Province is the southernmost province in the Susquehanna River Basin. It represents a significant change in the geology of the basin, characterized predominantly by metamorphic and igneous rock. The topography of the Piedmont Province is generally low rolling hills and broad valleys. Based on the friable nature of the geologic material, the derived soils are subject to a significant amount of erosion. The increase in erosion is typically associated with the Uplands Section of the Piedmont Province, located in the southern portions of York and Lancaster Counties. Climatic conditions tend to be fairly mild and are largely controlled by weather systems moving into the region from the southern and coastal areas. The typical air temperature ranges from about 46 to 55 degrees. As mentioned before, climatic conditions vary somewhat throughout the Susquehanna basin. Mean annual precipitation ranges from about 38 inches to 48 inches. Most of the precipitation is in the form of rain, although the northern portions of the basin can receive significant amounts of snowfall. Table 2 shows a summary of precipitation for selected areas of the basin.
7
Table 2. Summary for Annual Precipitation for Selected Areas in the Susquehanna River Basin, Calendar Year 2001
Average Calendar Long-Term Year 2001
Area Season Precipitation Precipitation inches inches
Conestoga River above Conestoga, Pa. (Within Lower Susquehanna Subbasin)
Yearly Total 40.51 22.68
B. Development of the Water Supply
The Harford County Water Treatment Plant serves approximately 100,000 people throughout Harford County, not including areas served by the water systems in Havre de Grace, Aberdeen, and Bel Air. The water system has over 540 miles of water mains with 13 storage tanks that hold over 12 million gallons of water. Harford County’s system operates two surface water treatment plants and one well-water treatment plant. One water plant draws water from the Susquehanna River in Havre de Grace, Md. Another plant receives untreated water from Baltimore City’s “Big Inch” pipeline. That facility can treat water from the Loch Raven Reservoir or the Conowingo Pool. The third plant draws water from seven wells. These wells receive water from the Potomac Group Aquifer. This report assesses the water quality at the intake in the Susquehanna River in Havre de Grace, Md. Those interested in Harford County’s other water
8
sources should refer to the Baltimore City’s Source Water Assessment report, or Harford County’s Well Field Source Water Assessment report. Harford County provides over 4 billion gallons of water a year to its customers. Typically, 58 percent of Harford County’s water comes from the Loch Raven Reservoir, 27 percent from the Potomac Group Aquifer, and 15 percent from the Susquehanna River in Havre de Grace, Md. The percentages changed during the year 2002 due to drought conditions. During 2002, 66 percent of Harford County’s water came from the Susquehanna River (44 percent from the Conowingo Pool and 22 percent from the Susquehanna River in Havre de Grace, Md.), 25 percent from the Potomac Group Aquifer, and 9 percent from Loch Raven Reservoir. The Harford County Water system has finished water interconnections with 6 other water utilities within Harford County. These interconnections can be used to transfer water from one system to another when needed. The Susquehanna River is the most plentiful source of freshwater near Havre de Grace. The intake is a shallow water intake, and a vacuum pump draws water into the plant. This pump feeds raw water to the Trident units. The treatment plant uses two US Filter Microfloc Trident units. They consist of an absorption clarifier and a mixed media filter. Each unit can treat 2 million gallons per day (mgd). Chemical addition often includes alum, polymer, activated carbon, chlorine, sodium hydroxide, and sodium silicafluoride. Filters and clarifiers also are used to treat the water. Similarly, the Abbingdon Treatment Plant uses chemical addition and filtration to treat the water.
9
III. RESULT OF SITE VISITS
A. Intake Description
Harford County operates one intake on the Susquehanna River in Havre de Grace, Md. The intake is relatively shallow and is located close to shore.
B. Operator Concerns
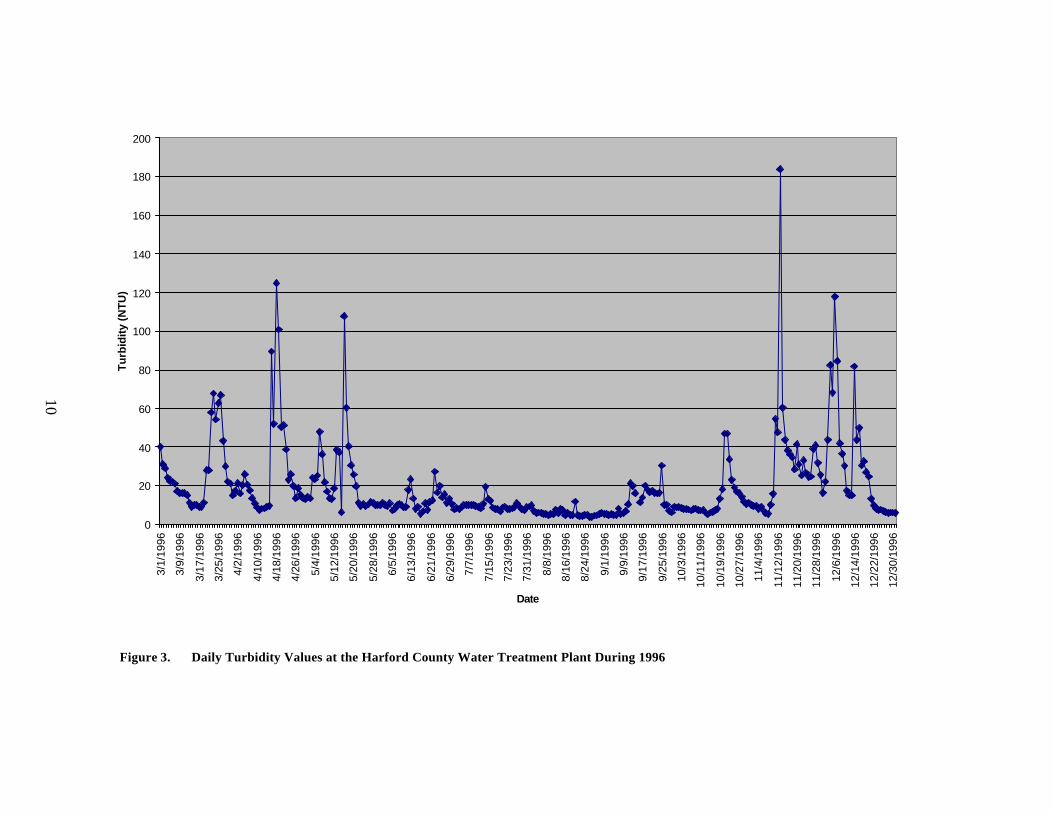
High salinity in the river water is a primary concern of the water supplier. This occurs typically during drought conditions. High turbidity is another concern of the operator, particularly during high-flow conditions. Flash turbidity can occur following a heavy rainstorm. The possibility of spills into the river from one of the many bridges that cross it is another concern of the water supplier. Additionally, upstream sewage dischargers are of concern. Figure 3 shows the turbidity near Harford County during 1996.
0
20
40
60
80
100
120
140
160
180
200
3/1/
1996
3/9/
1996
3/17
/199
6
3/25
/199
6
4/2/
1996
4/10
/199
6
4/18
/199
6
4/26
/199
6
5/4/
1996
5/12
/199
6
5/20
/199
6
5/28
/199
6
6/5/
1996
6/13
/199
6
6/21
/199
6
6/29
/199
6
7/7/
1996
7/15
/199
6
7/23
/199
6
7/31
/199
6
8/8/
1996
8/16
/199
6
8/24
/199
6
9/1/
1996
9/9/
1996
9/17
/199
6
9/25
/199
6
10/3
/199
6
10/1
1/19
96
10/1
9/19
96
10/2
7/19
96
11/4
/199
6
11/1
2/19
96
11/2
0/19
96
11/2
8/19
96
12/6
/199
6
12/1
4/19
96
12/2
2/19
96
12/3
0/19
96
Date
Tu
rbid
ity
(NT
U)
Figure 3. Daily Turbidity Values at the Harford County Water Treatment Plant During 1996
10
11
IV. WATERSHED CHARACTERIZATION
A. Source Water Assessment Area
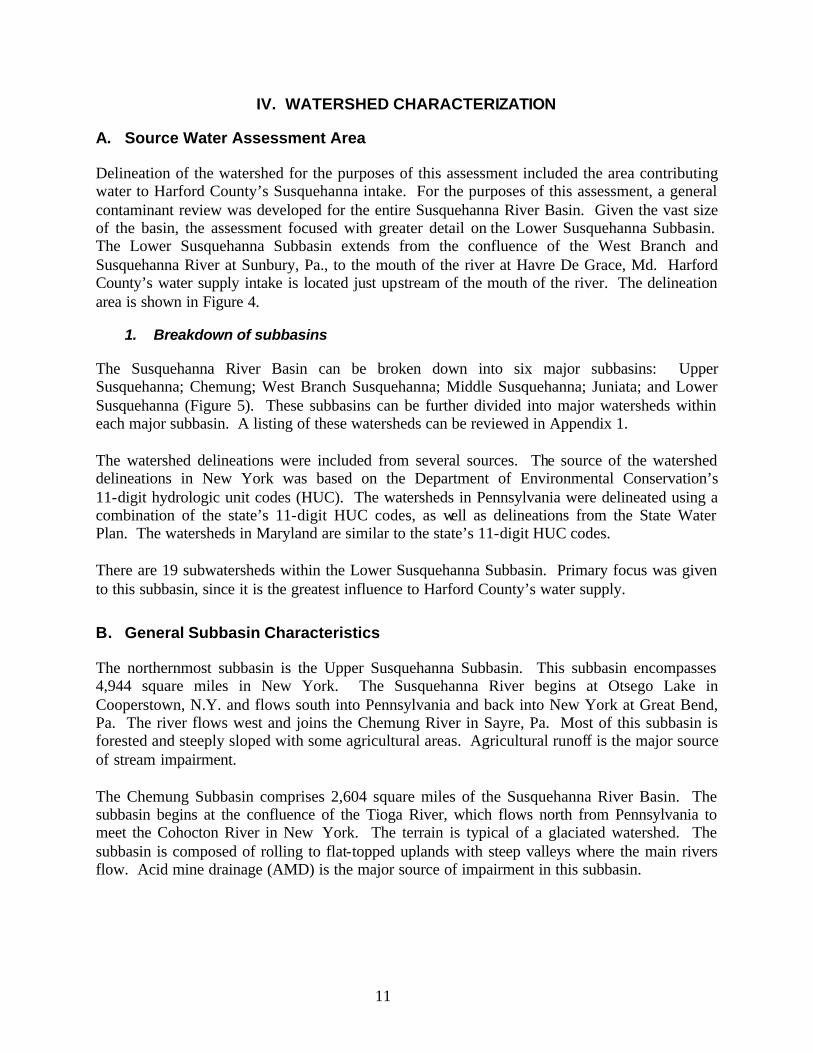
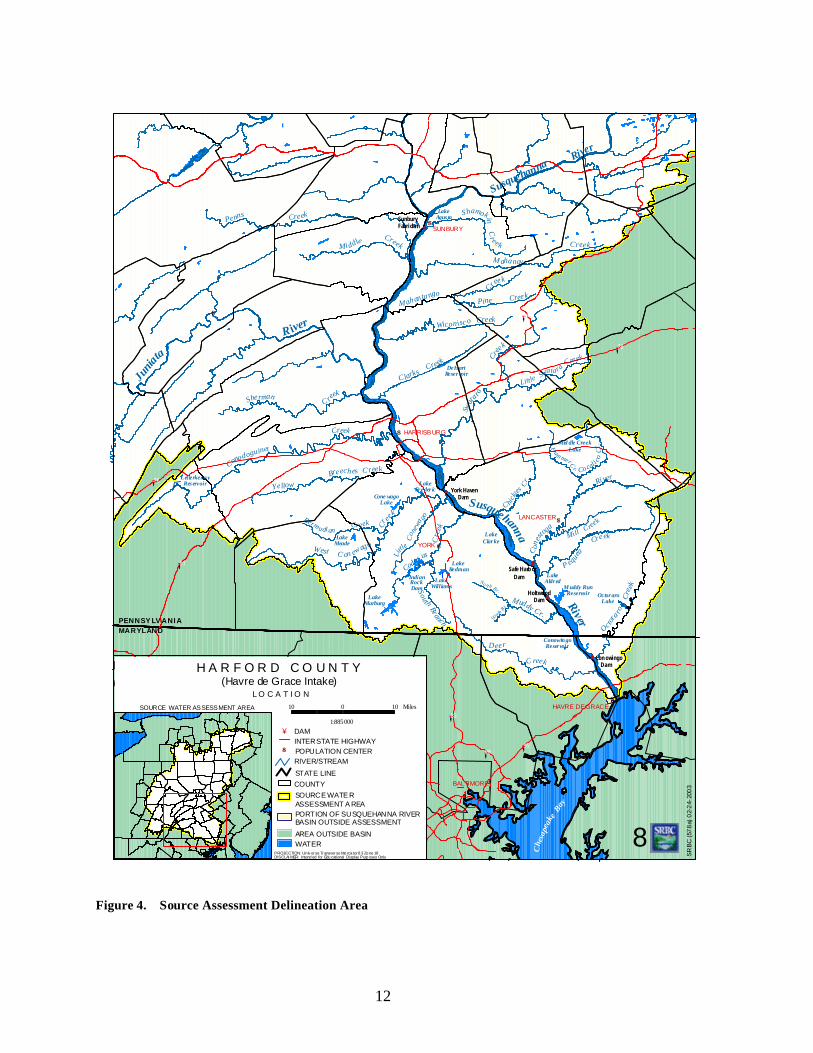
Delineation of the watershed for the purposes of this assessment included the area contributing water to Harford County’s Susquehanna intake. For the purposes of this assessment, a general contaminant review was developed for the entire Susquehanna River Basin. Given the vast size of the basin, the assessment focused with greater detail on the Lower Susquehanna Subbasin. The Lower Susquehanna Subbasin extends from the confluence of the West Branch and Susquehanna River at Sunbury, Pa., to the mouth of the river at Havre De Grace, Md. Harford County’s water supply intake is located just upstream of the mouth of the river. The delineation area is shown in Figure 4.
1. Breakdown of subbasins
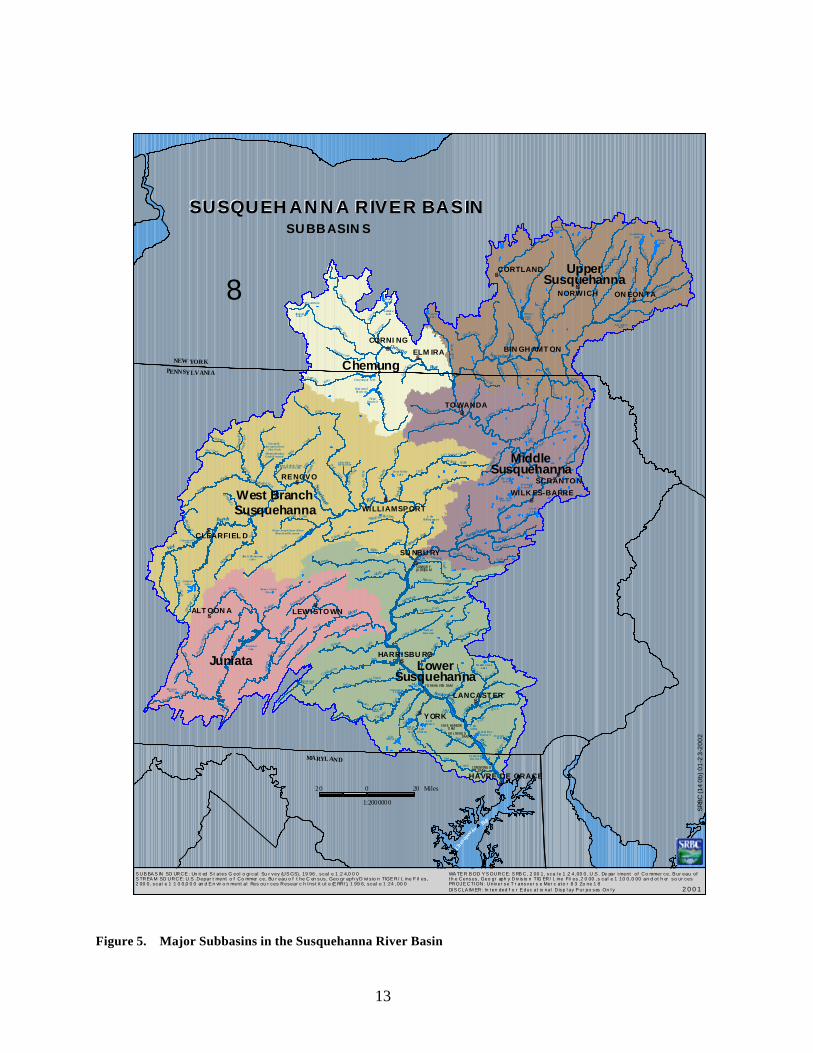
The Susquehanna River Basin can be broken down into six major subbasins: Upper Susquehanna; Chemung; West Branch Susquehanna; Middle Susquehanna; Juniata; and Lower Susquehanna (Figure 5). These subbasins can be further divided into major watersheds within each major subbasin. A listing of these watersheds can be reviewed in Appendix 1. The watershed delineations were included from several sources. The source of the watershed delineations in New York was based on the Department of Environmental Conservation’s 11-digit hydrologic unit codes (HUC). The watersheds in Pennsylvania were delineated using a combination of the state’s 11-digit HUC codes, as well as delineations from the State Water Plan. The watersheds in Maryland are similar to the state’s 11-digit HUC codes. There are 19 subwatersheds within the Lower Susquehanna Subbasin. Primary focus was given to this subbasin, since it is the greatest influence to Harford County’s water supply.
B. General Subbasin Characteristics
The northernmost subbasin is the Upper Susquehanna Subbasin. This subbasin encompasses 4,944 square miles in New York. The Susquehanna River begins at Otsego Lake in Cooperstown, N.Y. and flows south into Pennsylvania and back into New York at Great Bend, Pa. The river flows west and joins the Chemung River in Sayre, Pa. Most of this subbasin is forested and steeply sloped with some agricultural areas. Agricultural runoff is the major source of stream impairment. The Chemung Subbasin comprises 2,604 square miles of the Susquehanna River Basin. The subbasin begins at the confluence of the Tioga River, which flows north from Pennsylvania to meet the Cohocton River in New York. The terrain is typical of a glaciated watershed. The subbasin is composed of rolling to flat-topped uplands with steep valleys where the main rivers flow. Acid mine drainage (AMD) is the major source of impairment in this subbasin.
12
#S
#S
#S
#S
#S
#S
C reek
Deer
Octora
ro
Cre
ek
C reek
C reek
M ah anta ngoCreek
Pine
Wicon isc o Creek
C larks Creek Cre
ek
Swat
a ra
Little Swata r a Creek
Ham me r C
r.
Mill Creek
Creek
P equeaC
ones
toga
No rt h B r.
M uddy Cr.
S outh Branch
Codo r us
C
r eekCreekBermudi an
West C on ewago
Yellow Breech es C reek
Creek
Conod oguinet
Sherman
Midd le Creek
CreekPenns
M aha noy
Cocalico
Cr.
Ri ver
Cr eek
Li
ttle
Con
ewa go
River
C reek
R iver
Junia
ta
So
uth Br
LakeFreder ic
LakeClarke
ConowingoReservoir
IndianRockDam
LakeMarburg
LakeAldred
Muddy RunReservoir
DeHartReservoir
OctoraroLake
LakeAgus ta
LakeMeade
Cone wagoLake
Mid dle CreekLake
LakeWilliams
LakeRedman
LetterkennyReservoir
S hamokin Cr e ek
C hick
ies C
r .
Susquehanna
SR
BC
(57
8a)
02-
24-
200
3
PROJECTION: Un iv er se Tr ansver se Me rca tor 8 3 Zo ne 18DISCLAI MER: Intend ed for Edu cational Display Purp oses Only
10 0 10 Miles
1:885000
Ch e
sape
ake
Bay
H A R F O R D C O U N T Y
PORTION OF SUSQUEHANNA RIVER BASIN OUTSIDE ASSESSMENT
AREA OUTSIDE BASINWATER
RIVER/STREAM
STATE LINECOUNTYSOURCE WATE R ASSESSMENT A REA
POPULATION CENTER#S
INTERSTATE HIGHWAY¥ DAM
L O C A T I O N
SOURCE WATER ASSESSMENT AREA
8
YORK
LANCASTER
HARRISBURG
HAVRE DE GRACE
BALTIMORE
PENNSYLVANIAMARYLAND
River
Susquehanna
.-,76
.-,78
.-,81
.-,81
.-,95
.-,83
.-,695
Con owingo Dam
Holtwood Dam
Safe Harb or Dam
York Haven Dam
SunburyFabridam SUNBURY
(Havre de Grace Intake)
Figure 4. Source Assessment Delineation Area
13
#S
#S
#S
#S
#S
#S
#S
#S
#S
#S
#S
#S
#S
#S
#S#S
#S
#S
#S
UpperSusquehanna
MiddleSusquehanna
LowerSusquehanna
Juniata
Chemung
JuniataBran
ch
Ray stown
Creek
Deer
Oct
oraro C
reek
Creek
Creek
Mahantango CreekPine
Wiconisco Creek
Clarks Creek
Creek
Swatar
a
Little Swatar
a Creek
Hammer Cr .
Mill Creek
Creek
P equeaCo
nes tog
a
North Br.
Muddy Cr.
S ou th Branch
Codo rus C
re ek
CreekBermu dian
Conewago
River
Bobs Cre ek
Frank
sto wn B
r anch
Jun
ia ta River
Cl ov er
Cr ee
k
L it tle J
uniata River Stone
Creek
St anding
Cre ek
Augh
w ick
Cre
ek
Blackl o
g Cre
ek
Yellow Breeches Creek
Creek
Conodoguinet
Sherman
Buffalo Creek
Tuscar
ora
Middle
Cr eek
CreekPenns
C hest C reek
Clear f
ield C
reek
A nde rs on Cr.
C reek
Moshan
no n
Bennett
Fishing Cre
ek
CreekBeech
Creek
Eagle
Bald
Pine
Creek
Fork
First
Sinnem
a honin
g
Driftwood
West Creek
Branch
Branch
Sinnemahoning Creek
Creek
Ket tle
Sugar Creek
Littl e Loyalsock Cr.
Loyalsock Cr eek
Little
Pine Cr
eek
Pine
Cree
k
Ly
coming Creek
L oyals
ock
Creek
Muncy
Creek
BuffaloCreek
Roaring
Creek
Catawissa Black Creek
CreekNescopeck
Wapwall open
Creek
Cr eek
Fish ing
Towanda Creek
Lackaw
ann
a Riv
er
Mart in
s
Cree
k
Tun khannoc
k
Meshopp
en Cree
kWyalusing
CreekRiverTi oga
Cowanesque River
O a ks Cr ee k
Cherry
V all ey
Cree
k
Charlotte Creek
Ou
leout Creek
Schenevus C
ree k
C reek
Rive r
But ter nu
t Cree
k
Wharton
Cr
e ek
Sanger
field Ri v
er
Geneg
antsle
t Cre
ek
Otsel
ic Ri
ve r
Chen
ango
River
Ti oughn ioga
River
Catatonk Creek
Owe
go Cr
eek
Cayuta C reek
Se eley
Cre ek
Tuscarora Creek
M ea ds Cr
eek
Mud Cr
eek
Cohocton River
Canisteo R iv er
Oteg o
Una di
lla
Creek
BrushCreek
Mahanoy
Co calico Cr
.
River
Cre
ekLi tt
le C
on ewa
goCr eek
Susquehanna
Susquehanna
River
River
Chemung
River
Susquehanna
Sus quehannaWest BranchSusquehanna
YORK
ELMIRA
RENOVO
CORNING
NORWICH ONEONTA
ALTOONA
TOWANDA
CORTLAND
SCRANTON
LANCASTER
LEWISTOWN
BINGHAMTON
HARRISBURG
CLEARFIELD
WILKES-BARRE
WILLIAMSPORT
HAVRE DE GRACE
Por ta
ge Cr
eek
Creek
Dunni n
g Creek
Honey Cr eek
R iver
Junia
ta
So ut h Br .
Kishacoqu
illas
Cre ek
River
Starucca Creek
C hoconu t Cr eek
A pa lac hi n Cr .
Saltli ck Cr eek
Wappasening Cr eek
Snake
Creek
Wysox
Cre e
k
Lak eFre deric
Lak eClark e
Otseg oLa ke
Co nowin goRes ervo ir
Cowa nesq ue La ke
Glend a leLak e
Ca nad ara goLa ke
Tio gaReservo ir
Indi anRo ckDa m
Ham mon dRe serv oir
La keMarb ur g
Wa netaLak e
Whitne yPointLak e
L akeAldred
Fo ster Jo sep h Sa yer s Da mBlan ch ard Re servo ir
Har vey sLa k e
Lamok aLa ke
Curwen svilleLak e
Cry sta lLa ke
M ud dy Ru nReservo ir
DeH artRese rvoir
Oc to raroLa ke
Cayu taLak e
LakeAgu sta
Lak eMead e
Ro se Va lleyLak e
Con ewag oLa ke
H un tsv il leR eservo ir
Mi ddle Cree kLak e
Pikes Cre ekRese rvoir
Ark p ort Da m
Ea to nRes ervoir
Lak eCa rey
Sha wn eeLa k e
LakeWillia ms
L akeCh illisq uaq u e
Blac k Mo sha n nonLak e
Almo ndLak e
East Sidn eyLa ke
Stillwa te rLa ke
Sh ave r Cree kDa m
Alvin R. Bu sh Dam/Ke ttle Cre ek Lake
Little Pin eCre ek Da m
La keRed ma n
Nant ico
ke C
r.
Ra ystownLake
SAFE HARBORD AM
YO RK HA VEN DAM
CONOWING ODAM
SUNBUR YFA BRIDA M
HO LTWOO D DAM
Geo rge B. Stev enso n Da m/
First Fo rk S in nem ah on in gCreek R eservo ir
Letterk en nyReser voir
Branch
West
River
White Deer Hole Creek
Larr
ys C
reek
Yo ung
Woma
ns
Cr.
Mosquito Cr .
Shamokin Cree k
Chi cki es
Cr
.
Bowman
C
r.Mehoop
any Cr
eek
SUNBURY
West
Chillisquaq
ue Creek
NEW YORKPENNSYLVANIA
Ches
apea
ke B
ay
SUSQUEH AN N A RIVER BASINSUSQUEH AN N A RIVER BASINSUBBASIN S
MARYL AND
WA TE R B OD Y S OURCE: S RB C, 2 00 1, sca l e 1 :2 4, 00 0, U.S . De par t ment of Co mmer ce, B ur eau oft h e Census , Geo gr aph y D iv is io n TIG ER/ L ine Fil es , 2 0 00 , s cal e 1 :10 0, 0 00 an d ot h er so ur cesPROJE CTI ON: Univer se T r ansver s e Mer c at o r 8 3 Zo ne 1 8DI S CLA IM ER: In t en ded f o r E duc at io nal D isp l ay P ur po ses On l y 2 0 0 1
SRBC
(14
0b) 0
1-2
3-20
02
20 0 20 Miles
1:2000000
8
S UB BA S IN SO URCE : Un it ed S t at es G eol o gi cal Su r vey (US GS), 19 96 , scal e 1 :2 4,0 0 0 S TREA M SO URCE: U. S . Depar t ment o f Co mmer ce, Bu r eau o f t he C en sus , Geo gr aph y D ivi s io n TIGE R/ L ine F il es , 2 00 0, scal e 1 :1 0 0,0 0 0 an d E n vir o n ment al Res ou r ces Resear c h I ns t it ut e (E RRI ), 1 99 6, scal e 1 :24 , 00 0
Figure 5. Major Subbasins in the Susquehanna River Basin
14
The Middle Susquehanna Subbasin flows southeast through high plateaus separated by steep valleys. It comprises 3,755 square miles of the entire basin. The Susquehanna River joins the Lackawanna River before turning to flow southwest towards Sunbury. Much of this area is known as Wyoming Valley and extends from Carbondale to Nanticoke, Pa. This is a coal-mining region that has become urbanized, and as a result, AMD is the major source of stream impairment. The West Branch Susquehanna Subbasin originates in the rolling hills of the Allegheny Mountains and is 6,992 square miles. The West Branch flows northeast passing the Allegheny High Plateaus section. At Renovo, Pa., the West Branch flows southeast and then turns south to meet its confluence with the Susquehanna River. This area is predominantly forested, although extensive coal mining has occurred in the western parts of the subbasin. As a result, AMD is the major source of stream impairment in this region. The Juniata River is a major tributary to the Susquehanna River in the Juniata Subbasin, which is 3,406 square miles. This subbasin is contained entirely within the Ridge and Valley Province, which has parallel mountains with long, narrow valleys. The dominant land use is forested, although agriculture maintains a significant presence in the subbasin, as well. Hence, agricultural runoff is a major source of stream impairment in the subbasin. The Lower Susquehanna Subbasin is the most developed subbasin, comprising 5,809 square miles, of which 275 lie in Maryland. The northern part of the subbasin contains ridges that follow southwest to northeast. The river flows through these ridges and widens as it flows through the central portion of the basin. The southern portion of the subbasin is comprised of metamorphosed sediments that are folded and faulted. The steep river slope and narrow valley of the Lower Susquehanna Gorge creates a suitable environment for hydroelectric power generation. Agriculture is very prominent, and as a result is a major source of stream impairment. Three basins in Lancaster County, Pa. are ranked as the most susceptible to agricultural contamination in the state of Pennsylvania. The Lower Susquehanna Subbasin empties into the Chesapeake Bay in Havre de Grace, Md., providing greater than 50 percent of the freshwater inflow.
1. Travel time information from subbasins to intake
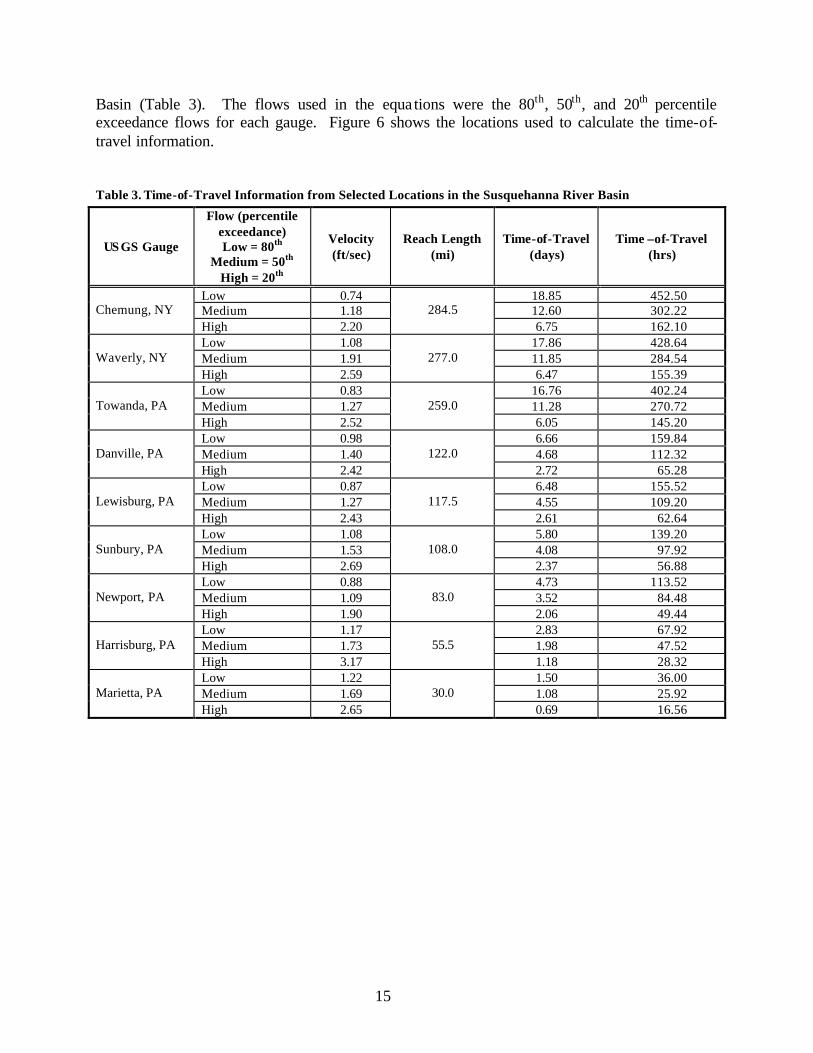
Time-of-travel information is important when considering impacts of contamination on a drinking water source. For the Susquehanna River in New York and Pennsylvania, no dye studies for estimating time-of-travel information have been conducted since the 1960s. For the purpose of this assessment, a U.S. Geological Survey (USGS) estimation method was used to summarize time-of-travel information above Conowingo Dam. In 2001 and 2002, the Susquehanna River Basin Commission (SRBC) performed a series of dye studies in the lower Susquehanna River below Conowingo Dam. The information from this dye study was used to help characterize travel times for the Susquehanna River below the dam. Both sets of information are presented in the following section. The USGS recently developed regression equations for determining time-of-travel estimates in Pennsylvania (Reed and Stuckey, 2002). Streamflow data obtained from USGS gauges were used to calculate the time-of-travel estimates for selected points within the Susquehanna River
15
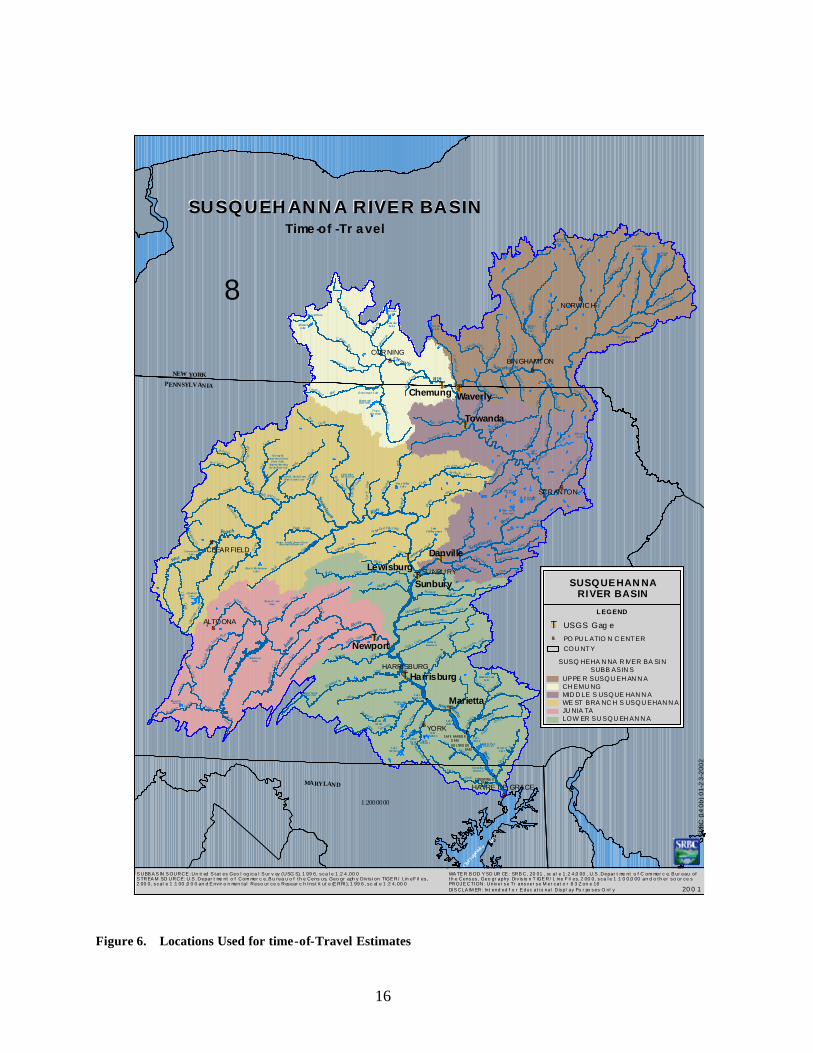
Basin (Table 3). The flows used in the equa tions were the 80th, 50th, and 20th percentile exceedance flows for each gauge. Figure 6 shows the locations used to calculate the time-of-travel information. Table 3. Time-of-Travel Information from Selected Locations in the Susquehanna River Basin
US GS Gauge
Flow (percentile exceedance) Low = 80th
Medium = 50th High = 20th
Velocity (ft/sec)
Reach Length (mi)
Time-of-Travel (days)
Time –of-Travel (hrs)
Low 0.74 18.85 452.50 Medium 1.18 12.60 302.22 Chemung, NY High 2.20
284.5 6.75 162.10
Low 1.08 17.86 428.64 Medium 1.91 11.85 284.54 Waverly, NY High 2.59
277.0 6.47 155.39
Low 0.83 16.76 402.24 Medium 1.27 11.28 270.72 Towanda, PA High 2.52
259.0 6.05 145.20
Low 0.98 6.66 159.84 Medium 1.40 4.68 112.32 Danville, PA High 2.42
122.0 2.72 65.28
Low 0.87 6.48 155.52 Medium 1.27 4.55 109.20 Lewisburg, PA High 2.43
117.5 2.61 62.64
Low 1.08 5.80 139.20 Medium 1.53 4.08 97.92 Sunbury, PA High 2.69
108.0 2.37 56.88
Low 0.88 4.73 113.52 Medium 1.09 3.52 84.48 Newport, PA High 1.90
83.0 2.06 49.44
Low 1.17 2.83 67.92 Medium 1.73 1.98 47.52 Harrisburg, PA High 3.17
55.5 1.18 28.32
Low 1.22 1.50 36.00 Medium 1.69 1.08 25.92 Marietta, PA High 2.65
30.0 0.69 16.56
16
#S
#S
#S
#S
#S
#S
#S
#S
#S
#S
$T $T
$T
$T$T
$T
$T
$T
$TJuniataBran
ch
Raystow n
Creek
Deer
Octorar
o Cr
eek
Creek
Creek
Mahantango CreekPine
Wiconisco Cr eek
Clarks Cree k
Creek
Swa ta
ra
Little S wa tara Creek
Ha
m mer Cr.
M ill Creek
Creek
PequeaCo
nes tog
a
Nor th Br .
Muddy Cr.
S ou th Branch
Codoru s C
re ek
CreekBer mud ian
Con ewago
River
Bobs Cr eek
Frank s
t own
Branch
Jun iata
River
Clov e
r Cr e
e k
Li ttle
Juniata Rive r S tone
Creek
Stand ing
Creek
Augh
wick
C
reek
B lackl og
Cre
ek
Yellow Bree
ches Creek
Creek
Conodogui net
Sherman
Buffa lo Cree k
Tu scaror
a
Middle
C reek
CreekPenns
C hest Creek
Clear
f ield
C reek
An de rs on
Cr.
C ree k
Mosha
nnon
Bennett
Fishing C
reek
CreekBeech
Cree
k
Eag
le
Ba ld
Pine
Creek
F ork
First
Si nn em
a honi
ng
Dr iftwood
We st Cree k
Branc h
Branch
Sinnemaho ning Cr eek
Cr eek
Kettle
Sugar Cr eek
Little Loyalsock Cr.
Loyalsock Creek
Little
Pine
Cre
ek
Pine
Creek
Ly
coming Cr eek
Lo ya ls
ock
Creek
Munc
y
Creek
BuffaloCr eek
Roari ng
Creek
Catawissa Bla ck Creek
Creek
Nescopeck
Wapwal lope
n
Creek
Creek
Fishing
Tow anda Creek
Lackaw
anna
River
Mart in
s
Cr eek
Tunkha nnock
Meshopp
e n C
r eekWyal
using CreekRiverTioga
Cowanesque River
O ak s Cr eek
Cherr
y Va l le
y Creek
Cha rlo tte Creek
Ou
leout Cre
ek
Schenevus
Cre ek
Cree
k
Rive r
Butter
nut C
re ek
Whart o
n C
r eek
Sange
rf ield
River
Gene
gantsl
et Cr e
ekOtsel
ic R
iver
Chen
ang
o
River
Ti oughn ioga
River
Catatonk Cree k
Owego
Creek
Cayut a Cree k
Seele
y Creek
T uscarora Creek
Mea ds
Creek
Mud C
reek
Cohocton River
Canisteo River
O tego
Unad
illa
Cree
k
Bru shCreek
Mahanoy
C ocalico C
r.
River
Cree k
Lit
tle Con
e wago
Creek
Susquehanna
Susquehanna
River
River
Chemung
River
Susquehanna
Susquehanna
YORK
CORNING
NORWICH
ALTOONA
SCRANTON
BINGHAMTON
HARRISBURG
CLEARFIELD
HAVRE DE GRACE
Port ag
e Cr
eek
Creek
Dunn
ing Creek
Honey Creek
R iver
Juniata
Sout h Br.
Kishacoquill
as
C reek
River
Staruc ca Creek
Choconut C reek
A pa la ch in Cr .
Saltlic k Cr eek
Wapp asening Creek
Snake
Cree
k
Wysox
Cree
k
Lak eFrede ric
Lak eClark e
OtsegoLake
Con owin g oReservo ir
Co wa n esqu e Lake
Glend a leLak e
Can ada ra goLake
Tiog aRes ervoir
IndianRo ckDa m
Hamm ondRese rvoir
Lak eMa rbu rg
Wa n etaLa ke
Whitne yPointLak e
Lak eAldre d
Fo ste r Jo seph Sa yers Da mBla n cha rd Reserv o ir
Har vey sLa k e
Lam okaLa k e
Curwen svilleLak e
Cry sta lLa ke
Mud dy Ru nReserv oir
DeHa rtReservo ir
Oc tora roLak e
Cay utaLa ke
Lak eAgu sta
LakeMe ade
Ros e Va lleyLak e
Co new agoLa ke
H un tsv illeR eservo ir
Midd le Cr eekLa ke
Pikes Cre ekRese rvoir
Ark p ort Da m
Ea to nRes ervo ir
Lak eCa rey
Sha wn eeLa k e
La keWilliam s
LakeChillisq u aqu e
Blac k Mo sha nn onLak e
Almon dLake
Ea st S idn eyLak e
Stillwa te rLa ke
Sh ave r C reekDam
Alvin R. Bu sh D am/Ke ttle Creek La ke
Little Pin eCre ek Da m
La keRedma n
Nan ti
coke
Cr.
Raysto wnLa ke
SAFE HARBO RD AM
CONOWING ODAM
HO LTWO OD DAM
Ge o rge B. Steve nso n Da m/
First Fork Sinn em aho n in gCre ek Reser vo ir
Letter ken nyRese rvoir
Branch
West
River
W hite Deer Hole Creek
Larr
ys C
reek
Y ou ng
Woma
ns Cr .
Mo squit o Cr.
Bowma n
C
r.Mehoop
any C
reek
SUNBURY
West
Chillisqu
aque Cr eek
NEW YORKPENNSYLVANIA
Che s
apea
ke Ba
y
SUSQUEH ANN A RIVER BASINSUSQUEH AN N A RIVER BASINTime -of -Tr a vel
MARYLAND
WA TE R B OD Y SO UR CE : SRB C, 20 01 , sc al e 1: 2 4,0 00 , U. S . Depar t me nt o f C om mer c e, B ur eau oft h e Census , Geo gr aphy Di v is io n T IGE R/ L ine F il es, 2 00 0, sca l e 1 :1 0 0,0 00 an d o t h er so ur ce sPROJE CTI ON: Univer se Tr ansver se M er cat o r 8 3 Z on e 18DI S CLA IM ER: Int end ed f o r E duc at i o nal D ispl ay Pu r po ses O nl y 20 0 1
SRBC
(14
0b) 0
1-2
3-20
02
1:2000000
8
S UBB A S IN S OURCE : Un it ed S t at es Geo l og ica l S ur v ey (USG S), 1 99 6, sca l e 1 :2 4 ,00 0 S TREA M SO URCE: U. S . Depar t me nt o f Com mer c e, B u rea u o f t h e Cens us, Geo gr aph y D iv is i on TIGE R/ Lin e F il es , 2 00 0, scal e 1 :1 00 ,0 0 0 an d E nv ir o n men t al Reso ur ce s Resear c h I ns t it ut e (E RRI ), 1 99 6 , sc al e 1 :2 4, 00 0
SUSQ HEHA N NA R IVER BA SI NSUBB ASIN S
CH EMU NG
JU NIA TALOW ER SU SQU EH AN N A
MID D LE S USQUE HAN N A
UPPE R SUSQU EH AN N A
WE ST BRA NC H S USQU EHAN N A
COU NT Y
#S PO PU L ATIO N C ENT ER
L EGEND
SUSQUEHAN NARIVER BASIN
$T USGS Gag e
WaverlyChemung
DanvilleLewisburg
Newport
Marietta
Towanda
Sunbury
Harrisburg
Figure 6. Locations Used for time-of-Travel Estimates
17
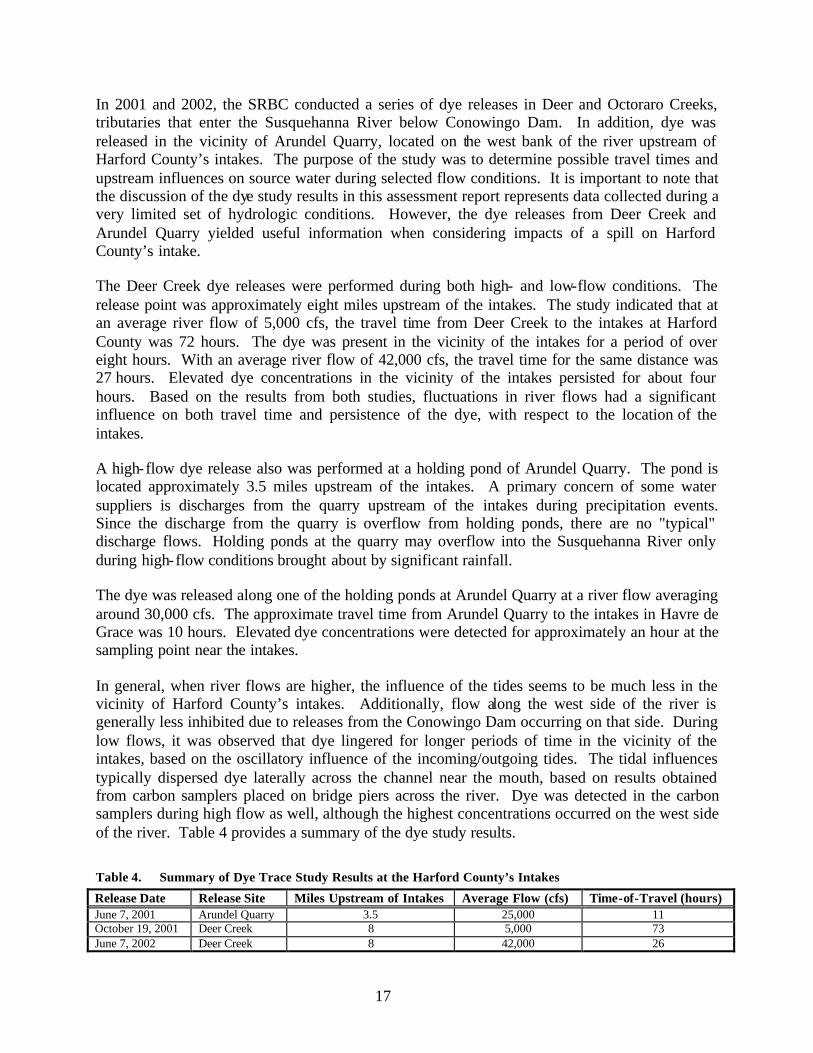
In 2001 and 2002, the SRBC conducted a series of dye releases in Deer and Octoraro Creeks, tributaries that enter the Susquehanna River below Conowingo Dam. In addition, dye was released in the vicinity of Arundel Quarry, located on the west bank of the river upstream of Harford County’s intakes. The purpose of the study was to determine possible travel times and upstream influences on source water during selected flow conditions. It is important to note that the discussion of the dye study results in this assessment report represents data collected during a very limited set of hydrologic conditions. However, the dye releases from Deer Creek and Arundel Quarry yielded useful information when considering impacts of a spill on Harford County’s intake. The Deer Creek dye releases were performed during both high- and low-flow conditions. The release point was approximately eight miles upstream of the intakes. The study indicated that at an average river flow of 5,000 cfs, the travel time from Deer Creek to the intakes at Harford County was 72 hours. The dye was present in the vicinity of the intakes for a period of over eight hours. With an average river flow of 42,000 cfs, the travel time for the same distance was 27 hours. Elevated dye concentrations in the vicinity of the intakes persisted for about four hours. Based on the results from both studies, fluctuations in river flows had a significant influence on both travel time and persistence of the dye, with respect to the location of the intakes. A high-flow dye release also was performed at a holding pond of Arundel Quarry. The pond is located approximately 3.5 miles upstream of the intakes. A primary concern of some water suppliers is discharges from the quarry upstream of the intakes during precipitation events. Since the discharge from the quarry is overflow from holding ponds, there are no "typical" discharge flows. Holding ponds at the quarry may overflow into the Susquehanna River only during high-flow conditions brought about by significant rainfall. The dye was released along one of the holding ponds at Arundel Quarry at a river flow averaging around 30,000 cfs. The approximate travel time from Arundel Quarry to the intakes in Havre de Grace was 10 hours. Elevated dye concentrations were detected for approximately an hour at the sampling point near the intakes. In general, when river flows are higher, the influence of the tides seems to be much less in the vicinity of Harford County’s intakes. Additionally, flow along the west side of the river is generally less inhibited due to releases from the Conowingo Dam occurring on that side. During low flows, it was observed that dye lingered for longer periods of time in the vicinity of the intakes, based on the oscillatory influence of the incoming/outgoing tides. The tidal influences typically dispersed dye laterally across the channel near the mouth, based on results obtained from carbon samplers placed on bridge piers across the river. Dye was detected in the carbon samplers during high flow as well, although the highest concentrations occurred on the west side of the river. Table 4 provides a summary of the dye study results. Table 4. Summary of Dye Trace Study Results at the Harford County’s Intakes
Release Date Release Site Miles Upstream of Intakes Average Flow (cfs) Time-of-Travel (hours) June 7, 2001 Arundel Quarry 3.5 25,000 11 October 19, 2001 Deer Creek 8 5,000 73 June 7, 2002 Deer Creek 8 42,000 26
18
Overall, the flow controlled by the Conowingo Dam’s generation station appeared to be the single most dominant influence. The flows of the two major tributaries downstream of the dam, Octoraro and Deer Creeks, typically represent less than one percent of the flow generated by the dam, even at high flows. Dye concentrations also were typically 5 to 8 orders of magnitude less at the downstream intake than at the release sites. This dilution was an obvious effect of flows from the dam, as well. C. Land Use Characteristics
1. Analysis of land use types for the assessment area
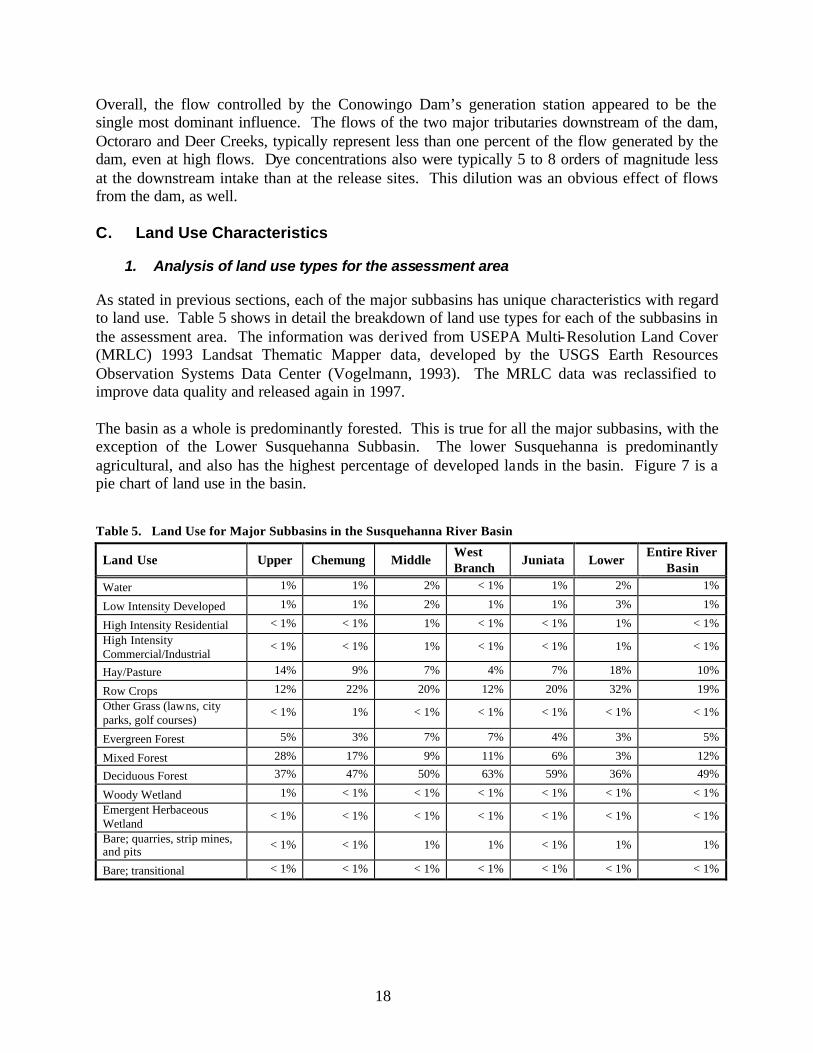
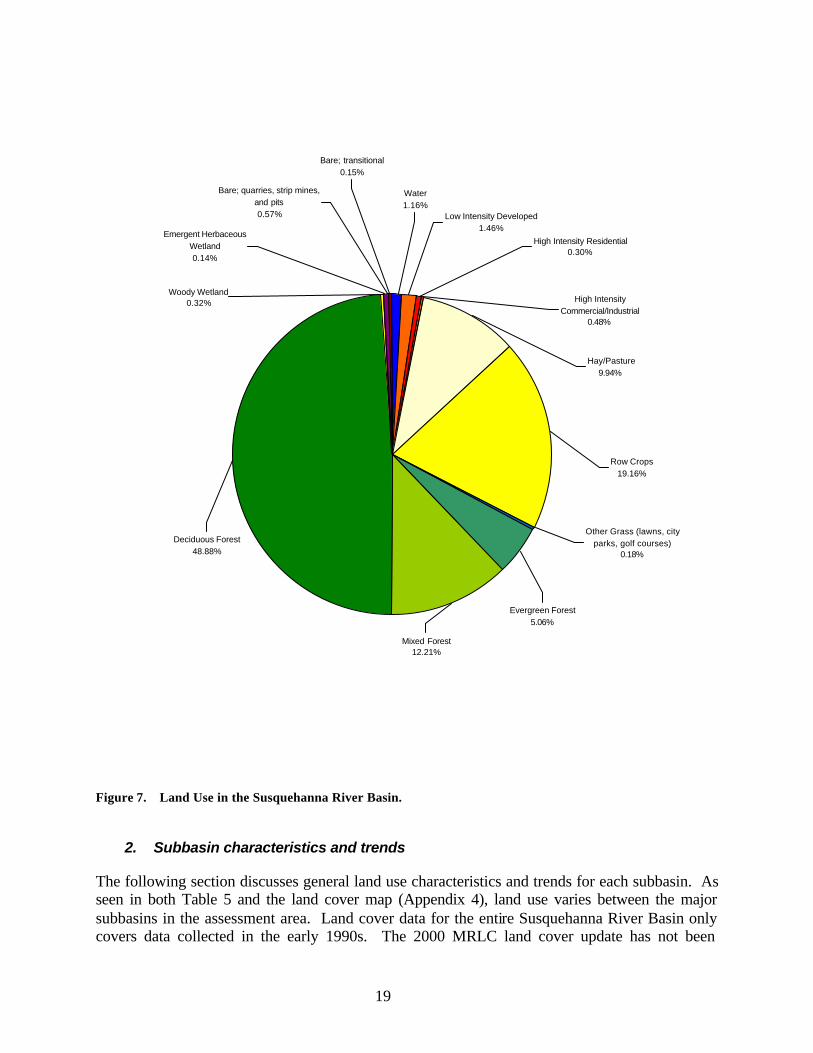
As stated in previous sections, each of the major subbasins has unique characteristics with regard to land use. Table 5 shows in detail the breakdown of land use types for each of the subbasins in the assessment area. The information was derived from USEPA Multi-Resolution Land Cover (MRLC) 1993 Landsat Thematic Mapper data, developed by the USGS Earth Resources Observation Systems Data Center (Vogelmann, 1993). The MRLC data was reclassified to improve data quality and released again in 1997. The basin as a whole is predominantly forested. This is true for all the major subbasins, with the exception of the Lower Susquehanna Subbasin. The lower Susquehanna is predominantly agricultural, and also has the highest percentage of developed lands in the basin. Figure 7 is a pie chart of land use in the basin. Table 5. Land Use for Major Subbasins in the Susquehanna River Basin
Land Use Upper Chemung Middle West Branch
Juniata Lower Entire River
Basin Water 1% 1% 2% < 1% 1% 2% 1%
Low Intensity Developed 1% 1% 2% 1% 1% 3% 1%
High Intensity Residential < 1% < 1% 1% < 1% < 1% 1% < 1% High Intensity Commercial/Industrial
< 1% < 1% 1% < 1% < 1% 1% < 1%
Hay/Pasture 14% 9% 7% 4% 7% 18% 10%
Row Crops 12% 22% 20% 12% 20% 32% 19% Other Grass (lawns, city parks, golf courses)
Figure 7. Land Use in the Susquehanna River Basin.
2. Subbasin characteristics and trends
The following section discusses general land use characteristics and trends for each subbasin. As seen in both Table 5 and the land cover map (Appendix 4), land use varies between the major subbasins in the assessment area. Land cover data for the entire Susquehanna River Basin only covers data collected in the early 1990s. The 2000 MRLC land cover update has not been
20
released as of the date of this assessment report. However, U.S. Census Bureau data collected on populations surveyed in 1990 and 2000 were used to assist with the general trends observed in each of the subbasins. In the Upper Susquehanna Subbasin, much of the land is steeply sloped with hills and ridges dominated by forested land. Agricultural land occupies the lower lying areas possessing more productive soil types. The major population centers in the subbasin are Binghamton, Johnson City, Endicott, Cortland, and Oneonta, N.Y. Small villages exist throughout the subbasin. Census data indicates that the population in the subbasin has decreased slightly during 1990 to 2000. The Chemung Subbasin is composed of terrain that is typical of glaciated watersheds. Forested land occupies the steep hillsides, while flat hilltops and valleys are used for agriculture. Agricultural activity is almost evenly split between cropland and pasture grazing. The major population centers in the subbasin are Elmira, Corning, and Hornell, N.Y. Populations within the subbasin did not significantly change between the 1990 and 2000 census. The Middle Susquehanna Subbasin terrain has many high plateaus that are separated by steep valleys. This subbasin is a highly urbanized coal-mining region. Much of the mining region is abandoned lands; however, remining activity has been increasing with technological advances in extraction methods. The major population centers are Scranton, Wilkes-Barre, Carbondale, and Sunbury, Pa. The Scranton/Wilkes-Barre corridor represents a very intensely urbanized area, extending over 20 miles in the Lackawanna Valley. The West Branch Susquehanna Subbasin is predominantly covered by forested land with low rolling hills. Mining, urban, and agricultural areas are dispersed throughout the subbasin. The major population centers are State College, Lock Haven, Williamsport, Clearfield, and Lewisburg, Pa. Census data indicates the population has increased by approximately 5 percent in the subbasin over the last decade. Most of this increase is focused in the Nittany Valley, surrounding the State College area. Development has increased rapidly with the addition of housing at the expense of traditionally agricultural areas. The Juniata Subbasin is composed of terrain with mountains and long, narrow valleys. Agriculture is common in the valley portions of the subbasin where soils are more productive, while the steep mountains are primarily forested. The subbasin is predominantly rural. The major population centers in the subbasin are Altoona, Hollidaysburg, Bedford, Lewistown, Huntingdon, and Mount Union, Pa. The subbasin is facing increasing development pressure with the addition and improvement of several travel corridors. Interstate 99 is currently being built to connect Interstate Routes 76/70 and 80, which run parallel to each other in an east to west direction across Pennsylvania. State Route 322, which travels northwest into the subbasin from Harrisburg was recently expanded to accommodate four lanes of traffic. With this expansion, the increased accessibility to the Harrisburg Metropolitan Area has spurred development in the eastern portions of the basin. With respect to land use distribution, the Lower Susquehanna Subbasin contrasts greatly in comparison to the other subbasins. Fifty percent of the subbasin is dedicated to agricultural
21
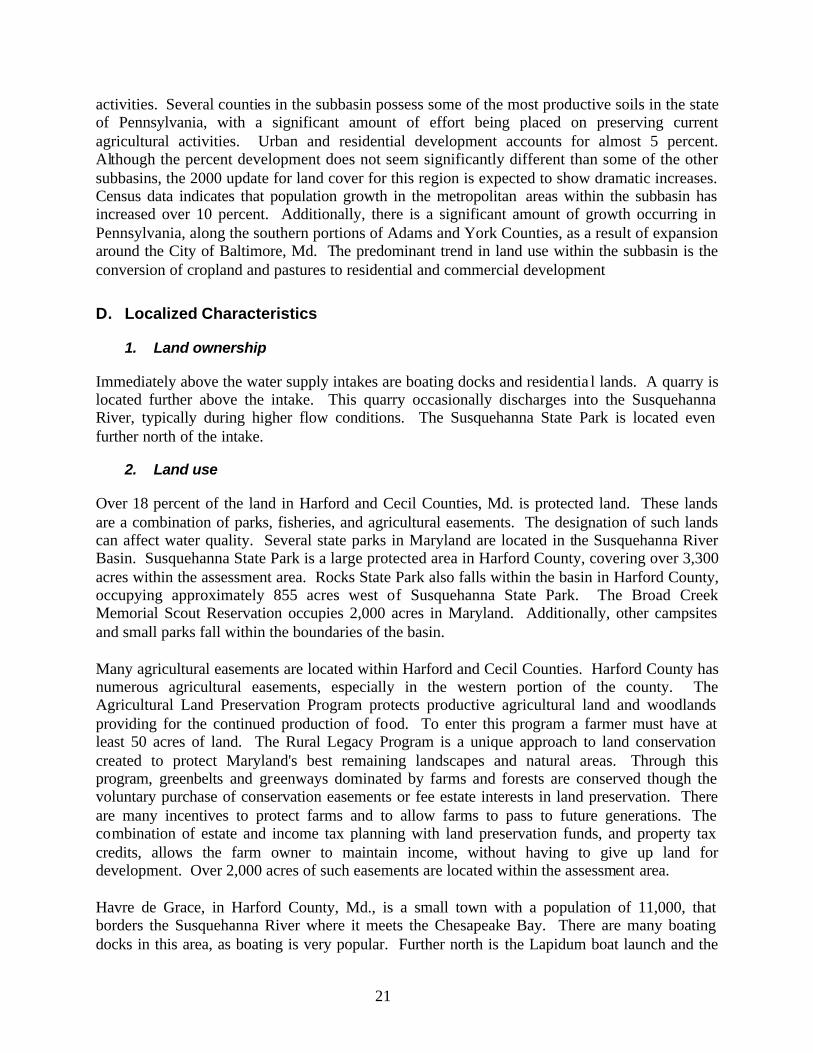
activities. Several counties in the subbasin possess some of the most productive soils in the state of Pennsylvania, with a significant amount of effort being placed on preserving current agricultural activities. Urban and residential development accounts for almost 5 percent. Although the percent development does not seem significantly different than some of the other subbasins, the 2000 update for land cover for this region is expected to show dramatic increases. Census data indicates that population growth in the metropolitan areas within the subbasin has increased over 10 percent. Additionally, there is a significant amount of growth occurring in Pennsylvania, along the southern portions of Adams and York Counties, as a result of expansion around the City of Baltimore, Md. The predominant trend in land use within the subbasin is the conversion of cropland and pastures to residential and commercial development
D. Localized Characteristics
1. Land ownership
Immediately above the water supply intakes are boating docks and residentia l lands. A quarry is located further above the intake. This quarry occasionally discharges into the Susquehanna River, typically during higher flow conditions. The Susquehanna State Park is located even further north of the intake.
2. Land use
Over 18 percent of the land in Harford and Cecil Counties, Md. is protected land. These lands are a combination of parks, fisheries, and agricultural easements. The designation of such lands can affect water quality. Several state parks in Maryland are located in the Susquehanna River Basin. Susquehanna State Park is a large protected area in Harford County, covering over 3,300 acres within the assessment area. Rocks State Park also falls within the basin in Harford County, occupying approximately 855 acres west of Susquehanna State Park. The Broad Creek Memorial Scout Reservation occupies 2,000 acres in Maryland. Additionally, other campsites and small parks fall within the boundaries of the basin. Many agricultural easements are located within Harford and Cecil Counties. Harford County has numerous agricultural easements, especially in the western portion of the county. The Agricultural Land Preservation Program protects productive agricultural land and woodlands providing for the continued production of food. To enter this program a farmer must have at least 50 acres of land. The Rural Legacy Program is a unique approach to land conservation created to protect Maryland's best remaining landscapes and natural areas. Through this program, greenbelts and greenways dominated by farms and forests are conserved though the voluntary purchase of conservation easements or fee estate interests in land preservation. There are many incentives to protect farms and to allow farms to pass to future generations. The combination of estate and income tax planning with land preservation funds, and property tax credits, allows the farm owner to maintain income, without having to give up land for development. Over 2,000 acres of such easements are located within the assessment area. Havre de Grace, in Harford County, Md., is a small town with a population of 11,000, that borders the Susquehanna River where it meets the Chesapeake Bay. There are many boating docks in this area, as boating is very popular. Further north is the Lapidum boat launch and the
22
Susquehanna State Park. Four bridges cross the river in Maryland (Route 40, Interstate 95, Route 1, and a railroad bridge). Cecil County, Md. is not as populated as Harford County, Md. North of the Perry Point VA Hospital is the Town of Perryville. Some boat launch sites exist in this area. Port Deposit is the next small town that borders the river before Conowingo Dam. The Town of Rising Sun is even further northeast of the intake and lies within the Octoraro drainage basin.
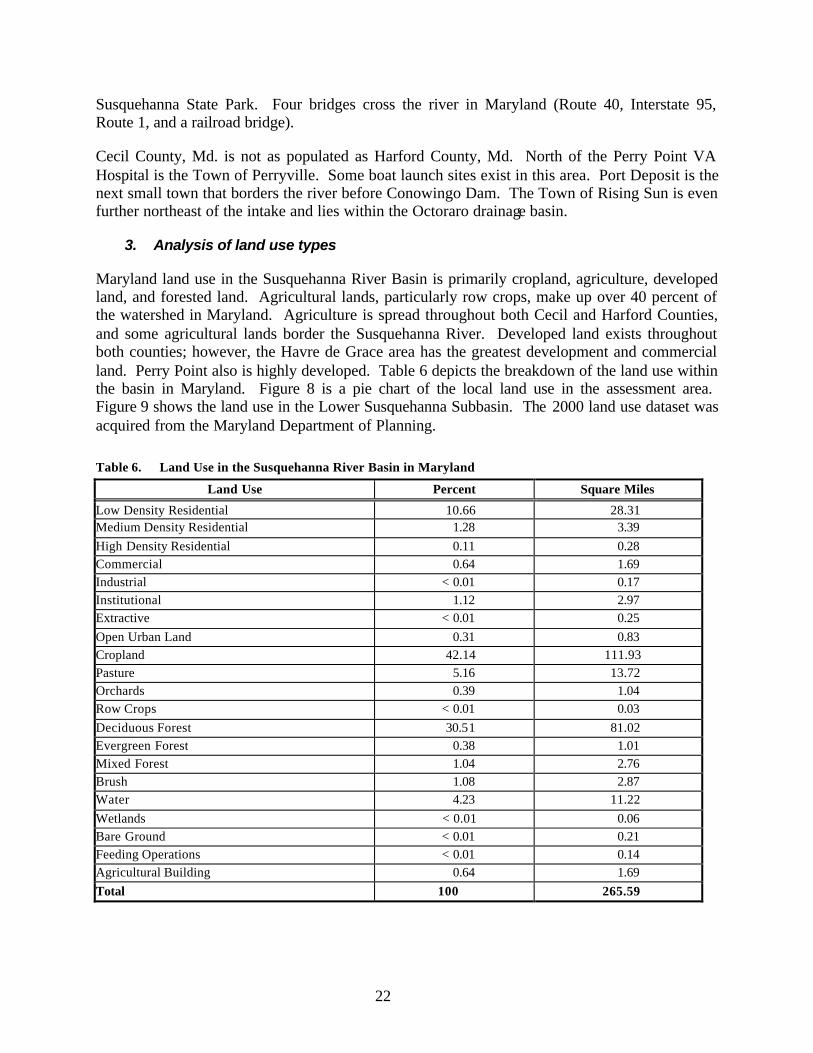
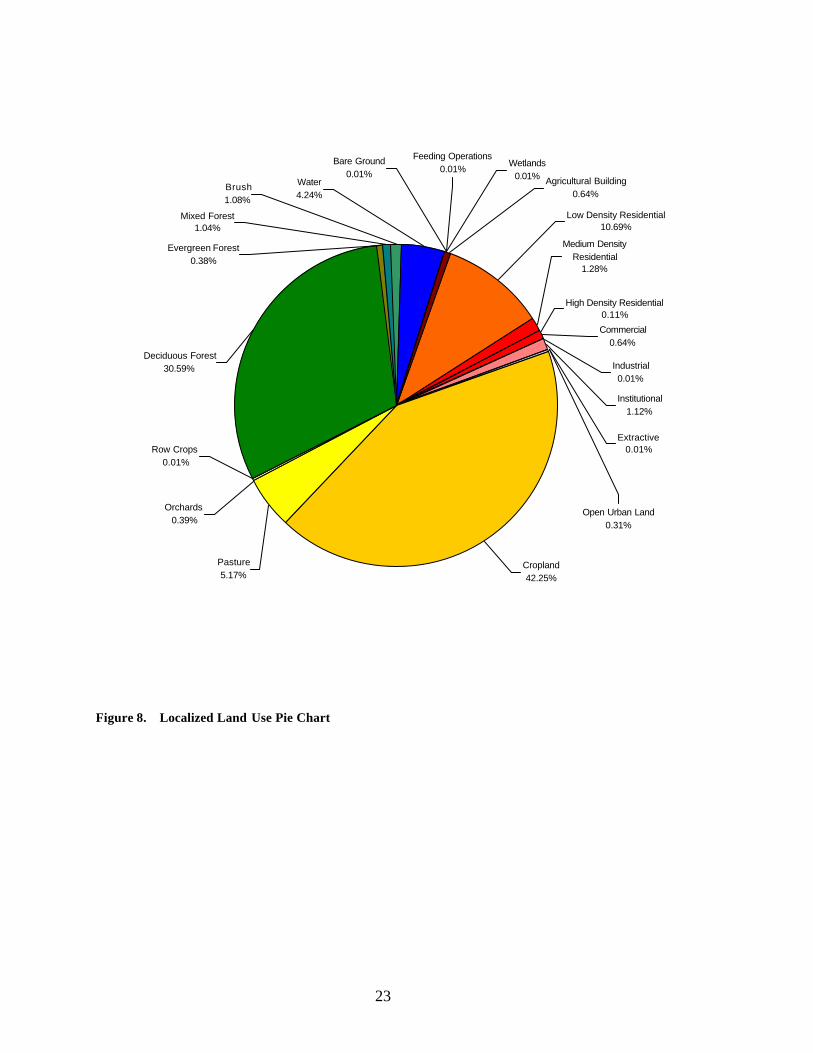
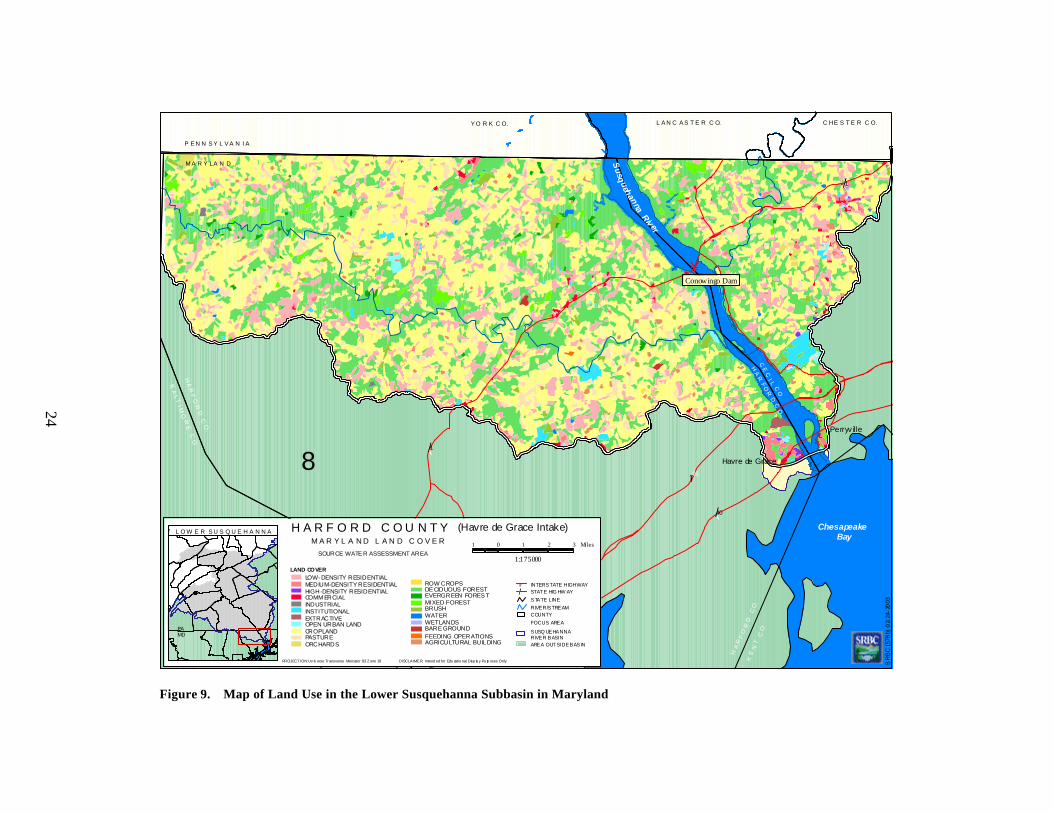
3. Analysis of land use types
Maryland land use in the Susquehanna River Basin is primarily cropland, agriculture, developed land, and forested land. Agricultural lands, particularly row crops, make up over 40 percent of the watershed in Maryland. Agriculture is spread throughout both Cecil and Harford Counties, and some agricultural lands border the Susquehanna River. Developed land exists throughout both counties; however, the Havre de Grace area has the greatest development and commercial land. Perry Point also is highly developed. Table 6 depicts the breakdown of the land use within the basin in Maryland. Figure 8 is a pie chart of the local land use in the assessment area. Figure 9 shows the land use in the Lower Susquehanna Subbasin. The 2000 land use dataset was acquired from the Maryland Department of Planning. Table 6. Land Use in the Susquehanna River Basin in Maryland
Land Use Percent Square Miles
Low Density Residential 10.66 28.31 Medium Density Residential 1.28 3.39 High Density Residential 0.11 0.28 Commercial 0.64 1.69 Industrial < 0.01 0.17 Institutional 1.12 2.97 Extractive < 0.01 0.25 Open Urban Land 0.31 0.83 Cropland 42.14 111.93 Pasture 5.16 13.72 Orchards 0.39 1.04 Row Crops < 0.01 0.03 Deciduous Forest 30.51 81.02 Evergreen Forest 0.38 1.01 Mixed Forest 1.04 2.76 Brush 1.08 2.87 Water 4.23 11.22 Wetlands < 0.01 0.06 Bare Ground < 0.01 0.21 Feeding Operations < 0.01 0.14 Agricultural Building 0.64 1.69 Total 100 265.59
23
Cropland42.25%
Open Urban Land0.31%
Institutional1.12%
Extractive0.01%
Industrial0.01%
Commercial0.64%
High Density Residential0.11%
Medium Density Residential
1.28%
Low Density Residential10.69%
Agricultural Building0.64%
Pasture5.17%
Row Crops0.01%
Orchards0.39%
Deciduous Forest30.59%
Evergreen Forest0.38%
Mixed Forest1.04%
Brush1.08%
Water4.24%
Bare Ground0.01%
Wetlands0.01%
Feeding Operations0.01%
Figure 8. Localized Land Use Pie Chart
PROJECT ION: Un iv erse Tr ansverse Mercator 83 Z one 18 DISCLAIMER: Intend ed for Edu catio nal Disp la y Pu rp oses Only
1 0 1 2 3 Miles
1:175000
H A R F O R D C O U N T Y M A R Y L A N D L A N D C O V E R
SOURCE WATE R ASSESSMENT AREA
8
LAND COVERLOW- DENSITY RESIDENTIALMEDIUM-DENSITY RESIDENTIALHIGH-DENSITY RESIDENTIALCOMM ERCIALINDUSTRIALINSTITUTIONAL
OPEN URBAN LANDCROPLANDPASTUREORCHARDS
EXTRACTIVE
ROW CROPSDE CIDUOUS FORESTEVERGREEN FORES TMIXED FORESTBRUSHWATERWETLANDSBARE GROUNDFEEDING OPERATIONSAGRICULTURAL BUILDING
STAT E HIG HW AYINTERSTATE HIGHWAY
(/.-,
RIVER/STREAM
FOCUS AREA
COUNTY
AREA OUT SIDE BASIN
SUSQ UEHANNA RIVER BASIN
STATE LINE
PA MD
P E N N S Y L V A N I A
M A R Y L A N D
Chesapeake Bay
(/1
.-,95
(/40
¥
Havre de Grace
Perryv ille
(/1
Conowingo Dam
H A
R F
O R
D C
O.
B A L T
I M O
R E C
O.
K E
N T
C
O.
H A
R F
O R
D
C O
.
L O W E R S U S Q U E H A N N A
L A N C A S T E R C O.Y O R K C O. C H E S T E R C O.
H A
R F O
R D C
O.
C E
C I L C
O.
Susquehanna River
SR
BC
(57
8b)
02-
24-2
003
(Havre de Grace Intake)
Figure 9. Map of Land Use in the Lower Susquehanna Subbasin in Maryland
24
25
E. Subwatersheds of Concern
Water quality varies between the major subbasins due to a number of characteristics associated with land use, soils, and geology. Under the federal Clean Water Act, states are required to assess streams and lakes within their jurisdiction and list waterbodies that do not meet water quality standards. The lists are called the Section 303(d) List, and are published every two years on even numbered years. The following section summarizes major influences on water quality within each of the major subbasins and identifies watersheds of concern, based on SRBC subbasin surveys and state 303(d) lists (Appendix 2). Overall, the Upper Susquehanna Subbasin has excellent water quality conditions. Most sample sites were found to be supporting healthy water quality, biological conditions, and habitat. Some areas for concern include Tioughnioga River Watershed, Salt Lick Creek, and Nanticoke Creek, which all had slightly impaired sample sites. The water quality impairments that do exist tend to be associated with atmospheric deposition, particularly acid rain and mercury from air pollution. The Chemung Subbasin has five major watersheds. Much of the Tioga River Watershed is severely impacted by AMD. Biological conditions are greatly impaired on most of the mainstem. The Cowanesque River Watershed has slight impairments due to excessive nutrients from wastewater discharges and agricultural runoff. Overall, the Canisteo River Watershed is fairly healthy. There is a small area with urban influences. The Cohocton River Watershed has poor water quality due to the agricultural activities throughout the watershed. A subbasin survey was completed for the Middle Susquehanna Subbasin in 2001. The survey found the watersheds in the upper half of the basin, such as Towanda, Tunkhannock, and Meshoppen Creeks to be fairly healthy. None of the watersheds are considered to be extremely degraded in water quality, biology, or habitat. The watersheds in the lower half of the basin, which include the Lackawanna River, Nescopeck Creek, and Catawissa Creek, are greatly affected by AMD and urban influences. Smaller tributaries such as Solomons, Nanticoke, and Newport Creeks are strongly impacted by urban influences and AMD and provide very poor quality water to the Susquehanna River. Most of the sample sites on the mainstem in the middle Susquehanna either had water quality of low or nonexistent acidity and high organic carbon concentrations; or had high levels of nutrients and AMD inputs. The AMD and nutrient affected sites were generally located between Wilkes-Barre and Sunbury. Few sites had an increase in ammonia and decrease in sulfate due to major point-source inputs. The West Branch Susquehanna Subbasin is largely affected by AMD. Over 100 miles of the West Branch Susquehanna River between the towns of Clearfield and Lock Haven have no aquatic life due to AMD. The pH in this section of river is as low as 3.2 at the town of Karthaus. Another 100 miles of the river varies in degree of degradation to AMD. Water quality ranges from fair to good and some life is found in the biological communities. The lower 50 miles of the West Branch is the only section of the river that is free from the effects of AMD. The tributaries to the West Branch Susquehanna River have a tremendous impact on its water quality. Clearfield Creek negatively impacts the West Branch due to its large flow and its degraded water quality. Alder Run is another tributary with a negative impact on the West Branch. Water quality is poor and the biological conditions are stressed. Moshannon Creek contributes highly acidic water and the greatest acid load of all of the tributaries to the West Branch. The
26
Sinnemahoning Creek is the largest tributary to the West Branch. One of its branches is severely degraded by AMD. Chest Creek discharges beneficial water into the upper West Branch, however the West Branch does not receive a major contribut ion of beneficial water quality until Bald Eagle Creek at Lock Haven. From Lock Haven down, the river begins to show signs of improving water quality. Water quality conditions in the Juniata Subbasin are fairly good. However, there are some watersheds such as the Frankstown Branch, Beaverdam Branch and Kishacoquillas Creek that contribute poor water quality to the Juniata River. A section of the Frankstown Branch is impaired by a point-source discharger. The Beaverdam Branch has poor water quality due to AMD, point sources, and runoff from the Altoona/Hollidaysburg area. Several sections of the Kishacoquillas Creek are impaired due to agricultural impacts. The lower section of the Kishacoquillas Creek is moderately impaired due to urban runoff during storm events or point-source discharges. In the lower Susquehanna River Basin, the major sources of contamination are agricultural runoff, AMD, urban runoff, municipal and industrial waste discharges, atmospheric deposition, and septic discharges. Nutrients and siltation from agricultural runoff and streambank erosion have been identified as pollutants causing designated use impairments throughout the subbasin. In many places, little to no riparian buffer zone exists along pastures and croplands. Livestock also have unlimited access to streambanks in many parts of the subbasin. Fertilizer and animal manure contribute to agricultural related contamination. The Chickies Creek and Conestoga River, both in Lancaster County, have the highest and second highest animal- loading indices, respectively, in Pennsylvania. AMD contributes sediment and metals to surface waters, particularly in the northern portions of the subbasin. Urban runoff and municipal and industrial discharges contribute high concentrations of nutrients, heavy metals, organic contaminants, and other materials to surface waters. On- lot septic systems contribute nutrients to the basin. Degradation of surface water also is caused by atmospheric deposition and natural conditions. Precipitation in Pennsylvania has low pH, which can affect poorly buffered headwater streams. Emissions of sulfur and nitrogen oxides have resulted in some of the most acidic precipitation in the nation.
27
V. WATER QUALITY DATA
Different sources of water quality data were reviewed for the Susquehanna River Basin. Data were collected and reviewed from the water suppliers’ monthly operating reports, SRBC, MDE, Maryland Department of Natural Resources (MD DNR), and USGS. Water quality data from the Susquehanna River will be compared with maximum contaminant levels (MCLs) set by the USEPA to ensure safe drinking water.
A. Review and Discussion of Existing Plant Data
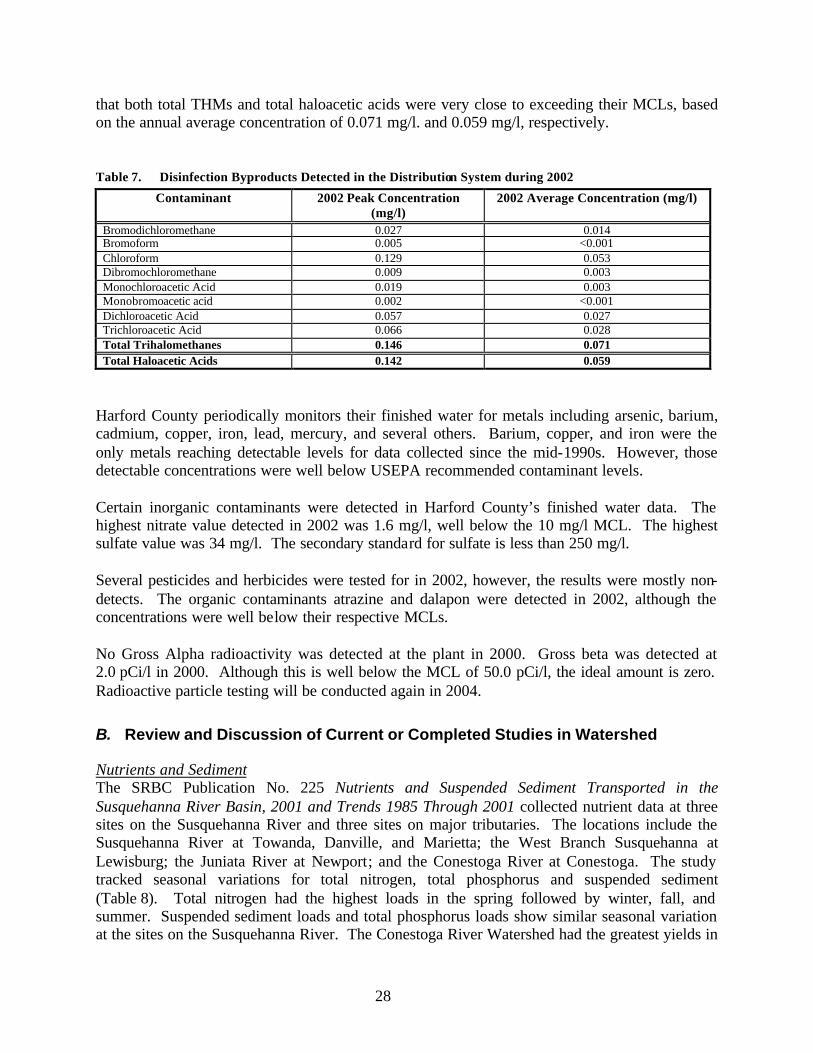
Harford County performs water quality tests on both finished and raw water. In 2001, Harford County had no drinking water standard violations for finished water. Raw Water Data Raw water turbidity, alkalinity, and pH are parameters that are tested daily. Turbidity in the river is occasionally high, especially following a heavy rain event. The average turbidity was about 8 Nephelometric Turbidity Units (NTU) in 2002, although the turbidity ranged from 1 NTU to 9 NTU that year. However, as shown in Figure 3 displaying 1996 plant data, turbidity levels can easily exceed 100 NTU during high-flow events or periods of intense rainfall. The average pH in 2002 was about 7.8, while the average alkalinity was about 66 mg/l. Harford County does not collect raw water bacteria data. However, Havre de Grace does collect bacteria data regularly for their intakes in the immediate vicinity of Harford County’s intake. It is important to note that in 2001, there were several occasions when the fecal coliform concentrations in the source water samples, collected and measured by Havre de Grace, exceeded MDE’s water quality criteria. The water quality criteria require fecal coliform densities not to exceed a geometric mean of 200 per 100 ml, based on a minimum of not less than five samples taken over any 30-day period. In addition, there were several violations of the additional criteria requiring fecal coliform densities not to exceed 400 per 100 ml for 10 percent of the total number of samples taken during a 30-day period. Most of the criteria violations occurred during the January through June timeframe. Finished Water Data Disinfection byproducts (DBPs) are sampled within the distribution system by Harford County personnel, and the analyses are submitted to MDE. Harford County data collected during 2001 and 2002 indicated that total trihalomethanes (THMs) ranged from 0.018 mg/l. to 0.146 mg/l. Total haloacetic acid results ranged from 0.022mg/l to 0.142 mg/l during the same timeframe. The MCLs for total THMs and total haloacetic acids is 0.08 mg/l and 0.06 mg/l, respectively, with compliance determined from the running annual average. DBPs information from 2002 for Harford County is shown in Table 7. The data represents samples taken from the distribution system. However, it is important to note that the data does not represent water exclusively from the Susquehanna River, but samples taken during use of the river as a source. Harford County has several sources, some of which include ground-water wells. The sample results determined to be from ground-water sources were not included in the data reviewed. Overall, the data shows
28
that both total THMs and total haloacetic acids were very close to exceeding their MCLs, based on the annual average concentration of 0.071 mg/l. and 0.059 mg/l, respectively. Table 7. Disinfection Byproducts Detected in the Distribution System during 2002
Harford County periodically monitors their finished water for metals including arsenic, barium, cadmium, copper, iron, lead, mercury, and several others. Barium, copper, and iron were the only metals reaching detectable levels for data collected since the mid-1990s. However, those detectable concentrations were well below USEPA recommended contaminant levels. Certain inorganic contaminants were detected in Harford County’s finished water data. The highest nitrate value detected in 2002 was 1.6 mg/l, well below the 10 mg/l MCL. The highest sulfate value was 34 mg/l. The secondary standard for sulfate is less than 250 mg/l. Several pesticides and herbicides were tested for in 2002, however, the results were mostly non-detects. The organic contaminants atrazine and dalapon were detected in 2002, although the concentrations were well below their respective MCLs. No Gross Alpha radioactivity was detected at the plant in 2000. Gross beta was detected at 2.0 pCi/l in 2000. Although this is well below the MCL of 50.0 pCi/l, the ideal amount is zero. Radioactive particle testing will be conducted again in 2004.
B. Review and Discussion of Current or Completed Studies in Watershed
Nutrients and Sediment The SRBC Publication No. 225 Nutrients and Suspended Sediment Transported in the Susquehanna River Basin, 2001 and Trends 1985 Through 2001 collected nutrient data at three sites on the Susquehanna River and three sites on major tributaries. The locations include the Susquehanna River at Towanda, Danville, and Marietta; the West Branch Susquehanna at Lewisburg; the Juniata River at Newport; and the Conestoga River at Conestoga. The study tracked seasonal variations for total nitrogen, total phosphorus and suspended sediment (Table 8). Total nitrogen had the highest loads in the spring followed by winter, fall, and summer. Suspended sediment loads and total phosphorus loads show similar seasonal variation at the sites on the Susquehanna River. The Conestoga River Watershed had the greatest yields in
29
pounds per acre per year of total nitrogen, total phosphorus, and suspended sediment for all seasons. The long-term yields of total nitrogen increased in the Susquehanna River in a downstream order from Towanda to Marietta. The increase is possibly due to a larger amount of agricultural lands and sewage treatment plants in the lower Susquehanna. Overall, the Susquehanna River system is phosphorus limited. Long-term yields for total phosphorus at the sites on the Susquehanna River do not show a uniform seasonal pattern. Suspended sediment long-term yields decreased in downstream order except during the summer at Marietta. Overall, there were significant improving trends at all six stations for total nitrogen, total phosphorus and suspended sediment. The USGS Lower Susquehanna National Water Quality Assessment (NAWQA) Study (1992-1995) found that nitrate concentrations exceeded the USEPA MCL (10 mg/l) in streams located in agricultural areas that are underlain by limestone. These areas have a strong correlation between the manure applications rate and nitrate concentrations. The study also found that streams located in agricultural areas that are underlain by sandstone, shale, and crystalline bedrock contribute large amounts of nitrate. Animal manure used as fertilizer for agriculture was determined to be the main source of nitrogen to the Susquehanna River. Manure application had a strong correlation with nitrate levels in the streams. The study found that there were higher concentrations in streams than in ground water in limestone urban areas. Tributaries like Mill Creek, Lancaster County, that are in limestone areas had nitrate levels around 10 mg/l. There were some seasonal fluctuations in these concentrations. Nitrate concentrations were less than 2 mg/l in the Susquehanna River at Harrisburg. Nitrate concentrations in limestone areas are generally higher during the spring. Overall, nitrate was found in 98 percent of the samples. Ninety-two percent of the samples detected nitrate in concentrations above 0.3 mg/l. Streams with these levels of nitrates encourage excessive algae growth. The Susquehanna River transports about 25 percent of the sediment, 40 percent of the phosphorus, and nearly 66 percent of the nutrient load to the Chesapeake Bay. Three hydroelectric dams on the lower Susquehanna River form the reservoir system, which consists of Lake Clarke, Lake Aldred and the Conowingo Reservoir. Since their construction in the early 1900s, these reservoirs have been filling with sediment and nutrients. Lake Clarke and Lake Aldred, the two upper reservoirs, have reached the ir capacity to store sediment and no longer trap sediments and nutrients. The Conowingo Reservoir currently traps 2 percent of the total nitrogen load, 40 percent of the total phosphorus load, and 70 percent of the suspended-sediment load. Concentrations of total nitrogen collected from bottom sediments averaged about 3,600 milligram per kilogram (mg/kg) in the area of the reservoir within 1-mile upstream of the Conowingo Dam. The average concentration for total phosphorus in this same area was about 850 mg/kg. There is about 29,000 acre-ft of sediment storage capacity left in the reservoir. There is no storage capacity left in the Conowingo Reservoir from its upper end to about 28,000 feet upstream of the Conowingo Dam. Once the reservoir system reaches capacity, and if conditions remain constant, there will be a 2 percent average yearly increase in total nitrogen, a 70 percent average yearly increase in total phosphorus, and a 250 percent average yearly increase in suspended sediment entering the Chesapeake Bay. With Conowingo Dam no longer mitigating the effects of nutrient and sediment loads, downstream water suppliers such as Harford County
30
could potentially see significant changes in water quality conditions at the intake. Such conditions could result in elevated turbidity levels, an increase in algal-related problems, or increased risk of microbial contamination.
Table 8. Seasonal Mean Water Discharges and Loads of Nutrients and Suspended Sediment, Calendar Year 2001
Volatile Organic Compounds The NAWQA study found that VOCs were more frequently detected in ground water of urban areas than in agricultural areas. This is likely due to the numerous sources of VOCs found in urban areas. These sources include spills, improper disposal, runoff from pavement, leaks from underground storage tanks, atmospheric deposition, and leaking sewer lines. This study indicated that contaminated ground water flows from springs into streams. The detection levels of VOCs in wells ranged from 0.2 to 1.0 ug/l. These levels were detected in 23 of the 60 compounds sampled. However, there were no significant concentrations detected in surface waters within the lower Susquehanna. Synthetic Organic Compounds Pesticide concentrations in the lower Susquehanna rarely exceeded the drinking water standards. Overall, the concentrations of individual pesticides were quite low. Forty-seven insecticides and herbicides were tested. Only 22 of over 500 samples detected pesticides at levels greater than 0.002 mg/l. Herbicides that are widely used on corn were the most commonly detected pesticides. These herbicides include atrazine, metolachlor, simazine, prometon, alachlor, and cyanazine. The two most commonly used agricultural pesticides in the lower Susquehanna River Basin are metolachlor and atrazine. Generally, the detection of pesticides was related to bedrock type, pesticide leaching potential, and pesticide use. Storm runoff in the spring during the major application period was found to be a major contributor of high concentrations of pesticides to streams. During the major application period, concentrations of atrazine detected in Mill Creek ranged from 0.1 mg/l to 0.2 mg/l. The pesticides detected in the Susquehanna River at Harrisburg were similar to those found in streams in agricultural areas throughout the lower Susquehanna River Basin. Pesticide concentrations found at this site were usually less than 1 ug/l. Atrazine concentrations ranged from 0.00001 to 0.001 mg/l. Metolachlor concentrations ranged from 0.000007 to 0.002 mg/l. The MCL for atrazine is 0.003 mg/l, simazine is 0.004 mg/l, and alachlor is 0.002 mg/l. The MCL for atrazine is 0.003 mg/l, for simazine is 0.004 mg/l, and for alachlor is 0.002 mg/l. A more recent NAWQA study took place nationwide during 1999 and 2000. This study looked for the occurrence of pharmaceuticals, hormones, and other organic wastewater contaminants in streams. Five of the sampling sites were located in the lower Susquehanna River Basin. These sites were located in the East Mahantango Creek at Klingerstown, Schuylkill County; Conodoguinet Creek at Hogestown, Cumberland County; Bachman Run at Annville, Lebanon County; Chickies Creek at Marietta, Lancaster County; and Mill Creek at Lyndon, Lancaster County. In the lower Susquehanna River Basin, 18 antibiotic compounds were sampled for at the five sites. Each site had concentrations of the antibiotics that were generally below the detectable limits. Erythromycin (sampled at Chickies Creek) was the only compound found in the lower Susquehanna at a detectable limit (0.00005 mg/l). Lincomycin and erythromycin were the only antibiotics found in the basin that were frequently detected nationwide. Steroid and hormone compound data were only collected in Chickies Creek. Cholesterol, used as a plant/animal steroid, was found at a level of 0.0023 mg/l. Coprostanol, a fecal steroid, had a concentration of 0.00014 mg/l. Estriol, a reproductive hormone, was the only other compound with a concentration (0.000019 mg/l) above the detectable limit. Forty-five compounds considered as
33
wastewater-related were sampled for at the Chickies Creek site. Twenty of these compounds were frequently detected in streams nationwide. Four of the compounds sampled at Chickies Creek had concentrations at a detectable limit. Ethanol, used as a blending component in gasoline, had a concentration of 0.0002 mg/l. Naphthalene, a polycyclic aromatic hydrocarbon (PAH), was detected at 0.00005 mg/l. The health advisory level for this contaminant is 0.02 mg/l. Triclosan, an antimicrobial disinfectant, had a concentration of 0.00006 mg/l. Tri (chloroethyl) phosphate, a fire retardant was found at a level of 0.00006 mg/l. The USGS and George Mason University (Koplin and others, 2002) studied organic contaminants sampled at the Conowingo Dam between March 4 and December 12, 1994. Some common contaminants that were detected included pesticides (atrazine, metolachlor, cyanazine, and malathion), insecticides (chlordane), total PCBs, and total PAHs. Both point and nonpoint sources are associated with contributing these contaminants to the environment. Sample concentrations were measured in filtered water and filtered particles. The samples were filtered with Whatman glass fiber filters. For a list of common filtered water concentrations see Table 9. Although there were detections for many of the compounds sampled, all were well below any established MCLs. Table 9. Organic Contaminants Detected at Conowingo Dam, 1994
Contaminant Mean Concentration nanograms per liter
Concentration Range nanograms per liter
MCL nanograms per liter
105 <2.9-279 NA 84.5 <0.9-184 NA 81.5 26-241 3,000
Pesticides Malathion Cyanazine Atrazine Metolachlor 61.2 16-195 NA
Insecticides
Chlordane 0.19 <0.0009-0.65 2,000
Total PCB 1.7 0.5-5.3 500 Total PAH 99.6 25-240 NA
Malathion was found in the river water in high concentrations, but was infrequently detected. There was a peak in the discharge between March and May due to combined runoff from snowmelt and rainfall. Concentrations of organo nutrient/phosphorus pesticides showed a seasonal link to agriculture activities. PCBs and chlordanes concentrations were linked to seasonal runoff. PBC concentrations were greatest during the spring due to increased runoff from precipitation and snowmelt. Chlordane concentrations showed an increase during the spring and the month of August when river flows were high. Radionuclides Present both naturally and as a result of human activity, low concentrations of radionuclides are typically found when sampling air, soil, or water. However, potential contamination of drinking water sources by increased levels of radionuclides exists due to human activities such as the mining of radioactive substances, production of nuclear power, use and/or production of nuclear weapons, and practice of nuclear medicine. The most significant sources of radionuclides in the
34
lower Susquehanna are nuclear power plants and residual piles of surfaced elements from mining operations. In order to ensure public safety from exposure to radioactive particles, the USEPA has set MCLs for radium (5 picocuries per liter - pCi/l ), gross alpha particles (15 pCi/l), beta particles (50 pCi/l), tritium (20,000 pCi/l), and uranium (30 ug/l). Public water systems are required to test annually for radioactive contaminants. Upstream surface water data supplied by AmerGen-Three Mile Island (TMI) and MDE were reviewed. TMI data incorporates several locations (upstream control sites and downstream indicator sites) sampled monthly from January to December of 2001. MDE data represents weekly sampling from the Susquehanna River at Conowingo from January 2000 through September 2002. Concentrations of tritium (H-3), iodine-131 (I-131), and gross beta particles were reviewed for both datasets. MDE samples additionally for xenon-133 (Xe-133), and TMI for numerous gamma-emitting isotopes. TMI samples along the Susquehanna River near Steelton for control measurements. Downstream indicator measurements of outfalls are taken along the Susquehanna River near TMI (west shore), Columbia, and Wrightsville. Tritium levels at the upstream control location ranged from <143-<183 pCi/l, averaging over the 12 month collection period at approximately 168 pCi/l. Levels at the indicator location (downstream of the outfall) typically ranged from <159 to approximately 3,300 pCi/l, spiking once in January 2001 at 30,129 + 495 pCi/l. The median for this period was 1,657 pCi/l. Not including the January event, the yearly average over the remaining 11 months was approximately 1,300 pCi/l. It should be noted, that some of the samples from this location were grab samples, due to freezing temperatures and/or sampler malfunction. Columbia data indicated only one instance of slightly elevated tritium levels (437 pCi/l). Wrightsville data stayed within control levels for tritium. Both Columbia and Wrightsville sites sampled for gross beta particle levels and I-131. I-131 levels oscillated infrequently and very slightly, deviating from control values (<0.4 pCi/l) by no more than 0.2 pCi/l. Gross beta results were similar. Control values (1.5-2.4 pCi/l) were seldom exceeded at Columbia, and although exceeded frequently at Wrightsville, the variation in concentration was small (max. record 3.7 pCi/l). MDE data from the Susquehanna River at Conowingo also indicates stable levels of I-131 and gross beta particles. However, gross beta particle values for MDE data exceeded those of TMI, the low value being 1.0 pCi/l in January of 2000, and the high value in August and September of 2002 at 6.0 pCi/l. Tritium concentrations remained <300 pCi/l throughout the study period.
C. Review and Discussion of Outside Sources of Data and Findings
USEPA STORrage and RETrieval DATABASE (STORET) DATA STORET data has been collected at many sites on the Susquehanna River. Lower Susquehanna River data collected by the Pennsylvania Department of Environmental Protection (Pa. DEP), SRBC, and MD DNR were reviewed. Pa. DEP monthly data were reviewed for 1997 and 1998. These data were collected from the Susquehanna River at Columbia and Wrightsville, Pa. SRBC
35
monthly data from 1987 to 1990 also were reviewed. These data were collected from the Susquehanna River in Cecil County, Md., near Lapidum. MD DNR monthly data were reviewed from 1978 to 1995. These data were collected near the Conowingo Dam Pool. Low DO in a stream can be indicative of poor water quality. The measured DO values typically ranged from 4 to 14 mg/l, with the lowest values typically measured during the summer months. DO values near the Conowingo Pool typically ranged from 4 to 12 mg/l. Nitrate and nitrite measured as nitrogen in stream water may result from fertilizer runoff use, leaching from septic tanks and natural erosion. USEPA sets the MCL for nitrate at 10 mg/l and for nitrite at 1 mg/l. Nitrate values ranged from approximately 0.53 to 2.79 mg/l. Nitrite values ranged from 0.003 to 0.154 mg/l. All the data exhibited a general trend where nitrate/nitrite levels increased during the winter months. Copper and lead found in streams may result from plumbing corrosion and natural erosion. USEPA sets action levels for copper and lead at 1.3 mg/l and 0.015 mg/l, respectively. Pa. DEP data indicated that the concentrations of both metals were typically below detection limits. The National Secondary Drinking Water Regulations provide guidelines for regulating nontoxic contaminants. Total aluminum, chloride, iron, manganese, and sulfate in drinking water have recommended maximum values under these guidelines. The recommended maximum concentrations for each compound are shown in Table 10. In addition, Table 10 provides a summary of the reviewed STORET data. Table 10. Summary of STORET Data
Contaminant Pa. DEP Data SRBC Data MD DNR US EPA Limits
Copper <0.001-0.0093 mg/l N/A N/A 1.3 mg/l Lead <0.001-0.00252 mg/l N/A N/A 0.015 mg/l Nitrite <0.02 mg/l 0.01-0.03 mg/l 0.003-0.154 mg/l 1 mg/l Nitrate 0.56-1.93 mg/l 0.81-2.99 mg/l 0.53-2.79 mg/l 10 mg/l Data from Fish Tissue The Pa. DEP and Pennsylvania Fish and Boat Commission (PFBC) regularly sample fish tissue for contaminants. Levels of a specific PCB compounds were detected in fish tissue at all sites sampled north of Sunbury, Pa., with the exception of one site at Sayre, Pa. Of the six PCB compounds analyzed, only one compound was typically above detectable limits. Pesticides and trace elements also were detected at varying levels in fish tissues. The metals detected include arsenic, mercury, copper, lead, chromium and cadmium.
36
VI. SIGNIFICANT SOURCES OF CONTAMINATION
A. Nonpoint Source Concerns
Unlike point sources, nonpoint sources are unable to be isolated to a specific discharge point. Runoff from agricultural activities and roads, improper stormwater drainage, erosion along streambanks or from uncontrolled construction, and on- lot septic systems are all examples of nonpoint sources. Nonpoint sources in this assessment were identified using several geographic information system (GIS) datasets. These data sets included land use, animal indices, stream assessment information, and field observations. Although difficult to quantify, nonpoint sources are significant contributors to water quality degradation in the Susquehanna River Basin. Several hundred miles of streams are listed on Maryland, New York, and Pennsylvania’s 303(d) List of Impaired Waters (Appendix 2). The sources and causes range significantly. In the Susquehanna River Basin, the leading sources of contamination in order of significance are agricultural runoff, AMD, and runoff associated with urban/residential areas and storm sewers (Table 11). The leading cause of water quality impairment from nonpoint sources is sediment, coming from all three major sources. Additionally, agricultural runoff contributes to a majority of the problems associated with excessive nutrients and organic enrichment. AMD is the primary source for metals and low pH, although urban runoff is believed to contribute some metals as well. Urban runoff is a source of numerous contaminants, based on the range of activities present. Appendix 3 indicates which watersheds have approved Total Maximum Daily Loads established, and lists the pollutants addressed. Table 11. Summary of Stream Assessments in the Susquehanna Basin
Three Leading Impairment Sources Agriculture 1,900 1,200 Acid Mine Drainage 1,300 200 Urban/Residential 60 50
The Susquehanna River Basin north of Sunbury, Pa. is predominantly forested with some agricultural land use and a few urban centers. Water quality conditions in the Upper Susquehanna Subbasin are fairly good, with little agriculture and development. The only potential for significant contamination exists from urban/stormwater runoff in the Elmira and Binghamton, N.Y. areas. Agricultural practices in the Chemung Subbasin have caused an increase in nutrients and sediments, and to a lesser extent, AMD has caused problems with metals and sediment. The single most problematic area in the northern portion of the assessment area is the large urban area located in the Wyoming Valley, within the Middle Susquehanna
37
Subbasin (Wilkes Barre/Scranton, Pa.). The tributaries in the Wyoming Valley contribute a large amount of sewage, trash, and urban runoff to the Susquehanna River. The Middle Susquehanna Subbasin also has severe problems associated with AMD. Combined with the West Branch Susquehanna Subbasin, these two subbasins contribute the majority of the problems associated with AMD in the Susquehanna basin. AMD causes low pH, high levels of metals, and acidity. However, the effects of AMD are largely mitigated by dilution downstream of the subbasin. As stated in previous sections, the Lower Susquehanna Subbasin is the southernmost subbasin and most influential regarding Maryland’s source water quality. Unlike all the other subbasins, it is dominantly agricultural land, with most of the activity occurring within Lancaster and York Counties, Pa. (Figure 5). It represents the most productive area in the Susquehanna River Basin. Hence, the leading cause for water quality problems is associated with agricultural runoff, specifically siltation and nutrients. Siltation is fairly severe in portions of the lower Susquehanna, degrading to source water quality, as well as recreational use and fish habitat. The small particles clog waterways and decrease water clarity. Sediment also can carry contaminants such as pesticides into streams. The major contributors of siltation in the lower Susquehanna are predominantly unmanaged crop and pasture fields, and to a lesser extent urban/stormwater runoff, and unmanaged construction. The problems associated with excessive nutrients are also prevalent in the lower Susquehanna. Sources of phosphorus include human sewage, urban/residential runoff, agricultural run-off from crops, sewage from animal feedlots, pulp and paper industry, vegetable and fruit processing, chemical and fertilizer manufacturing, and detergents. Aside from the negative health effects from elevated nutrients such as nitrate, elevated nutrient loads (nitrogen and phosphorus) can lead to increased algal productivity (Novotny and Olem, 1994). The addition of large quantities of phosphorus to waterways accelerates algae and plant growth by enhancing eutrophication and depleting the water body of oxygen. Increases in algal productivity also can have adverse effects on water supplies, such as potentially clogging a filter or affecting taste and odor. Any increase in total organic carbon also increases the excretion of toxins and the probability for the formation of harmful DBPs during treatment. Agricultural practices also can increase the loads of fecal coliforms, cryptosporidium, and giardia in waterways, particularly where the animal populations are high. These microbial contaminants can result in severe gastrointestinal illnesses. Increases in the number of industrial farms, or concentrated animal feeding operations, have increased the potential for contamination of source water in the Lower Susquehanna Subbasin. To determine relative inputs, animal biomass indices were calculated for the subbasin using 1998 zip code data with animal population numbers, and USEPA estimates for daily manure loadings by animal type. The calculations were then distributed on a per acre basis of animal biomass. The index map identifies high animal densities throughout Lancaster County (Figure 10). The highest densities are represented in the Chickies Creek watershed, followed in decreasing order by Pequea Creek, Conestoga River, and Octoraro Creek watersheds. Due to the proximity and concentration of livestock sources in the lower Susquehanna to the intake, potential for source contamination is high. Contaminants of high concern include: nutrients, siltation/turbidity, and bacteria/protozoa (total coliforms, Giardia, Cryptosporidium, etc.).
38
PROJECTION: U nive rse Tran svers e Me rca tor 83 Zo ne 18DI SCLAIMER: Int end ed fo r Ed ucati onal Disp la y Purp ose s Only
10 0 10 20 Miles
1:900000
A N I M A L I N D E X SOURCE WATER ASSESSMENT AREA
L O W E R S U S Q U E H A N N A
SOURCE W ATE R ASSESSMENT ARE A
AREA OUTSIDE BASIN
SUSQUEHANNA RIVER BASINCOUNTYSTA TE LINERIVER/STRE AM
ANIMAL BIOMASS INDEX (LBS/ACRE)
0 - 34 - 1011 - 2122 - 38
39 - 6061 - 99100 - 174175 - 420
8
PENNSYLVANIAMARYLAND
Y O R K C O.L A N C A S T E R C O.
L E B A N O N C O.D A U P H I N C O.
C U M B E R L A N D C O.
B A L T I M O R E C O.H A R F O R D C O.
C E C I L C O.
A D A M S C O.
N O R T H U M B E R L A N D C O.
P E R R Y C O.
F R A N K L I N C O.
B E R K S C O.
S C H U Y L K I L L C O.S N Y D E R C O.
J U N I A T A C O.
M I F F L I N C O.
C H E S T E R C O.
C E N T R E C O.
U N I O N C O. M O N T O U R C O.
C O L U M B I A C O.
L U Z E R N E C O.
SRBC
(572
c) 0
2-24
-200
3
BALTIMORE CITY
Ches
apea
ke B
ay
Figure 10. Animal Biomass Index for the Pennsylvania Portion of the Lower Susquehanna Subbasin
39
Although their occurrence is not as frequent as the previously mentioned contaminants, herbicide/pesticide usage also has been documented to contribute contaminants to waterways from runoff associated with agricultural activities. Aside from an agricultural source, residential use of lawn fertilizers/pesticides, as well as increases in the number of golf courses, is responsible for an increase in the contribution of these types of contaminants as development increases in the Lower Susquehanna Subbasin. Within the Lower Susquehanna Subbasin, there are three major metropolitan areas (Harrisburg, Lancaster, and York). Development has been rapidly expanding for both residential and commercial areas. Runoff from these developed areas can lead to increased problems with VOCs, SOCs, metals, and turbidity. Runoff containing road de- icing chemicals is also becoming an increasing problem during the winter months. On such occasions, the presence of several bridges in the lower subbasin, with minimal drainage controls, has caused some water suppliers to experience problems with chlorine demand during treatment due to ammonia levels present in road de-icers.
B. Point Discharge Concerns
Point-source pollutants generally refer to instream discharges that have a discrete, identifiable outfall, regulated by the state and federal government. Point sources are commonly called “end of pipe” discharges. Examples of point sources include sewage treatment plants and industrial wastewater discha rges. For this assessment, point sources were identified using GIS datasets provided by the USEPA, Pa. DEP, and MDE. For permits located within the Lower Susquehanna Subbasin, discharge monitoring reports were reviewed and water quality violations were noted. There are approximately 1,152 permitted discharge sites in the entire Susquehanna River Basin covered under the USEPA’s National Pollutant Discharge Elimination System (NPDES). Of that total, there are 115 sites located in New York, 1,024 in Pennsylvania, and 13 in Maryland. Within the Lower Susquehanna River Basin there are about 381 NPDES discharges upstream of Harford County’s intakes. Of these dischargers, 252 (66 percent) are municipal and 113 (29 percent) are industrial. Sixteen sites (5 percent) are a combination municipal/industrial. Within the Maryland portion of the assessment area, there are 9 municipal and 4 industrial discharges. The NPDES map (Appendix 4) shows the sites within Harford’s assessment area for the Lower Susquehanna Subbasin. A majority of the municipal sources discharge contaminants such as nutrients, while the industrial sources discharge a full range of contaminants (metals, VOCs, SOCs, etc.). It is important to note that mine and quarry operations do not always have NPDES permits for discharges, based on differences in the way the sites are managed and regulated. The USGS NAWQA Program summarized nutrient levels in the Lower Susquehanna River Basin between 1975 and 1990. Based on volume, the two primary contaminants of concern associated with point-source discharges in the Lower Susquehanna Subbasin are nitrogen and phosphorus. With respect to point source contribution, about 60 percent of the nitrogen comes from municipal discharges, while almost 90 percent of the phosphorus load comes from industrial sources such as food processing facilities and pharmaceutical laboratories (Risser and
40
Siwiec, 1996). Overall, point-source nitrogen loads exceed phosphorus loads in the Susquehanna River and its tributaries. The study determined that Codorus Creek, the Juniata, and Conestoga Rivers receive the majority of the nitrogen and phosphorus loads from municipal dischargers, with nitrogen loads significantly higher than phosphorus loads. Overall, estimated nutrient loads from point sources are significantly lower than loads emanating from nonpoint sources. Another USGS study (Sprague and others, 2000) found that approximately 10 percent and 27 percent of the total load for nitrogen and phosphorus, respectively, originate from point sources within the Susquehanna Basin. Based on permits reviewed for this assessment, flows from municipal and industrial discharges in the Lower Susquehanna Subbasin are estimated to comprise less than 5 percent of the mean annual flow for the Susquehanna River as measured at Marietta, Pa. Average flows from municipal and industrial discharges are estimated to be 110 mgd and 50 mgd, respectively. These estimates did not include flows associated with non-contact cooling water. Several power plants comprise the majority of the flow contribution to the Susquehanna from point-source discharges in the Lower Susquehanna Subbasin. Table 12 shows the facilities and their associated flows. Water used for non-contact cooling processes in 2001 comprised almost 20 percent of the flow in the lower Susquehanna River as measured at Marietta, Pa., during the same time period (approximately 15,000 mgd). Table 12. Power Facilities Located in the Lower Susquehanna Subbasin
Permit Number
Permit Name Design Flow
(mgd) Average Flow
(mgd)
Average Flow for Non-contact Cooling
(mgd) Non-contact Cooling
PA0008281 PP&L Brunner Island 744.5 580 580
PA0009733 Exelon Energy Company – Peach Bottom
2,199.8 1,960 1,960
PA0009920 AmerGen Energy Company - TMI
83.4 20 20
PA0008451 Sunbury Generation LLC 330.0 260 260
Power Generation
PA0009741 Exelon Energy Company – Muddy Run
N/A 6.40 --
PA0008435 PP&L Holtwood N/A 0.17 --
PA0044628 York Haven Power Company N/A 0.28 --
PA0032379 Safe Harbor Water Power Corporation
N/A 0.03 --
MD0002518 Susquehanna Energy Company (SEC)
N/A 5,000 --
Total Flows 3,357.7 7,826.88 2,820
41
C. Transportation Related Concerns
Transportation crossings on the Susquehanna River mainstem are another concern due to the possibility of spills. There are numerous road and railroad crossings over the Susquehanna River in Pennsylvania. Most of these crossings are U.S. routes or state routes that are classified as primary highways. Fifteen crossings are by rail. The majority of pipeline and utility crossings are found within the Lower Susquehanna Subbasin. Below Sunbury, Pa. there are 19 road/train crossings, 10 pipeline crossings, and 35 utility crossings.
Four heavily traveled bridges cross the Susquehanna River in Maryland. Three of these bridges transport cars and trucks, and one bridge is a railroad bridge. A high volume of traffic crosses the river daily by means of these bridges. The greatest transportation threat would be a potential spill from one of these bridges or a train derailment. Route 222 runs through Port Deposit to Perry Point, Md. At times, this road is very close to the river and to Octoraro Creek, which empties into the river. Road runoff, as well as de- icing materials may contribute contaminants to the river. Table 13 shows pipeline crossings in the Susquehanna basin in order of closest proximity to Harford County’s intakes. Colonial Pipelines, the major petroleum pipeline that connects the northeast United States with Texas, crosses the Susquehanna River just below the Conowingo Dam. Table 13. Pipeline Crossings in the Susquehanna Subbasin
Pipeline Name/Company River Crossing Commodity
Colonial Pipeline Cecil/Harford Co., Md. Refined Petroleum Product Williams Gas Co. Pipeline - Transco Lower Lanc./York Co., Pa. Natural gas Texas Eastern Transmission Corp. Wrightsville/Columbia, Pa. Natural gas
Williams Gas Co. Pipeline - Transco Berwick, Pa. Natural gas Williams Gas Co. Pipeline - Transco Wyoming, Pa. Natural gas Exxon Pipeline Co. Pittston, Pa. Refined Petroleum Product
Tennessee Gas Pipeline Co. Wyalusing, Pa. Natural gas
42
D. Land Use Planning Concerns
Maryland The populations in Cecil and Harford Counties, Md. have increased over the past decade. From 1990 to 2000, the population in both counties increased by about twenty percent. As mentioned in the previous discussions on land use, little more than 12 percent of the assessment area in Maryland is significantly developed. So a majority of the county’s planning efforts are focused on agricultural activities. Land use changes in the county over the past ten years has been predominantly through the conversion of agricultural lands to developed lands, although forested to developed land use conversion is common as well in some areas. As of 1999, Harford County had 27,500 acres of permanent agricultural easements. Harford County’s agricultural land preservation program allows landowners to preserve farmland for future generations. Cecil County also has some agricultural easements. With respect to conservation practices, the County Soil Conservation Districts have assisted farmers with the installation of riparian buffers on crop and pasturelands, through programs such as the Conservation Reserve Enhancement Program. Additionally, the retirement of steep croplands within 1,000 feet of waterbodies is being promoted, as is the construction of wetlands in croplands. Conservation district activities have focused on areas within the Broad and Deer Creek Watersheds, as well as some other tributaries draining directly into the Susquehanna River. The Environmental Quality Incentive Program supports a wide range of conservation practices including grassed waterways, nutrient management, manure storage, and other practices. This program has active participation in both Broad and Deer Creeks, as does the Maryland Cost Share Program that assists with stream crossings for livestock, watering troughs, and riparian buffers. Pennsylvania Several of the heavily agricultural counties in the Pennsylvania portion of the assessment area also employ many of the same types of conservation programs as Maryland. Many watershed groups and county conservations districts are planning and implementing restoration projects for various watersheds with both state and federal grant assistance. With agricultural land use exceeding 60 percent, both Lancaster and York Counties have very active farm preservation programs. Last year, close to 60 farms encompassing 60,000 acres of farmland were preserved in the two counties under the conservation easement program. In addition to the conservation easement program, there are numerous other efforts working towards the goal of reducing nonpoint agricultural runoff. Within the lower counties, there are over 30 active USEPA 319 Nonpoint Source Control projects active in York and Lancaster Counties. Pennsylvania’s Growing Greener Grant Program has funded dozens more. A sample list of activities ongoing in the two counties includes streambank restoration, fencing, wetland construction, installation of manure treatment systems, Best Management Practices (BMPs) effectiveness studies, and numerous educational activities. In recent years, there also has been special focus on such tributaries of concern as Codorus Creek, Pequea Creek, Chickies Creek, Octoraro Creek, and the Conestoga River. River conservation plans are underway or completed for several of these waterbodies. One of the largest contributors of nutrients to the Susquehanna
43
River, the Conestoga, is currently the focus of a pilot nutrient trading project. It is hoped that this project will determine the best way to manage and reduce nutrient inputs from both nonpoint and point sources. Aside from agricultural issues, the Lower Susquehanna Subbasin in Pennsylvania is experiencing an increase in water quality problems associated with development. The second biggest source of contamination in the southernmost counties is related to development issues. Specific examples of sources include urban runoff, storm sewers, construction, runoff from residential areas, and road runoff. Development pressure is growing due to growth in both the southcentral Pennsylvania corridor (York, Lancaster, and Harrisburg), as well as the expansion of the Baltimore commuter communities to southern Adams and York Counties. Currently, there are only a handful of stormwater management plans developed for watersheds in the Lower Susquehanna Subbasin. These plans were developed under Pennsylvania’s Act 167 Stormwater Management Program. The development of an Act 167 plan is voluntary, so few are approved and operational at present. With the implementation of USEPA’s NPDES Phase II Program, stormwater and urban runoff controls should improve with mandatory BMP construction. However, there are still several communities in the lower subbasin that will not be covered under the program. Full implementation of the program also will not take effect for several years, and program effectiveness will not be measurable for a numbers of years.
44
VII. SUSCEPTIBILITY ANALYSIS (FOR EACH CONTAMINANT CLASS)
Each class of contaminants that were detected in the water quality data will be analyzed based on the potential for contaminating the water supply. The analysis will identify suspected sources of contaminants, evaluate the natural conditions in the watershed that may decrease or increase the likelihood of a contaminant entering the river, and evaluate the impacts that future changes may have on the susceptibility of the river.
A. Turbidity and Sediment
The average turbidity at the intake is approximately 8 NTU. However, turbidity may range from less than 3 NTU to greater than 25 NTU. Excessively high turbidity can interfere with water treatment and can carry harmful microorganisms into drinking water supplies. High levels of turbidity in the river can result from storm events (rainfall) and snowmelt, or both. Heavy rains into Deer Creek also can result in turbidity on the west side of the river. Additionally, according to the water supplier, discharges from quarries and point sources can increase turbidity in the water. Spring turbidity levels generally tend to be more sensitive to rainfall events, where runoff from agricultural fields and urban areas is prevalent. Sedimentation is the leading cause of impairment within the Susquehanna River Basin and contributes to elevated turbidity levels. The predominance of agriculture within the critical portion of the assessment area indicates it will continue to be a high priority issue. Springtime sediment loads in Marietta, Pa. reached almost two billion pounds in 2001. In addition to degrading fish habitat and decreasing water clarity, sediments can serve as the transport media for microbial contaminants, pesticides, and other organic contaminants. The sediment load also has been attributed to filling in Conowingo Reservoir. After the reservoir reaches capacity in an estimated 20 to 25 years, the likelihood of contamination from sediments will increase significantly. The Lower Susquehanna Subbasin has experienced a significant increase in developed lands in recent years. Although a majority of the sediment load is from agricultural practices, sediment loads emanating from developed areas may increase if proper stormwater controls are not implemented in the future.
B. Microbial Contaminants
Since turbidity and sediment are considered priority issues, it is logical that microbial contamination also would be considered a priority contaminant of concern, as well. Under certain conditions, both parameters can give some indication as to the presence/absence of microbial contamination, based on similar sources and transport mechanisms. The agricultural activities in the Lower Susquehanna Subbasin are the most likely source for microbial concentrations in the river. Agricultural manure application, concentrated feeding operations, and general management practices may contribute significantly to the amount of fecal material that enters surface waters through runoff. Such runoff also is likely to increase the amount of coliforms moving down the river. Coliform data collected by MDE from 2000 to
45
2002, indicated that higher levels of coliforms were more likely to be found during the winter months, due to improper manure storage and increased washoff from frozen agricultural lands. The high animal loading indices in Lancaster County suggests that those areas might be the most significant source for microbial contamination. Human waste is also a feasible source of contamination through permitted point source discharges of wastewater. The Lower Susquehanna Subbasin has experienced a significant increase in developed lands in recent years. Although a majority of the sediment load is from agricultural practices, sediment loads emanating from developed areas may increase if proper stormwater controls are not implemented in the future. During 2001, total coliforms were highest during the winter months and lowest during the summer months. Fecal coliforms near the Harford County water supply ranged from below detection limits to over 4,000. In 2001, one sample of untreated water from the Susquehanna River indicated the presence of cryptosporidium and Giardia lamblia. Although those organisms were not found in the treated water, they result from human and fecal animal waste and may cause gastrointestinal illnesses. The limit for these organisms is zero. In Harford County’s finished water in 2001, there were zero coliforms. The possibilities for microbiological contamination grow as human activities increase in the basin. As noted in previous sections, the growth trends in the Lower Susquehanna Subbasin indicate that microbial contamination will continue to be a concern.
C. Disinfection Byproducts
Disinfection of drinking water is one of the major public health advances in the 20th century. In the past, typhoid and cholera epidemics were common throughout the United States. Disinfection was the major reason for the reduction in these epidemics, and it is an essential part of drinking water treatment today. However, while disinfectants are effective in controlling many microorganisms, they react with natural organic and inorganic matter in source water and distribution systems to form potentially harmful DBPs. Many of these DBPs have been shown to cause cancer and reproductive and developmental effects in laboratory animals. Chlorine can combine with organic materials in the raw water to create the THMs discussed in previous sections. THMs are known to cause liver, kidney, or central nervous system problems. Repeated exposure to elevated levels of THMs or haloacetic acids over a long period of time could increase a person's risk of cancer. The formation of DBPs is a concern for Harford County, based on the nature of the source. Surface water sources are more likely to contain organic materials that combine with chlorine to form DBPs. Organic matter introduced under such common events as leaf fall can increase the likelihood of DBP formation. In addition, the Conowingo Pool has some similarities to a lake under certain flow conditions, which can inc rease the effects of eutrophication downstream of the dam. Nutrients such as phosphorus increase the rates of production of aquatic biomass, while organic matter attached to sediment can increase TOC. As discussed in previous sections, DBPs could become an increasing concern as the Conowingo Reservoir becomes a less effective trap
46
for sediment and nutrients. Low-flow conditions in the river, particularly in the summer months, also can increase the effects of any of the aforementioned processes. Other factors controlling the formation of DBPs include source water pH, temperature, and the presence of certain inorganic constiuents. Biological activity discussed in the previous paragraph can cause small changes in pH. Temperatures can fluctuate significantly not only with the change of seasons, but with changing tides as well. Some studies also have indicated links between DBP formation and the presence of bromide and other saltwater constituents.
D. Inorganic Compounds
Phosphorus Natural waters have a phosphorus concentration of approximately 0.02 ppm, which is a limiting factor for plant growth. Large concentrations of this nutrient can accelerate plant growth. When the concentration of phosphorus rises above 100 mg/l the coagulation processes in drinking water treatment plants may be adversely affected. Manmade sources of phosphorus include human sewage, agricultural runoff from crops, sewage from animal feedlots, pulp and paper industry, vegetable and fruit processing, chemical and fertilizer manufacturing, and detergents, all of which occur in the lower Susquehanna River Basin. Phosphorus is a pollution concern in the lower Susquehanna River. Regarding the sources mentioned in the previous paragraph, agricultural practices are the greatest source of phosphorus. Excess phosphorus in the river may result in the growth of algae and aquatic plants. This condition is known as eutrophication, or over- fertilization of receiving waters. The rapid growth of algae and aquatic vegetation depletes DO levels, contributing to further biological impairment and die-off. In addition, the resulting rises in total organic carbon levels can contribute to the formation of DBPs. It is important to prevent erosion of soils, as it can be a contributor of phosphorus in runoff water. Riparian buffers and streambank fencing can help reduce this runoff in agricultural areas. Similarly to sediment, as the trapping capacity of the Conowingo Reservoir decreases, phosphorus will become more of a problem downstream of the dam. Nitrates Nitrates can enter the water supply from fertilizer runoff, leaching from septic tanks, wastewater effluent, atmospheric deposition, and erosion of natural deposits. Although nitrates have been detected in the finished water supply, no samples have been close to the 50 percent MCL trigger. Since so much land use within the basin is agricultural, nitrates will continue to enter the water supply. It is unlikely that nitrates will increase in the future based on long-term decreasing trends in loads observed in the more heavily agricultural watersheds in the lower Susquehanna basin. With regards to point-source discharges, it is believed that any increase in the numbers of facilities will be offset by improvements in removal technologies. Presently, only 2 percent of the nitrogen load is trapped by the Conowingo Reservoir, so any change in storage capacity associated with the dam is probably insignificant from the water system’s perspective.
47
E. Volatile Organic Compounds and Synthetic Organic Compounds
VOCs are more commonly found in urban areas. The greatest sources of VOCs are spills, improper disposal, runoff from pavement, leaks from underground storage tanks, atmospheric deposition and leaking sewer lines. The highway and railway bridges that cross the Susquehanna River north of the intake are the most likely source of potential VOC contamination. A spill from one of these bridges could release significant quantities of VOCs into the river. Stormwater runoff from these bridges and other nearby roads may also introduce VOCs into the raw water source. Boating is a popular activity in and around the Chesapeake Bay. An American Legion boating dock exists immediately above the intake. North of these boating docks, in Harford County, are several petroleum storage tanks. These storage tanks are near the shoreline upstream of the Harford County intake. Some of these storage tanks contain oil that is used for home heating. Other tanks store gasoline for use by boaters and barges. Leakages from these boats, gas tanks, or other boats in the water or at nearby docks could contribute VOCs to the water supply. The level of boat traffic during certain times of the year also cannot be ignored as a possible source. The likelihood of contamination increases based on the proximity of several docks and a well traveled navigational channel. Although VOCs can pose a threat to drinking water supplies, the tendency for these groups of contaminants to float on the water’s surface would likely prevent such spills and leakages from posing a major threat to the intake, which is well below the surface of the river. USGS studies have indicated herbicides such as atrazine, cyanazine, alachlor, and simazine have been detected above MCLs in tributaries; however, the dilution occurring in the mainstem of the Susquehanna appears to mitigate the impact of SOC contamination. The same can be said for the other organic contaminants. However, increasing use of such compounds in the environment has the potential to cause future problems. Overall, VOC/SOC contamination is expected to increase with development. Within the Lower Susquehanna Subbasin, there are three major metropolitan areas (Harrisburg, Lancaster, and York) experiencing rapid expansion of residential and commercial areas. Runoff from these urban areas has been linked to elevated levels of VOCs, SOCs, and turbidity in streams within the subbasin.
F. Radionuclides
Radionuclides were not tested for by Harford County. However, Havre de Grace undergoes radionuclide testing. Radionuclides were not detected in the Havre de Grace water supply in 2000. Gross alpha and beta are tested once every four years in the Havre de Grace water supply. Without the presence of any natural sources, radionuclides are not expected to be present. The next testing at the water supply will be in 2004. Radioactivity sampled from 2000 to 2002 in the Susquehanna River at Conowingo Dam indicated that gross beta was detected at times up to four.
48
Although radioactive monitoring values remain quite constant and low concentrations are the norm, the existence of several nuclear power generating plants with outfalls along the Susquehanna River upstream of Harford’s intake indicates a significant potential for radionuclide contamination. Based solely on close proximity to the intake, Peach Bottom should be considered a potential source of contamination. The accident at TMI in 1979 is an example that the possibility does exist. Contaminants used to clean water intake and cooling tower structures can also pose a unique problem for water supply intakes downstream of nuclear facilities. Pesticides are often used to control organisms, such as zebra mussels, from attaching to the structures. Regular cleaning of the same structures can also introduce halogenated disinfectants, commonly chlorine based, which can lead to DBP formation.
49
VIII. RECOMMENDATION FOR SOURCE WATER PROTECTION PLAN
The assessment report for Harford County’s Susquehanna intake was developed to provide the water supplier with the information it needs to best protect its raw source. Although the vast size of the assessment area creates a daunting task in terms of source protection, there are feasible steps that can be taken to improve the use of the source. With the information contained in this report, the water supplier is in a position to better understand the water supply area, track potential contaminant sources, identify critical protection areas, and evaluate the potential for future problems. It is hoped that the information will assist the management of resources associated with source water protection activities. Some recommendations are presented in the following sections.
A. Increase Partnerships
Many comprehensive planning, restoration, and protection efforts are currently underway in the Lower Susquehanna Subbasin. Source water protection efforts could be improved with minimal resources by increasing the level of communication and partnerships with other water suppliers, local/state/federal agencies, and the emergency response community. Efforts could be focused on priority issues identified within this assessment report. When considering the size of the assessment area, joining a collective body with similar goals for source water protection could increase the opportunities for implementing actions and influencing measures to improve water quality conditions in the Susquehanna River. The SRBC and Pa. DEP are currently developing the framework for an early warning communication network for the Susquehanna River and major tributaries. The goal of the system is to provide water suppliers and the emergency response community the means for exchanging water quality information for the purpose of protecting the public health and improving treatment strategies. Harford County is encouraged to participate in activities related to this project. In addition, the U.S. Army Corp of Engineers (USACE) Section 22 Lower Susquehanna Comprehensive Water Resources Study is currently underway. The USACE has partnered with Pa. DEP, SRBC, and the Capital Region Water Board (CRWB), to develop a management plan for the water resources in southcentral Pennsylvania. The study may provide additional information for the understanding of the assessment area.
B. Planning and Regulatory Activities
Emergency response plans should be in place in case of an accidental spill into the river from a bridge, nearby road, or pipeline. In addition, an action plan in response to a train derailment should also be in place based on the proximity of an active railway, and response plans should be implemented in case of an accidental leak from one of the petroleum storage tanks upstream of the intake. Harford County should periodically conduct its own detailed field survey in the vicinity of their intake to ensure there are no new potential sources of contamination, and provide updates on
50
potential changes in land use that may affect raw water quality. In regards to planning information, Harford County could establish a protocol for regularly obtaining updates on state and county planning initiatives relating to source water quality issues such as:
• Stormwater management planning; • Agricultural runoff prevention programs; and • Land use planning initiatives.
Increasing development within the vicinity of the intake can potentially lead to an increase in permitted discharges. Strict compliance to permitted discharge regulations should be enforced to reduce point source pollution.
C. Public Education and Outreach
Public education is an important aspect of watershed protection. The public should be made aware of their watershed through signs and consumer confidence reports. Educating the general public about protecting their waterways is an important step in achieving a successful protection plan. Increased education about protecting drinking water sources also could enhance public support for source water protection activities. Based on the aforementioned concept, the SRBC conducted a workshop in 1999 focusing on the formation community partnerships to foster or enhance source protection efforts (SRBC, 1999). The goal was to bring together a diverse group of representatives from government, industry, academia, and citizen groups for the purpose of developing a source protection plan for Swatara Creek Watershed. The groups were asked to present ideas for developing and implementing the steps needed for source water protection, with the emphasis on utilizing effective partnerships. The basic steps identified were: (1) establish a steering committee; (2) delineate the protection area; (3) identify the sources of contamination; (4) determine the methods to be utilized; and (5) implement the plan of action. The model outlined at the workshop has proven to be an effective catalyst for source water protection efforts. Results that can be linked to the success of the workshop include:
• The establishment of the Swatara Creek Watershed Association as an example of the importance of citizen involvement in source protection efforts;
• The Swatara becoming a pilot watershed for Pa. DEP’s new Environmental Futures Planning Initiative; and
• The development of the U.S. Army Corps of Engineers Lower Susquehanna Comprehensive Water Resources Study, working in partnership with the SRBC, Pa. DEP, and a regional water suppliers board.
A similar model could be followed by potential stakeholders in the Maryland portion of the basin, as well. The formation of community partnerships can facilitate reaching a consensus on the steps needed to solve complex water quality issues. It also provides the necessary support needed to acquire funds to perform the necessary work.
51
D. Monitoring
Regular monitoring for turbidity and fecal coliforms should be conducted. Additional monitoring activities could include more frequent collection of upstream raw water coliform data, thus increasing the understanding of microbial susceptibility for the Susquehanna intake. Also, sampling for total suspended solids could be used as an indicator of other potential pollutants, such as metals and bacteria. These constituents commonly attach to particles as a transport mechanism in surface waters. Monitoring for suspended solids measures an actual weight of material per volume of water, and is valuable for determining the total quantities of materials. Based on proximity of the intake to tidal influences, sodium and bromide monitoring should be conducted during regularly to characterize concentrations at the intake. During drought conditions, increased concentrations of either constituent at the intake could complicate the treatment process or require the operator to switch to one of the county’s other raw water sources. Monitoring and studying which source areas have the potential to form DBPs should be conducted. Since organic matter in surface water sources can increase the formation of DBPs, recognizing and monitoring parameters related to organic content could help water suppliers to control the formation of DBPs.
E. Availability of the Assessment
A public meeting presenting the results of this source water assessment was held on March 5, 2003, in Havre de Grace. Over 15 people attended the meeting, including 1 individual from the water system and 8 individuals representing local, state, and federal agencies. Several local citizens were also in attendance. A summary of this assessment should be included in future Consumer Confidence Reports. Full reports will be available at public libraries, town/city offices, or by contacting the Water Supply Program of MDE.
53
REFERENCES
Commonwealth of Pennsylvania. 2001. Pennsylvania Code. Title 25 Environmental Protection. Department of Environmental Protection. Chapter 93. Water Quality Standards. Harrisburg, PA.
Foster, G.D., K.A. Lippa and C.V. Miller. 2000. Seasonal Concentrations of Organic
Contaminants at the Fall Line of the Susquehanna River Basin and the Estimated Fluxes to northern Chesapeake Bay, USA. Environmental Toxicology and Chemistry, Vol. 19.
Frey, Robert. 2002. Fish Tissue data. Unpublished. Pennsylvania Department of Environmental
Protection, Bureau of Water Supply and Wastewater Management, Division of Water Quality Assessment and Standards.
Hainly, Robert A. and Connie A. Loper. 1997. Water Quality Assessment of the Lower
Susquehanna River Basin, Pennsylvania and Maryland: Sources, Characteristics, Analysis, and Limitations of Nutrient and Suspended Sediment Data, 1975-90.
Hoffman, J.L.R. 2002. The 2002 Susquehanna River Basin Water Quality Assessment 305 (b)
Report. Susquehanna River Basin Commission (Publication No. 220). Kauffman, C.D., J.T. Armbruster, and A. Voytik. 1976. Time-of-Travel; Susquehanna River;
Binghamton, New York to Clarks Ferry, Pennsylvania. U. S. Department of the Interior Geological Survey. Open-File Report 76-247
2002. Pharmaceuticals, Hormones, and Other Organic Wastewater Contaminants in the U.S. Streams, 1999-2000: A National Reconnaissance. U. S. Geological Survey. Environmental Science and Technology. Vol. 6.
LeFevre, Susan R. 2002. Middle Susquehanna Subbasin: A Water Quality and Biological
Assessment. Susquehanna River Basin Commission (Publication No. 222). Lindsey, B.D., K.J. Breen, M.D. Bilger, and R.A. Brightbill. 1998. Water Quality in the Lower
Susquehanna River Basin, Pennsylvania and Maryland 1992-1995. U. S. Geological Survey. National Water-Quality Assessment Program. Circular 1168.
Maryland Department of the Environment. 1993. Water Quality Regulations for Designated
Uses, COMAR. 26.08.02.03-3 Annapolis, Maryland (488-3) McGarrell, Charles A. 1997. Water Quality and Biological Assessment of the Juniata Subbasin.
Susquehanna River Basin Commission (Publication No. 178). McGonigal, Kevin and Robert E. Edwards. 2002. Nutrients and Suspended Sediment
Transported in the Susquehanna River Basin, 2001, and Trends, January 1985 Through December 2001. Susquehanna River Basin Commission.
54
Millard, C.J., P.F. Kazyak, and D. M. Boward. 1999. Lower Susquehanna Basin, Environmental Assessment of Stream Conditions. Maryland Department of Natural Resources. Resource Assessment Service. Monitoring and Non-Tidal Assessment Division.
Novotny, V., and H. Olem, 1994. Water Quality: Prevention, Identification, and Management of
Diffuse Pollution. Van Nostrand Reinhold, New York. Originator: James Vogelmann. U.S.G.S. EROS Data Center, Sioux Falls, SD Publication_Date:
1993 Title: Multi-Resolution Land Characteristic (MRLC) Grid of Pennsylvania, Maryland, Delaware, Virginia, and West Virginia
Reed, Lloyd A., and Marla H. Stuckey. 2002. Prediction of Velocities for a Range of
Streamflow Conditions in Pennsylvania. U.S. Geological Survey, New Cumberland, PA. Risser, D.W., and S.F. Siwiec. 1996. Water Quality Assessment of the Lower Susquehanna
River Basin, Pennsylvania and Maryland: Environmental Setting. U. S. Geological Survey. Water-Resources Investigations Report 94-4245.
Sprague, L. A., M.J. Langland, S. E. Yochum, R.E. Edwards, J.D. Blomquist, S.W. Phillips, G.
W. Shenk, and S.D. Preston. 2000. Factors Affecting Nutrient Trends in Major Rivers of the Chesapeake Bay Watershed. United States Department of the Interior Geological Survey. Water-Resources Investigations Report 00-4218.
Stoe, Travis W. 1999. Water Quality and Biological Assessment of the Upper Susquehanna
Subbasin. Susquehanna River Basin Commission (Publication No. 203). Susquehanna River Basin Commission. 1999. Source Water Protection Community Partnership
Workshop - Proceedings. Susquehanna River Basin Commission. 1985. Water Quality and Biological Survey of the West
Branch Susquehanna River. Resource Quality Management and Protection Division. ——. 1997. Water Quality and Biological Assessment of the Middle Susquehanna Subbasin,
1993. Water Quality and Monitoring Programs Division. Takita, Charles S. and Robert E. Edwards. 2001. Nutrients and Suspended Sediment
Transported in the Susquehanna River Basin, 2000, and Trends, January 1985 Through December 2000. Susquehanna River Basin Commission (Publication No. 218).
Traver, Carrie L. 1998. Water Quality and Biological Assessment of the Chemung Subbasin.
Susquehanna River Basin Commission (Publication No. 198). U. S Geological Survey. Real-Time Data for Pennsylvania. http://waterdata.usgs.gov/pa/nwis/rt
55
——. National Water-Quality Assessment Program. Water Resources Investigations Report 97-4209.
57
Appendix 1. Major Watersheds within the Six Susquehanna Subbasins Major watersheds in the Upper Susquehanna Basin Cayuta Creek Watershed Oaks Creek Watershed Catatonk Creek Watershed Otego Creek Watershed Owego Creek Watershed Cherry Valley Creek Watershed Nanticoke Creek Watershed Schenevus Creek Watershed Wappasening Creek Watershed Charlotte Creek Watershed Apalachin Creek Watershed Ouleout Creek Watershed Choconut Creek Watershed Snake Creek Watershed Tioughnioga River Watershed Saltlick Creek Watershed Otselic River Watershed Starrucca Creek Watershed Chenango River Watershed Susquehanna River Unadilla River Watershed Major Watersheds in Chemung Basin Canisteo River Watershed Tioga River Watershed Cowanesque River Watershed Seeley Creek Watershed Cohocton River Watershed Chemung River Watershed Major Watersheds in the West Branch Susquehanna Basin Sinnemahoning Creek Watershed Anderson Creek Watershed Kettle Creek Watershed Chest Creek Watershed Young Woman's Creek Watershed Clearfield Creek Watershed Pine Creek Watershed Moshannon Creek Watershed Larry's Creek Watershed Beech Creek Watershed Lycoming Creek Watershed Bald Eagle Creek Watershed Loyalsock Creek Watershed Fishing Creek Watershed Muncy Creek Watershed Buffalo Creek Watershed Mosquito Creek Watershed White Deer Hole Creek Watershed West Branch Susquehanna River Watershed Chillisquaque Creek Watershed Major Watersheds in the Middle Susquehanna Basin Sugar Creek Watershed Bowman Creek Watershed Towanda Creek Watershed Lackawanna River Watershed Wysox Creek Watershed Susquehanna River Watershed Wyalusing Creek Watershed Fishing Creek Watershed Meshoppen Creek Watershed Nescopeck Creek Watershed Tunkhannock Creek Watershed Catawissa Creek Watershed Mehoopany Creek Watershed Roaring Creek Watershed Major Watersheds in the Juniata River Basin Raystown Branch Juniata River Watershed Kishacoquillas Creek Watershed Frankstown Branch Juniata River Watershed Tuscarora Creek Watershed Little Juniata River Watershed Juniata River Watershed Shaver Creek Watershed Buffalo Creek Watershed Standing Stone Creek Watershed
58
Major Watersheds in the Lower Susquehanna Basin Penns Creek Watershed Yellow Breeches Watershed Middle Creek Watershed West Conewago Creek Watershed Shamokin Creek Watershed Chickies Creek Watershed Mahanoy Creek Watershed Conestoga River Watershed Mahantango Creek Watershed Codorus Creek Watershed Wiconisco Creek Watershed Muddy Creek Watershed Susquehanna River Watershed Pequea Creek Watershed Sherman Creek Watershed Octoraro Creek Watershed Swatara Creek Watershed Deer Creek Watershed Conodoguinet Creek Watershed
59
Appendix 2. Impairments of Major Streams in the Susquehanna River Basin Subbasin/ State (ID)
Watershed Name
Source of Impairment
Cause of Impairment
Lower Susquehanna
MD(02120202) Deer Creek Unknown Biological MD(02120203) Octoraro Creek Unknown Biological MD(02120205) Muddy Creek
PA(7K) Octoraro Creek Agriculture Agriculture Agriculture
Nutrients Siltation Organic Enrichment/Low DO
PA Susquehanna River Agriculture Agriculture Agriculture Grazing Related Agriculture Grazing Related Agriculture Urban Runoff/Storm Sewers Road Runoff Road Runoff Channelization Other Habitat Modification
Nutrients Siltation Organic Enrichment/Low DO Nutrients Siltation Siltation Water/Flow Variability Siltation Water/Flow Variability Cause Unknown Other Habitat Alterations
PA(7I) Muddy Creek On Site Wastewater On Site Wastewater Petroleum Activities
Taste and Odor Organic Enrichment/Low DO Oil and Grease
PA(7K) Pequea Creek Grazing Related Agriculture Grazing Related Agriculture Crop Related Agriculture Agriculture
Nutrients Siltation Siltation Organic Enrichment/Low DO
PA(7J) Conestoga River Agricultural Agricultural Crop Related Agriculture Crop Related Agriculture Grazing Related Agriculture Grazing Related Agriculture Urban Runoff/Storm Sewers Urban Runoff/Storm Sewers Urban Runoff/Storm Sewers Urban Runoff/Storm Sewers Small Residential Runoff Small Residential Runoff Road Runoff Golf Courses Municipal Point Source Surface Mining Upstream Impoundment Channelization
Channelization Removal of Vegetation Other Land Development Erosion from Derelict Land Erosion from Derelict Land
Flow Alterations Siltation Organic Enrichment/Low DO Siltation Cause Unknown Siltation
PA(7G) Chickies Creek Agriculture Agriculture Urban Runoff/Storm Sewers Urban Runoff/Storm Sewers Urban Runoff/Storm Sewers Other
Siltation Nutrients Flow Alterations Metals Cause Unknown Other Habitat Alterations
PA(7H) Codorus Creek Agriculture Agriculture Agriculture Agriculture Urban Runoff/Storm Sewers Urban Runoff/Storm Sewers Channelization Industrial Point Source Industrial Point Source Industrial Point Source Industrial Point Source Habitat M odification Municipal Point Source
Siltation Nutrients Flow Alterations Suspended Solids Flow Alterations Siltation Other Habitat Alterations Suspended Solids Organic Enrichment/Low DO Thermal Modifications Color Other Habitat Alterations Nutrients
PA(7F) West Conewago Creek Agriculture Other
Suspended Solids Suspended Solids
PA(7D) Swatara Creek Agriculture Agriculture Agriculture Crop Related Agriculture Crop Related Agriculture Abandoned Mine Drainage Abandoned Mine Drainage Abandoned Mine Drainage Construction Road Runoff Urban Runoff/Storm Sewers Urban Runoff/Storm Sewers Municipal Point Source On Site Wastewater Natural Sources Other
PA(7E) Yellow Breeches Creek Agriculture Agriculture Agriculture Agriculture Construction Construction Construction Urban Runoff/Storm Sewers Urban Runoff/Storm Sewers Hydromodification Habitat Modification Source Unknown Source Unknown Atmospheric Deposition
Nutrients Siltation Organic Enrichment/Low DO Other Habitat Alterations Siltation Organic Enrichment/Low DO Other Habitat Alterations Siltation Cause Unknown Water/Flow Variability Other Habitat Alterations Siltation Flow Alterations pH
PA(7B) Conodoguinet Creek Agriculture Pesticides
61
Subbasin/ State (ID)
Watershed Name
Source of Impairment
Cause of Impairment
Agriculture Agriculture Habitat Modification Construction Land Disposal Land Disposal Other Other Other Source Unknown
Nutrients Suspended Solids Flow Alterations Siltation Cause Unknown Priority Organics Organic Enrichment/Low DO Siltation Nutrients Cause Unknown
PA(7A) Sherman Creek Removal of Vegetation Crop Related Agriculture Grazing Related Agriculture Grazing Related Agriculture Atmospheric Deposition
Siltation Siltation Nutrients Siltation Metals
PA(6C) Wiconisco Creek Agriculture Agriculture Crop Related Agriculture Grazing Related Agriculture Removal of Vegetation Small Residential Runoff Abandoned Mine Drainage Abandoned Mine Drainage Abandoned Mine Drainage
PA(6A) Middle Creek Atmospheric Deposition Grazing Related Agriculture Grazing Related Agriculture
pH Siltation Nutrients
PA(6A) Penns Creek Grazing Related Agriculture Crop Related Agriculture Animal Feeding Agriculture Animal Feeding Agriculture
Siltation Siltation Nutrients Siltation
PA(6B) Shamokin Creek Grazing Related Agriculture Grazing Related Agriculture Agriculture Agriculture
Organic Enrichment/Low DO Siltation Organic Enrichment/Low DO Siltation
Juniata PA Juniata River Crop Related Agriculture Siltation PA(12B) Buffalo Creek Crop Related Agriculture Siltation PA(12B) Tuscarora Creek Agriculture
Grazing Related Agriculture Grazing Related Agriculture
Siltation Nutrients Siltation
PA(12A) Kishacoquillas Creek Agriculture Agriculture Agriculture Agriculture Urban Runoff/Storm Sewers
PA(8B) Anderson Creek Abandoned Mine Drainage Abandoned Mine Drainage Grazing Related Agriculture
Metals pH Siltation
PA(8B) Chest Creek Agriculture Removal of Vegetation
Siltation Other Habitat Alterations
Middle Susquehanna PA Susquehanna River No Listings PA(5E) Roaring Creek No Listings PA(5E) Catawissa Creek Abandoned Mine Drainage
Abandoned Mine Drainage Metals pH
PA (5C) Fishing Creek Atmospheric Deposition Atmospheric Deposition Road Runoff Removal of Vegetation Agriculture
Metals pH Siltation Siltation Siltation
PA(5D) Nescopeck Creek Abandoned Mine Drainage Abandoned Mine Drainage
Metals pH
PA(5A) Lackawanna River Abandoned Mine Drainage Abandoned Mine Drainage Abandoned Mine Drainage Abandoned Mine Drainage Hydromodification Hydromodifcation Urban Runoff/Storm Sewers Channelization Land Development
Flow Alterations pH Metals Siltation Flow Alterations Other Habitat Alterations Siltation Other Habitat Alterations Water/Flow Variability
64
Subbasin/ State (ID)
Watershed Name
Source of Impairment
Cause of Impairment
Upstream Impoundment Source Unknown
Cause Unknown Cause Unknown
PA(4G) Bowman Creek No Listings PA(4F) Tunkhannock Creek No Listings PA(4G) Mehoopany Creek No Listings PA(4F) Meshoppen Creek No Listings PA(4D) Wyalusing Creek No Listings PA(4D) Wysox Creek No Listings PA(4C) Towanda Creek Abandoned Mine Drainage
Abandoned Mine Drainage Metals pH
PA(4C) Sugar Creek No Listings Upper Susquehanna
PA(4E) Susquehanna River No Listings PA(4B) Cayuta Creek No Listings NY Susquehanna River Atmospheric Deposition Mercury NY Cayuta Creek No Listings NY Wappasening Creek No Listings PA(4B) Wappasening Creek Animal Feeding Agriculture Nutrients NY Catatonk Creek No Listings NY Owego Creek No Listings NY Apalachin Creek No Listings PA(4B) Apalachin Creek No Listings NY Nanticoke Creek No Listings NY Choconut Creek No Listings PA(4E) Choconut Creek No Listings NY Chenango River Atmospheric Deposition Mercury NY Otselic River No Listings NY Tioughnioga River No Listings NY Snake Creek No Listings PA(4E) Snake Creek No Listings PA(4E) Starucca Creek No Listings NY Unadilla River Atmospheric Deposition Mercury NY Ouleout Creek No Listings NY Otego Creek No Listings NY Shenevus Creek No Listings NY Cherry Valley Creek No Listings NY Oaks Creek No Listings NY Salt Lick Creek No Listings Chemung PA Chemung River No Listings NY Chemung River No Listings NY Seeley Creek No Listings PA(4B) Seeley Creek No Listings NY Cohocton River No Listings NY Canisteo River No Listings NY Tioga River No Listings PA(4A) Tioga River Road Runoff
NY Cowanesque River No Listings PA(4A) Cowanesque River Agriculture
Agriculture Municipal Point Source Upstream Impoundment
Nutrients Siltation Nutrients Organic Enrichment/Low DO
65
Subbasin/ State (ID)
Watershed Name
Source of Impairment
Cause of Impairment
Industrial Point Source Industrial Point Source Removal of Vegetation
Thermal Modifications Cause Unknown Siltation
Lower Susquehanna: Major and Minor Contributing Tributary 303(d) listings within each major watershed 5 other Subbasins: Major Contributing Tributary 303(d) listings within each major watershed.
67
Appendix 3. Pa TMDL List
County Name TMDL Name Cause Pollutant(s) Other Counties Lancaster Conowingo Creek NPS (ag runoff) Phosphorus, sediments
Muddy Run Watershed NPS (ag runoff) Phosphorus, sediments
Pequea Creek NPS (ag runoff) Phosphorus, sediments
Chickies Creek Watershed NPS (ag runoff) Nitrogen, Phosphorus, sediments
Donegal Creek Watershed NPS (ag runoff) Phosphorus, sediments
Conewago Creek Watershed Primarily agriculture N, P, Sediments Lebanon, Dauphin
Dauphin Conewago Creek Watershed Primarily agriculture N, P, Sediments Lebanon, Lancaster