69
Sources of Organic Amendments & Analysis of Nutrients Nutrient Smart – Organic Amendments March 23, 2018

Sources of Organic Amendments & Analysis of Nutrients
Nutrient Smart – Organic Amendments March 23, 2018

Organic Amendment OptionsOutline:
• Organic Amendments compared
• Nutrients vs organic matter
• Synergies with other practices?
• How much can we afford to pay for amendments?
• New Technologies
• Opportunities

Initiatives/Policies:• Soil Health Strategy
• Great Lakes Water Quality (phosphorus reduction)
• Climate Change (greenhouse gas reduction)
• Pollinator Health• Decrease/eliminate organics from landfill (MOECC)
These initiatives have BMPs where increasing SOM as a common denominator
BMPs around these issues could have cost-share funding

Reality:
Soil organic matter levels can not be maintained
with crop rotations that include frequent use of
soybeans without the use of:
• More diverse rotations
• Cover crops and/or
• Organic Amendments

Organic Amendment Synergy
Cover Crops without digestate
Cover Crops with digestate

Approximate Biomass Yield of Three Cover Crop Mixes with and without Organic Amendments
Cover CropWith Manure Without Manure Increase
from manure
Approximate Yield (ton/ac)*
Oats3.6 2.8 33 %
Multi-Species Mix: Planted at 40 lbs/ac
33% Oats, 4% Nitro radish, 2% Brassica, 2% Sorghum Sudangrass, 1% Phacelia, 2% Sunflowers, 4% Sun hemp, 5% Turnips, 25% Crimson Clover, 23% Austrian Peas
2.10 1.75 17 %
3 Species Mix: Planted at 30 lbs/ac
14% Nitro Radish, 16% Crimson Clover, 70% Oats2.85 1.83 36 %
* biomass yield that includes top-growth and comparative root massThe above data represents one site –one year 3,500 gal/ac digestate was applied in mid-August. Nutrient composition of digestate is similar to hog manure.

sugars
cellulose
proteins
hemicellulose
polyphenols
lignin
humus
Cover crops
Digestate
Manure/Biosolids
Compost
Different Amendments provide Different Benefits to Soil

Diversity benefits the soil
sugars
cellulose
proteins
hemicellulose
polyphenols
lignin
humus
BacteriaActinomycetes
Fungi

Building SOM
Kallenbach & Grandy (2011) Agri. Ecosyst. Environ. 144, 241-252.
Wake up the soil microbes with:
Organic amendments

Plant residues Farm yard manure
Cattle manurePoultry manure
Swine manure
Organic amendment
Kallenbach & Grandy (2011) Agri. Ecosyst. Environ. 144, 241-252.
Building SOM
Change does not occur over-night

Soil Water Characteristics
Manure on clay loam
Poultry Sewage Sludge
Straw Alfalfa Anaerobic Digestate(sewage
biosolids)% Change compared to control
Organic C content 57 84 37 13
Bulk Density "-" -7 -10 -11 -7 "-11 to -28
Aggregate Stability + 22 24 59 40 +
Moisture Content + 3 9 25 4 +
Water Infiltration + 18 39 52 50 Neutral
Martens And Frankenberger (1992), Kladiviko and Nelson (1979), Lindsay and Logan (1998)
Building Healthier Soils with Amendments

Goal
Appropriate methods
Appropriate materials
Improve soil structure quickly
Restoration of grass orPasture
Rotation with high residue crop
Leaves Heavily bedded manures
Plant a cover crop
Living mulch
Graze cover crop rather than till
Add high carbon “raw waste”
Incorporate crop
residues
Build Soil Organic Matter quickly
Use stable organic amendment e.g. compost
Supply nutrients
Apply raw or minimally processed waste high in nutrients
Plant a legume cover crop (Nitrogen)
ManuresProcessed wastes Municipal Wastes
Pumice or Fruit cullsVegetable wastes
DDG / FOG
Liquid ManureAnaerobic Digestate
Matching Goal with the Right Amendment

Amendment Type Total N(lbs/ton)
C:N ratio
Applicationrate (ton/ac)
Stable C(lb/ton)
% SOM increase
1% ↑ SOM
(applicatons)
N - P205 - K20 (lbs/ac)* (available)
High C:N dairy 6 lbs 49 340 19,992 1.0 1 327 – 625 - 1,179High C:N dairy 6 49 150 8,820 0.44 2.3 145 - 276 – 520
Mushroom compost 24.8 10 400 99,200 1.0 1 3,143 - 5,000 - 9,390Mushroom compost 24.8 10 25 1,240 0.062 16 196 – 313 - 587
Solid Dairy manure 18.32 16 341 19,991 1.0 1 1,160 - 3,600 - 6,900Solid Dairy manure 18.32 16 32 1,875 0.094 10.6 109 – 338 – 650
Leaf/yard compost 19.6 17 300 19,992 1.0 1 1,808 - 2,315 - 3,445Leaf/yard compost 19.6 17 34 2,266 0.113 8.8 204 - 263 – 390
Solid Horse manure 10 30 333 19,980 1.0 1 801 - 1,836 - 3,103Solid Horse manure 10 30 62 3,720 0.186 5.4 149 - 342 - 578*NMAN3 data using average database nutrient values for application 1 x per 3 years for a 180 bu corn crop
Materials are not created equally – Need to know the nutrient and OM, C:N ratio of the materials being considered.
Organic Amendments: Nutrients or Organic Matter?How long does it take and how much material is required to raise Soil Organic Matter by ~1%

Categories of Organic Amendments• Solid Manures / Biosolids / Immature Compost
– Nutrient rich, – Odours, pathogens– High carbon/organic matter
• Unrestricted Compost– manure and municipal
• Liquid Manures / Anaerobic Digestate– Available nutrient rich– Higher environmental risk with application– Potential for high pH, high ammonia, – Low carbon/organic matter
• Processed Biosolids– e.g. N-Viro, Pellets, LysteGro
• Other– Biochar

Sources of Organic Matter (& Nutrients)
• Cover crops
• Manure• Biosolids• Biosolids Pellets• N-Viro• Biochar• Digestate• Lystegro• Compost (manure & municipal)

Livestock Manure (Solid)What Is It?• Livestock waste with bedding materials (straw, wood chips etc.)
Benefits:• Available on-farm (livestock neighbours?)• provides many of the required macro and micro nutrients • supplies organic matter which will help maintain or improve soil health
Challenges:• contains odours and pathogens which,
– can lead to water contamination • application to wet soils
– can cause soil compaction. • Nutrient content
– usually not in proportions needed by crops• Application to crops further from manure storage
– takes time and planning

Manure Value
Animal TypeDM%
Useable N1
lbs
P2052
lbs
K20lbs
Year 1 Value
$
Year 2-4 Value3
$
Liquid Hog /1000 gal 4 22 11 21 28.80 7.80
Liquid Dairy /1000 gal 8 17 8 27 26.70 7.40
Solid Cattle /ton 30 4.5 5.3 14 12.00 4.60
Poultry layers /ton 37 20 18 21 32.20 13.80
Poultry broilers/ton 66 25 26 39 47.30 20.90
Sheep /ton 32 6 6.3 16 14.50 5.00
Horses /ton 37 2.4 2.8 9 7.10 2.60Spring applied; incorporated; 40% P in application year; Organic N and 40% P in yr 2-4
Are there opportunities to move/sell manure to fields with higher fertility needs?
http://fieldcropnews.com/wp-content/uploads/2015/03/Nutrient-Value-of-Manure.pdf

Compost (manure) What Is It?• Material with specific C:N ratio and moisture content that goes through a
process of heating, turning and curing provides nutrients and organic matter with reduced volume and odour compared to the original material
Benefits: • provides many of the required macro and micro nutrients (ration based)• Low odour and pathogen content• Low risk of nitrogen loss (leaching or volatilzation)
• supplies organic matter which will help maintain or improve soil health
Challenges:• Higher labour requirement than with manure• Could have odour issues if C:N ratio or
moisture content is too high or low

Municipal CompostWhat Is It?• Municipal good waste mixed with high carbon materials (ie wood
chips) and composted in-vessel, or in windrows, under specific conditions to meet MOE un-restricted compost guidelines
• Analysis will vary for each facility, depends on process and length of curing.
Benefits: • High OM product with good balance of available N-P-K and micro
nutrients. (Varies with inputs i.e. food waste v.s. leaf-yard waste)
• Cured compost = low odour & low risk of N loss• Uniform application is easier than with most solid manure types• Ideally applied once in the rotation (after cereal harvest) at ~10-15
ton/acre

Municipal Greenbin CompostChallenges:• Low bulk density as low as 20 lbs/cubic foot, makes transport expensive• Contaminants – plastics• Maturity – could result in class B compost = NASM 3 = more work• Odour - Un-cured or green compost can have a distinct odour that re-
occurs when wetted if material is not incorporated• Temporary field storage can cause some compaction damage• Timing of product availability and application• Some variability in product – time of year input availability• Un-incorporated, surface applied = soluble P runoff risk ?

AIM Hamilton Try Recycling CompostAnalysis Available (lbs/ton) Analysis Available (lbs/ton)
Dry Matter % 72 1,532 61.7 1,234Total Nitrogen % 2.4
19.5 + 3.8 = ~20 0.985.8 + 0.2 = ~5NH4-N (ppm) 2541 142
Phosphorus % 0.62 22.7 (P205) 0.21 7.7 (P205)Potassium % 1.25 27 (K20) 0.53 11.4 (K20)Organic Matter % 50.1 720* 30.2 373*pH 6.60 8.10C:N ratio 12 : 1 17 : 1Bulk Density 329 kg/m3 20.5 lbs/ft3 596 kg/m3 37.2 lbs/ft3
Sulphur (ppm) 2373 4.7 1171 2.3EC (conductivity) (ms/cm) 9.81 12.6 3.15 4.0Sodium % 0.62 12.4 0.07 1.4Aluminum (ppm) 1458 2.9 2183 4.4Boron (ppm) 15.1 0.03 15 0.03Calcium (%) 3.28 66 3.70 74Copper (ppm) 31.6 0.06 35.5 0.07Iron (ppm) 2775 5.6 5644 11.3Magnesium (%) 0.39 7.8 0.79 15.8Manganese (ppm) 134.2 0.27 219.2 0.44Zinc (ppm) 94.6 0.18 251.0 0.50
* ~20% of OM is assumed stable
Knowing Material Composition is Important

BiocharWhat is It?• Black carbon material produced from a thermochemical process (pyrolysis) of
organic feedstocks• Stable, inert material that can adsorb nutrients and increase nutrient retention
without carbon release to atmosphereBenefits:• Increases water holding capacity when applied at high rates• Yield response to biochar when added to fall applied liquid manure:
– Viscosity (thickness) increased– Provides odour control– benefit from immobilization of NH4-N & NO3-N to slow release / could ↓ N loss
Challenges:• Soil applied (without manure) - little impact on biomass grain yield • Difficult to handle and apply in a practical operation • Composition influenced by feedstock and manufacturing conditions• Supply driven by energy industry (carbon offsets) -limited Ontario supply

Biochar - Alberta Study• Reduce methane emissions?• Nitrogen and water retention in soil?• Nitrous oxide emission reductions?
Canadian Cattlemans Magazine, June 2017

% Change in manure composition from feeding biochar in livestock rations
Biochar

Biosolids What Is It?• Dried & dewatered sewage biosolids• Pulp & paper waste• Processing waste
Benefits: • similar to manure from nutrient and organic matter perspective• custom applied and applied at no cost for the farm (usually)• regulatory changes in 2010 - application rates set to meet crop needsChallenges:• Sewage biosolids contain little or no potash • contain trace elements (ie lead, copper) • wider setbacks are required from residences and sensitive features• setback areas = additional trip with commercial fertilizer• regulatory requirements – NASM plan required pre-application

N-ViroWhat Is It?• Biosolids material processed with kiln dust to provide liming benefit• Regulated through CFIA - treated as a fertilizer material
Benefits: • high calcium and potassium = liming capacity • relatively high sulphur content• ideal product for sandy soils with low pH • regulated through CFIA = product consistency - no NASM plan
Challenges:• nitrogen contribution and organic matter is relatively low.• N-Viro is dusty and should be applied under low wind conditions

Biosolids Pellets What Are They?• Process - digested sewage to biosolids cake • Followed with pelletization (heating and drying) • Regulated through CFIA - treated as a fertilizer
Benefits: • excellent source of OM, N, P and micro-nutrients• Regulated through CFIA = product consistency -no need for NASM plan• biosolids pellets - Windsor, Detroit and Toronto - similar in nutrients
Challenges:
• Low K = not the product of choice if potash is important requirement• Can heat and ignite in storage • Water treatment processes result in differences in aluminum, calcium,
iron levels which could affect phosphorus availability, in low pH soils• Pellets application rate restricted to meet heavy metals limits (~1 T/ha for
Toronto pellets)

Label (guaranteed analysis) v.s. “real analysis”Label: 4.6 – 6.0 - 0
Actual: 5.0 – 6.7 – 0Available: 2.6 -5.3 - 0

Biosolids Pellets ComparedWindsor Toronto Detroit

Biosolids Pellets ComparedWindsor Toronto Detroit
Dry MatterTotal NAmmonium N
PhosphorusPotassium
3.7SulphurMagnesiumManganeseCalciumSodiumOrganic MatterC:NpH
188.3 92.6 94.265.4 88 95.43.6 1.3 ?
67.3 108.2 57.73.7 2.8 5.4
17 21 ? 6.6 9.8 7.20.7 0.6 0.3
26.4 63.6 35.43 2.6 3.8
1,266 1,169 1,4489.7 :1 6.6 :1 7.6 :1
6.6 6.5 6.2
lbs/ton

Toronto Biosolids Pellets applied at 3 ton/ac

Toronto Biosolids Pellets applied at 3 ton/ac

LystegroWhat Is It?
• Regulated through CFIA - treated as a fertilizer material• Patented process that combines sewage biosolids + potassium
hydroxide + heat (70 °C) + a lysing process
Benefits:
• 14-15% dry matter ~ 50 – 35 – 20 lbs/1000 gal of available N-P205-K20 in year of application
• high sulphur (~14 lbs) and high organic matter (> 500 lbs) content• Custom applied• Available N - P2O5 - K2O - S value: ~$ 90 – 120 / 1000 gal
(difference is value placed on residual N)
Challenges: • High pH, high NH4-N = high volatilization risk• Requires immediate incorporation or injection

Label (guaranteed analysis) v.s. “real analysis”Label: 3 – 3 – 2
Actual: 6 – 7 – 2
73.31
51.12
88.38
35.35
23.25
20.93
6.27
3.65

Anaerobic DigestateWhat Is It?• By-product of anaerobic digesters – strategy for GHG reduction• Composition will vary with inputs – testing is important• Opportunity for liquid solid separation – further composting?
Benefits: • Higher N & lower C:N ratio compared to pre-AD
• Available N - P2O5 - K2O - S value: ~$ 18 – 25/1000 gal(difference is length material has been stored)
Challenges:• ↑ NH4-N and ↓C:N ratio – similar composition to liquid hog manure• Higher risk = more management
– Application rate, uniformity, timing is more important– ↑pH, ↑ NH4-N – Higher risk of volatilization & leaching

Liquid – Solid Separation – an ExampleWater is the most expensive manure “nutrient” to transport – separating out the water would solve many nutrient and logistical problems• easier to broker solid manure• economics of storage
Example: Average Liquid Dairy Manure:8.5 % Dry Matter → liquid/solid separation to 90% DM
6,000 gal tanker 10 ton spreader145-83-135 lbs available N-P-K 400-347-566 lbs available N-P-K1 load covers ~1.5 acres 1 load covers ~ 6 acresCost ~ $40/acre Cost ~$ 8.00/acreLow P, high K liquids can be summer applied to forages or corn fields close to storage

Organic Amendment Trial• Grey, Dufferin, Wellington and South Simcoe
• 2015 5 fields 2016 4 fields 2017 4 fields (Lystegro, digestate & manure)
3 treatments: 3 replicates
4,500 gal/ac LysteGro 3,000 gal/ac LysteGro NPK equivalent commercial fertilizer blend
Measurements:
Soil – pre application tissue analysis, soil samples, soil nitrate (silking) Yield, moisture, test weight Stalk nitrate, grain protein
LysteGro
Fertilizer Equivalent

Application Rates160 bu/ac CORN
CROP REMOVAL
LYSTEGRO gal/acBioEn
3,000 gal/acFinisher Hog
gal/ac
4,500 3,000 Pit Fresh 3,000NITROGEN lbs/ac 132 195 130 50 100 174
P205 lbs/acre
67 284* 189* 10 30 51
K20 lbs/acre
46 122 81 19 33 108

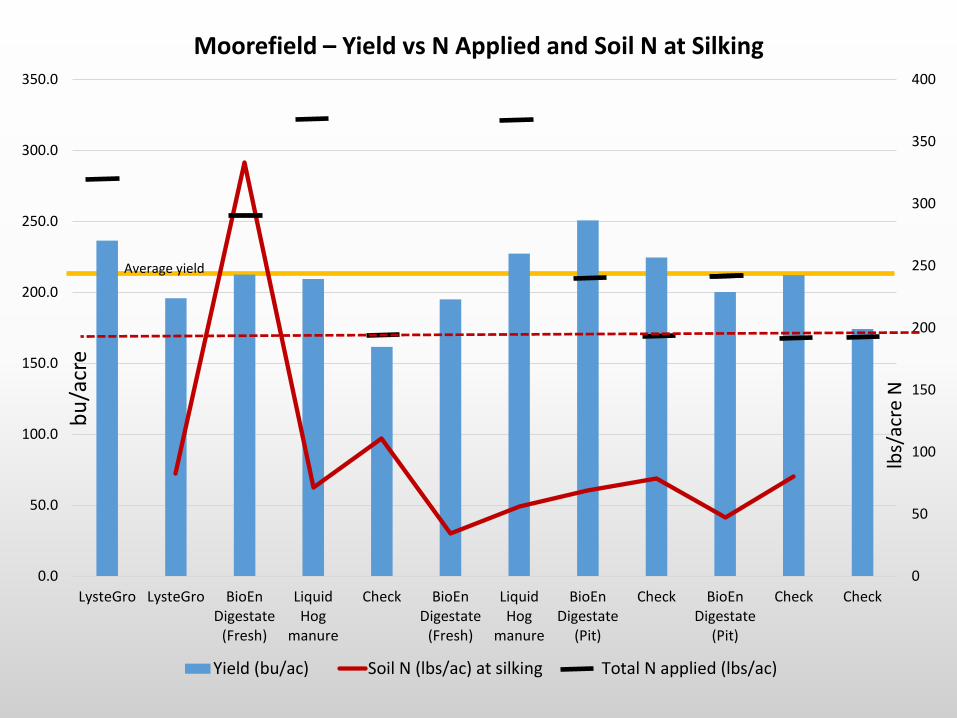
2017 In-Crop Application – Moorefield Site

Nutrients Applied from Organic AmendmentsAS-APPLIED LysteGro BioEn (Pit) BioEn (Fresh) Finisher Hog
Dry Matter % 12 1 3 4.2Total N lbs/1000 gal 67 18.5 39 66NH4-N lbs/1000 gal 35 15 27 48
Available N lbs/1000 gal 43 17 33 58Avail P (80%) lbs/1000 gal 63 3.3 10 17
Avail K lbs/1000 gal 27 6.4 11 36OM lbs/1000 gal 260 50 180 300pH 8.1 7.8 7.8 7.2
C:N ratio 5:1 2:1 3:1 3:1Sulphur (Elemental) lbs/1000 gal 19 1.3 5.1 6.3
Bulk Density lbs/ft3 53.7 62.7 62.8 64.4Total Salts (EC) ms/cm 14.2 12.1 16.6 28.5
Sodium (Na) lbs/1000 gal 10 5 11 9Aluminum (Al) lbs/1000 gal 7.7 0.4 1.1 0.1
Boron (B) lbs/1000 gal 0.03 0.003 0.01 0.03Calcium (Ca) lbs/1000 gal 104 5.6 15 11Copper (Cu) lbs/1000 gal 1 0.05 0.07 0.6
Iron (Fe) lbs/1000 gal 87 3.7 6.6 1Magnesium (Mg) lbs/1000 gal 5.5 0.4 1.6 6Manganese (Mn) lbs/1000 gal 0.5 0.2 0.2 0.2
Zinc lbs/1000 gal 0.9 0.05 0.2 0.5

OM DM basis: 101 66 790 1,178at typical rate 2,020 231 3,950 1,500 - 3,500

OM DM basis: 768 210 373 489 333at typical rate 3,840 2,100 3,730 2,445 1,000

What did we Learn?• 2015 and 2017 – wet growing season with significant
denitrification resulted in yield increase from slow release organic N (~12-16 bu/ac)
• 2016 – dry growing season resulted in less yield difference, yet much higher yields than expected given low rainfall (~1 bu/ac)

92949698
100102104106
Melancthon Shelburne New Lowell Meaford Average
86889092949698
100102104106
Moorefield Dundalk New Lowell Meaford Average
Lystegro 4,500 gal/ac Lystegro 3,000 gal/ac N-P-K Equivalent

What did we Learn?
• Strong relationship (2016) to yield and potash in fields
with low K
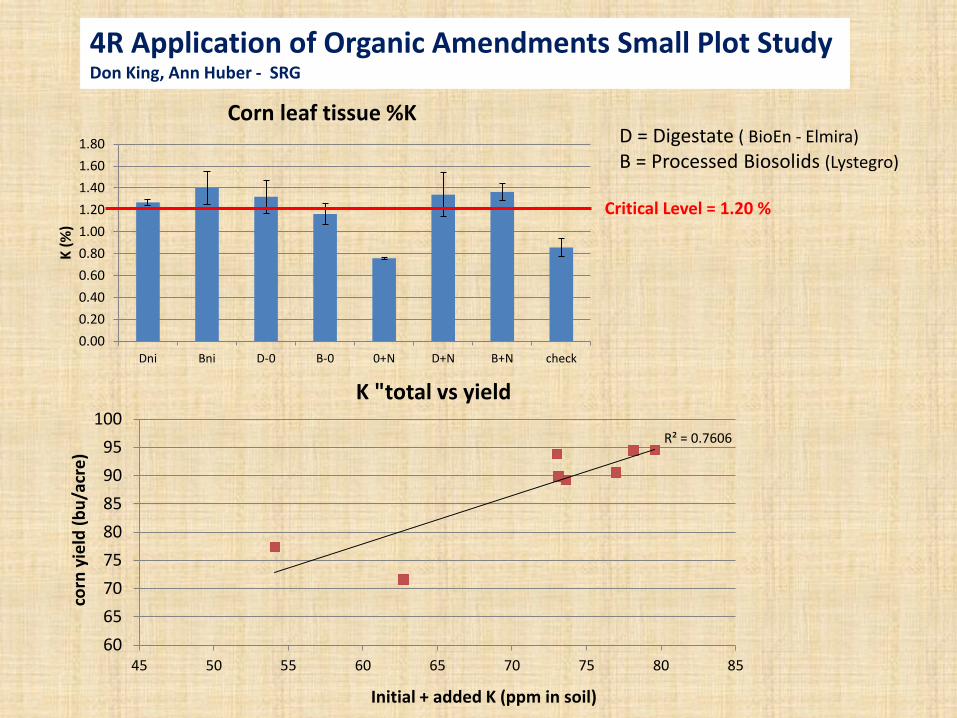
D = Digestate ( BioEn - Elmira)B = Processed Biosolids (Lystegro)
4R Application of Organic Amendments Small Plot StudyDon King, Ann Huber - SRG
R² = 0.7606
6065707580859095
100
45 50 55 60 65 70 75 80 85
corn
yie
ld (b
u/ac
re)
Initial + added K (ppm in soil)
K "total vs yield
Critical Level = 1.20 %
0.000.200.400.600.801.001.201.401.601.80
Dni Bni D-0 B-0 0+N D+N B+N check
K (%
)
Corn leaf tissue %K
0
50
100
150
200
250
300
350
400
0.0
50.0
100.0
150.0
200.0
250.0
300.0
350.0
LysteGro LysteGro BioEnDigestate
(Fresh)
LiquidHog
manure
Check BioEnDigestate
(Fresh)
LiquidHog
manure
BioEnDigestate
(Pit)
Check BioEnDigestate
(Pit)
Check Check
Moorefield – Yield vs N Applied and Soil N at Silking
Yield (bu/ac) Soil N (lbs/ac) at silking Total N applied (lbs/ac)
bu/a
cre
lbs/
acre
N
Average yield

R² = 0.1217
0
20
40
60
80
100
120
50.00 60.00 70.00 80.00 90.00 100.00 110.00 120.00 130.00
NIT
ROG
EN (L
BS/A
C)
YIELD (INDEXED (BU/AC)
Moorefield - Yield vs N applied and Soil N (silking)
Yield vs Soil N at silking (lbs/ac)
Highest Soil N = lowest yield

BMPVD project – Trinier Site
D=Digestate B=Lystegro N= nitrogen ni= nitrogen inhibitor

What did we Learn?• Organic nitrogen does continue to become available from organic
amendments • Too much nitrogen is an issue – does it reduce yield potential?• Lystegro had significantly higher organic nitrogen – also higher
amounts left at the end of the season• Nitrogen inhibitor did appear to “tie-up” nitrogen
Summary:• Addition of Organic Amendments, including digestate and hog
manure, especially on low fertility soils did increase soil fertility and yields.
• Lystegro at a cost of $35/1000 with over $75 N-P-K value and average 12 bu yield increase is an economic option

0
500
1000
1500
2000
2500
Melancthon Shelburne New Lowell Meaford Average
Corn Stalk Nitrate (ppm) Fall 2016 vs Soil N ppm (PSNT) June 2017
4,500 gal/ac 3,000 gal/ac N-P-K equivalent2017 Crop: Canola Soybeans Soybeans Soybeans
14 14 14Soil N (ppm)
15 18 16 12 12 14 16 13 13 13 12 14
Stal
k N
ppm
More N applied than required
Deficient

Opportunities with Organic AmendmentsIssues: • municipal organics production - daily• application –
o limited to growing season o no application when soils are frozen or snow covered.
• Storage of liquids is expensive • Storage of solids (temporary field storage options)• Solids have lower environmental risk
Opportunities: Mixing materials to match needs• Examples: ↑carbon solid + ↑ N liquid = ↑ nutrient concentration
= ↑ marketability to agriculture (e.g. digestate mixed with leaf-yard based compost)
• match nutrient needs vs organic matter• match products to where they have greatest benefit

Opportunities with Organic Amendments• Marketing to agriculture
• Example immature compost – as a potential market• Mixing products to match niche markets• Government initiatives
• Soil Health (GLASI funding for adding OM)• Lake Erie phosphorus reduction• Climate Change
• Improving logistics • Shared transportation? Improved efficiency?• Working with fertilizer industry
• 4R initiative• Storage/ marketing/application opportunities for
“August-October” applications with cover crops• Component of Neighbourhood nutrient plans?

Winter Spreading: Agronomic & Environmental Pitfalls

Liquid Loadingfrozen = no infiltration
ALL soils have “High” runoff potential

Opportunities for New Technology? Strip Tillage
• Reduce soil disturbance – increased residue between strips
• Incorporate nutrients (manure) in fall
• Plant into strips in spring
• Utilize GPS /GIS
• Utilize N-inhibitors?

The Goal – Extending the Application SeasonUsing N-Inhibitors?
• ~$12/ac to apply with manure (~2.1 L/ac)• Slows conversion from ammonium-N to nitrate-N• Fall applied liquid manure
• less fall/winter loss? (more N in spring?)• Less environmental loss (less GHG emissions?)
Side-by-side comparisons needed!!
Instinct ll = eNtrench (Dow)
• US study (2009-2015)• > 7 bu/ac ↑ yield (ave)
Yield
bu/ac
# of comparisonsYield advantage from N inhibitor

Manure Value – Application to Fields with High v.s. Low Soil Fertility
ManureDry
Matter
NitrogenP2O5
1 K2O
Net Value (after application)3
FallApplied
Spring Applied
High Fertility Field
Low Fertility Field
Rate2
Liquid manure % lb/1000gal $/acre $/acre /acreCattle 8.6 12 18 16.5 27 ($ 33) $ 105 8,000 gal
Swine (SEW ) 1.7 8.5 16 11 12 ($ 58) $ 16 8,000 galSwine(Finishers)
5 18 33 28 29 $ 6 $ 127 5,000 gal
Poultry (Layer) 10 28 48 50 31 $ 30 $ 139 3,000 gal
Solid Manure % lb/ton $/acre $/acre /acreCattle(light bedding)
21 4.1 6.1 7.5 13 ($ 2) $120 15 ton
Cattle (heavy bedding)
45 6.5 6.6 13 13 $ 15 $ 127 10 ton
Sheep/Goats 35 5.5 6.6 11.5 19 $ 6 $ 130 10 tonHorse 37 3 - 2 5.5 9 ($ 16) $ 41 10 tonPoultry (Broilers) 66 31 38 52 39 $ 64 $ 184 4 ton1Total available P2O5 is shown in this table. At least half of the P will be available in the year of application 2 Applied for a corn crop at a rate that will increase soil test P between 1 - 2 ppm3 Net value does not account for the distance between storage and neighbouring fields.Values are based on application cost of $0.015/gallon or $4/ton; manure incorporated within 24 hrs and based on N-P-
1Total available P2O5. At least half of the P will be available in the year of application 2 Applied for a corn crop - rate could increase soil test P between 1 - 2 ppm3 Net value doesn’t account for distance between storage and neighbouring fields.Values are based on application cost of $0.015/gal or $4/ton; incorporated within 24 hrs and based on N-P-K equivalent where N is $0.41/lb; P2O5 is $0.57/lb and K2Ois $0.36/lb. OM & micronutrient values not included.
Value of available nutrients minus cost of application
It takes years to see payback on P & K on high fertility soils

Neighbourhood Nutrient Management Planning
• Moves manure from areas of high fertility to areas of low fertility
• developed cooperatively with livestock and cash crop farms with third party 4R consultant - paperwork, (maps, crop rotation schedules, manure analyses and soil tests)
• manure analyses would pre-determine value of available N, P205, K20
• explore opportunities
• community storages,
• pipe-lines (manure from central location) decrease transportation costs / road issues

Crop rotations in application plan - minimize compaction and maximize nutrient efficiency - manure to a growing crop or post wheat with cover crops
Neighbourhood Nutrient Planning

Neighbourhood nutrient management plan benefits• Manure - nutrients and OM at times that maximize nutrient
utilization• Low value liquid manure applied to forages, standing corn
• Low value solid manure could be transported to low OM soils
• Trade straw and/or pay for value of manure fertilizer equivalent
• The livestock operator receives financial benefit for nutrients that would take many years to provide a pay-back `+
• Consultant does planning, record keeping, sampling, nutrient balancing with fertilizer, etc.,

Variable Rate Manure – Site Specific Rates?
• Rates based on N or P – usually P
• Opportunity to inject / co-apply commercial N
• Opportunity to “skim” un-agitated manure to apply low P-high NH4-N material to fields closest to storage and nutrient rich (high P) to fields further from storage

Manure Application onto Growing crops
• Spring application on winter wheat
• After planting up to side-dress in corn
• Forages /pastures
• After wheat harvest with cover crops (slurry seeded)

Application into standing crops


Compaction PenaltyScott Shearer – Ohio State University (presented Jan 14 2016 CCA conference)
Machine Trafficked Area (%)
Yield Reduction Prediction (200 bu/ac No-Till corn Base)
Normal Wet
Traffickedyield
Field Ave Trafficked yield
Field Ave
Grain Cart 14 175 196 148 193
36 row Planter 6.7 190 199 171 198
16 row Combine 17.1 176 196 150 192
Manure Application 44.7 189 195 168 186
27 bu/ac x 45% x $4.50/bu = > $50/acEconomics: Wheat in rotation – opportunity for cover crops and manure plus $50 compaction reduction

Potential Yield Reduction from Compaction with Manure Application
Normal Soil Moisture
Wet Soil Moisture
~ Yield Impact /ac($4.50/bu corn)
Spread width
TraffickedArea (%)
Traffickedyield
Field Average
Trafficked yield
Field Average
Normal Soil
WetSoil
10 ft 40
189 195 168 186
$ 11 $ 50
$ 7 $ 3020 ft 25
$ 4 $ 1830 ft 15
$ 2 $ 1050 ft 8
Adapted from Scott Shearer 2016 presentation to Ontario CCA

Right rate• Uniform application • Frequent analysis - nutrient content (,OM, C:N, pH)• Calibrate equipment - apply rate to meet crop needs
Right application timing• Apply in spring or into growing crops• After cereal harvest apply with cover crop• Non growing season manure should be incorporated
Right field• Select crop that needs the nutrients • Ensure field soil conditions maximize infiltration / minimize runoff
Right placement • Rapid incorporation/injection to minimize ammonium-N volatilization • Avoid concentrated deep placement to minimize leaching /movement to tile
Right storage management• Permanent cover helps reduce storage N losses (high pH materials)• Runoff management of temporary storages (fields)
BMPs to Maximize Nutrient & OM Value

Christine BrownField Crop Sustainability SpecialistOMAFRA - [email protected]: @manuregirl


![Developments in upgrading digestate Pelletizing - …...Nutrients of digestate 5 Type of digestate DM [%] N total [kg/m³] NH 4 [kg/m³] P 2 O 5 [kg/m³] K 2 O [kg/m³] Liquid digestate](https://static.documents.pub/doc/80x56/5fb935f7ef3b3f270171ee43/developments-in-upgrading-digestate-pelletizing-nutrients-of-digestate-5-type.jpg)


