Page 1
South Africa’s Shale Gas Resources – Chance or Challenge?
Clara Orthofera,b,∗, Daniel Huppmanna, Volker Kreya
aInternational Institute for Applied Systems Analysis (IIASA), Schlossplatz 1, 2361 Laxenburg (Austria)bTechnical University of Munich (TUM), Arcisstrae 21, 80333 Munich (Germany)
Abstract
South Africa faces the triple challenge of (a) fueling its economic development by meeting the rapidly grow-
ing energy demand; (b) increasing the reliability of its power system; and (c) letting domestic greenhouse gas
emissions peak between 2020 and 2025 in line with its pledge to the UNFCCC under the Paris agreement.
Recently discovered domestic shale gas reserves are currently under evaluation as a potential new energy
source, to provide clean, reliable and cheap electricity while mitigating greenhouse gas emissions. But, the
impact of shale gas on greenhouse gas emissions is far from settled. In order to evaluate if shale gas can play
a viable role in solving South Africa’s energy dilemma, we apply a country-level version of the integrated
assessment model MESSAGE to analyze and quantify the interdependence between shale gas extraction and
climate change mitigation effort regarding the South African energy pathways and its domestic greenhouse
gas emissions.
Our results illustrate, that low cost shale gas can lower the overall energy system costs compared to
the no-shale-gas counterfactual. At the same time, a system with abundant low cost natural gas from shale
sources requires a stronger carbon price signal compared to the no-shale-gas scenarios in order to achieve the
same desired mitigation goals. Therefore, reaching the mitigation goals might be more economically achiev-
able utilizing low cost shale gas in combination with a more stringent climate policy measure compared to a
no-shale-gas scenario.
Keywords: MESSAGE, carbon tax, scenario analysis, COP 21, INDC, Integrated Assessment Modeling
∗Corresponding authorEmail addresses: [email protected] (Clara Orthofer), [email protected] (Daniel Huppmann),
[email protected] (Volker Krey)
Page 2
1. Introduction
South Africa’s economy is one of the most carbon-intensive in the world (Alton et al., 2014; Winkler,
2007). Compared to the global average, South Africa’s CO2 emissions per capita are about twice as high
and CO2 emissions per unit of GDP are close to three times as high (Table 1). Abundant coal resources and
a heavily subsidized mining sector used to attract and support energy-intensive industries and a power sector
based on coal. Today those carbon intensive consumers are the major drivers of economic development in
South Africa (Klausbruckner et al., 2016). In spite of the large domestic resources, the power sector has
experienced shortages and blackouts due to suboptimal management, the reliance on old and inefficient coal
power plants, and the rapid increase in power demand. This energy shortage resulted in fast-rising electricity
prices which today hamper economic development (Eberhard et al., 2014).
Table 1: Key indicators on South Africa’s energy and CO2 emission intensity in comparison to the world in the model base year (2010)
and the latest published year (2014) (WB, 2016b; BP, 2016; IEA, 2014).
South Africa World2010 2014 2010 2014
Population millions 51 54 6 900 7 200
Gross Domestic Product (GDP) billion USD2010 375 410 65 600 72 900
Primary Energy Supply (PES) EJ 5.9 6.3 544 574
CO2 Emissions MtCO2 410 440 30 500 32 400
PES per Capita GJ/capita 117 113 80 80
CO2 per Capita tCO2/capita 8.0 8.1 4.4 4.5
CO2 per GDP kgCO2/USD2010 1.1 1.1 0.5 0.4
Recently, the South African government committed to a significant reduction of greenhouse gas (GHG)
emissions (UNFCCC, 2015). At the 2015 Conference of the Parties in Paris (COP21), South Africa con-
firmed and strengthened its intention to reduce GHG emissions. According to the Paris agreement, the
Nationally Determined Contribution (NDC) of South Africa envisions GHG emissions to peak no later than
2030, and to achieve a decline of GHG emissions thereafter (UNFCCC, 2015). As shown in Figure 1, the
proposed trajectory implies a significant structural transformation of the South African energy system, as it
departs drastically from current emissions projections under ”business-as-usual” assumptions (Klausbruck-
ner et al., 2016; Henneman et al., 2016).
2
Page 3
One potential structural measure for ending South Africa’s energy crisis is currently under governmental
review and subject of heated public debates: industrial-scale hydraulic shale gas fracturing (so called frack-
ing), a technique enabling natural gas production from previously uneconomic shale gas resources (CSIR
and SANBI, 2016). With its lower CO2 emissions compared to coal, natural gas derived from shale is con-
sidered a possible remedy for South Africa’s energy challenge. It may allow to satisfy the growing energy
demand while emitting less GHG and other pollutants than the current coal-based power plant portfolio
(Burnham et al., 2012). As with most technological advances, there are supporters and opponents of shale
gas exploitation in South Africa. On the one hand, shale gas fracking opponents voice concerns about the
potential negative social and environmental impacts caused by shale gas extraction. They cite impacts expe-
rienced in the US such as increased threat of earthquakes, water pollution, ground water table lowering, and
methane leakage during the fracking process and relate them to the South African geology and geography
(Esterhuyse et al., 2016). On the other hand, promoters point out the substantial benefits that large-scale
domestic shale gas development could have: economic growth, reduced local air pollution (e.g. sulfur, black
carbon), and decreasing import dependence.
Figure 1: South Africa’s energy-related CO2 emissions as recorded in the past
(1971-2010) and as calculated for a no-carbon-price business-as-usual (BAU,
2010 - 2050) scenario per emissions source. The fair shaded area shows South
Africa’s NDC reduction pledge.
Hence, the benefits and shortfalls of shale gas utilization are to be seen as a multi-dimensional problem
with some researchers valuing the economic and climate benefits higher than the detrimental environmental
3
Page 4
side effects and the other way around. Some researchers find that shale gas could reduce CO2 emissions by
substituting coal as a more efficient and cleaner fuel (Hultman et al., 2011; Cathles et al., 2012; Burnham
et al., 2012; O’Sullivan and Paltsev, 2012). Other studies observe that non-CO2 emissions associated with
the production of shale gas, most importantly fugitive methane, might increase life-cycle GHG emissions
of this fuel to levels above those of coal combustion (Howarth et al., 2011; McJeon et al., 2014; Miller
et al., 2013; Howarth, 2015). These contradicting views pose a challenge to the South African government
when designing and implementing an effective carbon mitigation strategy, while at the same time carefully
balancing the competing goals of cheap and reliable energy, stable economic development, and a clean
and safe environment. In order to inform the debate and facilitate the decision process, the South African
government has commissioned the Strategic Environmental Assessment for Shale Gas Development in South
Africa to conduct a transparent and comprehensive analysis on the effects shale gas fracking (CSIR and
SANBI, 2016).
In the present work, we add to this assessment by evaluating shale gas exploitation as a measure designed
to end South Africa’s energy shortage and mitigate the countries’ fast-rising greenhouse gas emissions.
We conduct an extensive scenario analysis of the GHG mitigation potential of shale gas conducted with a
country-level version of the Integrated Assessment Model MESSAGE.
2. Methodology
To identify the economic boundaries of shale gas development and the associated change in CO2 emis-
sions, we employ a multi-scenario analysis. We utilize a long-term horizon, linear, least-cost integrated
assessment model of the South African energy system (MESSAGEix South Africa). Its main objective is
to explore the uncertainty and evaluate important factors that impact the potential role of gas. Therefore a
lean model was built that enables large scale sensitivity analysis. MESSAGEix South Africa is well-suited
to evaluating the GHG emission impact of shale gas fracking as it describes the entire energy supply system.
The linear model setup is computationally lean, which is a prerequisite for solving a large number of long-
term scenarios to fully explore the ranges of different pathways in terms of emissions and the role of shale
gas in the future South African energy system. This is important for capturing the full picture of system
dynamics behind shale gas, the energy system, the economy and its impact on climate forcing and the entire
set of possible outcomes inevitable in the face of the uncertainty connected to it.
4
Page 5
2.1. The MESSAGEix South Africa model
MESSAGEix South Africa is a country-level application of the Integrated Assessment Model MES-
SAGEix (Model for Energy Supply Strategy Alternatives and their General Environmental Impact), devel-
oped at the International Institute of Applied Systems Analysis (IIASA) over the past decades (Riahi et al.,
2012).
For this analysis, we use the new MESSAGEix platform (Huppmann et al., in preparation): this frame-
work consists of a GAMS implementation of the energy-engineering-economic-environment (E4) optimiza-
tion model; a dedicated database infrastructure for version-controlled management of input assumptions and
model results; interfaces to scientific programming languages Python and R for efficient data processing;
and a web user interface for visualization and analysis. The modeling platform is geared towards efficient
scientific workflows as well as the highest level of transparency of both input data and modeling results.
For developing the MESSAGE South Africa model, we implemented a workflow to collect data from
multiple sources, thereby automating much of the parametrization and calibration of a national energy sys-
tem model. These data sources include the most recent global version of the MESSAGE model (Krey et al.,
2016), statistics provided by the International Energy Agency (IEA, 2016), historical power plant installation
data from CARMA (Ummel, 2012; Wheeler and Ummel, 2008), and various national reports and statistics
(see section 2.2).
Building a ”stand-alone” national model requires assumptions on commodity trade and the global price
levels of fossil fuels to ”close” the model, in particular because of South Africa’s dependence on oil imports
and its substantial coal exports. For our analysis, global commodity prices and upper bounds on imports
and exports are based on the recently published Shared Socioeconomic Pathways (SSP), a scientific narra-
tive framework of socioeconomic development projections for climate change research (Riahi et al., 2017;
O’Neill et al., 2017; van Vuuren et al., 2017). We chose the SSP narrative as they allow us to understand the
results of our analysis in the global development context. Out of the five available SSP scenarios, we based
our assumptions on the moderate development ”middle of the road” pathway SSP2 (Fricko et al., 2017; KC
and Lutz, 2017; Dellink et al., 2017).
The analysis focuses on the medium-term outlook until 2050. This is the time frame of relevance for the
development of a shale gas industry and the horizon that will decide if South Africa can reach the emission
trajectory proposed in the NDC. The underlying model extends to 2100 to avoid ’end-of-timehorizon’ effects,
which might oteherwise bias the numerical results.
5
Page 6
2.2. Data & Scenario Assumptions
In order to maintain consistency with the global version of the MESSAGE model, technology specifica-
tions, development costs and boundaries are based on the region ”Sub-Saharan Africa” of the global data set
(Krey et al., 2016; GEA, 2012). However, we adjust certain parameters, most notably the technology costs,
where better data from national sources was available (Bedilion et al., 2012; Department of Energy, 2013).
Energy Demand:. In our model the energy demand is represented as ”useful energy” demand, i.e. the
demand for energy services such as heating or electric appliances, such that the model endogenously de-
termines the optimal mix of technologies and final energy consumption under the given constraints on the
energy system and policy measures in place. In MESSAGEix South Africa the demand is split into three
energy-consuming sectors: residential & commercial (RC), industry and transport (Table 3). The energy
demand of the RC and industrial sectors is split into a specific electric and a thermal demand as well as
a consumption of non-energy feed-stock in the petrochemical industry. This detailed representation of fu-
ture energy consumption is extrapolated for South Africa based on the historical development and the SSP2
scenario parameters.
Energy Resources & Potentials:. Data on fossil energy commodities considered in the model are based on
national and international resource assessments (Table 2). The renewable energy potential was estimated
based on spatially disaggregated data set available online (Tables 4, 5 & 6) (Eurek et al., 2016; Pietzcker
et al., 2014). Considering the vast wind energy potential of South Africa, only the on-shore wind energy po-
tential of production sites close (0-50 miles) to consumption sites was considered for this analysis. However,
not even this small share of South Africa’s wind power potential was fully exploited in any of the scenarios.
Utilization of renewable power potentials in MESSAGEix South Africa is based on a linear representation
distinguishing across multiple availability classes (Sullivan et al., 2013). The formulation also considers
system-wide impacts regarding the reliability of variable renewable energy sources and ensures sufficient
installation of firm, dispatchable capacity.
Greenhouse Gas Emissions:. MESSAGEix South Africa calculates GHG emissions ’production-based’,
i.e. only fuels combusted and fugitive emissions occurring within country-boundaries are contribute to
the country’s GHG emissions. In the current version, the most important GHGs from the energy system,
CO2 and CH4 , in 2010 representing about 85 % of total GHG emissions, or 99 % of GHG emissions from
6
Page 7
the energy system, are accounted for in the model (WB, 2016b; Witi et al., 2014).1 The emission factors
are based on literature. The CO2 emission factors are based on emission factors based on IPCC national
inventory guidelines (IPCC, 1996), the CH4 emission factors are based on recent research by Hoglund-
Isaksson (2017). In order to compare the modeled emission trajectories to the national GHG reduction path
proposed in the NDC, we adjust the trajectories by the proportional share of non-CO2/CH4 and non-energy-
related emissions.
Carbon Price:. A suite of policies will be enacted to meet South Africa’s emission mitigation goals; these
will include fiscal incentives, regulatory policies and public financing. However, for the purpose of this study
we decide to use carbon pricing as a proxy mechanism to represent the effect induced through a balanced
policy portfolio. The marginal carbon tax rate proposed in the current draft of South Africa’s carbon tax bill
is 9 USD/tCO2 (120 ZAR/ tCO2) (Ministry of Finance, 2015). Taking into account the multiple tax exemp-
tions in the bill, the effective rate is estimated to vary between 0.4 to 3.5 USD/tCO2 (6 to 48 ZAR/ tCO2)
(WB, 2016a). The South African government proposes an escalation rate for the carbon tax of 10 % for the
first two years (2017 – 2019) (Ministry of Finance, 2015). However, the carbon tax bill has not yet been
implemented and no decisions have been made on how the tax will develop after the first introduction phase.
Thus we assume that there will be no carbon price before 2020. We test various levels of the introductory
carbon price and project an escalation of 5 % per year across all sectors and industries.
Shale Gas:. The shale gas volumes considered in the model are based on the shale gas availability assess-
ment by the eia (2015). Their assessment concludes that 370 tcf (400 EJ), i.e. around 60 times South Africa’s
current primary energy use or close to global primary energy use in 2015 (500 EJ), of shale gas are techni-
cally recoverable in South Africa. This might be an overestimation of the realistically extractable resource
volume (Geel et al., 2013), but, as the resource volume is found not to be the limiting factor to the shale
gas extraction across scenarios, the impact of the overestimation is not significant. The growth limitations
for the shale gas industry are based on the growth rates experienced in the U.S. (e.g. Fayetteville, Marcel-
lus, Woodford, Bakken, Haynesville and Barnett plays) (eia, 2016a; Richter, 2015). In our model we limit
the South African shale gas production during the first decade of production to 50 % of the respective U.S.
production growth rates because South African does not yet have the necessary gas infrastructure, including
1The global warming potential metric used by the model is based on the cumulative forcing potential over 100 years as listed in the
IPCCs Fifth Assessment Report (Myhre et al., 2014).
7
Page 8
long-distance pipelines and local distribution networks. This calculation results in a annual production limit
during the fist decade of 1 EJ/a and thereafter in an annual growth rate of ±10 %, which confirms literature
estimates on on South Africa’s shale gas industry potential (Altieri and Stone, 2016).
Given the numerous uncertainties connected to shale gas exploitation in South Africa, we base our study
on a analysis of more than 10,000 scenario. Within those scenarios we vary the most influential input
parameters across a wide range of values: (a) the average shale gas extraction cost, (b) the average effective
carbon price, (c) the price development of imported fossil fuels and (d) the assumed growth parameters of
the import and export markets.
Carbon Capture and Storage:. We consider carbon capture and storage (CCS) technologies in the transfor-
mation as well as in the power sector.2 As carbon capture and storage technologies are not yet available on
commercial scale to the South African market, the first year of operation is defined to be 2030 earliest.
2.3. Scenario Description
No-Shale-Gas Scenarios:. We first construct a set of scenarios which exclude shale gas exploitation in order
to provide a reasonable counterfactual with which to assess the implications of shale gas utilization. This
no-shale-gas scenario set considers 61 introductory carbon price levels ranging from 0 to 60 USD/tCO2and
escalating at 5 % per year. This extensive range reflects (a) the high carbon prices required for limiting global
warming to 1.5°C (Aldy et al., 2008), (b) the low effective carbon tax level scheduled for introduction in
South Africa (3.5 USD/tCO2) and (c) the current situation of no effective carbon price (Ministry of Finance,
2015).
Shale Gas Scenarios:. The scenarios introduced now consider shale gas utilization under thirty different
extraction cost levels ranging from 1 to 10 USD/GJ and the same carbon prices as in the first set of scenarios.
For the first part of the analysis, we reduce the number of scenarios to the seven representative carbon tax
levels already evaluated in the no-shale-gas scenario section to focus on the salient aspects. The subsequent
analysis uses the entire set of 1800 scenarios.
2CCS-capable fuel transformation technologies available to the model are: coal to methanol, synthetic liquids (coal to light and fuel
oil) and gas to methanol. CCS-capable power plants technologies available to the model are: coal, integrated coal gasification and gas
combined cycle power plants.
8
Page 9
3. Results
We now consider the differences in results between the scenarios with and without a carbon price without
shale gas available and the same scenarios with shale gas available at various cost levels in terms of energy
demand, efficiency of the energy system, GHG emissions and the GDP development.
3.1. Temporally Aggregated Scenario Results
Figures 2 and 3 show the temporally aggregated results of 1,800 shale-gas-scenario runs. All plots show
the cumulative values of one specific variable over the time horizon (2020-2050) for each of the scenarios.
0 10 20 30 40 50 60Carbon Price [USD/tCO2]
2
4
6
8
Sha
le G
as C
ost [
US
D/G
J]
25
5075100
125
ShaleGasExtraction [EJ]
0
25
50
75
100
125
150
175
(a) Shale Gas Extraction [EJ]
0 10 20 30 40 50 60Carbon Price [USD/tCO2]
2
4
6
8
Sha
le G
as C
ost [
US
D/G
J]
80
120
160
200
240280
320
PrimaryEnergyConsumption [EJ]
40
80
120
160
200
240
280
320
360
(b) Primary Energy Consumption [EJ]
0 10 20 30 40 50 60Carbon Price [USD/tCO2]
2
4
6
8
Sha
le G
as C
ost [
US
D/G
J]
120
160
200
240
280
CoalExtraction [EJ]
80
120
160
200
240
280
320
(c) Coal Extraction [EJ]
0 10 20 30 40 50 60Carbon Price [USD/tCO2]
2
4
6
8
Sha
le G
as C
ost [
US
D/G
J]
24
32
40
48
56 64
7272
RenewableEnergyUse [EJ]
16
24
32
40
48
56
64
72
80
(d) Energy Use from Renewable Sources [EJ]
Figure 2: Cumulative model results (2020-2050) on the usage of renewable energy carriers and fuels.
Shale Gas Utilization and Energy Use:. Shale gas is used if variable extraction costs lie below about
3 USD/GJ. Beneath this cost level, the economics of shale gas extraction depend on the carbon price in
place: the higher the extraction costs, the higher the carbon price needs to be to make shale gas economi-
cally favorable over other fuels (Figure 2a). If shale gas use is economically viable, it reduces coal use by
up to one third (Figure 2c). However, low cost shale gas also reduces renewable energy use by up to 30 %
9
Page 10
0 10 20 30 40 50 60Carbon Price [USD/tCO2]
2
4
6
8
Sha
le G
as C
ost [
US
D/G
J]
-75.00-75.00
-60.00-45.00
-30.00-15.00
0.000.00
CO2Emissions - rel change [%]
90
75
60
45
30
15
0
15
(a) Relative Change:
CO2 Emissions [%]
0 10 20 30 40 50 60Carbon Price [USD/tCO2]
2
4
6
8
Sha
le G
as C
ost [
US
D/G
J]
-2.00-1.60
-1.20
-0.80
-0.40
0.00
GDP - rel change [%]
2.4
2.0
1.6
1.2
0.8
0.4
0.0
0.4
(b) Relative Change:
Gross Domestic Product [%]
0 10 20 30 40 50 60Carbon Price [USD/tCO2]
2
4
6
8
Sha
le G
as C
ost [
US
D/G
J]
300
450600
750
CO2 per GDP [kgCO2/MUSD]
0
150
300
450
600
750
900
(c) CO2 Emitted per GDP [gCO2/USD]
10 20 30 40 50 60Carbon Price [USD/tCO2]
2
4
6
8
Sha
le G
as C
ost [
US
D/G
J]
0
816
16 24
32
GDP loss per t CO2 mitigated [MUSD / GtCO2]
16
8
0
8
16
24
32
40
(d) Mitigation Costs [ USD/tCO2]
Figure 3: Cumulative model results (2020-2050) on CO2 emissions and the GDP. (a) and (b) show the relative change of the scenario
results compared to the no-shale-gas and no-carbon-price baseline scenario. The mitigation costs shown in (d) are here defined as the
ratio between the GDP reduction per ton of CO2 mitigated.
(Figure 2d). While coal use is reduced more significantly at higher carbon prices, renewable energy use is
reduced stronger at low carbon prices.
Energy demand is elastic to energy costs: with increasing carbon prices energy demand decreases but the
availability of low cost shale gas can delay this feedback. The availability of low cost shale gas can therefore
increase the useful energy demand across all scenarios compared to the respective no-shale-gas scenarios.
This is also true for primary energy consumption at most shale gas cost and carbon price levels. But, at
shale gas extraction costs above 2 USD/GJ and carbon prices between 7 to 20 USD/tCO2 the opposite effect
appears: primary energy consumption is decreased by shale gas utilization (Figure 2b). As a result, the ratio
between the useful energy consumption and the fossil primary energy consumption is decreased by shale gas
use in most scenarios, apart from those low primary energy use scenarios at shale gas extraction costs above
2 USD/GJ and carbon prices between 7 to 20 USD/tCO2 .
10
Page 11
Emissions and Socio Economic Implications:. The cumulative CO2 emissions over the 2020 to 2050 time
horizon are strongly reduced with increasing carbon price. The emissions are however also influenced by
shale gas use. At carbon prices above 5 USD/tCO2 shale gas use increases CO2 emissions (Figure 3a). This
effect fades at carbon prices above 30 USD/tCO2.
The gross domestic product (GDP) as a measure for energy system supply cost and elastic demand is
affected by carbon prices and shale gas costs: The higher the carbon prices are, the more expensive the
energy system gets. The cumulative GDP decreases by up to 2 % with increasing carbon prices (Figure 3b).
However this effect can be subdued by the availability of potentially low cost shale gas. The average macro-
economic costs for mitigating one ton of CO2 is for example significantly reduced from 12 to 4 USD/tCO2
at a 5 USD/tCO2 carbon price (Figure 3d). However, the amount of CO2 emitted per USD of GDP generated
is nevertheless increased by shale gas use at carbon prices above 5 USD/tCO2 compared to the same scenario
without economically available shale gas (Figure 3c). It should be noted that the GDP effects described
here do not include benefits from reduced climate change impacts or co-benefits or adverse side-effects of
mitigation action (e.g., reduced air pollution and associated health and environmental impacts).
3.2. Emission Trajectories and the NDC Pledge
No-Shale-Gas Scenarios:. Figure 4a shows the relative greenhouse gas (CO2 & CH4 ) emission reduction
in the no-shale-gas scenarios under different carbon prices relative to the BAU (no-shale-gas and no-carbon-
price) scenario. The figure shows that in all no-shale-gas scenarios the carbon price is the determining factor
for the development of the energy systems emission trajectory. The variations in carbon price induce a strong
variation of emission trajectories and the energy sector’s diversity. We find that even though any positive
carbon price will lead to a reduction in emissions compared to the no-carbon-price scenario, an introductory
carbon price of 7 USD/tCO2 (in 2020, growing at 5% p.a.), or above is required in order to transform the
emission trajectory to resemble the desired peak-plateau-decline development (Figure 4b). If the carbon
price is increased beyond this value the overall level of emissions decreases further and the emission peak
moves towards earlier points in time.
In our model the emission trajectory pledged in South Africa’s NDC can be met without the utilization
of shale gas under the assumptions stated above if a carbon price of 7 USD/tCO2 or above is introduced by
2020, growing to 22 USD/tCO2 by 2050.
Shale Gas Scenarios:. Figure 4b summarizes the energy-related GHG emissions under seven illustrative
carbon price trajectories under various gas extraction costs. It visualizes the impact imposed by carbon
11
Page 12
2020 2025 2030 2035 2040 2045 2050
80
60
40
20
0E
mis
sion
Red
uctio
n (n
sg) [
%]
0 $/tCO21 $/tCO2
3 $/tCO2
5 $/tCO2
7 $/tCO2
15 $/tCO2
61 $/tCO2
NDCpledge
(a) Relative GHG emission reduction [%]
2020 2025 2030 2035 2040 2045 2050
200
400
600
800
Tota
l Em
issi
ons
[MtC
O2e
] 0 $/tCO2
1 $/tCO2
3 $/tCO2
5 $/tCO2
7 $/tCO2
15 $/tCO2
61 $/tCO2
NDCpledge
(b) Absolute GHG emissions [ MtCO2]
Figure 4: Energy-related CO2 & CH4 emissions at selected carbon prices under various gas extraction costs. The gray shaded area
shows South Africa’s NDC reduction pledge (UNFCCC, 2015) (a) shows the relative reduction in the no-shale-gas scenarios under
selected carbon prices relative to the zero carbon price (BAU) scenario. (b) shows the impact of shale gas utilization upon the GHG
emission trajectory. The lines indicate the no-shale-gas scenarios, the shaded areas indicate the emission range if shale gas is available
at various extraction costs. The figure shows that shale gas utilization decreases emissions at low carbon prices (green), but increases
them at moderate to high carbon price levels (red).
price and shale gas extraction costs upon the emission trajectory. While Figure 4a is about the relative
emission reduction, Figure 4b displays the development of the absolute GHG emissions of the scenario sets.
The figure displays the temporal disaggregation of what has been found before: shale gas utilization can
impact South Africa’s energy-related GHG emissions in either direction depending on the carbon price and
the shale gas extraction costs. While at low carbon prices, the availability of shale gas can lower South
Africa’s GHG emissions, the emissions can increase compared to the no-shale-gas-baselines if carbon prices
of 5 USD/tCO2 an above are in place.
3.3. Impacts on the Power Sector Development
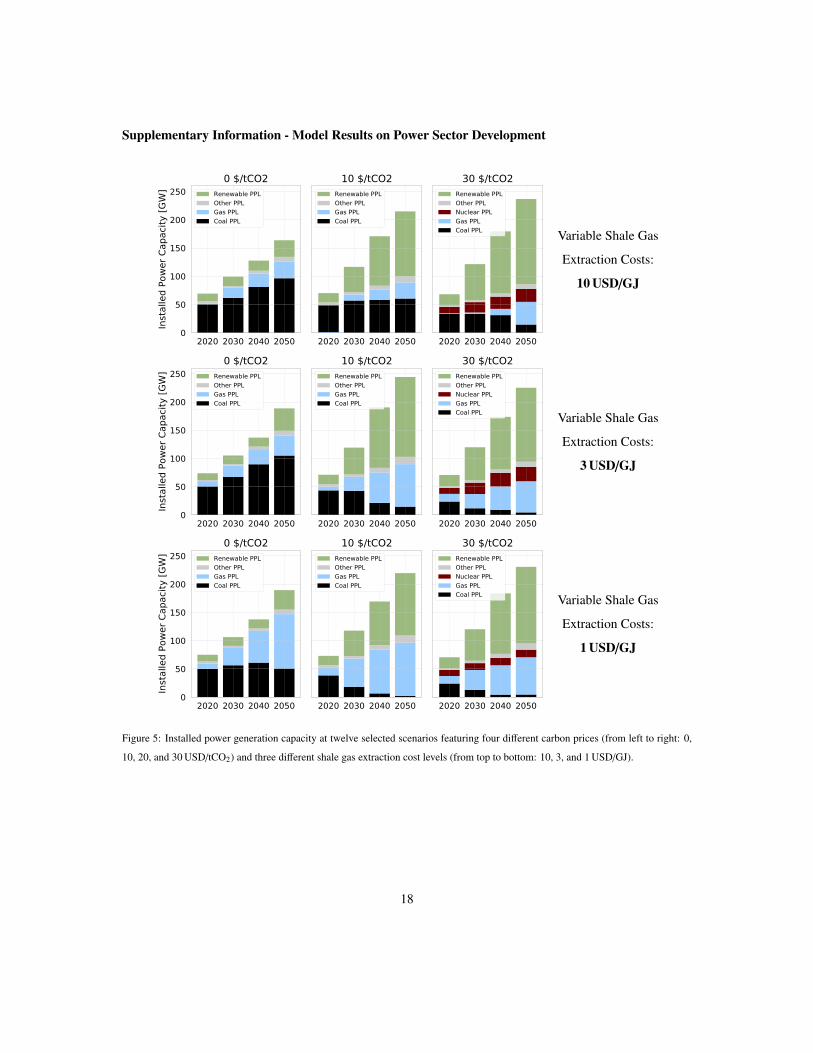
Figure 5 shows the total installed capacity and Figure 6 the total production over the planning horizon
for twelve selected scenarios featuring variable shale gas extraction costs of 10, 3 and 1 USD/GJ and carbon
prices of 0, 10 and 30 USD/tCO2.
High Cost (10 USD/GJ) Shale Gas Scenarios:. The total power generation capacity of the no-carbon-price
and high cost shale gas scenario reaches 155 GW in 2050 whereof the majority is coal fired power plants
(65 %). The power generation over the entire time horizon is also dominated by coal power plants (more
12
Page 13
than 87 %), while renewable power stations supply no more than 9 % to the power generation. The coal
dominated power plant portfolio is complemented with 30 GW of each gas fired (open and combined cycle
gas turbines) and renewable power plants (photovoltaik, solar thermal, concentrated solar and wind power
plants). The remainder is made up of nuclear power stations and electricity imports.
With increasing carbon prices the power demand decreases and the renewable power stations gain share.
At 10 USD/tCO2 the summed power demand over the time horizon reduces by 10 %. 38 % of the power
supply is produced from renewable sources. If the carbon price is increased to 30 USD/tCO2 the renew-
able power generation is further expanded to half of the total power demand and coal power generation is
reduced to 18 %. As coal use is further reduced in this scenario, the remaining power generation is prevailed
by nuclear power stations (20 %). In both scenarios gas power plants persist on low full load hours only
supporting the power system during peak load. The increase in renewable power generation, in the carbon
price scenarios, is accompanied by an increase in total installed power generation capacity: at a carbon price
of 10 USD/tCO2 a total of 210 GW of power generation capacity is installed, at 30 USD/tCO2 this value
further increases to 240 GW (Figures 5 - 6).
Moderate Cost (3 USD/GJ) Shale Gas Scenarios:. In a no-carbon-price scenario, moderately priced shale
gas has a small impact on the system. The lower energy costs compared to the no-shale-gas scenarios
increase energy demand by 9 % even though the majority of electricity is still produced by coal fired power
plants (86 %). However, more electricity is generated in fluctuating renewable power stations (5 %) as they
are complemented by flexible gas fired power plants (5 %).
At a carbon price of 10 USD/tCO2 renewable power generation facilities increase their share enough to
supply close to 40 % of the total power demand. Supported by gas power plants, renewable power reduces
coal power generation to below 50 %. If carbon prices increase further to 30 USD/tCO2 coal power gen-
eration is diminished by 2040 as renewable and gas power stations are complemented with nuclear power
facilities.
Low Cost (1 USD/GJ) Shale Gas Scenarios:. If low cost shale gas is available in abundance, gas fired power
plants dominate South Africa’s power generation fleet with as well as without a carbon price in place. In all
scenarios, the low cost shale gas replaces the otherwise dominating power source.
Without a carbon price in place, low cost shale gas supersedes the otherwise predominant coal power
generation. At a carbon price of 10 USD/tCO2 the gas fired power stations do not only economically out-
compete coal power plants but also renewable power generation, therefore displacing both technologies by
13
Page 14
about the same amount. At a carbon price of 30 USD/tCO2 low cost shale gas supplements a small share
of nuclear power, inducing a power generation portfolio similar to the portfolio exhibited at moderate shale
gas costs.
4. Discussion & Conclusion
South Africa is considering to utilize its shale gas reserves to reduce its high greenhouse gas emissions
and initiate a downward shift in line with its GHG mitigation pledge at the Paris climate conference. In
this paper, we evaluate the consequences of introducing shale gas upon South Africa’s energy-related GHG
emissions and the related implications for South Africa’s ambitions on fulfilling the NDC pledges: reducing
greenhouse gas emissions emissions to 398 - 614 MtCO2-e, including land use, land use change and forestry,
over the period 2025-2030 (UNFCCC, 2015). Our impact assessment extends previous research for South
Africa by constructing a technology-specific assessment model of the South African energy system that in-
corporates global development trends through projections from the SSP2 pathway. Unlike previous studies,
this study evaluates several thousand scenarios to properly capture the full range of shale gas cost and carbon
price assumptions.
The no-shale-gas scenarios confirm and extend the findings of previous research: a carbon price can
effectively reduce South Africa’s energy-related GHG emissions (Merven et al., 2014; Henneman et al.,
2016). As already described in literature, we too find, that already a moderate carbon price of 7 USD/tCO2
(in 2020, growing at 5% p.a.), could reduce the South African GHG emissions by 60 % compared to the
BAU (no-shale-gas and no-carbon-price) scenario, leading to a fulfillment of the NDC pledge (Pegels, 2010).
Additionally our systematic sensitivity analysis add to literature by allowing for a detailed impact assessment
on effects, that carbon prices have upon the countries power system and the energy supply chain.
The shale gas scenarios indicate that: if shale gas is abundant at low cost it can impact South Africa’s
energy future significantly, thereby confirming for South Africa what has previously been found for other
countries (Baranes et al., 2017). Further, the extensive scenario analysis gives insights on how and under
which conditions this impact might occur. We find that for shale gas to have a significant impact, variable
extraction costs have to lie well below 3 USD/GJ. While shale gas extraction costs experienced in the United
States range between 2 to 6 USD/GJ (eia, 2016b), current estimates on shale gas extraction costs considering
the South African geology and infrastructure range between 4 to 10 USD/GJ (CSIR and SANBI, 2016) which
indicates that lowering extraction costs below current estimates would be necessary for shale gas to play a
substantial role. The analysis, however, further reveals, that if shale gas extraction is economically viable,
14
Page 15
it can impact South Africa’s GHG emissions either way, in particular depending on the level of climate
policy ambition in place. We find that under an modestly ambitious climate policy (carbon prices below
5 USD/tCO2 in 2020) shale gas can help lowering South Africas GHG emissions, primarily by substituting
coal as the primary fuel source.3 But, under a more ambitious climate policy, shale gas is competing with
low-carbon fuels such as renewable energy sources, thereby leading to higher GHG emissions. To achieve
the same emissions reduction as without shale gas, it would therefore be necessary to tighten climate policy
and the implied carbon prices. However, with that adjustment of climate policy in place, abundant shale
gas can lower GHG mitigation costs compared to a situation without cheap shale gas resources as well as
provide some economic benefits.
We find, that motivating significant GHG mitigation requires a stronger carbon price signal if abundant
shale gas is available, as overall energy system costs decrease. We conclude, that low-cost abundant shale gas
in synergy with a sufficiently stringent climate policy can potentially pose a least cost solution to reaching
South Africa’s NDC pledge.
While our results provide insights into the South African energy system, an agenda for further research
remains. First, we show that the development of the international energy market has a substantial impact on
the South African energy system and its import and export structure. Therefore nesting the South African
”stand-alone” model into the global MESSAGE model could help create a consistent picture South Africa
in the setting of the global energy market in the SSP2 scenario. This coupled model could then also further
be used to investigate alternative futures from the ensemble of the Shared Socio-economic Pathways (SSP).
Second, our model setup implies that similar results on the interdependencies between shale gas utilization
and GHG emissions are likely to be found for other countries facing similar energy related supply challenges
such as growing demand, cheap domestic coal, potential for shale gas, and growing climate policy ambition.
An extended analysis on such countries including China, Vietnam, India and Indonesia could confirm this.
Acknowledgement
Part of the research was developed in the Young Scientists Summer Program at the International Insti-
tute for Systems Analysis, Laxenburg (Austria) with financial support from the Austrian National Member
Organization and the Peccei Award.
3Considering CO2 and CH4 emissions from combustion as well as fugitive CH4 emissions.
15
Page 16
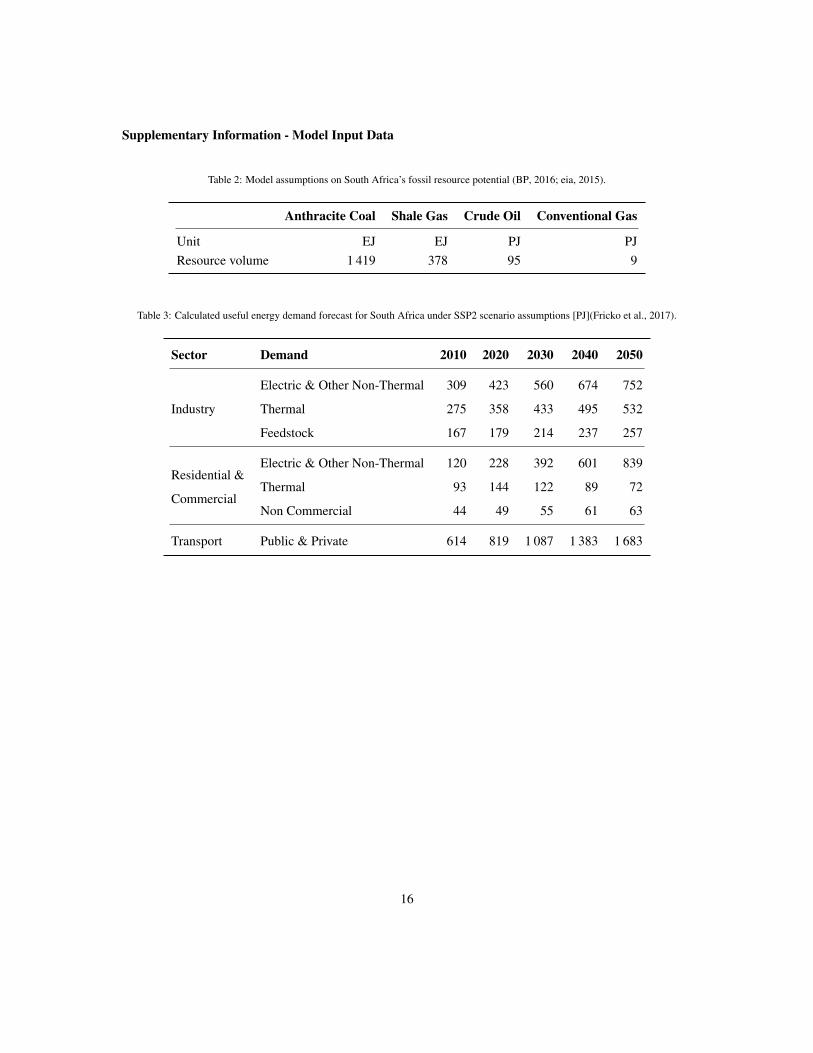
Supplementary Information - Model Input Data
Table 2: Model assumptions on South Africa’s fossil resource potential (BP, 2016; eia, 2015).
Anthracite Coal Shale Gas Crude Oil Conventional Gas
Unit EJ EJ PJ PJResource volume 1 419 378 95 9
Table 3: Calculated useful energy demand forecast for South Africa under SSP2 scenario assumptions [PJ](Fricko et al., 2017).
Sector Demand 2010 2020 2030 2040 2050
Industry
Electric & Other Non-Thermal 309 423 560 674 752
Thermal 275 358 433 495 532
Feedstock 167 179 214 237 257
Residential &
Commercial
Electric & Other Non-Thermal 120 228 392 601 839
Thermal 93 144 122 89 72
Non Commercial 44 49 55 61 63
Transport Public & Private 614 819 1 087 1 383 1 683
16
Page 17
Table 4: Model assumptions on South Africa’s onshore wind power resource potential by wind grade and distance to load [GW] (Eurek
et al., 2016).
Capacity Factor ≥ 0.34 0.34-0.3 0.3 - 0.26 0.26 - 0.22 0.22 - 0.18 ≤ 0.18
near (0-50 miles) 2 64 146 168 317 937
transitional (50-100 miles) 1 30 185 253 228 249
far (100 - 500 miles) 0 0 156 517 992 45
Table 5: Model assumptions on South Africa’s photovoltaic resource potential by full load hours (Flh) and distance to load [GW]
(Pietzcker et al., 2014).
Full Load Hours [h] 1300 1250 1200 1150 1100 1050 1000 950 900 ≤ 850
near (0-50 km) 16 293 1 022 1 548 1 655 715 142 205 190 55transitional (50-100 km) 27 202 768 1 706 1 799 1 068 464 550 371 74
Table 6: Model assumptions on South Africa’s concentrated solar power resource potential by full load hours (Flh) and distance to load
[GW] (Pietzcker et al., 2014).
Full Load Hours [h] 5800 5600 5400 5200 5000 4800 4600 4400 4200 ≤ 4000
near (0-50 km) 9 62 54 221 291 389 161 62 28 47transitional (50-100 km) 12 145 273 571 311 140 84 30 7 21
17
Page 18
Supplementary Information - Model Results on Power Sector Development
2020 2030 2040 20500
50
100
150
200
250
Inst
alle
d Po
wer C
apac
ity [G
W]
0 $/tCO2Renewable PPLOther PPLGas PPLCoal PPL
2020 2030 2040 2050
10 $/tCO2Renewable PPLOther PPLGas PPLCoal PPL
2020 2030 2040 2050
30 $/tCO2Renewable PPLOther PPLNuclear PPLGas PPLCoal PPL Variable Shale Gas
Extraction Costs:
10 USD/GJ
2020 2030 2040 20500
50
100
150
200
250
Inst
alle
d Po
wer C
apac
ity [G
W]
0 $/tCO2Renewable PPLOther PPLGas PPLCoal PPL
2020 2030 2040 2050
10 $/tCO2Renewable PPLOther PPLGas PPLCoal PPL
2020 2030 2040 2050
30 $/tCO2Renewable PPLOther PPLNuclear PPLGas PPLCoal PPL Variable Shale Gas
Extraction Costs:
3 USD/GJ
2020 2030 2040 20500
50
100
150
200
250
Inst
alle
d Po
wer C
apac
ity [G
W]
0 $/tCO2Renewable PPLOther PPLGas PPLCoal PPL
2020 2030 2040 2050
10 $/tCO2Renewable PPLOther PPLGas PPLCoal PPL
2020 2030 2040 2050
30 $/tCO2Renewable PPLOther PPLNuclear PPLGas PPLCoal PPL Variable Shale Gas
Extraction Costs:
1 USD/GJ
Figure 5: Installed power generation capacity at twelve selected scenarios featuring four different carbon prices (from left to right: 0,
10, 20, and 30 USD/tCO2) and three different shale gas extraction cost levels (from top to bottom: 10, 3, and 1 USD/GJ).
18
Page 19
2020 2030 2040 20500
200
400
600
800
1000
Powe
r Gen
erat
ion
[TW
h]
0 $/tCO2Renewable PPLOther PPLCoal PPL
2020 2030 2040 2050
10 $/tCO2Renewable PPLOther PPLCoal PPL
2020 2030 2040 2050
30 $/tCO2Renewable PPLOther PPLNuclear PPLCoal PPL
Variable Shale Gas
Extraction Costs:
10 USD/GJ
2020 2030 2040 20500
200
400
600
800
1000
Powe
r Gen
erat
ion
[TW
h]
0 $/tCO2Renewable PPLOther PPLGas PPLCoal PPL
2020 2030 2040 2050
10 $/tCO2Renewable PPLOther PPLGas PPLCoal PPL
2020 2030 2040 2050
30 $/tCO2Renewable PPLOther PPLNuclear PPLGas PPLCoal PPL Variable Shale Gas
Extraction Costs:
3 USD/GJ
2020 2030 2040 20500
200
400
600
800
1000
Powe
r Gen
erat
ion
[TW
h]
0 $/tCO2Renewable PPLOther PPLGas PPLCoal PPL
2020 2030 2040 2050
10 $/tCO2Renewable PPLOther PPLGas PPLCoal PPL
2020 2030 2040 2050
30 $/tCO2Renewable PPLOther PPLNuclear PPLGas PPLCoal PPL Variable Shale Gas
Extraction Costs:
1 USD/GJ
Figure 6: Power generation at twelve selected scenarios featuring four different carbon prices (from left to right: 0, 10, 20, and
30 USD/tCO2) and three different shale gas extraction cost levels (from top to bottom: 10, 3, and 1 USD/GJ).
19
Page 20
References
Aldy, J., Ley, E., Parry, I., 2008. What is the Role of Carbon Taxes in Climate Change Mitigation? Poverty
Reduction and Economic Management Network Notes (2).
URL http://www1.worldbank.org/prem/PREMNotes/Note2_role_carbon_taxes.pdf
Altieri, K. E., Stone, A., 2016. Prospective Air Pollutant Emissions Inventory for the Development and
Production of Unconventional Natural Gas in the Karoo Basin, South Africa. Atmospheric Environment
129, 34–42.
Alton, T., Arndt, C., Davies, R., Hartley, F., Makrelov, K., Thurlow, J., Ubogu, D., 2014. Introducing Carbon
Taxes in South Africa. Applied Energy 116, 344–354.
Baranes, E., Jacqmin, J., Poudou, J.-C., 2017. Non-Renewable and Intermittent Renewable Energy Sources:
Friends and Foes? Energy Policy 111, 58–67.
Bedilion, R., Booras, G., Coleman, T., Lyons, C., Nguyen, B., Ramachandran, G., 2012. Power Generation
Technology Data for Integrated Resource Plan of South Africa: Final Technical Update. Tech. rep., Elec-
tric Power Research Institute, Palo Alto.
URL http://www.doe-irp.co.za/content/EpriEskom_2012July24_Rev5.pdf
BP, 2016. Statistical Review of World Energy. Tech. rep., British Petroleum, London.
URL http://www.bp.com/en/global/corporate/energy-economics/
statistical-review-of-world-energy.html
Burnham, A., Han, J., Clark, C. E., Wang, M., Dunn, J. B., Palou-Rivera, I., 2012. Life-Cycle Greenhouse
Gas Emissions of Shale Gas, Natural Gas, Coal, and Petroleum. Environmental Science & Technology
46 (2), 619–627.
Cathles, L. M., Brown, L., Taam, M., Hunter, A., 2012. A Commentary on “The Greenhouse-Gas Footprint
of Natural Gas in Shale Formations” by R.W. Howarth, R. Santoro, and Anthony Ingraffea. Climatic
Change 113 (2), 525–535.
CSIR, SANBI, 2016. Shale Gas Development in the Central Karoo: A Scientific Assessment of the Positive
and Negative Consequences. , Council for Scientific and Industrial Research and South African National
Biodiversity Institute and Council for Geoscience, Pretoria and Pietermaritzburg.
URL http://seasgd.csir.co.za/
20
Page 21
Dellink, R., Chateau, J., Lanzi, E., Magne, B., 2017. Long-term Economic Growth Projections in the Shared
Socioeconomic Pathways. Global Environmental Change 42, 200–214.
Department of Energy, 2013. Integrated Resource Plan (IRP): 2010-2030. Tech. rep., Department of Energy
of the Republic of South Africa, Pretoria.
URL http://www.doe-irp.co.za/content/IRP2010_updatea.pdf
Eberhard, A., Kolker, J., Leigland, J., 2014. South Africa’s Renewable Energy IPP Procurement Program:
Success Factors and Lessons. , Public-Private Infrastructure Advisory Facility and The World Bank
Group, Washington DC.
URL http://www.gsb.uct.ac.za/files/PPIAFReport.pdf
eia, 2015. Technically Recoverable Shale Oil and Shale Gas Resources: South Africa. Tech. rep., U.S.
Energy Information Administration, Washington DC.
URL https://www.eia.gov/analysis/studies/worldshalegas/pdf/South_Africa_2013.
pdf
eia, 2016a. Online Database - Shale Gas Production.
URL https://www.eia.gov/dnav/ng/ng_prod_shalegas_s1_a.htm
eia, 2016b. Trends in U.S. Oil and Natural Gas Upstream Costs.
URL https://www.eia.gov/analysis/studies/drilling/pdf/upstream.pdf
Esterhuyse, S., Avenant, M., Redelinghuys, N., Kijko, A., Glazewski, J., Plit, L., Kemp, M., Smit, A., Vos,
A. T., Williamson, R., 2016. A Review of Biophysical and Socio-Economic Effects of Unconventional
Oil and Gas Extraction - Implications for South Africa. Journal of Environmental Management 184 (Pt
2), 419–430.
Eurek, K., Sullivan, P., Gleason, M., Hettinger, D., Heimiller, D., Lopez, A., 2016. An Improved Global
Wind Resource Estimate for Integrated Assessment Models. Energy Economics.
Fricko, O., Havlik, P., Rogelj, J., Klimont, Z., Gusti, M., Johnson, N., Kolp, P., Strubegger, M., Valin, H.,
Amann, M., Ermolieva, T., Forsell, N., Herrero, M., Heyes, C., Kindermann, G., Krey, V., McCollum,
D. L., Obersteiner, M., Pachauri, S., Rao, S., Schmid, E., Schoepp, W., Riahi, K., 2017. The Marker
Quantification of the Shared Socioeconomic Pathway 2: A Middle-of-the-Road Scenario for the 21st
Century. Global Environmental Change 42, 251–267.
21
Page 22
GEA, 2012. Global Energy Assessment: Toward a Sustainable Future. Cambridge University Press and
International Institute for Applied Systems Analysis, Cambridge and Laxenburg.
Geel, C., Schulz, H.-M., Booth, P., deWit, M., Horsfield, B., 2013. Shale Gas Characteristics of Permian
Black Shales in South Africa: Results from Recent Drilling in the Ecca Group (Eastern Cape). Energy
Procedia 40, 256–265.
Henneman, L. R., Rafaj, P., Annegarn, H. J., Klausbruckner, C., 2016. Assessing Emissions Levels and
Costs Associated with Climate and Air Pollution Policies in South Africa. Energy Policy 89, 160–170.
Hoglund-Isaksson, L., 2017. Bottom-up Simulations of Methane and Ethane Emissions from Global Oil and
Gas Systems 1980 to 2012. Environmental Research Letters 12 (2).
Howarth, R., 2015. Methane Emissions and Climatic Warming Risk from Hydraulic Fracturing and Shale
Gas Development: Implications for Policy. Energy and Emission Control Technologies (3), 45–54.
Howarth, R. W., Santoro, R., Ingraffea, A., 2011. Methane and the Greenhouse-Gas Footprint of Natural
Gas from Shale Formations. Climatic Change 106 (4), 679–690.
Hultman, N., Rebois, D., Scholten, M., Ramig, C., 2011. The Greenhouse Impact of Unconventional Gas
for Electricity Generation. Environmental Research Letters 6 (4), 049504.
Huppmann, D., Gidden, M., Fricko, O., Kolp, P., Orthofer, C., Pimmer, M., Riahi, K., Krey, V., in prepara-
tion. The MESSAGEix Integrated Assessment Model and the ix modeling platform.
IEA, 2014. Africa Energy Outlook: A Focus on Energy Prospects in Sub-Saharan Africa. Tech. rep.,
International Energy Agency, Paris.
URL https://www.iea.org/publications/freepublications/publication/WEO2014_
AfricaEnergyOutlook.pdf
IEA, 2016. World Energy Balance. Tech. rep., International Energy Agency, Paris.
URL http://www.iea.org/bookshop/724-World_Energy_Balances_2016
IPCC, 1996. Revised 1996 IPCC Guidelines for National Greenhouse Gas Inventories: The Workbook (Vol-
ume 2). Tech. rep., Geneva, Switzerland.
URL http://www.ipcc-nggip.iges.or.jp/public/gl/invs6.html
22
Page 23
KC, S., Lutz, W., 2017. The Human Core of the Shared Socioeconomic Pathways: Population Scenarios by
Age, Sex and Level of Education for all Countries to 2100. Global Environmental Change 42, 181–192.
Klausbruckner, C., Annegarn, H., Henneman, L. R., Rafaj, P., 2016. A Policy Review of Synergies and
Trade-offs in South African Climate Change Mitigation and Air Pollution Control Strategies. Environ-
mental Science & Policy 57, 70–78.
Krey, V., Havlik, P., Fricko, O., Zilliacus, J., Gidden, M., Strubegger, M., Kartasasmita, I., Ermolieva, T.,
Forsell, N., Gusti, M., Johnson, N., Kindermann, G., Kolp, P., McCollum, D. L., Pachauri, S., Rao,
N., Rogelj, J., Valin, H., Obersteiner, M., Riahi, K., 2016. MESSAGE-GLOBIOM 1.0 Documentation. ,
International Institute for Applied Systems Analysis, Laxenburg.
URL http://data.ene.iiasa.ac.at/message-globiom/
McJeon, H., Edmonds, J., Bauer, N., Clarke, L., Fisher, B., Flannery, B. P., Hilaire, J., Krey, V., Marangoni,
G., Mi, R., Riahi, K., Rogner, H., Tavoni, M., 2014. Limited Impact on Decadal-Scale Climate Change
from Increased use of Natural Gas. Nature 514 (7523), 482–485.
Merven, B., Moyo, A., Stone, A., Dane, A., Winkler, H., 2014. The Socio-economic Implications of Miti-
gation in the Power Sector Including Carbon Taxes in South Africa. Working Paper for CDKN Projecton
Linking Sectoral and Economy-wide Models.
URL http://open.uct.ac.za/handle/11427/16897
Miller, S. M., Wofsy, S. C., Michalak, A. M., Kort, E. A., Andrews, A. E., Biraud, S. C., Dlugokencky,
E. J., Eluszkiewicz, J., Fischer, M. L., Janssens-Maenhout, G., Miller, B. R., Miller, J. B., Montzka, S. A.,
Nehrkorn, T., Sweeney, C., 2013. Anthropogenic Emissions of Methane in the United States. Proceedings
of the National Academy of Sciences of the United States of America 110 (50), 20018–20022.
Ministry of Finance, 2015. Draft Carbon Tax Bill.
URL http://www.treasury.gov.za/public%20comments/CarbonTaxBill2015/Carbon%
20Tax%20Bill%20final%20for%20release%20for%20comment.pdf
Myhre, G., Shindell, D., Breon, F.-M., Collins, W., Fuglestvedt, J., Huang, J., Koch, D., Lamarque, J.-
F., Lee, D., Mendoza, B., Nakajima, T., Robock, A., Stephens, G., Takemura, T., Zhang, H., 2014.
Anthropogenic and Natural Radiative Forcing. In: Stocker, T., Qin, D., Plattner, G.-K., Tignor, M. M.,
Allen, S. K., Boschung, J., Nauels, A., Xia, Y., Bex, V., Midgley, P. M. (Eds.), Climate Change 2013.
Cambridge University Press, Cambridge.
23
Page 24
O’Neill, B. C., Kriegler, E., Ebi, K. L., Kemp-Benedict, E., Riahi, K., Rothman, D. S., van Ruijven, B. J.,
van Vuuren, D. P., Birkmann, J., Kok, K., Levy, M., Solecki, W., 2017. The Roads Ahead: Narratives for
Shared Socioeconomic Pathways Describing World Futures in the 21st Century. Global Environmental
Change 42, 169–180.
O’Sullivan, F., Paltsev, S., 2012. Shale Gas Production: Potential Versus Actual Greenhouse Gas Emissions.
Environmental Research Letters 7 (4), 044030.
Pegels, A., 2010. Renewable Energy in South Africa: Potentials, Barriers and Options for Support. Energy
Policy 38 (9), 4945–4954.
Pietzcker, R. C., Stetter, D., Manger, S., Luderer, G., 2014. Using the Sun to Decarbonize the Power Sector:
The Economic Potential of Photovoltaics and Concentrating Solar Power. Applied Energy 135, 704–720.
Riahi, K., Dentener, F., Gielen, D., Grubler, A., Jewell, J., Klimont, Z., Krey, V., McCollum, D., Pachauri,
S., Rao, S., van Ruijven, B., van Vuuren, D. P., Wilson, C., 2012. Chapter 17 - energy pathways for
sustainable development. In: Global Energy Assessment - Toward a Sustainable Future. Cambridge Uni-
versity Press, Cambridge, UK and New York, NY, USA and the International Institute for Applied Systems
Analysis, Laxenburg, Austria, pp. 1203–1306.
Riahi, K., van Vuuren, D. P., Kriegler, E., Edmonds, J., O’Neill, B. C., Fujimori, S., Bauer, N., Calvin, K.,
Dellink, R., Fricko, O., Lutz, W., Popp, A., Cuaresma, J. C., KC, S., Leimbach, M., Jiang, L., Kram, T.,
Rao, S., Emmerling, J., Ebi, K., Hasegawa, T., Havlik, P., Humpenoder, F., Da Silva, L. A., Smith, S., Ste-
hfest, E., Bosetti, V., Eom, J., Gernaat, D., Masui, T., Rogelj, J., Strefler, J., Drouet, L., Krey, V., Luderer,
G., Harmsen, M., Takahashi, K., Baumstark, L., Doelman, J. C., Kainuma, M., Klimont, Z., Marangoni,
G., Lotze-Campen, H., Obersteiner, M., Tabeau, A., Tavoni, M., 2017. The Shared Socioeconomic Path-
ways and Their Energy, Land Use, and Greenhouse Gas Emissions Implications: An Overview. Global
Environmental Change 42, 153–168.
Richter, P. M., 2015. From Boom to Bust? A Critical Look at US Shale Gas Projections. Economics of
Energy & Environmental Policy 4 (1).
Sullivan, P., Krey, V., Riahi, K., 2013. Impacts of Considering Electric Sector Variability and Reliability in
the MESSAGE Model. Energy Strategy Reviews 1 (3), 157–163.
24
Page 25
Ummel, K., 2012. CARMA Revisited: An Updated Database of Carbon Dioxide Emissions from Power
Plants Worldwide. 304, Center for Global Development.
UNFCCC, 2015. South Africa’s Nationally Determined Contribution (INDC). Tech. rep., United Nations
Framework Convention on Climate Change, Bonn.
URL http://www4.unfccc.int/Submissions/INDC
van Vuuren, D. P., Riahi, K., Calvin, K., Dellink, R., Emmerling, J., Fujimori, S., KC, S., Kriegler, E.,
O’Neill, B., 2017. The Shared Socio-economic Pathways: Trajectories for Human Development and
Global Environmental Change. Global Environmental Change 42, 148–152.
WB, 2016a. Modeling the Impact on South Africa’s Economy of Introducing a Carbon Tax. Tech. rep., The
World Bank Group, Washington, D.C.
URL http://us-cdn.creamermedia.co.za/assets/articles/attachments/65696_carbon_
tax_modelling_report_final_oct_2016.pdf
WB, 2016b. World Development Indicators Online Database. Tech. rep., Washington DC.
URL http://data.worldbank.org/data-catalog/world-development-indicators
Wheeler, D., Ummel, K., 2008. Calculating CARMA: Global Estimation of CO2 Emissions from the Power
Sector. 145, Center for Global Development.
URL https://www.cgdev.org/publication/
Winkler, H., 2007. Energy Policies for Sustainable Development in South Africa. Energy for Sustainable
Development 11 (1), 26–34.
Witi, J., Stevens, L., Manzini, L., Du Toit, L., Musee, N., 2014. GHG Inventory for South Africa 2000
- 2010. Tech. rep., Department of Environmental Affairs Republic of South Africa and Deutsche
Gesellschaft fur Internationale Zusammenarbeit, Pretoria and Bonn.
URL https://www.environment.gov.za/sites/default/files/docs/greenhousegas_
invetorysouthafrica.pdf
25