Canaccord Adams is the global capital markets group of Canaccord Capital Inc. (CCI : TSX|AIM) The recommendations and opinions expressed in this Investment Research accurately reflect the Investment Analyst’s personal, independent and objective views about any and all the Designated Investments and Relevant Issuers discussed herein. For important information, please see the Important Disclosures section in the appendix of this document. 5 November 2008 2008-185 J. Frederick Kozak, P.Eng. 1.403.508.3836 [email protected]Timothy Clark 1.403.508.3824 [email protected]INSIDE Summary ..................................................... 2 The Caribbean – An Overview.................... 3 Caribbean Geology ..................................... 4 Trinidad and Tobago................................... 9 Guyana ...................................................... 21 Suriname ................................................... 26 Company Feature Summaries .............. 30 Canadian Superior Energy Inc. ............ 31 CGX Energy Inc...................................... 45 Challenger Energy Corp........................ 61 Petro Andina Resources Inc................. 73 Primera Energy Resources Ltd. ........... 77 Voyager Energy Ltd. .............................. 81 Energy – Oil and Gas, Exploration and Production South American Offshore – The Caribbean Report It’s not just on the beach – there’s oil there The Caribbean is probably best-known as a destination for golden sun and sand, but looking around the Caribbean basin, especially off the northern coast of South America, we find gold of a different colour: black gold, and with it trillions of cubic feet of natural gas. Although this area may not be high on the explorers’ lists of prospect regions, exploration is underway and it is generating results. Mature and not-so-mature Regions of the Caribbean basin, including Barbados and Trinidad and Tobago, are well known for having crude oil – discoveries that were made more than 100 years ago through surface oil seeps and later proven with exploration drilling. While these mature areas are well know, opportunities remain for new and exciting discoveries in these areas. Add to this list the less mature areas where there is exploration potential, hydrocarbons to be produced and not surprisingly money to be made. Focus on the companies We focus on the up-and-coming regional players. In Trinidad and Tobago, the offshore has garnered the most recent interest with continuing large discoveries of natural gas. However, the onshore region is not finished and we look at companies operating in both areas. Further away, with undiscovered resources and a small oil and gas sector, is the Guyana- Suriname Basin, where oil production exists but upcoming exploration activity from large international and smaller, exploration- focused companies is underway. New company initiation reports included As part of our regional study, we are initiating coverage on two Trinidad and Tobago offshore exploration companies and one early-stage exploration company in Guyana. Company Ticker Current Price Rating 12-month target Canadian Superior Energy Inc. SNG : TSX C$1.94 SPECULATIVE BUY C$4.50 CGX Energy Inc. OYL : TSX-V C$0.49 SPECULATIVE BUY C$1.80 Challenger Energy Corp. CHQ : TSX-V C$2.20 SPECULATIVE BUY C$5.25
Transcript
Canaccord Adams is the global capital markets group of Canaccord Capital Inc. (CCI : TSX|AIM)
The recommendations and opinions expressed in this Investment Research accurately reflect the Investment Analyst’s personal, independent and objective views about any and all the Designated Investments and Relevant Issuers discussed herein. For important information, please see the Important Disclosures section in the appendix of this document. 5 November 2008 2008-185
INSIDE Summary ..................................................... 2 The Caribbean – An Overview.................... 3 Caribbean Geology ..................................... 4 Trinidad and Tobago................................... 9 Guyana ......................................................21 Suriname...................................................26
Company Feature Summaries .............. 30 Canadian Superior Energy Inc. ............31 CGX Energy Inc......................................45 Challenger Energy Corp........................61 Petro Andina Resources Inc.................73 Primera Energy Resources Ltd. ...........77 Voyager Energy Ltd. ..............................81
Energy – Oil and Gas, Exploration and Production
South American Offshore – The Caribbean Report It’s not just on the beach – there’s oil there The Caribbean is probably best-known as a destination for golden sun and sand, but looking around the Caribbean basin, especially off the northern coast of South America, we find gold of a different colour: black gold, and with it trillions of cubic feet of natural gas. Although this area may not be high on the explorers’ lists of prospect regions, exploration is underway and it is generating results.
Mature and not-so-mature Regions of the Caribbean basin, including Barbados and Trinidad and Tobago, are well known for having crude oil – discoveries that were made more than 100 years ago through surface oil seeps and later proven with exploration drilling. While these mature areas are well know, opportunities remain for new and exciting discoveries in these areas. Add to this list the less mature areas where there is exploration potential, hydrocarbons to be produced and not surprisingly money to be made.
Focus on the companies We focus on the up-and-coming regional players. In Trinidad and Tobago, the offshore has garnered the most recent interest with continuing large discoveries of natural gas. However, the onshore region is not finished and we look at companies operating in both areas. Further away, with undiscovered resources and a small oil and gas sector, is the Guyana-Suriname Basin, where oil production exists but upcoming exploration activity from large international and smaller, exploration- focused companies is underway.
New company initiation reports included As part of our regional study, we are initiating coverage on two Trinidad and Tobago offshore exploration companies and one early-stage exploration company in Guyana.
Company Ticker Current Price Rating 12-month target Canadian Superior Energy Inc. SNG : TSX C$1.94 SPECULATIVE BUY C$4.50 CGX Energy Inc. OYL : TSX-V C$0.49 SPECULATIVE BUY C$1.80 Challenger Energy Corp. CHQ : TSX-V C$2.20 SPECULATIVE BUY C$5.25
2
South American Offshore 5 November 2008
SUMMARY
In this report we focus on the offshore hydrocarbon potential of the Caribbean adjacent to South America. There are several countries with known hydrocarbon potential and production in the region and other countries that have limited hydrocarbon production but tremendous potential. We have reviewed the region as a whole and, for the purposes of this report, we look at Trinidad and Tobago, Guyana, and Suriname. As part of this review we will also look at companies operating in these areas and highlight new research coverage.
With the popularity of oil and gas in Colombia drawing attention to the South American continent, investors and oil and gas companies alike are looking further afield for investment opportunities. Colombia’s offshore potential is well known, as the country currently produces a majority of its natural gas production from the offshore Caribbean natural gas field at Guajira.
Wrapping around the northern edge of the continent and adjacent to Colombia is the country of Venezuela. Onshore, this country has significant hydrocarbons which appear to extend into tremendous offshore hydrocarbon resource potential. Unfortunately the exploration of this potential is currently limited due to the country’s current political landscape. But extending to just offshore Venezuela is the Caribbean nation of Trinidad and Tobago. This country has long been an area of known oil potential, with surface oil seeps having been used as caulking for ocean-going ships for centuries. There is a long history of oil production from onshore Trinidad, but more recently natural gas production, located offshore Trinidad and Tobago has become the dominant hydrocarbon product of the country. Trinidad and Tobago has become a prime exporter of Liquefied Natural Gas (LNG) to the US and the world through the installation of LNG processing facilities and production. Just 10 years ago production of natural gas was approximately 1.0 Bcf per day – this has now increased to more than 4.0 Bcf/d with the potential to grow further.
As part of our report, we also reviewed companies operating in the Caribbean region. Most notable is the exploration currently underway offshore Trinidad by Canadian Superior and its joint venture group, where as much as 4 trillion cubic feet of natural gas may have been discovered in 2008.
But the known hydrocarbon resources come at a price – the upcoming bidding round for new offshore blocks in Trinidad is expected to be highly contested, given the proximity of the acreage to the new offshore discoveries made by Canadian Superior, et al.
Wrapping further eastward around the northern coast of South America, oil and gas potential still exists. Excluding Venezuela (for now), oil and gas companies are seeing tremendous potential in Guyana and neighbouring Suriname. While no significant recent discoveries have yet been made, the Guyana-Suriname Basin has been identified by the US Geological Service as a very underexplored basin, with potential that could exceed 15 billion barrels of oil with natural gas potential of 42 trillion cubic feet. In this report, we will also examine that area’s potential and operations that are currently underway.
3
5 November 2008 The Caribbean Report
THE CARIBBEAN – AN OVERVIEW
Long considered a hot spot for winter sun seekers from North America and Europe, as well as vacationing sailors, the Caribbean has not been well thought of as a source of oil and gas production. Most people think of Caribbean oil as what’s been spilled on the beach from suntan lotion bottles!
Figure 1: Caribbean region oil production or shows
Source: Google Maps, Canaccord Adams
But think again.
Our specific area of interest is the Caribbean off the coast of South America as shown on the map in Figure 1. The oil and gas potential of South America is well known, given the history of production from Venezuela and Colombia, both located on the northern coast of the continent. However, in addition to extensive oil and gas production (and offshore potential) in these two countries, there has been a long history of oil production from the island of Barbados and the island of Trinidad. (More recently, offshore gas production from Trinidad has been a major new export for the country). In addition to hydrocarbons from the islands, there has been production from onshore Suriname and exploration has also yielded oil and gas shows offshore Suriname and Guyana. While not close to the region in question, explorers have gone further afield and have also found indications of oil and gas in Nicaragua in Central America. While many think of the Caribbean as a holiday destination, it is clear that there is oil and gas potential in the region.
4
South American Offshore 5 November 2008
CARIBBEAN GEOLOGY
The structural geology of the Caribbean region is surprisingly complex. In the technical readings done to prepare for this report, we noted that even the experts can not fully agree on the full technical development of the region. However, there is enough “big picture” information to explain how the region was formed. With this understanding, it is easy to see how the prospectivity of the region developed and supports the currently known oil and gas potential of the area.
Throughout the Earth’s history, the continents have moved and been joined to one another in some form or fashion. Plate tectonic models have identified the supposed
orientation of the Earth’s crusts as far back as 750 million years ago1.
However, our interest in plate tectonics is only related to the past 250 million years. As shown below, approximately 250 million years ago, the plates of the world were all clustered together as shown below. Note in particular the orientation of North America, South America and Africa.
Figure 2: Plate tectonics – 250 million years ago
Source: Lawver et al; Plates 2002
The significance of this map is not just to the subject of our report. Over time, as the continents started to move apart, major oil and gas regions were formed due to deposition of sediments and faulting. Outside of the Caribbean one most notable impact is the discovery of very significant oil and gas deposits off the eastern coast of South America (Brazil) and the western coast of Africa (Angola).
Starting approximately 170 million years ago (Middle Jurassic), the three continents started moving. Most notable is the movement of North America away from the other two continents. The significance of this event is that it correlated to the formation of the
1 Atlas of Plate Reconstructions, Lawver, Dalziel, Gahagan, Martin and Campbell, 2002
Africa
North America
South America
Caribbean
5
5 November 2008 The Caribbean Report
Atlantic Ocean between North America and Africa and also provided for the formation of reefs and ultimately carbonate formations in the Caribbean area.
Figure 3: Plate tectonics – 170 million years ago
Source: Lawver et al; Plates 2002
Guyana/Suriname potential created by well-understood processes As the Atlantic Ocean was forming, there were changes occurring on all three continents. Specifically, with the movement of the continents away from each other, there occurred uplift of the continents due to the release of geologic stresses and movements of the tectonic plates.
This tectonic movement created the conditions that account for the hydrocarbon potential today. Uplift of the continents (specifically South America) resulted in erosion on the land mass over time. With the erosional process, there was a long period of deposition at the continental margins of thick sedimentary sequences, rich in organic material, well-sorted sandstones and mudstones/claystones and siltstones.
As South America and Africa separated from each other, thick sedimentary sequences from the erosional processes were created in the Caribbean area. Notable was the
creation of large turbidite fan sequences off the coast of northeast South America2. These are now primarily located off the coast of Guyana and Suriname and are identified as the Guyana-Suriname Basin.
2 US Geological Survey World Petroleum Assessment, 2000
6
South American Offshore 5 November 2008
Figure 4: Plate tectonics – 90 million years ago
Source: Lawver et al; Plates 2002
Structural geology drives Trinidad and Tobago Oil and Gas At the same time as the thick sedimentary deposits were being made off the northeast coast of Guyana/Suriname, plate tectonics in the Caribbean were forming this region. In the Late Cretaceous (80 million years ago), the movement of the Caribbean Plate between North and South America commenced.
Figure 5: Movement of the Caribbean Plate (20 million years ago)
Source: Lawver et al; Plates 2002
Starting on the Pacific Ocean side of the continents, the Caribbean plate started moving from west to east as highlighted above in Figure 5. From 80 million to 20 million years ago, the Caribbean Plate continued to move across the top of South America as the continents drifted apart. Further movement of the Caribbean Plate over the past 20 million years has resulted in the structural geological elements of the Caribbean as it stands today.
7
5 November 2008 The Caribbean Report
Figure 6: Caribbean Plate representation
Source: Jackson School of Geosciences, University of Texas at Austin website; Canaccord Adams
This movement of the Caribbean Plate was resisted by both the South American Plate and the North American Plate. As a result, at the margins of the plates, significant faulting and deformation occurred. With the depositional environment providing organic source rock and the geologic environment providing temperature and pressure creating the geologic kitchen, a perfect environment for the formation of hydrocarbons occurred.
Figure 7: Structural areas offshore Trinidad
Source: Leslie J. Wood and Carolyn Roberts “Opportunity in a World-class Hydrocarbon Basin; Trinidad and Tobago’s Eastern Offshore Marine Province” Houston Geological Society Bulletin, June 2001
Caribbean Plate Margin
Trinidad
Large Natural Gas discoveries in this area
8
South American Offshore 5 November 2008
As highlighted above, at the margin of the Caribbean Plate in Trinidad’s offshore waters, large natural gas structures have been discovered in fractured and faulted zones. Most notable are some of the fields highlighted below in Figure 8.
Figure 8: Offshore Trinidad natural gas discoveries
Field Name Discovery Date
Total Recoverable Reserves (Tcf) Partners
East Manzanilla 08 May 1972 0.32 BP* (70.00%), Repsol YPF (30.00%) Juniper 11 Feb 1996 1.91 BP* (70.00%), Repsol YPF (30.00%) Mahogany 13 Sep 1973 2.38 BP* (70.00%), Repsol YPF (30.00%) Manakin 10 May 2000 1.07 BP* (70.00%), Repsol YPF (30.00%) Savonette 18 Dec 2004 2.11 BP* (70.00%), Repsol YPF (30.00%) Dolphin 21 Nov 1976 4.26 BG* (50.00%), Chevron (50.00%) Dolphin Deep 15 Aug 1998 0.50 BG* (50.00%), Chevron (50.00%) Manatee 03 Mar 2005 1.67 Chevron* (50.00%), BG (50.00%) Starfish 30 Nov 1998 0.43 BG* (50.00%), Chevron (50.00%) Toucan 30 Jan 2006 0.70 EOG Resources* (90.00%), CL Financial
(10.00%)
*Operator of the field. Source: Wood Mackenzie
Figure 9 below shows a more detailed interpretation of the prospectivity of this offshore area. At the margin of the Caribbean Plate and the South American Plate, significant anticlinal features have been created. It is in this area that, with a combination of other structural geological elements, the major natural gas fields of Trinidad have been discovered.
GOVERNMENT The country of Trinidad and Tobago (more commonly referred to as “Trinidad”) became a republic in 1976 after gaining its independence in 1962 from the UK. The government system mimics the Westminster (British Parliamentary System) model of government, which values parliamentary democracy. The Executive branch includes the President, Prime Minister, and Cabinet. The Legislative branch includes the bicameral parliament, which consists of 31-seat Senate whom are appointed by the President and a 36-seat House of Representatives whom are elected by popular vote. The judicial branch includes an independent court system and since the country remains a member of the British Commonwealth, the highest court of appeal is London’s Privy Council.
Parliament members elect a President for a five-year term and are instrumental in electing a Prime Minister. The Prime Minister, who is appointed by the President, is generally the Member of Parliament who received the most parliament-member votes. The current President is George Maxwell Richards, who was reelected to a second five-year term on February 11, 2008. Patrick Manning, who holds both the position of Prime Minister and Minister of Finance, has held his positions since December 2001. Currently, the People’s National Movement (PNM), United National Congress (UNC), and the Congress of the People (COP) are the major political parties; these parties are interested in increased foreign investment and pursuing free mark economic policies.
Since gaining its independence in 1962, Trinidad has developed and forged strong relationships with the United States and Europe, both of which are two of the country’s main trading partners. Trinidad has taken a lead role in the Caribbean Community and Common Market (CARICOM), where it was both an advocate and instrumental in strengthening economic conditions and securing political security and integration. Trinidad has many planned, executed, and proposed foreign investment projects. The government wants to increase and expand foreign investment within the country. The history of successful foreign business can be attributed to several factors, including but not limited to: a history of prosperous oil and gas industry, consistent democratic legislation and government, accessible raw materials, and a strong fiscal regime promoting foreign investment. The following chart shows foreign direct investment in Trinidad since 1998.
10
South American Offshore 5 November 2008
Figure 10: Trinidad and Tobago’s historical foreign direct investment
680
835791 808
998940
788
0
200
400
600
800
1,000
1,200
1998 1999 2000 2001 2002 2003 2004
US
$B
Source: Nations Conference on Trade and Development (UNCTAD), World Investment Report 2007
ECONOMY Trinidad has shifted from an oil-based economy to a gas-based economy. The oil and gas industry in Trinidad began with oil exploration and production. During the 1950s, significant gas production began to take place. From 1950 onwards, enormous volumes of natural gas reserves were discovered while exploring for oil. Natural gas boomed in the 1980s and became an integral part of Trinidad’s economy. Starting in the late 1970s natural gas production started a steady growth curve. However, it was not until 2000 when significant Liquefied Natural Gas (LNG) projects commenced that gas production grew significantly. Average natural gas production in Trinidad for 2007 was approximately 3.9 bcf/d. The following graph displays Trinidad’s evolution from an oil-based country to a predominantly natural gas-based country.
11
5 November 2008 The Caribbean Report
Figure 11: Trinidad and Tobago’s crude oil and natural gas average production
0
50
100
150
200
250
300
80 83 86 89 92 95 98 01 04 07
Oil
Prod
uctio
n (m
bls/
d)
0
500
1,000
1,500
2,000
2,500
3,000
3,500
4,000
4,500
Nat
ural
Gas
Pro
duct
ion
(mm
cf/d
)
Oil ProductionNatural Gas Production
*Natural Gas Production for 2007 is based on the CIA Factbook Estimate Source: Energy Information Agency, Canaccord Adams
Trinidad, which has one of the highest GDP growth rates in Latin America, has gained the reputation of being an excellent investment area for international business. The country’s growth can be attributed to oil and gas exploration, LNG, petrochemicals, and steel. GDP in 2007 was $23.8 billion, with oil and gas accounting for approximately 40% of the total. The 2007 GDP breakdown is approximately 0.6% agriculture, 61.9% industry, and 37.5% services. The following graph displays Trinidad’s GDP growth since 2003.
Figure 12: Trinidad and Tobago’s historical GDP
11.2
12.7
15.1
18.2
20.7
25.0
0%
2%
4%
6%
8%
10%
12%
14%
16%
2003 2004 2005 2006 2007 2008*
Rea
l GD
P G
row
th Y
/Y (%
)
5
10
15
20
25
GD
P (U
S$
BN
)
GDP (US$BN) (current prices)
Real GDP Growth (% change Y/Y)
Source: Australian Department of Foreign Affairs *Estimate for 2008
12
South American Offshore 5 November 2008
The oil and gas industry accounts for approximately 80% of exports and 5% of total employment. Economic growth in 2006 was approximately 12.2% and 5.5% in 2007, fuelled by a growing trade surplus and increasing prices of oil, LNG and petrochemicals. Additionally, during this period the energy sector increased its capacity as foreign investment increased, with a particular focus on oil and gas. Oil and gas plays a vital role in Trinidad’s economy as shown below.
Figure 13: Trinidad and Tobago’s GDP composition
Source: Minister Of Energy And Energy Industries (MEEI) Presentation, 2008
Trinidad exports petroleum and petroleum products, LNG, methanol, ammonia, urea, steel products, beverages, cereal and cereal products, sugar, cocoa, coffee, citrus, fruit, vegetables, and flowers. Additionally, Trinidad is the largest exporter of LNG to the US in the world. Of the total LNG exports in Trinidad, 65% is shipped to the US. The following graph displays Trinidad’s LNG export markets.
Figure 14: Trinidad and Tobago’s LNG exports destinations
Source: BP Statistical Review of World Energy, 2007
13
5 November 2008 The Caribbean Report
Figure 15: Trinidad and Tobago’s LNG exports by country
Source: BP Statistical Review of World Energy, 2007
Figure 16: LNG exporting countries
Source: BP Statistical Review of World Energy, 2007
14
South American Offshore 5 November 2008
OIL AND GAS INDUSTRY In 2007, Trinidad and Tobago’s total crude oil production was 121.4 million barrels a day, with exports of 99 million barrels a day to the US. According to the CIA World Factbook, total crude oil proved reserves are approximately 605.8 million bbl as of January 2007. In 2007, estimated aggregate natural gas production was approximately 1.4 trillion cubic feet,
allowing for natural gas exports of 742.7 billion cubic feet.3 According to Ryder Scott, total natural gas Proven reserves as of year-end 2007 totaled 17.0 trillion cubic feet and Proven plus Probable (2P) reserves were 24.9 trillion cubic feet.
Figure 17: Trinidad and Tobago’s oil and natural gas production
Source: The Natural Gas Company of Trinidad and Tobago Ltd., 2007
Trinidad has a large and increasing domestic demand for gas. The country’s extensive collection of petrochemical plants and infrastructure play a significant role in Trinidad’s domestic demand of approximately 1.58bcfd. According to Wood Mackenzie’s estimates, over the next 15 years (2008-2022) approximately 11.4 tcf of gas will be required to supply existing projects, and over the next 20 years the supply requirement is expected to soar to approximately 15.7 tcf. Trinidad’s domestic demand is expected to increase
29% from 1.58 bcf/d in 2007 to 2.04 bcf/d in 2011.4 The following graph represents Trinidad’s historical natural gas production and consumption.
3 CIA Factbook 4 Wood Mackenzie
15
5 November 2008 The Caribbean Report
Figure 18: Trinidad and Tobago’s natural gas production vs. consumption
Source: CIA World Fact Book - 2007 Estimate, Energy Information Agency (EIA)
Over the next several years, Trinidad needs to discover new natural gas reserves in order to supply existing demand as well as future additional demand. Wood Mackenzie’s demand base case forecast for Trinidad expects that 24.9 tcf of gas will be required over the next 15 years and 33.7 tcf over the next 20 years. These figures are not including proposed new project requirements, which could add an additional 1.7 tcf over 15 years. As mentioned above, current Proven plus Probable reserves according to Ryder Scott are approximately 24.9 tcf. As a result, Trinidad desperately needs to discover new reserves as they fall short, potentially causing the country to be a net importer of natural gas.
The government is attempting to reduce its demand requirements and increase its reserve supply through several means, including:
• Construction of “Train X” (a new LNG processing train) has been postponed until new gas discoveries are made
• The Eastern Caribbean Gas Pipeline, which was a proposed project to build a gas pipeline from Trinidad north to nearby islands including Grenada, Saint Lucia and Barbados.
• Offer better incentives for new exploration. A full review of Trinidad’s upstream fiscal regime is in order, beginning with a review of the PSC terms for new acreage. Trinidad’s 2006 bidding round provoked little interest from businesses, after Trinidad initiated the new “Taxable PSC” terms into the bid rounds.
• The government plans on holding a bid round late in 2008/early 2009 to spur new exploration in Trinidad. The structure of the existing bid round process can take over a year before any contracts are finalized. Expediting this process will help fuel further exploration. (We note that the recent discovery by Canadian Superior et al has likely fueled interest in the upcoming bid round).
16
South American Offshore 5 November 2008
• Potential increase of domestic natural gas prices. The domestic market of Trinidad is paying approximately US$2/mmbtu for gas, compared to LNG, which offers a significantly higher netback in excess of US$5/mmbtu or more. Accounting for the current economic outlook, including rising inflation and the fact that exploration in Trinidad is becoming much more risky and costly, increased domestic gas prices to account for the changing times would reduce domestic consumption and position itself as an economically feasible option compared to LNG.
The following figure highlights Trinidad’s reserve estimates as evaluated by Ryder Scott. Since 2001, the Trinidad government has had six reserve reports prepared. It is clear that over the last three years the country’s overall Proven plus Probable plus Possible (3P) reserves are decreasing.
Figure 19: Trinidad and Tobago’s reserves estimates
17.118.8 17.0
9.07.8 7.9
7.1
6.2 5.9
0
5
10
15
20
25
30
35
40
2004 2006 2007
Trill
ion
Cub
ic F
eet
Proved Probable Possible
Source: Ryder Scott Presentation, July 2008
Production Sharing Contracts (PSC) International oil and gas companies hold a significant stake in the Trinidad and Tobago energy industry. Some of the largest oil and gas companies in the world operate in Trinidad and Tobago. Since 1995, 21 Production Sharing Contracts (PSC) have been awarded to companies such as ConocoPhillips, British Gas, ExxonMobil, BHP Billiton, PetroCanada, and even Enron. However, smaller companies are starting to enter the area such as Canadian Superior Energy, Challenger Energy and EOG Resources. These 21 PSCs awarded since 1995 are reflected in the figure below.
17
5 November 2008 The Caribbean Report
Figure 20: Trinidad and Tobago’s production-sharing contracts history
1995-2002 Blocks Acreage Effective Date Company (main operator) 2(c.) 51,772 April 1996 BHP 2(ab) 133,504 June 1996 BHP Modified U(a) 38,881 July 1996 Enron S11(b) 39,260 November 1996 Elf 5(b) 73,691 January 1997 Amoco NCMA1 93,949 March 1997 British Gas 4(a) 45,743 June 1997 Conoco 4(b) 75,333 June 1997 Conoco 5(a) 40,761 December 1997 British Gas 25(a) 138,811 February 1998 Shell 25(b) 139,076 February 1998 Exxon 26 119,520 February 1998 Exxon 27 117,880 February 1998 Arco 3(a) 614 sq. km. April 2002 BHP Billiton Lower Reverse "L" 364 sq. km April 2002 EOG Resources 2005 Blocks Acreage Effective Date Company (main operator) 1(a) 62,011 July 2005 Petro-Canada/Petrotrin 1(b) 58,591 July 2005 Petro-Canada/Petrotrin 3(b) 64,476 July 2005 Kerr McGee/Primera 4(a) 45,727 July 2005 EOG Resources/Primera 5(c.) 32,392 July 2005 Canadian Superior 22 296,805 July 2005 Petro-Canada
Source: Trinidad and Tobago: Ministry of Energy and Energy Industries website
In January 2006, the Government of Trinidad opened a competitive bidding round for the exploration and production of eleven blocks, including eight onshore/near shore, and three shallow marine blocks. Later in June 2006, the Government furthered its offerings through the tender of one Deep Atlantic Block. The bidding round ultimately attracted eleven companies, resulting in 14 bid proposals for eight blocks and one proposal for the Deep Atlantic block.
The Government of Trinidad plans on hosting an open bidding round late 2008/early 2009. On offer are blocks from the North Coast Marine Area (NCMA), and in the East Coast Marine Area (ECMA). The following blocks are expected to be open for bidding.
18
South American Offshore 5 November 2008
Figure 21: Trinidad and Tobago’s available concessions
Source: Trinidad and Tobago: Ministry of Energy and Energy Industries website
Figure 22: Trinidad and Tobago’s bidding round 2008/2009
2008 Bidding Round – Q4 2008 North Coast Marine Area Blocks Acreage Water Depth (ft) NCMA 3 2100 km² 100-300 NCMA 4 1800 km² 200-400 NCMA 5 2300 km² 100-350
2009 Bidding Round - Deep Atlantic Area East Coast Marine Area Blocks Acreage Water Depth (ft) Block 4(b) 750 km² 1300-2700 Block 5(d) 700 km² 1400-2700
Source: Trinidad and Tobago: Ministry of Energy and Energy Industries website
Fiscal regime The Petroleum Act (1969), Petroleum Regulations (1970), and the Petroleum Taxes Act (1974) govern the petroleum industry in Trinidad. The Petroleum Act created a structure for the grant of licences and contracts for petroleum operations in the area, including both onshore and offshore activities. The Act established the areas to be allowed for petroleum operations. Additionally, a land right to explore and produce petroleum from these given areas is decided through competitive bidding. Once bidding has taken place, the following types of licences/contracts can be offered:
• Exploration Licence: allows the licensee(s) the right to conduct operations, with terms according to the licence, in the given area.
• Exploration and Production Licence: allows the licensee(s) the sole right, with rules according to the licence, to explore and produce all petroleum opportunities within the given area.
19
5 November 2008 The Caribbean Report
• Exploration and Production (Private Petroleum Rights) Licence.
• Production Sharing Contract (PSC): an agreement where the licensee(s) have an agreement with the host government. According to the agreement, which varies between contracts, the contractors carry all exploration and development risks in order to be granted a share of the potential production.
The current energy taxation/fiscal regime is a two-tier system including a production based tax, which includes a Royalty, Production Levy, and a Supplemental Petroleum Tax (S.P.T.). The second-tier is a profits based tax, which has a Petroleum Profits Tax and an Unemployment Levy. The government has added incentives to attract business investments. The following table outlines the fiscal regime.
Figure 23: Trinidad’s fiscal regime
Production-Based Tax Royalty Tax 12.5% of all hydrocarbon production. Production Tax Value ranges.
Maximum of 3% of gross income earned from crude oil production. Rate is unique to each project.
S.P.T. Charged on production of crude oil. Rate is defined by oil price sensitivities. Ranges from 0% to 35% for crude in excess of US$49.50/bbl.
S.P.T. Allowable Deductions 50% of geological/geophysical costs. 100% of drilling exploration wells direct costs. 40% of direct intangible drilling costs. 40% of tangible development costs. Royalty payments.
Profits-Based Tax P.P.T. 50% of gross revenue less deductible
expenses/allowances Unemployment Levy 5% with eligible deductions.
Including: Operating/Administrative Expenses. Royalty Tax. Production Tax. S.P.T. Payments. Capital Allowances. Heavy Oil Allowance.
Source: Trinidad and Tobago: Ministry of Energy and Energy Industries website
Infrastructure Trinidad relies heavily on LNG plants to facilitate the transportation of natural gas between their country and other countries. An LNG plant uses “trains” to properly convert and process the LNG, where the gas passes through a compression area, propane condenser area, and methane and ethane areas before being liquefied. The process of bringing LNG to market takes several steps, including:
• Producing the natural gas (15% of cost);
• Liquefying the natural gas through LNG plants (trains) (40% of cost);
• Shipping the LNG (25% of cost);
• Re-gasification—turning the LNG back into a gas (20% of cost);
• Bring the natural gas to market.
20
South American Offshore 5 November 2008
The Atlantic LNG Company of Trinidad, with operations in Point Fortin, Trinidad, currently operates four LNG trains. The trains are owned by various companies, including: BG, BP, Repsol YPF, NGC Trinidad LNG, and Suez. These are the only LNG trains operated in Trinidad. The four trains have a combined production capacity of approximately 15.3 million metric tones per annum. LNG trains account for a significant portion of domestic demand for gas (approximately 59%). Currently, all four trains are at full capacity and require approximately 2.5 billion cubic feet a day of natural gas to run the trains. Wood Mackenzie believes that feedstock requirements will increase to 13.5 tcf over the next 15 year period (2008 to 2022) and 18.0 tcf over the next 20-year period (2008-2027).
A fifth train, or “Train X,” has been proposed; however, the project has been put on hold until further discoveries or new production becomes available. The following figure displays information regarding the four current trains in Trinidad.
Figure 24: Atlantic LNG liquefaction trains information
Source: BG Trinidad and Tobago Limited
21
5 November 2008 The Caribbean Report
GUYANA
GOVERNMENT The government of Guyana is run under a semi-presidential representative democratic republic system, where the President of Guyana heads both the government and multi-party system. This system is basically a hybrid of the Westminster (British Parliamentary System) style democracy and the Philadelphia (Presidential) system. Executive power is exercised by the government, but legislative power is vested in both the government and National Assembly of Guyana, which is the country’s parliament. The judicial system is independent from executive and legislative powers.
Currently, there are two main political parties in Guyana: the Peoples’ Progressive Party or PPP, and the Peoples National Congress or PNC. Parties are elected every five years; the PPP currently forms the government. The government system considerably lowers the risk to foreign investment compared to its neighbor Venezuela.
Guyana’s government is inclined to attracting more foreign investment. Both public and private business leaders have declared their openness and willingness to foreign investment. This approach is confirmed with Guyana’s conduct towards foreign investors, who are treated the same as domestic investors. In addition, there are many attractive incentives to doing business in Guyana. Incentives include a flat tax rate, tax holidays, export tax allowances and waivers of custom duties. Specifically, custom duties waivers cover plant, machinery and equipment imports (with the permission of the Commissioner General). Due to the amicable relations between Guyana and the U.S., Guyana offers the same high quality and reliable low cost goods as the U.S. Additionally, many Guyanese importers favor U.S. suppliers. The following chart shows foreign direct investment in Guyana since 2003. Foreign Direct Investment from 2004 to 2006 has increase significantly due to improved investment climate in the country. Specifically, the increase is a result in the government’s aim to maintain infrastructure needed to maintain growth and development, such as roads, bridges, sea defense, drainage and irrigation, and schools. Moreover, the government is also allocating funds for
improvement in agriculture, housing and water, and national security.5
5 US State Department
22
South American Offshore 5 November 2008
Figure 25: Guyana’s historical foreign direct investment
67
56
44
2630
77
102
0
10
20
30
40
50
60
70
80
90
100
110
2000 2001 2002 2003 2004 2005 2006
FDI (
In U
S$M
M)
DFI Flow (US$MM)
Source: Nations Conference on Trade and Development (UNCTAD), World Investment Report 2007
Natural resources in Guyana are vast and include mineral deposits of gold, bauxite, diamonds and potentially large reservoirs of oil and gas in the minimally explored Guyana-Suriname Basin and Takatu Basin. Although the country is known primarily for its rice and sugar production capabilities, its agricultural industry includes fresh fruits and processed vegetables. Another potentially lucrative resource is Guyana’s forestry, which is only beginning to be exploited. The U.S. Commercial Service from the Department of Commerce lists the sectors with the best prospects in Guyana as Agricultural Machinery/Equipment, Telecommunications Equipment, Mining Industry Equipment, Computers/Peripherals, Automotive Parts, Construction Equipment, and Architectural/Construction/Engineering Services.
A major block of foreign investment into the country’s oil and gas industry resulted from an offshore border dispute between Guyana and Suriname. The dispute had flared up in June 2000, when CGX Energy was drilling for oil under a Guyanese concession and was forced to cease operations by Surinamese military gunboats. After several failed attempts at negotiation, in 2004 Guyana took the dispute to the UN Law of the Sea tribunal, which unanimously determined that the vast majority of the area in contention belonged to Guyana. The resolution of the dispute is expected to very positive for Guyana's economy in
the long term, as the seabed is estimated to contain approximately 15 billion barrels of oil.6
6 US State Department
23
5 November 2008 The Caribbean Report
Figure 26: Guyana’s export partners
Canada
U.S.
U.K.
Portugal
Trinidad and Tobago
France Netherlands
Jamaica
0%
2%
4%
6%
8%
10%
12%
14%
16%
18%
20%
Perc
enta
ge o
f Tot
al E
xpor
ts
Source: CIA World Factbook
Although the oil and gas industry has not historically been an important part of Guyana’s economy, the potential is there. Depending on exploration results and Guyana’s ability to attract more foreign exploration and production companies, oil and gas could be a lucrative opportunity to boost Guyana’s economy. With the end of Guyana and Suriname’s border dispute, the biggest block against foreign investment has been resolved. The U.S. Geological Survey estimates there are potentially 15 billion barrels of oil and 42 trillion cubic feet of gas lying off the shores of Guyana and Suriname. Until a bidding process is created, Guyana will continue to award licences and concessions on a first-come first-served basis. The Petroleum Division of the Guyana Geology and Mines Commission is in charge of negotiating the exploration contracts. Guyana had no oil and gas production in 2007.
Guyana has two basins of interest, the Guyana-Suriname Basin which is located both onshore and offshore, and the onshore Takatu basin. The Guyana-Suriname Basin is a classic passive margin basin associated with the opening of the Central Atlantic. Its stratigraphic and sedimentation framework is comparable to the Espirito Santo and Campos basins, especially in terms of the shelf and basin stratigraphy. The difficulty in this basin for petroleum exploration is finding prospective traps of oil from the migration path of the source rock. The Takatu basin origins from a failed rift associated with the opening of the Central Atlantic. However, both basins have not been explored enough to be completely understood.
24
South American Offshore 5 November 2008
Figure 27: Guyana-Suriname Basin
Source: www.economist.com
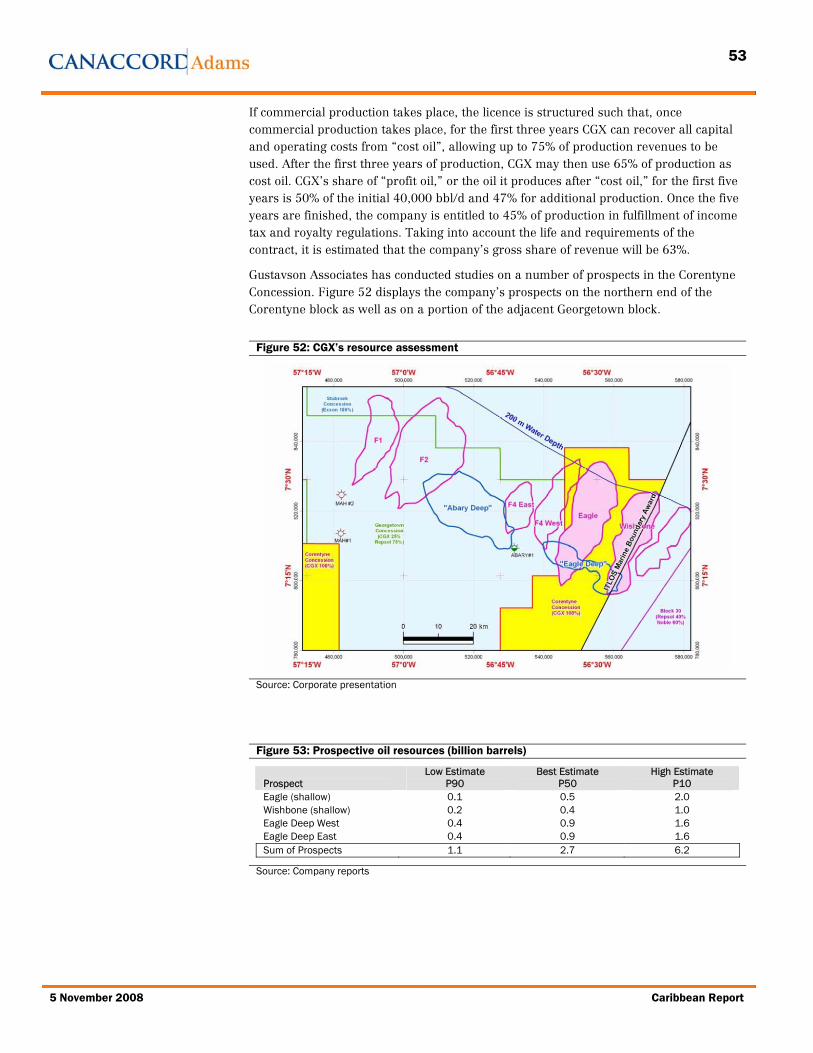
The fiscal regime in Guyana consists of two licences, one for exploration and the other for production. The Petroleum Prospecting Licence includes a waiver of duty for imports of petroleum equipment, reduction of duty to nominal levels on fuel for exploration operations and exemption for the contractor from certain provisions of the Corporate Tax Act. For both exploration and production, there are no tax obligations and a 10% reduction on all fuel costs. The government has a minimum discretionary position to profit from the split of oil production with the contractor; contractors can make a maximum of 50%. The Petroleum Prospecting Licence is for an initial period of four years with provision for two further renewal periods with each period lasting no more than three years. The renewal period is at the option of the licensee. The Petroleum Production Licence has an initial period of 20 years, potentially followed by one renewal period up to 10 years, which is also at the option of the licensee. CGX Energy, a Canadian exploration and production company with interests in Guyana, estimates that using full-cycle economics, the licensee’s share of gross revenue is 63%.
Figure 28: Guyana’s exploration licences
Area/Block/Licence Acreage (MM) Company (main operator) Corentyne Licence 3.8 CGX Energy Georgetown Licence 2.8 CGX Energy and Repsol YPF Pomeroon Licence 2.8 CGX Energy Exxon Licence 17.0 ExxonMobil Takatu Basin Area 2.7 Groundstar Resources
Source: CGX Energy Corporate Website, Groundstar Resources Corporate Website
25
5 November 2008 The Caribbean Report
Figure 29: Guyana’s offshore exploration licences
Source: CGX Energy Corporate Website
Exploration and production companies operating in Guyana include Exxon-Mobil, Century Oil, CGX Energy, Repsol YPF, Maersk Oil, and Groundstar Resources.
26
South American Offshore 5 November 2008
SURINAME
GOVERNMENT Suriname’s government is a constitutional democracy, consisting of a 51 member National Assembly. The President must be chosen by a minimum of 2/3 of all votes of the National Assembly or else a People’s Assembly will be formed. If a President is elected, he or she appoints a 16 member cabinet. The President also selects 10 commissioners, one for each administrative district of Suriname.
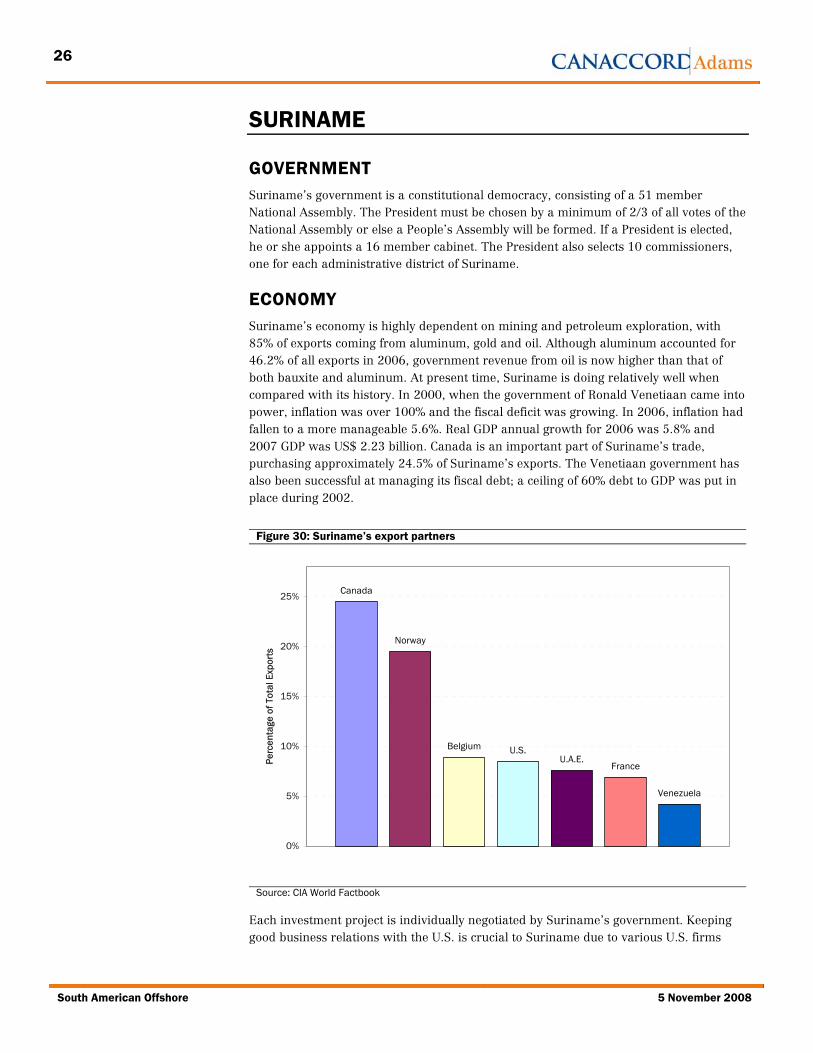
ECONOMY Suriname’s economy is highly dependent on mining and petroleum exploration, with 85% of exports coming from aluminum, gold and oil. Although aluminum accounted for 46.2% of all exports in 2006, government revenue from oil is now higher than that of both bauxite and aluminum. At present time, Suriname is doing relatively well when compared with its history. In 2000, when the government of Ronald Venetiaan came into power, inflation was over 100% and the fiscal deficit was growing. In 2006, inflation had fallen to a more manageable 5.6%. Real GDP annual growth for 2006 was 5.8% and 2007 GDP was US$ 2.23 billion. Canada is an important part of Suriname’s trade, purchasing approximately 24.5% of Suriname’s exports. The Venetiaan government has also been successful at managing its fiscal debt; a ceiling of 60% debt to GDP was put in place during 2002.
Figure 30: Suriname’s export partners
Canada
Norway
Belgium U.S.U.A.E.
France
Venezuela
0%
5%
10%
15%
20%
25%
Perc
enta
ge o
f Tot
al E
xpor
ts
Source: CIA World Factbook
Each investment project is individually negotiated by Suriname’s government. Keeping good business relations with the U.S. is crucial to Suriname due to various U.S. firms
27
5 November 2008 The Caribbean Report
operating in the country, including Suralco, Exxon-Mobil, Texaco, IBM and Alico. Additionally, Suriname is highly dependent on its relations with the Dutch government.
OIL AND GAS INDUSTRY The country has a state owned petroleum firm called Staatsolie. Many of the foreign companies operating in Suriname are doing so through production sharing contracts with Staatsolie, including Repsol YPF, Noble Energy, Maersk Oil, Teikoku, Murphy Oil and Tullow Oil. In addition, Staatsolie also has a 100% subsidiary called Paradise Oil. In 2007, Staatsolie contributed US$150 million to the government’s budget. ROE was 54% on a net profit of US$ 225 million. Total crude oil production for Suriname in 2007 was 13,500 bbl/d.
Figure 31: Suriname’s historical oil production
8
9
10
11
12
13
14
2000 2001 2002 2003 2004 2005 2006 2007
Thou
sand
s of
bar
rels
a d
ay
Source: Energy Information Agency (EIA)
The table below summarizes oil and gas exploration areas in Suriname:
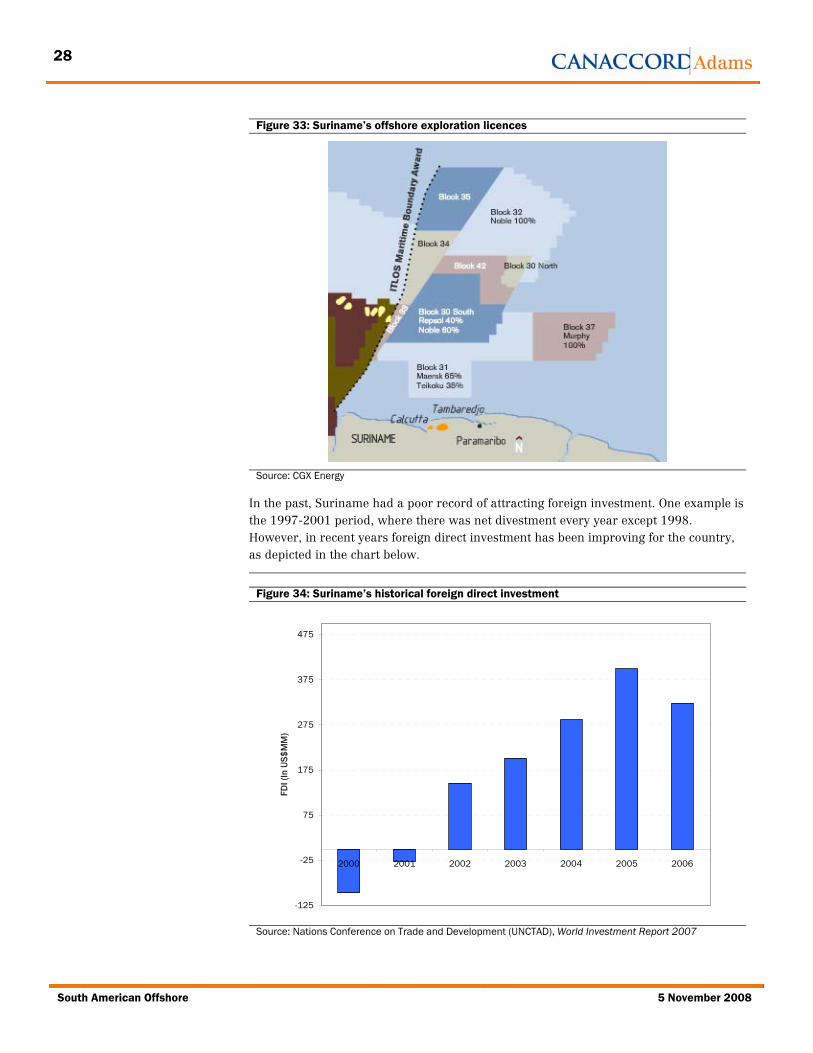
In the past, Suriname had a poor record of attracting foreign investment. One example is the 1997-2001 period, where there was net divestment every year except 1998. However, in recent years foreign direct investment has been improving for the country, as depicted in the chart below.
Figure 34: Suriname’s historical foreign direct investment
-125
-25
75
175
275
375
475
2000 2001 2002 2003 2004 2005 2006
FDI (
In U
S$M
M)
Source: Nations Conference on Trade and Development (UNCTAD), World Investment Report 2007
29
5 November 2008 The Caribbean Report
Historically, oil and gas has not played an important role in Suriname’s economy. Going forward, exploration and production activity could be a significant contributor to the country’s prosperity. This would be dependent on exploration results as onshore and offshore exploration has been limited. However, with the resolution of the border dispute with Guyana, there is more certainty to the offshore land position which could generate further offshore activity.
30
South American Offshore 5 November 2008
COMPANY FEATURE SUMMARIES
In the following section, we highlight a number of oil and gas companies that have operations in the Caribbean. We have included five public companies and one private company which are all headquartered in Canada. Within our company features we have three companies of particular interest that we have initiated research coverage on. These companies are Canadian Superior Energy, Challenger Energy, and CGX Energy.
Canadian Superior Energy Inc. (SNG : TSX : C$1.94 | SPECULATIVE BUY, C$4.50 12-month target).........................31
CGX Energy Inc. (OYL : TSX-V : C$0.49 | SPECULATIVE BUY, C$1.80 12-month target) ............................................45
COMPANY STATISTICS: Forecast Return %: 132% 52-week Range: C$1.27–5.01 Avg. Daily Vol. (000s): 147.8 Shares Out (M) basic: 157.6 Shares Out (M) fd: 179.1 Market Cap (M): C$305.8 Net Debt (2008E) (M): C$60.9 Enterprise Value (M): C$366.7 EARNINGS SUMMARY: FYE 2007A 2008E 2009E Oil & NGL (b/d): 594 750 750 Natural Gas (mmcf/d): 13.5 18.0 20.0 Total (boe/d): 2,843 3,750 4,083 EPS (fd) $(0.07) $0.19 $0.11 CFPS (fd): $0.09 $0.25 $0.29 Commodity Prices 2007A 2008E 2009E WTI (US$/b): $72.29 $104.97 $80.00 NYMEX Gas (US$/mmbtu): $6.97 $9.25 $8.75 SHARE PRICE PERFORMANCE:
COMPANY SUMMARY: Canadian Superior Energy is a Calgary-based oil and gas exploration and production company with operations in Western Canada, offshore Trinidad & Tobago, and Offshore Nova Scotia. All amounts in C$ unless otherwise noted.
Energy – Oil and Gas, Exploration and Production
PUSHING BEYOND CANADIAN BOUNDARIES Initiating research coverage We are initiating coverage on Canadian Superior Energy Inc. with a SPECULATIVE BUY recommendation and a 12-month target price of C$4.50. Our target price is based on a risked net asset valuation of the company’s development projects in Canada and Trinidad and Tobago.
Overview Canadian Superior Energy is a Calgary-based oil and gas exploration and production company with operations in western Canada, offshore Nova Scotia, offshore Trinidad and Tobago and a recently awarded block in Libya in north Africa.
The company has a sizeable presence in Trinidad and Tobago with interests in Block 5(c) and the Mayaro/Guayaguayare (M/G) project, accounting for gross undeveloped holdings of 135,041 acres. The company has a 45% working interest in Block 5(c), which has estimated reserves of 4 tcf. Block 5(c) has three separate potential hydrocarbon basins: Victory, Bounty and Endeavour. Exploration wells on the Victory and Bounty discoveries have potential initial production rates of approximately 100 and 200 mmcf/d respectfully. Additionally, the company has a 100% working interest on the M/G Block, which has estimated reserves of 10-30 million barrels of oil. Canadian Superior expects to drill two exploration wells on the licence by the end of the first quarter of 2009
32
South American Offshore 5 November 2008
RECOMMENDATION
We are initiating coverage on Canadian Superior Energy Inc. with a SPECULATIVE BUY recommendation and a 12-month target price of C$4.50. Our target price is based on a risked net asset valuation of the company’s development projects in Canada and Trinidad and Tobago.
CORPORATE PROFILE
COMPANY HISTORY Canadian Superior Energy was previously known as Kapalua Gold Mines Ltd. when it was founded in 1983. During 1993, the company changed its name to Prize Energy Inc. before finally changing its name to Canadian Superior Energy in 2000. The company has offices in Calgary, Halifax, Jersey City (NY) and Port of Spain, Trinidad, with total staff (including direct contract) of approximately 70.
The company was founded by Mr. Greg Noval, the current Chairman of Canadian Superior Energy, who also founded 88 Energy Corp., a company that he grew to a market cap worth over $500 million. Unfortunately, 88 Energy Corp. eventually ran into trouble with an unsuccessful exploration program and oil price volatility. This resulted in Mr. Noval coming to an agreement with the board of directors at 88 Energy Corp. to form a new entity called Canadian Superior. The new company was formed with the divestiture of certain assets and properties from 88 Energy Corp. to shareholders. Canadian Superior made one of its first major acquisitions on January 13, 2003, by purchasing the Drumheller, Alberta, area of the Canadian plains assets from El Paso, a multi-billion-dollar company that had become overburdened with debt.
Canadian Superior’s major holdings now include offshore properties in Trinidad and Tobago and 2.59 million gross acres located in offshore Nova Scotia. Other areas with interests include Libya and Tunisia, and Windfall and Boundary Lake in western Canada. The company also has a 50/50 LNG joint venture called Liberty Natural Gas with Excalibur Energy USA. The project proposes to bring LNG to the Greater New York City area in the United States.
BUSINESS STRATEGY Canadian Superior’s business focus is on international high-impact growth paired with production growth in western Canada, while also exploring in offshore in eastern Canada. At the same time, the company will strive to maintain financial discipline; one of Canadian Superior’s short-term goals is to be debt-free by the end of 2008. Additionally, the firm will mitigate risk where it can but will still attempt to take bold new business steps.
MANAGEMENT AND DIRECTORS The management group and board of directors consist of professionals with considerable international oil and gas industry experience.
33
5 November 2008 Caribbean Report
• Greg Noval, Chairman. Mr. Noval was recently Chairman of Challenger Energy (CHQ : TSX-V : C$2.20 | SPEC BUY, C$5.25 target) but recently resigned his position. Mr. Noval is also an owner of many private firms involved in real estate development, aviation and farming and ranching. He has over 20 years’ experience in the Canadian energy industry. Mr. Noval founded Canadian 88 Energy Corp., which converted into Esprit Energy Trust, before being acquired by Pengrowth Corporation. He holds a BComm and BA in economics from the University of Alberta and also a Bachelor of Law degree from the University of Saskatchewan.
• Craig McKenzie, Chief Executive Officer and Director. Mr. McKenzie was previously President of BG Trinidad & Tobago, one of BG’s largest and most profitable divisions. He has 21 years of international exploration and production experience in diverse segments including LNG, commercial and corporate operations and large-scale business transformations. Mr. McKenzie has also worked with BP plc and Amoco Corporation in various senior management positions. He holds an MBA from Kellogg School of Management at Northwestern University and a BS, petroleum engineering, from Louisiana State University.
• Michael Coolen, President and Chief Operational Officer. Mr. Coolen has worked for Canadian Superior since mid-2001. Prior to joining the company he was employed for over 20 years at Mobil Oil Canada and ExxonMobil. His last assignment at ExxonMobil was as senior manager for the Sable Offshore Energy project, which was the first offshore natural gas production project in offshore Nova Scotia. Mr. Coolen holds Bachelor of Science and Bachelor of Engineering degrees.
• Robb Thompson, Chief Financial Officer. Mr. Thompson was formerly the CFO and VP Finance at Berkana Energy Corp. He has over 25 years of experience, including technical, financial and operational expertise. He is a Chartered Accountant who has worked with KPMG LLP where he was an audit partner in the energy sector.
• Leif Snethun, VP, Western Canada. Mr. Snethun was a founder and President and CEO of Seeker Petroleum Ltd. He is a Professional Geologist and a member of the Association of Professional Engineers, Geologists and Geophysicists of Alberta. He holds a Bachelor of Science in geology from the University of Calgary and has 25 years of oil and gas experience within various senior geological, geotechnical and managerial positions.
The board of directors consists of Greg Noval, Craig McKenzie, Michael Coolen, Alex Squires (Managing Director of Brant Securities Ltd.), Charles Dallas, T.J. (Jake) Harp, Kaare (Kory) Idland and Richard (Rick) Watkins.
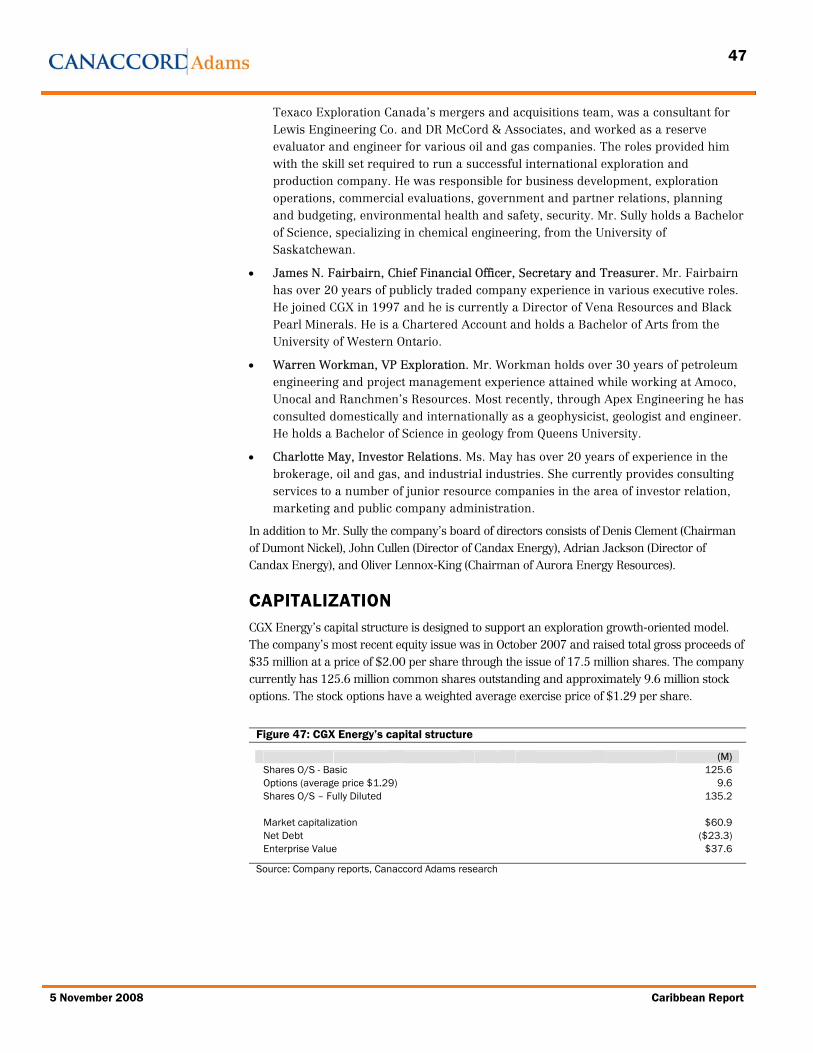
CAPITALIZATION Canadian Superior’s capital structure is designed to support a growth-oriented model. The most recent equity issue closed on September 4, 2008, and raised total gross proceeds of US$35 million at a price of $4.00 per share through the issue of approximately 8.8 million shares. The firm also completed a financing on November 16, 2007, raising gross proceeds of $22.7 million at a price of $3.50 per share through the issue of 6.5 million shares. The company currently has 157.7 million common shares outstanding and approximately 21.4 million dilutive securities. The 21.4 million in dilutive securities consist of 17.1 million options with an exercise price of $2.39 per
34
South American Offshore 5 November 2008
share and 4.4 million warrants with an exercise price of $4.00 per share. Additionally, the company has drawn $40.8 million against a revolving credit facility of $45 million.
Institutional investors own approximately 36% of the issued and outstanding shares of Canadian Superior. According to Thomson Financial, the major institutional shareholders of Canadian Superior include: Steelhead Partners, LLC (16.2 million shares), Palo Alto Investors, LLC (16.1 million shares), Blackrock Financial Management Inc. (9.4 million shares) and West Coast Asset Management Inc. (8.4 million shares).
Canadian Superior’s directors and management team own approximately 1.2% of the issued and outstanding shares of the company.
35
5 November 2008 Caribbean Report
OPERATIONS
BLOCK 5(C) – OFFSHORE TRINIDAD This block is located approximately 86 kilometres off the east coast of Trinidad, where the water depths range from approximately 500 to 1,500 feet. All wells drilled on this block to date have been drilled with a semi-submersible drilling rig. The company is paying 26.3% of the block’s exploration costs as a result of farming out to other parties to maintain a 45% working interest.
Figure 36: Joint venture partner working interest on Block 5(c)
Exploration Program Production Sharing Capital Commitment Contract Interest Canadian Superior 27% 45% British Gas 40% 30% Challenger 33% 25% 100% 100%
Source: Company reports
Over the last several years the company determined three large separate potential hydrocarbon structures on the block: named the Victory, Bounty, and Endeavour prospects. Canadian Superior drilled the Victory and Bounty prospects this year, and both were very successful. The third prospect, Endeavour, is currently being drilled with total depth expected to be reached in November 2008. The block is adjacent to several large gas fields including British Gas’ Dolphin and Dolphin Deep natural gas fields (see Figure 37).
Figure 37: Canadian Superior’s Block 5(c) operations
Source: Company reports
36
South American Offshore 5 November 2008
In early 2008, the company drilled the first well on the block at the Victory prospect. The well tested natural gas in two formations with the first zone being condensate rich. The first zone tested natural gas at pressure rates averaging between 40 mmcf/d and 45 mmcf/d and the second tested at rates averaging 30 mmcf/d. The two zones combined could produce gas at rates of approximately 100 mmcf/d. Reserves for the prospect are estimated to be between 0.6 and 1 tcf. The company believes that the Victory discovery well has an expected initial sales rate of 195 mmcf/d plus 6,000 bbl/d of condensate.
In July 2008, the company completed drilling the Bounty prospect to a total depth of 17,360 feet, which is located 2.2 miles from the Victory well. The well encountered gas-bearing zones with the main targeted zone encountering approximately 200 feet of pay. The well’s flow test indicated productive capability in excess of 200 mmcf/d of natural gas from this main targeted zone. Canadian Superior believes it has up to 2.6 Tcf of natural gas from this tested structure.
The company is now in the process of drilling the third prospect on Block 5(c). The Endeavour prospect is an independent prospect to the formerly drilled two prospects. It is expected that drilling will be completed in November 2008, with testing results due in the early first quarter of 2009. Despite the discoveries at Bounty and Victory, the chance of success on Endeavour is rated to be only 30%.
Regardless of the current and future success of these three prospects, the company still has the problem of bringing the Block 5(c) gas onstream. Canadian Superior and its partners are considering two options. The first one is to build a pipeline from Block 5(c) to the mainland. From there a fifth LNG train must be constructed to accommodate the new gas as the other four existing trains are already at capacity. A fifth train in the area has been proposed. However, the Trinidad government has yet to make a decision until a “new substantial gas discovery” can be made to justify the construction. Canadian Superior’s management believes a discovery over 4.5 tcf of natural gas should be sufficient to justify the construction of a fifth train. The second option is to liquefy the gas offshore and then transport the LNG to a sales point. Management has stated that both options have roughly the same economics and the decision depends on agreement from other stakeholders and joint venture partners, as well as the success of Endeavour well.
M/G BLOCK The company is a joint venture partner (100% working interest) with the Petroleum Company of Trinidad and Tobago (Petrotrin) in the near-shore Mayaro/Guayaguayare (M/G) Block. The block is off the east coast of Trinidad and consists of 58,080 gross acres. Reserves are estimated to be approximately 10-30 million barrels. Additionally, the block is in close proximity to several large onshore and offshore oil and natural gas discoveries. It is located 1.5 miles from the Navette field, which has produced over 60 million barrels of oil. Also nearby is its neighbour, the Angostura field, which has estimated reserves of approximately 1.75 tcf of natural gas and 450 million barrels of oil.
The company is currently in the process of receiving permits for the drilling of two locations on the block. Canadian Superior plans to drill both in the first quarter of 2009 pending approval from the government. The wells are expected to cost approximately $12-14 million assuming a 100% interest to the company. If the exploration wells are successful the company will follow up with additional 3D seismic in the area to determine a full field development plan.
37
5 November 2008 Caribbean Report
Figure 38: Canadian Superior’s M/G operations
Note: Corporate website
OTHER OPERATIONS
Libya and Tunisia The company recently announced its entry into North Africa, which it calls its Oasis project. On August 27, 2008, the company signed the formal Exploration and Production Sharing Agreement for the offshore Libya/Tunisia block called the 7th of November Block. The block comprises approximately 1,200 square miles (750,000 acres) of exploration property located 75 miles offshore North Africa in the Mediterranean Gulf of Gabes. Water depths in this area range from 250 to 375 feet. Nearly equal portions of the block fall in Tunisian and Libyan waters.
In close proximity to the7th of November Block is the El Bouri (Libya) and Ashtart (Tunisia) oil fields, which are estimated to have produced over 750 million barrels of oil and 250 million barrels of oil, respectively. Canadian Superior’s management team believes that its newly acquired block lies on productive trends established by these two fields. The company will be the operator of the block but has not yet disclosed its working interest.
38
South American Offshore 5 November 2008
Figure 39: 7th of November Block located on the border of Tunisia and Libya
Source: Company Reports, Canaccord Adams
Western Canada The company’s production currently resides in its western Canadian properties. Essentially, the Canadian assets are used to finance the larger and riskier projects for the company. Management has stated that, owing to future capital requirements for the development drilling of the Trinidad Block 5(c) prospects, these assets may be put up for sale as soon as this winter.
Figure 40: Western Canadian assets
Source: Company Reports, Canaccord Adams.
39
5 November 2008 Caribbean Report
Offshore eastern Canada Canadian Superior Energy is the largest offshore exploration acreage holder in offshore Nova Scotia, with approximately 1.2 million net acres residing in five exploration licences. The company holds a 100% interest in these five licences. The first exploration well (I-85) in the area was drilled in March 2004 on the Mariner prospect. The well encountered non-commercial quantities of natural gas pay. However, the well provided insight into the geology of the prospect. The company has a preliminary plan to drill a second offset exploration well at Mariner in March 2009. The company has identified possible potential unrisked reserves of as much as 2.5 trillion cubic feet.
Ideally, Canadian Superior would like to decrease the risk and cost of this well by bringing in some private investors for 50% of the interest. The company has not finalized any farm-out arrangements as of yet, but recently signed an agreement whereby the Tunisian/Libyan Joint Exploration, Production, and Petroleum Services Company (Joint Oil) was awarded an overriding royalty interest and optional participating interest to Joint Oil, in Canadian Superior’s Mariner Block.
Figure 41: Canadian Superior offshore eastern Canada blocks
Source: Company reports
Liberty Natural Gas Canadian Superior is also in a 50/50 LNG joint venture project with Excalibur Energy USA Inc. called Liberty Natural Gas. The proposed project will provide LNG to the largest and highest price yielding area in the United States – the greater New York City area. The project is unique in that it provides LNG to the city without being an eye sore to the residents and is safe from terrorist threats since it is submerged below the ocean surface. Canadian Superior’s management team believes it has the government onside for the project and feels comfortable that it can finance the project, since many institutional investors have approached the company already. If completed, the project would have a payback period of approximately one year and would generate about $600-700 million in cash flow each year.
40
South American Offshore 5 November 2008
VALUATION
We value Canadian Superior using a sum-of-the-parts valuation methodology. Within our valuation we have taken into account the company’s Canadian asset value as well as an estimated value of the company’s Block 5(c) assets. We have assumed no value from the company’s exploration prospects on the M/G Block, in the frontier offshore blocks held in eastern Canada, and in the offshore block on the border of Libya and Tunisia. We also note that, due to the uncertainty around final approval of the Liberty Gas project, we have not included any value for this asset. This results in what we view as a very conservative value for the company which is appropriate in today’s current capital markets.
Currently all of Canadian Superior’s production resides in Canada. As mentioned, this asset provides the company with cash flow to fund a portion its operations in Trinidad. The reserves for the Canadian assets have been determined by independent third-party engineering at December 31, 2007, for proven plus probable reserves along with the associated values. We note that these reserves estimates themselves are likely conservative given the different commodity prices as well as any reserve additions or adjustments that may be made as a result of the company’s 2008 drilling program. Including estimated company debt, the net asset value of the company’s Canadian assets is outlined in the figure below.
Figure 42: Canadian net asset value
NPV 10% Before Tax ($mm) Proven Reserves 103.8 Probable Reserves 44.5 Total Proved plus Probable 148.4 Estimated net debt (4.7) Total Value 143.7 NAV: $/ basic share 0.91 NAV: $/FD share 1.13
Source: Canaccord Adams, company reports
Additionally, Canadian Superior has a 45% interest in Block 5(c) offshore Trinidad, which has two confirmed discoveries on the block and a highly prospective third discovery currently drilling. As such, we present a potential value grid by which we have run various development scenarios related to reserve size, production and gas price. Our economics assume generic LNG costs for the offshore development and assume a cost-recovery/tariff model for the new pipeline from the block to Trinidad as well as for the construction and operation of a fifth LNG processing train.
Our assumptions for the economic analysis are reflected in the figure below. We have assumed gross capital expenditures to develop the three Block 5(c) prospects to be US$1.2 billion. Included in this capital are development drilling capital and a production platform. We have also assumed two different sets of operating costs that are dependent on the final destination of the LNG. We have assumed operating costs of US$3.25/mcf if the LNG is transported to North America and US$4.25/mcf if the LNG is transported to an international destination.
41
5 November 2008 Caribbean Report
Figure 43: Assumptions for discounted cash flow evaluation of Block 5(c)
Gross Capital Expenditures (US$M) 1,160 Operating Costs - North America Freight ($US/mcf) 3.25 Operating Costs - International Freight ($US/mcf) 4.25 Commencement of Production July 2014
* Includes all three exploration prospects on Block 5(c) to the combined total gross recoverable reserves ** The values in the areas of grey shading assumes gas delivery to North America only Source: Canaccord Adams
Figure 45: Valuation Grid for Block 5(c) – per share (in Canadian dollars)
NPV After-Tax @ 10% per Basic Share Outstanding (C$) Long-term Natural Gas Price (US$/mmbtu) Gross Recoverable
* Includes all three exploration prospects on Block 5(c) to the combined total gross recoverable reserves ** The values in the areas of grey shading assumes gas delivery to North America only Source: Canaccord Adams
Clearly, the valuation of Block 5(c) is a function of resources discovered and sales price. Even with double-digit natural gas prices available in North America, the smallest recoverable reserve size is only marginally economic based on the capital expenditures required to develop the resource. Given the world’s demand for energy and current LNG markets, it is our view that the successful development of the discoveries made on Block 5(c) will be sold to LNG buyers around the world. This would argue for a value based on natural gas prices of better than US$10.00/mmbtu.
The next component of the valuation relates to the total size of the discoveries on the block. To date, the first discovery at Victory is estimated to be 0.6-1.1 Tcf in size. The second discovery at Bounty is estimated to have a potential size of up to 2.6 Tcf of natural gas. Therefore, the resource potential identified so far could be as high as 3.7 Tcf of natural gas.
42
South American Offshore 5 November 2008
Given the history of production and resource size from the area, we have a degree of comfort in the potential resources discovered to date and are not risking the size of the prize, but have instead risked the development costs and assumptions,
Combining the value of the Canadian assets with the value attributable to Trinidad, we have set a 12-month target price of C$4.50. For the Trinidad assets, we assume a contribution of C$3.65 per share. We base this on the assumption that the recoverable resources will prove to be at the low end of the range shown above and ultimately sold for a gas price in the range of $10.00-15.00/mmbtu. However, we note that the upside value from this level in terms of reserves and price likely makes this target price conservative.
43
5 November 2008 Caribbean Report
Figure 46: Summary of estimates
CANADIAN SUPERIOR ENERGY INC. SNGRecommendation SPEC BUY Current price C$1.9412-month target price C$4.50 Total projected return* 132%November 3, 2008 * includes dividends payable
Share Information Current Market Multiples 2006A 2007A 2008E 2009E 2010EMarket cap ($M) $305.8 Discretionary cash flow multiple 13.1x 21.4x 7.8x 6.8x 7.2xShares O/S – basic (M) 157.6 Debt-adjusted multiple 12.1x 15.9x 8.8x 10.1x 12.5xShares O/S – float (M) 94.0 Earnings multiple NA NA 10.3x 17.1x 18.1xShares O/S – f.d. (M) 179.1 Target multiple 26.8x 45.6x 15.4x 15.7x 16.6x52-week range C$1.27 C$5.01 Debt-adjusted target multiple 27.1x 36.7x 18.4x 18.5x 20.9x Avg Daily Trading Volume (year) 147,777Valuation Current Net Income 2006A 2007A 2008E 2009E 2010ENet asset value (CCI estimate) $4.56 Net income ($M) NA ($9.9) $29.4 $17.9 $16.9Price/NAV 43% EPS (basic) ($0.09) ($0.07) $0.19 $0.11 $0.11Enterprise value ($M) $366.7 EPS (f.d.) ($0.10) ($0.07) $0.19 $0.11 $0.11EV/proven reserves ($/boe) $70.11
1.2% 1.5% 0.6% 0.5% 0.6%Reserves - 6:1 (at December 31, 2007) +/- C$0.10/mcf Gas $0.00 $0.00 $0.00 $0.00 $0.00Equivalent reserves (mmboe) Oil Gas Total 2.0% 3.2% 1.3% 1.2% 1.5%Proven 1.0 4.2 5.2Proven + probable 1.9 6.5 8.5 Management Team % Proven producing 96% 77% 80% Craig McKenzie, CEO British Gas % Proven 52% 65% 62% Michael Coolen, President and COO Mobil Oil, ExxonMobil % Crude oil & liquids 19% Robb Thompson, CFO Berkana Energy, KPMG Reserve life – proven (yrs) 4.3 4.5 4.5
1 Year 3 Year Reservoir Engineer BankerProven F&D costs ($/boe) 0.00 6.17 GLJ Associates Ltd. Canadian Western BankP+P F&D costs ($/boe) 0.00 4.76 Auditor Bank Lines - Q2/08 2008E 2009E 2010EProven reserve replacement ratio 1.0x 1.1x Meyers Norris Penny LLP $45 135% 335% 540%
Analyst: J. Frederick Kozak, P.Eng. (403) 508-3836Associate: Timothy Clark (403) 508-3824
Source: Canaccord Adams
44
South American Offshore 5 November 2008
Investment risks Risks to our investment thesis include:
• An investment in the company’s securities would be speculative due to the nature of the company’s involvement in the exploration, development and production of oil and natural gas and its present stage of development.
• Capital requirements and liquidity risks associated with the development and production of natural gas from the company’s Block 5(c) property as well as future projects.
• Commodity price swings in crude oil and natural gas could impact Canadian Superior’s profitability.
• Adverse changes to government regulations and fiscal terms. Any adverse changes could impact Canadian Superior’s execution and profitability.
• A left-leaning government that is less business friendly could affect the profitability of the company’s operations.
COMPANY STATISTICS: Forecast Return %: 267% 52-week Range: C$0.42–4.60 Avg. Daily Vol. (000s): 203.4 Shares Out (M) basic: 125.6 Shares Out (M) fd: 135.2 Market Cap (M): C$60.9 Net Debt (2008E) (M): C$(23.3) Enterprise Value (M): C$37.6 EARNINGS SUMMARY: FYE 2007A 2008E 2009E Oil & NGL (b/d): NA NA NA Natural Gas (mmcf/d): NA NA NA Total (boe/d): NA NA NA EPS (fd) ($0.04) ($0.14) ($0.02) CFPS (fd): ($0.02) ($0.02) ($0.03) Commodity Prices 2007A 2008E 2009E WTI (US$/b): $72.29 $104.97 $80.00 NYMEX Gas (US$/mmbtu): $6.97 $9.25 $8.75 SHARE PRICE PERFORMANCE:
COMPANY SUMMARY: CGX Energy is a Canadian-based oil and gas company focused on offshore and onshore oil exploration in the Guyana-Suriname basin. All amounts in $US unless otherwise noted.
Energy – Oil and Gas, Exploration and Development
SWINGING FOR THE FENCES Initiating research coverage Our 12-month target price of C$1.80 is based on the assumption that the company is able to develop successfully a 50 million barrel offshore discovery from offshore Guyana with internal expertise and capital resources. We note that independent third party evaluation of the best prospects on the company's landholdings put the resource potential at 1.1 billion barrels on a low estimate basis, implying that this prospect has an approximate 5 percent chance of success. We rate CGX Energy SPECULATIVE BUY.
Overview CGX Energy is an international oil and gas exploration and production company that is headquartered in Toronto with exploration properties in the South American country of Guyana. The company’s business focus is to explore for oil in the unproved high-risk Guyana-Suriname Basin. The United States Geological Survey (USGS) has identified the Guyana-Suriname Basin as having one of the largest unexplored oil basins in the world with estimated recoverable oil reserves of 15.2 billion barrels and gas reserves of 42 trillion cubic feet.
A recent dry hole drilled by Repsol and Noble Energy on Block 30 in offshore Suriname has created some speculation about the commerciality of the basin. While a success would have been favourable for companies such as CGX, that dry hole does not mean the basin is uneconomic as the targeted play type was different than what CGX is focusing on.
Significant presence in Guyana-Suriname
CGX Energy has interest in four Petroleum Prospecting Licences (PPL), which are offshore holdings in Guyana that amount to a total 7.2 million net acres. The presence of oil on a portion of one block alone (Corentyne, 100% interest) has been evaluated to contain an estimated resource potential of 2.7 billion barrels of oil. The company plans to drill its first well on the Corentyne PPL in late 2009 or early 2010.
46
South American Offshore 5 November 2008
RECOMMENDATION We are initiating coverage on CGX Energy Inc. with a SPECULATIVE BUY recommendation and a 12-month target price of C$1.80. Our 12-month target price of C$1.80 is based on the assumption that the company is able to develop successfully a 50 million barrel offshore discovery from offshore Guyana with internal expertise and capital resources. We note that independent third party evaluation of the best prospects on the company's landholdings put the resource potential at 1.1 billion barrels on a low estimate basis, implying that this prospect has an approximate 5 percent chance of success. We rate CGX Energy SPECULATIVE BUY.
CORPORATE PROFILE
COMPANY HISTORY In 1996, the company’s founders began the process of acquiring its first offshore concession with the Government of Guyana. Two years later in June 1998, a wholly owned subsidiary, CGX Resources Inc., was granted a 10-year licence called the Corentyne Licence. The licence covers 3.8 million acres of land located offshore Guyana. The following year the company conducted a 2D seismic program over the most prospective offshore portion of the licence. The seismic identified two turbidite deep-sea fan targets called Eagle and Wishbone, and two stratigraphic-trap targets called Horseshoe West and Horseshoe East. In 2000, following the prospect identification and seismic interpretation, the company planned to drill an exploration well on the Eagle prospect. However, the rig that was contracted to drill the well was forced off location by the Surinamese navy due to an offshore border dispute with neighbouring Suriname. CGX Resources then proceeded to drill a lower-grade target, Horseshoe West, which ended up being a dry hole.
The altercation with the Surinamese navy sparked a dispute between Suriname and Guyana regarding the location of each country’s offshore borders lasting almost seven years. In September 2007, the maritime border dispute was resolved between the two countries, with CGX Resources playing a pivotal role in the negotiations. The company now has the go-ahead to pursue its exploration leads that reside close to the maritime border between the two countries.
BUSINESS STRATEGY CGX Energy’s business model is based around the expertise of its technical team and the strategic relationships it has in Guyana. The company’s strategy is to create value through high-risk oil exploration and future development. The company is chasing a resource in an unproven area of the world. This high-risk business plan could prove to be extremely valuable if commercial hydrocarbons do actually reside in the Guyana-Suriname basin.
MANAGEMENT AND DIRECTORS The management group and board of directors consist of professionals with considerable international oil and gas industry experience.
• Kerry E. Sully, President, Chief Executive Officer and Director. Prior to his role as CEO, Mr. Sully was a co-founder and worked at Ranchmen’s Resources (bought by Crestar Energy for $260 million) as Chief Executive Officer. He held a position on
47
5 November 2008 Caribbean Report
Texaco Exploration Canada’s mergers and acquisitions team, was a consultant for Lewis Engineering Co. and DR McCord & Associates, and worked as a reserve evaluator and engineer for various oil and gas companies. The roles provided him with the skill set required to run a successful international exploration and production company. He was responsible for business development, exploration operations, commercial evaluations, government and partner relations, planning and budgeting, environmental health and safety, security. Mr. Sully holds a Bachelor of Science, specializing in chemical engineering, from the University of Saskatchewan.
• James N. Fairbairn, Chief Financial Officer, Secretary and Treasurer. Mr. Fairbairn has over 20 years of publicly traded company experience in various executive roles. He joined CGX in 1997 and he is currently a Director of Vena Resources and Black Pearl Minerals. He is a Chartered Account and holds a Bachelor of Arts from the University of Western Ontario.
• Warren Workman, VP Exploration. Mr. Workman holds over 30 years of petroleum engineering and project management experience attained while working at Amoco, Unocal and Ranchmen’s Resources. Most recently, through Apex Engineering he has consulted domestically and internationally as a geophysicist, geologist and engineer. He holds a Bachelor of Science in geology from Queens University.
• Charlotte May, Investor Relations. Ms. May has over 20 years of experience in the brokerage, oil and gas, and industrial industries. She currently provides consulting services to a number of junior resource companies in the area of investor relation, marketing and public company administration.
In addition to Mr. Sully the company’s board of directors consists of Denis Clement (Chairman of Dumont Nickel), John Cullen (Director of Candax Energy), Adrian Jackson (Director of Candax Energy), and Oliver Lennox-King (Chairman of Aurora Energy Resources).
CAPITALIZATION CGX Energy’s capital structure is designed to support an exploration growth-oriented model. The company’s most recent equity issue was in October 2007 and raised total gross proceeds of $35 million at a price of $2.00 per share through the issue of 17.5 million shares. The company currently has 125.6 million common shares outstanding and approximately 9.6 million stock options. The stock options have a weighted average exercise price of $1.29 per share.
Institutional investors own approximately 22% of the issued and outstanding shares of CGX Energy. According to Thomson Financial, the major institutional shareholders of CGX Energy include: Sprott Asset Management Inc. (12.5 million shares), AGF Management Ltd. (5.8 million shares), OppenheimerFunds Inc.(4.5 million shares), and Sceptre Investment Counsel Ltd. (3.6 million shares). CGX Energy’s directors and management team own approximately 4% of the issued and outstanding shares of the company.
49
5 November 2008 Caribbean Report
AREA OF OPERATIONS
SIMPLIFIED GEOLOGY The company is in a highly prospective portion of South America. The geology of the Guyana-Suriname Basin goes back more than 250 million years ago when North America, South America and Africa were essentially a single landmass.
Figure 48: Plate tectonics – 250 million years ago
Source: Atlas of Plate Reconstructions, Lawver, Dalziel, Gahagan, Martin and Campbell, 2002
As the earth’s geology evolved, these plates started to move apart, ultimately ending up where the continents are located today. But the movement of the individual plates created stresses in the earth’s crust. The movement of the three continents away from each other resulted in several geological formations, most notably in the Guyana-Suriname Basin, where the continent of South America started to rise up. With this process, significant erosion off the continental landmass into the ocean created large sedimentary sequences. These sedimentary sequences have overlaid the existing carbonate formations that were created, while the continents were mostly connected and likely resulted in the source rock for the sedimentary sequences.
Africa
North America
South America
Caribbean
50
South American Offshore 5 November 2008
Figure 49: Geology of Guyana-Suriname Basin
Source: CGX Energy
As a result of the erosional deposition, there is now estimated to be more than 3,000 metres of sedimentary rock in the Guyana offshore, containing turbidite and stratigraphic deposits that may hold a wealth of crude oil and natural gas reserves. According to the US Geological Survey, the basin’s potential could exceed 15 billion barrels of oil with natural gas potential of 42 trillion cubic feet with approximately 84% of the oil potential in the Late Cretaceous and Tertiary-aged play types.
51
5 November 2008 Caribbean Report
Figure 50: Location map
Source: CGX Energy
EXPLORATION BLOCKS The company has working interests in four petroleum prospecting licences, accounting for 9.5 million gross (7.2 million net) acres, which are located predominantly offshore Guyana.
• 100% working interest in the offshore Corentyne Concession and in the Corentyne Annex Concession (Western Annex);
• 25% working interest in the offshore Georgetown Concession;
• 100% working interest in the offshore Pomeroon Concession; and
• 62% working interest in the onshore ON Energy Block.
52
South American Offshore 5 November 2008
Figure 51: CGX’s holdings in Guyana/Suriname
Source: Company reports, Canaccord Adams
Corentyne and Corentyne Annex PPL, Guyana CGX holds a Petroleum Prospecting Licence (PPL) in this offshore area, which consists of approximately 3.8 million acres. The company has a 100% working interest in both the Corentyne and Western Annex areas. Offshore water depths in the Corentyne/Western Annex area range between 0 and 1,000 metres. Targeted zones in the area include the Lower Tertiary-aged turbidite sand reservoirs (~3,200 metres deep) and the Cretaceous-aged basin floor fan (~5,400 metres deep).
The company has commenced shooting on a 536 square kilometre 3D seismic program on its Corentyne licence in October 2008. This seismic program is being conducted in conjunction with a 1,650 square kilometre 3D seismic program on the adjacent Georgetown Block (25% CGX) and will fulfill the minimum work commitment through the First Renewal Phase Two of the Correntyne licence. Total cost to CGX is estimated at approximately US$16 million.
Interpretation of the 3D seismic will take place in early 2009 with drilling location(s) selected prior to mid-year. CGX could be ready to drill before the end of 2009. However, funding will be an issue, as the first exploration well to be drilled to approximately 19,500 feet is estimated to cost approximately US$85 million with the potential of the well being drilled to 22,000 feet at a cost of approximately US$90 million.
Prior to commencement of the 3D seismic program, CGX was marketing the offshore acreage as a potential farm-out deal. Apparently no acceptable farm-in offers were received and CGX has decided to proceed to the drill-ready stage before offering the block again. With the 3D data, the company should be in a much better position to attract a partner.
53
5 November 2008 Caribbean Report
If commercial production takes place, the licence is structured such that, once commercial production takes place, for the first three years CGX can recover all capital and operating costs from “cost oil”, allowing up to 75% of production revenues to be used. After the first three years of production, CGX may then use 65% of production as cost oil. CGX’s share of “profit oil,” or the oil it produces after “cost oil,” for the first five years is 50% of the initial 40,000 bbl/d and 47% for additional production. Once the five years are finished, the company is entitled to 45% of production in fulfillment of income tax and royalty regulations. Taking into account the life and requirements of the contract, it is estimated that the company’s gross share of revenue will be 63%.
Gustavson Associates has conducted studies on a number of prospects in the Corentyne Concession. Figure 52 displays the company’s prospects on the northern end of the Corentyne block as well as on a portion of the adjacent Georgetown block.
P10 Eagle (shallow) 0.1 0.5 2.0 Wishbone (shallow) 0.2 0.4 1.0 Eagle Deep West 0.4 0.9 1.6 Eagle Deep East 0.4 0.9 1.6 Sum of Prospects 1.1 2.7 6.2
Source: Company reports
54
South American Offshore 5 November 2008
Georgetown PPL, Guyana In early 2002, CGX acquired a 25% participating interest in the Georgetown PPL with Repsol holding the other 75% interest. The licence is subject to a confidentiality agreement with Repsol and the Government of Guyana; however, the terms of the work program and fiscal regime are believed to be similar to the company’s Corentyne licence. The property consists of approximately 2.8 million acres located offshore in water depths range from 30 to 200 metres. In October 2008, the company commenced the shooting of a 1,651 square kilometre 3D seismic survey on the block.
CGX has identified two potential play types on this block. The map in Figure 52 shows the outline of several prospects on the block, notably the Cretaceous-aged Abary Deep, and the Tertiary-aged prospects identified as F1, F2 and F4 East and F4 West. A well drilled in 1975 by then operator of the block, Shell Oil, had a downhole blowout that prevented proper testing of the Abary prospect. However, the well drilled at Abary-1 had numerous oil and gas shows.
The Cretaceous-aged basin fan features have resulted as an erosion of the underlying rock swept sediment further out from the continent. Clearly identified on seismic, the prospect has not been evaluated. However, on the 100% interest Correntyne block, the Eagle Deep East and West Prospects range in size from 0.4 billion to 1.6 billion barrels of prospective oil resources.
Pomeroon PPL, Guyana CGX holds a 100% interest in approximately 2.8 million acres in the area. This offshore property has water depths ranging from 20 to 500 metres. The area is located between CGX’s Georgetown Annex block and the Plataforma Deltana (offshore Venezuela).
The western boundary of this block remains unresolved with Venezuela and is not currently subject to any technical work. We note that the proximity of the block and the trend of the geology through the area make this block highly attractive for future exploration work, however no published assessment of the potential currently exists. CGX has made an application to extend the term of this block to November 2013. All work commitments on the block up to the end of the initial period are deemed to be completed.
Berbice Block, Guyana The company holds a 62% interest in 384,000 acres in this onshore area through its ownership in subsidiary ON Energy Inc. The area is located on the southeastern coastal plain of Guyana on the border Suriname (Figure 51). The company is currently working on the extension of this licence as well as its work program.
55
5 November 2008 The Caribbean Report
VALUATION
RESOURCE POTENTIAL Given the exploration nature of the region and the unknown production potential of the offshore blocks, it is difficult to know what a development scenario for the area might look like. However, with the resource potential as identified by the company’s independent evaluators, the total resource size and potential value to the company as shown in the following tables are immense.
Figure 54: Gustavson reserves
Prospective Oil Resources (mmbbl) Prospect Low Estimate Best Estimate High Estimate Eagle Shallow 153 545 1,956 Wishbone 186 439 1,043 Eagle Deep West 379 859 1,590 Eagle Deep East 415 904 1,636 Sum of prospects 1,133 2,747 6,225
Net Present Values (US$mm) Eagle Deep & Eagle Shallow Prospects 11,744 Eagle Shallow 4,314 Eagle Deep 7,296
Source: Gustavson Associates
VALUATION Given the unknown nature of the area, we have made some simplifying assumptions to assist investors in determining a potential value of exploration success to the company. We have determined that there is a high likelihood of an oil discovery on the company’s block. However, the ability of CGX to mount the development of the resources as highlighted above in the resource assessment by Gustavson is, in our opinion, not an option.
For our analysis we have assumed a “typical” offshore discovery scenario whereby CGX could potentially discover a 50 million barrel field or a 100 million barrel field and be able to develop these discoveries with the resources and capabilities of the company.
Our assumptions for the economic analysis are reflected in Figure 56, which lists our assumptions for the analysis of these two possible development scenarios. For the first scenario, we are assuming that CGX makes a deep 100 million barrel discovery. We have assumed gross capital expenditures to develop this prospect to be US$600 million. Included in this capital is US$85 million for one exploration well, US$300 million for development drilling, and US$215 million for a production platform. We estimate commencement of production for the company to occur in January 2012 with the company holding a 100% working interest. As a result of the high working interest and the significant costs associated with this scenario we have assumed the company will fund
56
South American Offshore 5 November 2008
50% of the project costs with equity. This results in the issuance of 100 million additional shares for the company in two tranches, which is reflected in our per-share discounted cash flow values in Figure 58 below.
For the second scenario, we are assuming that CGX discovers and develops a shallow 50 million barrel oil prospect. We have assumed gross capital expenditures to develop this prospect to be US$375 million. Included in this capital is US$85 million for one exploration well (the same well as drilled for the 100 million barrel prospect), US$150 million for development drilling, and US$140 million for a production platform. We estimate commencement of production for the company to be earlier than the 100 million barrel scenario, with production starting in April 2011 (100% working interest). We have assumed project financing in this case to be 80% equity reflecting the riskier nature of the development. This results in the issuance of 100 million additional shares for the company in two tranches, which is reflected in our per-share discounted cash flow values in Figure 60.
Figure 56: Assumptions for discounted cash flow evaluation
100 mmbbl scenario 50 mmbbl scenario Exploration Wells 1 Exploration Wells 1 Gross Exploration Capital (US$mm) 85 Gross Exploration Capital (US$mm) 85 Development Wells 4 Development Wells 3 Gross Development Capital (US$mm) 300 Gross Development Capital (US$mm) 150 Platform Capital (US$mm) 215 Platform Capital (US$mm) 140 Gross Capital Expenditures (US$mm) 600 Gross Capital Expenditures (US$mm) 375 Commencement of Production Jan 2012 Commencement of Production Apr 2011 Peak Production Rate (mbbl/d) 50 Peak Production Rate (mbbl/d) 30 Working Interest Assumption (%) 100 Working Interest Assumption (%) 100 Capital Structure for financing project 50/50 Equity Debt Capital Structure for financing project 80/20 Equity Debt $100mm Financing @ $2.00/share (mm) 50 $100mm Financing @ $2.00/share (mm) 50 $200mm Financing @ $4.00/share (mm) 50 $200mm Financing @ $4.00/share (mm) 50 Total Shares Raised (mm): 100 Total Shares Raised (mm): 100 Total basic shares outstanding (mm) 225.6 Total basic shares outstanding (mm) 225.6
Source: Canaccord Adams
Figure 57: Valuation grid – 100 million barrel scenario
From our analysis of the best-case scenario, we see above that the economics of a 100 million barrel offshore oil discovery in Guyana are very robust. As we highlight above, even a low-price scenario would have a material return on investment.
While we have provided a range of operating costs for the 100 million barrel case, we are of the opinion that the offshore development of such a field is more likely to be in the range of $10-15/bbl for operating costs. We have highlighted what we believe is the most likely area of long-term crude oil prices to assess the potential value per share of this discovery on the company.
Figure 59: Valuation grid – 50 million barrel scenario
From our analysis of this modest discovery scenario, we see above that the economics of a 50 million barrel offshore oil discovery in Guyana are also very robust. As we highlight above, even a low-price scenario would have a material return on investment.
As in the 100 million barrel case, we have provided a range of operating costs for the development of a 50 million barrel discovery. While operating conditions would be similar,
58
South American Offshore 5 November 2008
due to the shallow nature of our hypothetical discovery, the offshore development of such as field is more likely to have operating costs in the range of $7.50-15/bbl. We have highlighted what we believe is the most likely area of long-term crude oil prices to assess the potential value per share of this discovery on the company.
Our 12-month target price of C$1.80 is based on the assumption that the company is able to develop successfully a 50 million barrel offshore discovery from offshore Guyana with internal expertise and capital resources. We note that independent third party evaluation of the best prospects on the company's landholdings put the resource potential at 1.1 billion barrels on a low estimate basis, implying that this prospect has an approximate 5 percent chance of success. We rate CGX Energy SPECULATIVE BUY.
59
5 November 2008 The Caribbean Report
Figure 61: Summary of estimates
CGX ENERGY INC. OYLRecommendation SPEC BUY Current price C$0.4912-month target price C$1.80 Total projected return* 271%November 4, 2008 * includes dividends payable
Share Information Current Market Multiples 2006A 2007A 2008E 2009E 2010EMarket cap ($M) $60.9 Discretionary cash flow multiple NA NA NA NA NAShares O/S – basic (M) 125.6 Debt-adjusted multiple NA NA NA NA NAShares O/S – float (M) 93.3 Earnings multiple NA NA 3.5x NA NAShares O/S – f.d. (M) 135.2 Target multiple NA NA NA NA NA52-week range C$0.42 C$4.60 Debt-adjusted target multiple NA NA NA NA NA Avg Daily Trading Volume (year) 203,367Valuation Current Net Income 2006A 2007A 2008E 2009E 2010E Contingent Net asset value (CCI estimate) $4.00 Net income ($M) NA ($4.5) $17.6 ($2.4) ($1.4)Price/NAV 12% EPS (basic) ($0.07) ($0.04) $0.14 ($0.02) ($0.01)Enterprise value ($M) $37.6 EPS (f.d.) ($0.08) ($0.04) $0.14 ($0.02) ($0.01)EV/proven reserves ($/boe) NA
2006A 2007A 2008E 2009E 2010E Cash Flow 2006A 2007A 2008E 2009E 2010EEV/production ($/boe/d) NA NA NA NA NA Cash flow ($M) ($5.5) ($2.8) ($2.9) ($4.3) ($3.3)Return on equity (%) 49% -17% 23% -3% -2% CFPS (basic) ($0.03) ($0.02) ($0.02) ($0.03) ($0.03)Return on capital employed (%) -73% -18% 32% -4% -2% CFPS (f.d.) ($0.03) ($0.02) ($0.02) ($0.03) ($0.03)
CFPS (f.d.d.) ($0.05) ($0.02) ($0.02) ($0.03) ($0.03)Oil & Liquids Production (b/d) 2006A 2007A 2008E 2009E 2010EFirst quarter 0 0 0 0 0 Capital Expenditures & Debt 2006A 2007A 2008E 2009E 2010ESecond quarter 0 0 0 0 0 Capital expenditures ($M) $0.0 $0.0 $0.0 $89.0 $145.0Third quarter 0 0 0 0 0 Year-end net debt ($M) ($0.7) ($37.0) ($23.3) $70.0 $218.4Fourth quarter 0 0 0 0 0 Average net debt/cash flow NA NA NA 0.3 1.0Annual 0 0 0 0 0 Year-end net debt/cash flow 0.1 13.4 8.0 (16.1) (65.3)
Natural Gas Production (mmcf/d) 2006A 2007A 2008E 2009E 2010E Commodity Prices 2006A 2007A 2008E 2009E 2010EFirst quarter 0.0 0.0 0.0 0.0 0.0 WTI oil (US$/bbl) $66.13 $72.29 $104.97 $80.00 $90.00Second quarter 0.0 0.0 0.0 0.0 0.0 NYMEX gas (US$/mmbtu) 6.73 6.97 9.25 8.75 8.75Third quarter 0.0 0.0 0.0 0.0 0.0 Realized oil & NGL (US$/bbl) NA NA NA NA NAFourth quarter 0.0 0.0 0.0 0.0 0.0 Realized natural gas (US$/mcf) NA NA NA NA NAAnnual 0.0 0.0 0.0 0.0 0.0
Netbacks ($/boe) 2006A 2007A 2008E 2009E 2010ETotal Production (boe/d) - 6:1 2006A 2007A 2008E 2009E 2010E Revenue NA NA NA NA NAFirst quarter 0 0 0 0 0 Net royalties NA NA NA NA NASecond quarter 0 0 0 0 0 Operating costs NA NA NA NA NAThird quarter 0 0 0 0 0 Operating netback NA NA NA NA NAFourth quarter 0 0 0 0 0 Cash flow netback NA NA NA NA NAAnnual 0 0 0 0 0% crude oil & liquids NA NA NA NA 1% CFPS (f.d.d.) Price Sensitivity 2006A 2007A 2008E 2009E 2010EProduction growth NA NA NA NA NA +/- US$1.00/b WTI $0.00 $0.00 $0.00 NA $0.00
0.0% 0.0% 0.0% NA 0.0%Reserves - 6:1 (at December 31, 2007) +/- C$0.10/mcf Gas $0.00 $0.00 $0.00 NA $0.00Equivalent reserves (mmboe) Oil Gas Total 0.0% 0.0% 0.0% NA 0.0%Proven NA NA NAProven + probable NA NA NA Management Team % Proven producing NA NA NA Kerry Sully, President and CEO Birch Mountain, Ranchmen's Resources % Proven NA NA NA Warren Workman, VP Exploratio Amoco, Unocal, Ranchmen's % Crude oil & liquids NA James Fairborne, CFO Vena Resources, Black Pearl Minerals Reserve life – proven (yrs) NA NA NA
1 Year 3 YearProven F&D costs ($/boe) NA NA Reservoir Engineer BankerP+P F&D costs ($/boe) NA NA Gustavson Associates N/AProven reserve replacement ratio NA NA Auditor Bank Lines - Q2/08 2008E 2009E
Parker-Simone LLP N/A N/A N/A
ALL $ AMOUNTS ARE IN US$ UNLESS OTHERWISE NOTED
Analyst: J. Frederick Kozak, P.Eng. (403) 508-3836Associate: Timothy Clark (403) 508-3824
Source: Canaccord Adams
60
South American Offshore 5 November 2008
Investment risks Risks to our investment thesis include:
• An investment in the company’s securities would be speculative due to the nature of the company’s involvement in the exploration, development and production of oil and natural gas and its present stage of development.
• Capital requirements and liquidity risks associated with the exploration, development and production of oil and natural gas from the company’s Guyana assets.
• Commodity price swings in crude oil and natural gas could impact CGX Energy’s profitability.
• Adverse changes to government regulations and fiscal terms. Any adverse changes could impact CGX Energy’s execution and profitability.
• A left-leaning government which is less business friendly could affect the profitability of the company’s operations.
COMPANY STATISTICS: Forecast Return %: 139% 52-week Range: C$0.42–4.60 Avg. Daily Vol. (000s): 67.1 Shares Out (M) basic: 52.8 Shares Out (M) fd: 67.9 Market Cap (M): C$116.2 Net Debt (2008E) (M): C$15.6 Enterprise Value (M): C$131.7 EARNINGS SUMMARY: FYE 2007A 2008E 2009E Oil & NGL (b/d): NA NA NA Natural Gas (mmcf/d): NA NA NA Total (boe/d): NA NA NA EPS (fd) ($0.14) $0.35 ($0.02) CFPS (fd): ($0.02) ($0.05) ($0.05) Commodity Prices 2007A 2008E 2009E WTI (US$/b): $72.29 $104.97 $80.00 NYMEX Gas (US$/mmbtu): $6.97 $9.25 $8.75 SHARE PRICE PERFORMANCE:
COMPANY SUMMARY: Challenger Energy is a Calgary-based oil and gas exploration and production company. The company is currently in exploration projects in offshore Trinidad and Tobago. All amounts in $C unless otherwise noted.
Energy – Oil and Gas, Exploration and Development
A VICTORY-OUS, BOUNTY-FUL ENDEAVOUR Initiating research coverage We are initiating coverage on Challenger Energy Corp. with a SPECULATIVE BUY recommendation and a 12-month target price of C$5.25. Our target price is based on a risked net asset valuation of the company’s working interest in Block 5(c) located in offshore Trinidad and Tobago.
Overview Challenger Energy Corp. is a Calgary-based oil and gas exploration and production company with operations in offshore Trinidad and Tobago.
The company has a 25% working interest in Block 5(c), which has estimated reserves of 3-4 Tcf or more of natural gas. As identified on seismic, Block 5(c) has three separate potential hydrocarbon targets: Victory, Bounty and Endeavour. Exploration wells on the Victory and Bounty prospects have been successfully drilled and have been demonstrated to be world-class natural gas discoveries. The tested capabilities of Victory and Bounty are approximately 100 mmcf/d and 200 mmcf/d respectfully, which would be suitable to support a new future liquified natural gas processing train on the island of Trinidad.
Recommendation We are initiating coverage on Challenger Energy Corp. with a SPECULATIVE BUY recommendation and a 12-month target price of C$5.25. Our target price is based on a risked net asset valuation of the company’s working interest in Block 5(c) located in offshore Trinidad and Tobago.
62
South American Offshore 5 November 2008
CORPORATE PROFILE
COMPANY HISTORY Challenger Energy was formed through the merger of Challenger Energy Corp. and Global Energy Express Inc. on December 1, 2005. The company entered into a farm-out agreement on Canadian Superior’s Block 5c asset in November 2004. In December 2006, Challenger Energy commenced trading on the Toronto-Venture Exchange (TSX-V) under the symbol “CHQ” with a subsequent listing on the American Stock Exchange (AMEX) in late January 2007.
BUSINESS STRATEGY Challenger Energy’s business focus is towards international high-impact growth potential focused primarily in Trinidad and Tobago. More forward-looking, this company will be sold to either a joint venture partner on Block 5c or an international E&P company that wants to penetrate the highly lucrative natural gas industry of Trinidad and Tobago.
MANAGEMENT AND DIRECTORS The management group and board of directors consist of professionals with considerable international oil and gas industry experience.
• Daniel MacDonald, President, Chief Executive Officer and Director. Mr. MacDonald has over 20 years of experience in the oil and gas industry. His most recent role prior to joining Challenger Energy was advisor to various companies on international exploration opportunities, oil sands transactions and western Canadian petroleum activities. Mr. MacDonald was also the previous President and Chief Executive Office of Voyager Energy, which operates in Canada and also has assets in Trinidad and Tobago. Additionally, he was employed at Amoco Canada, Canadian 88 Energy and Canadian Superior. Mr. MacDonald is a Professional Landman and holds a Bachelor of Arts in Business Administration with a major in Finance and Economics from Washington State University.
• Manjeet Dhillon, Chief Financial Officer. Mr. Dhillon became VP Finance and Chief Financial Officer on February 1, 2006. He was previously employed at Shaw Cablesystems from August 2004 to January 2006. Additionally, he also was Vice President and Controller of Boardwalk Real Estate Investment Trust from August 1999 to August 2004. Mr. Dhillon holds a Bachelor of Commerce degree from the University of Alberta and is also a Chartered Accountant.
The board of directors consists of Dan MacDonald, James Brown (CEO of Mill City Gold Corp.), Joe Chatoor, Michael Hibberd (CEO of MJH Services), Timothy Lindsey (Consultant).
CAPITALIZATION Challenger Energy’s capital structure is based to support a growth-oriented model. The company recently raised new equity with an issue that closed on October 2, 2008. Challenger was able to raise total gross proceeds of C$30 million at a price of $3.00 a share through the issue of 10 million shares. The company currently has 52.8 million
63
5 November 2008 The Caribbean Report
common shares outstanding and approximately 15.1 million dilutive securities, consisting of 5.5 million options with an average exercise price of $1.76 a share and 9.6 million warrants at an average exercise price of $3.68 a share.
Institutional investors own approximately 6% of the issued and outstanding shares of Challenger Energy. According to Thomson Financial, the major institutional shareholders of Challenger Energy include: Cambrian Capital LP (1.8 million shares), Driehaus Capital Management LLC (1.1 million shares), Wellington Management Company, LLP (0.7 million shares), and BlackRock Financial Management Inc. (0.2 million shares).
Canadian Superior’s directors and management team own approximately 19% of the issued and outstanding shares of the company, with Greg Noval owning approximately 7.3 million shares, or 11% of the company.
64
South American Offshore 5 November 2008
OPERATIONS
BLOCK 5(C) – OFFSHORE TRINIDAD This block is located approximately 86 kilometres off the east coast of Trinidad, where the water depths range from approximately 500 to 1,500 feet. All wells on this block are drilled with a semi-submersible drilling rig. The company is paying 33% of the block’s exploration costs in three wells to earn a 25% working interest in the entire block.
Figure 63: Joint Venture Partner Working Interest on Block 5(c)
Exploration Program Capital Production Sharing Contract Commitment Interest Canadian Superior 27% 45% British Gas 40% 30% Challenger 33% 25% 100% 100%
Source: Company reports
Over the last several years, the company identified three large separate and distinct potential hydrocarbon structures on the Block which were named the Victory, Bounty, and Endeavour prospects. Challenger Energy and its joint venture partners have drilled the Victory and Bounty prospects this year, with great success. The third prospect, Endeavour is currently being drilled with completion expected late in the late fourth quarter of this year. The block is adjacent to several large gas fields including British Gas’ Dolphin and Dolphin Deep natural gas fields (Figure 64).
An early victory In early 2008, the company finished drilling the first well on the block in the Victory prospect. The well tested natural gas in two formations, with the first zone being condensate rich. The first zone tested natural gas at rates averaging between 40 mmcf/d and 45 mmcf/d with high gravity condensate of approximately 30 bbl/mmcf (or approximately 1,200-1,350 bbl/d of condensate). The second zone tested at rates averaging 30 mmcf/d. Combined, the two zones could be able of producing gas at rates of approximately 150 mmcf/d and 3,000 bbl/d of condensate. Reserves for the prospect are estimated to be between 0.6 Tcf and 1 Tcf with associated natural gas liquids (condensate etc) of 2.4 million to 3.7 million barrels.
The second prospect is Bounty-ful In July 2008, the company completed drilling of the Bounty prospect to a total depth of 17,360 feet. This prospect, located approximately 2.2 miles from the Victory well was drilled to test a new fault-defined trap on the block. The well encountered gas-bearing zones with the main targeted zone having approximately 200 feet of pay. A flow test of the high pressure zone (bottom hole pressure of 7,186 psi) was limited by the capacity of the test equipment, but a stabilized flow rate of 60 mmcf/d was achieved. The well’s flow test indicated productive capability of approximately 200 mmcf/d of natural gas from this main targeted zone. The operator of the block, Canadian Superior believes that the Bounty structure has up to 2.6 Tcf of natural gas resource potential.
66
South American Offshore 5 November 2008
Endeavour-ing to make another discovery The company is now in the process of drilling the final prospect on Block 5(c). The well spud at the end of August 2008 and is expected to take approximately 120 days to drill. Testing time could be as much as an additional 30-45 days. The Endeavour prospect is a prospect that is independent of Victory and Bounty. While confidence in the prospect potential is higher due to the two previous exploration successes on Victory and Bounty, management believes that the chance of success for Endeavour is unchanged at approximately 30%.
Figure 66: Horizon amplitude – “I” Sand
Source: Canadian Superior Energy Inc.
The Endeavour exploration well will test the same prospective reservoir (the “I” Sand) as was found in the Bounty well approximately five miles away. Geologically, it is possible that the fault block containing the Endeavour prospect could be connected to the fault block that contains the Bounty prospect. In reviewing the seismic shot over the block, we note the lack of a clearly defined boundary between the two prospects as shown in the seismic map above. Should this be the case and the two are actually connected, the size potential of a combined Endeavour-Bounty prospect would be very significant.
We expect that drilling will be completed in the late fourth quarter with testing results due in the early first quarter of 2009.
Future development potential Regardless of the current and future success of these three prospects, the company still has the problem of bringing Block 5(c) gas onstream. However, once the exploration drilling is completed, the operations of the block will be turned over to partner BG, who have extensive operating experience in the region. Future drilling timing remains unknown.
Challenger and its partners are considering two options. The first one is to build a pipeline from Block 5(c) to the island of Trinidad. This would require the construction of a new fifth LNG-processing train to accommodate the new gas as the other four existing
67
5 November 2008 The Caribbean Report
trains are operating at capacity. A fifth train on the island has been proposed for sometime, however, the Trinidad government has yet to make a decision until a “new substantial gas discovery” can be made to justify the construction. Challenger’s management believes a discovery containing over 4.5 tcf of natural gas should be sufficient to justify the construction of a fifth train. To date, it appears that Blcok 5(c) could be the catalyst for this new LNG train.
The second option is to liquefy the gas on a purpose-built ship with onboard LNG processing capacities and then transport the LNG to a sales point. This appears to be the favoured option of one of the partners, but does not appear to have significant support within the Challenger management team.
M/G BLOCK Another opportunity that Challenger could pursue in Trinidad and Tobago is farming in on the Mayaro/Guayaguayare M/G Block. Currently its partner in Block 5(c), Canadian Superior holds a 100% working interest the near-shore M/G Block. The Block is off the east coast of Trinidad and consists of 58,080 gross acres. Reserves are estimated to be approximately 10-30 million barrels. The block is also in close proximity to several large onshore and offshore oil and natural gas discoveries. It is located 1.5 miles away from the Navette field which has produced over 60 million barrels of oil, making this block highly prospective. Also nearby is the Angostura field, which while not fully analogous to the M/G Block geology, has estimated reserves of approximately 1.75 Tcf of natural gas and 450 million barrels of oil.
As operator, Canadian Superior is currently in the process of obtaining permits for the drilling of two locations on the block. Both wells are planned to be drilled in the first quarter of 2009 pending approval from the government. The wells are expected to cost approximately $12 to $14 million at 100% interest. If the exploration wells are successful, there would be the need to follow-up with additional 3D seismic in the area to determine a full field development plan.
Figure 67: Canadian Superior’s M/G operations
Source: Canadian Superior
68
South American Offshore 5 November 2008
VALUATION
As the company has not yet signed an agreement to farm in on the M/G Block, we have excluded the potential value of this in our valuation of Challenger. We note that the company is in essence a one-play company – it has a 25% interest in Block 5(c) offshore Trinidad which has two confirmed discoveries on the block and a highly prospective third discovery currently drilling.
We have run discounted cash flow models to estimate the value of the gas discoveries on the block to Challenger. At this early stage, there are many unknown factors that can impact the valuation of the block, but it is clear that there is significant value that has been found and potentially significant upside value to follow.
As such, we present a potential value grid by which we have run various development scenarios related to reserve size, production and gas price. Our economics assume generic LNG costs for the offshore development and assume a cost-recovery/tariff model for the new pipeline from the block to Trinidad as well as for the construction and operation of a fifth LNG processing train.
Our assumptions for the economic analysis are reflected in Figure 68. We have assumed gross capital expenditures to develop the three Block 5(c) prospects to be US$1.2 billion. Included in this capital is development drilling capital and a production platform. We have also assumed two different sets of operating and transportation costs which are dependent on the final destination of the LNG. We have assumed operating and transportation costs of US$3.25/mcf if the LNG is transported to North America and US$4.25/mcf if the LNG is transported to any of the numerous international destinations.
Figure 68: Assumptions for discounted cash flow evaluation
Gross Capital Expenditures (US$M) 1,160 Operating Costs - North America Freight ($US/mcf) 3.25 Operating Costs - International Freight ($US/mcf) 4.25 Commencement of Production July 2014
*Includes all three exploration prospects on Block 5(c) to the combined total Gross Recoverable Reserves **The values in the areas of grey shading assumes gas delivery to North America only Source: Canaccord Adams
69
5 November 2008 The Caribbean Report
Figure 70: Valuation grid for Block 5(c) – per share (in Canadian dollars)
NPV After-Tax @ 10% per Basic Share Outstanding (C$) Long-term Natural Gas Price (US$/mmbtu) Gross Recoverable
*Includes all three exploration prospects on Block 5(c) to the combined total Gross Recoverable Reserves **The values in the areas of grey shading assumes gas delivery to North America only Source: Canaccord Adams
Clearly, the valuation of the Block 5(c) is a function of resources discovered and sales price. Even with double-digit natural gas prices available in North America, the smallest recoverable reserve size is only marginally economic based on the capital expenditures required to develop the resource. Given the world’s demand for energy and the current LNG markets, it is our view that the successful development of the discoveries made on Block 5(c) will be sold to LNG buyers around the world. This would argue for a value based on natural gas prices of better than US$10.00/mmbtu.
The next component of the valuation relates to the total size of the discoveries on the block. To date, the first discovery at Victory is estimated to be from 0.6 Tcf to 1.1 Tcf in size. The second discovery at Bounty is estimated to have a potential size of up to 2.6 Tcf of natural gas. Therefore, the resource potential identified so far could be as high as 3.7 Tcf of natural gas.
Given the history of production and resource size from the area, we have a degree of comfort in the potential resources discovered to date and are not risking the size of the prize, but have instead risked the development costs and assumptions,
Our 12-month target price of C$5.25 is based on the assumption that the recoverable resources will prove to be at the low end of the range shown above and ultimately sold for a gas price in the range of $10.00/mmbtu to $15.00/mmbtu. However, we note that the upside value from this level in terms of reserves and price likely makes this target price conservative.
70
South American Offshore 5 November 2008
Figure 71: Summary of estimates
Challenger Energy Corp. CHQRecommendation SPEC BUY Current price C$2.2012-month target price C$5.25 Total projected return* 139%November 3, 2008 * includes dividends payable
Share Information Current Market Multiples 2006A 2007A 2008E 2009E 2010EMarket cap ($M) $116.2 Discretionary cash flow multiple NA NA NA NA NAShares O/S – basic (M) 52.8 Debt-adjusted multiple NA NA NA NA NAShares O/S – float (M) 33.6 Earnings multiple NA NA 6.2x NA NAShares O/S – f.d. (M) 67.9 Target multiple NA NA NA NA NA52-week range C$0.42 C$4.60 Debt-adjusted target multiple NA NA NA NA NA Avg Daily Trading Volume (year) 67,077 Valuation Current Net Income 2006A 2007A 2008E 2009E 2010EContingent Net asset value (CCI estimate) $5.25 Net income ($M) NA ($4.4) $18.3 ($1.2) ($1.2)Price/NAV 42% EPS (basic) ($0.08) ($0.14) $0.35 ($0.02) ($0.02)Enterprise value ($M) $131.7 EPS (f.d.) ($0.08) ($0.14) $0.35 ($0.02) ($0.02)EV/proven reserves ($/boe) NA
2006A 2007A 2008E 2009E 2010E Cash Flow 2006A 2007A 2008E 2009E 2010EEV/production ($/boe/d) NA NA NA NA NA Cash flow ($M) ($0.5) ($0.7) ($2.3) ($2.4) ($2.4)Return on equity (%) NA NA NA NA NA CFPS (basic) $0.00 $0.00 ($0.05) ($0.05) ($0.05)Return on capital employed (%) NA NA NA NA NA CFPS (f.d.) $0.00 $0.00 ($0.05) ($0.05) ($0.05)
CFPS (f.d.d.) ($0.00) ($0.02) ($0.05) ($0.05) ($0.05)Oil & Liquids Production (b/d) 2006A 2007A 2008E 2009E 2010EFirst quarter 0 0 0 0 (0) Capital Expenditures & Debt 2006A 2007A 2008E 2009E 2010ESecond quarter 0 0 0 0 (0) Capital expenditures ($M) NA $17.6 $74.3 $56.9 $56.9Third quarter 0 0 0 0 (0) Year-end net debt ($M) NA $6.2 $15.6 $71.9 $128.1Fourth quarter 0 0 0 (0) (0) Average net debt/cash flow NA NA 0.1 0.8 1.8Annual 0 0 0 0 (0) Year-end net debt/cash flow NA (9.3) (6.8) (29.9) (53.2)
Natural Gas Production (mmcf/d) 2006A 2007A 2008E 2009E 2010E Commodity Prices 2006A 2007A 2008E 2009E 2010EFirst quarter 0.0 0.0 0.0 0.0 0.0 WTI oil (US$/bbl) $66.13 $72.29 $104.97 $80.00 $90.00Second quarter 0.0 0.0 0.0 0.0 0.0 NYMEX gas (US$/mmbtu) 6.73 6.97 9.25 8.75 8.75Third quarter 0.0 0.0 0.0 0.0 0.0 Realized oil & NGL (US$/bbl) NA NA NA NA NAFourth quarter 0.0 0.0 0.0 0.0 0.0 Realized natural gas (US$/mcf) NA NA NA NA NAAnnual 0.0 0.0 0.0 0.0 0.0
Netbacks ($/boe) 2006A 2007A 2008E 2009E 2010ETotal Production (boe/d) - 6:1 2006A 2007A 2008E 2009E 2010E Revenue NA NA NA NA NAFirst quarter 0 0 0 0 (0) Net royalties NA NA NA NA NASecond quarter 0 0 0 0 (0) Operating costs NA NA NA NA NAThird quarter 0 0 0 0 (0) Operating netback NA NA NA NA NAFourth quarter 0 0 0 (0) (0) Cash flow netback NA NA NA NA NAAnnual 0 0 0 0 (0)% crude oil & liquids NA NA NA NA NA CFPS (f.d.d.) Price Sensitivity 2006A 2007A 2008E 2009E 2010EProduction growth NA NA NA NA NA +/- US$1.00/b WTI $0.00 $0.00 $0.00 $0.00 ($0.00)
0.0% 0.0% 0.0% 0.0% 0.0%Reserves - 6:1 (at December 31, 2007) +/- C$0.10/mcf Gas $0.00 $0.00 $0.00 $0.00 ($0.00)Equivalent reserves (mmboe) Oil Gas Total 0.0% 0.0% 0.0% 0.0% 0.0%Proven NA NA NAProven + probable NA NA NA Management Team % Proven producing NA NA NA Dan MacDonald, CEO Canadian Voyager Energy, Canadian 88 % Proven NA NA NA Manjeet Dhillon, CFO Boardwalk REIT, Shaw Cable % Crude oil & liquids NA Reserve life – proven (yrs) NA NA NA
1 Year 3 Year Reservoir Engineer BankerProven F&D costs ($/boe) NA NA N/A CIBCP+P F&D costs ($/boe) NA NA Auditor Bank Lines - Q2/08 2008E 2009EProven reserve replacement ratio NA NA Meyers Norris Penny LLP $0 N/A N/A
Analyst: J. Frederick Kozak, P.Eng. (403) 508-3836Associate: Timothy Clark (403) 508-3824
Source: Canaccord Adams
71
5 November 2008 The Caribbean Report
Investment risks Risks to our investment thesis include:
• An investment in the company’s securities would be speculative due to the nature of the company’s involvement in the exploration, development and production of oil and natural gas and its present stage of development.
• Capital requirements and liquidity risks associated with the development and production of natural gas from the company’s Block 5(c) property as well as future projects.
• Commodity price swings in crude oil and natural gas could impact Challenger Energy’s profitability.
• Adverse changes to government regulations and fiscal terms. Any adverse changes could impact Challenger Energy’s execution and profitability.
• A left-leaning government which is less business friendly could affect the profitability of the company’s operations.
COMPANY SUMMARY: Petro Andina is an oil and gas exploration and production company with assets in the Neuquen Basin of Argentina and recently entered into a joint venture agreement in Trinidad and Tobago. All amounts in C$ unless otherwise noted.
Energy – Oil and Gas, Exploration and Production
Recent news highlights September 15, 2008: Petro Andina announced that it has been awarded exploitation concessions in Argentina. Specifically, the exploitation concessions will cover the El Renegado and Gobernador Ayala Este fields in the Gobernador Ayala III concession and the Puesto Pinto field in the La Pampa portion of the company’s CNQ-7/A concession.
Company highlights
• The company has a sizeable presence in Argentina and Trinidad. It holds 598,500 gross undeveloped acres (331,500 net) in Argentina and 214,000 gross undeveloped acres (107,000 net) in Trinidad.
• The company’s current production is approximately 13,000 boe/d, all of which comes from its operations in Argentina.
• In early 2008, the company entered into a joint venture agreement with private company Voyager Energy, which granted Petro Andina a 50% operating working interest in two onshore exploration blocks – Central Range Shallow and Central Range Deep – in Trinidad and Tobago. The agreement is subject to a production-sharing contract with minimum work commitments. The company expects to spend $15 million on seismic coverage in the area during 2008 and to commence exploration drilling in 2009.
74
South American Offshore 5 November 2008
OPERATIONS
Trinidad and Tobago
• In January 2008, Petro Andina entered into a joint venture agreement with Voyager Energy Ltd. The agreement grants the company a 50% working interest and allows it be the operator of the two onshore exploration blocks. The two blocks are in close proximity to producing areas and recent discoveries. Under the conditions of the arrangement, the company will act as the operator of the Central Range Shallow and Central Range Deep blocks, which consist of approximately 214,000 gross (107,000 net) acres. Both of the areas are subject to a production-sharing contract that has been awarded to Voyager and the Petroleum Company of Trinidad and Tobago. The Petroleum Company of Trinidad and Tobago, if it chooses, can exercise an option to take a 35% working interest in any developments on the Central Range Shallow Block and a 20% working interest in any developments on the Central Range Deep Block.
• The production-sharing contract has minimum work commitments (during the first four-year term), which include 100 kilometres of 2D seismic, 250 square kilometres of 3D seismic, and the drilling of one deep well to a minimum depth of 12,000 feet and three shallow wells to a depth of 4,500 feet. The company’s minimum work commitment over the first four years is an estimated $25.25 million.
Figure 72: Petro Andina’s Trinidad operations
Note: Corporate website
75
5 November 2008 The Caribbean Report
Other operations
• The company’s holdings in Argentina are in the Northeast Platform of the Neuquen Basin. The Neuquen Basin is the most prolific producer of hydrocarbons in Argentina; current production surpasses 275,000 barrels of oil and 2.75 Bcf of gas per day. The basin’s estimated reserves are 1.2 billion barrels of oil and 14 trillion cubic feet of natural gas.
• Currently, Petro Andina is analyzing and executing specific enhanced oil recovery (EOR) techniques such as water flooding and steam flooding in its El Corcobo Norte and Cerro Huanul Sur operations in CNQ7/A Block in Argentina. The company anticipates that every 1% of additional recovery will add 1 million barrels of recoverable reserves to the company. It is estimated that primary recovery rates are 5-10%, water flood recovery rates are 15-35%, and steam injection recovery rates are 50-80%.
• The company plans to continue its development program in Argentina by drilling additional wells, exploring current land positions, and possibly increasing its acreage position through acquisitions.
Figure 73: Petro Andina’s Argentina operations
Note: Corporate website
76
South American Offshore 5 November 2008
MANAGEMENT AND BOARD OF DIRECTORS Figure 74: Petro Andina’s management team and board of directors
Name Position Wayne K. Foo President & Chief Executive Officer Barry B. Larson VP Operations & Chief Operating Officer Kenneth G. Pinsky VP Finance & CFO Jose M. Ronchino General Manager, Argentina David R. Taylor VP Business Development Norman F. McIntyre Chairman Curtis D. Bartlett Director, Member of Operations & Reserves Committee Ron D. Miller Director, Chair of Finance & Audit Committee W.A. (Alf) Peneycad Director, Member of Finance & Audit and Corporate
Governance & HR Committee David I. Holm Director, Member of Finance & Audit and Corporate
COMPANY SUMMARY: Primera Energy is a junior oil and gas exploration company with acquired assets in onshore Trinidad and is currently pursuing several other opportunities in both onshore and offshore Trinidad. All amounts in C$ unless otherwise noted.
Trinidad
Tobago
Energy – Oil and Gas, Exploration and Production
Recent news highlights September 22, 2008: Primera Energy Resources announced that it has voluntarily requested a halt of trading of its common shares on the TSX Venture Exchange as the company is in advanced negotiations with a related party concerning the acquisition of production. Additionally, the company mentioned it is considering a private placement.
Company highlights
• The company’s assets reside in Trinidad’s onshore Block WD-4, onshore Cory Moruga Block (Cory “E”), and offshore Block 3(b).
• The company’s assets in Block WD-4 consist of 700 acres, where it currently has 10 wells on production at an average production rate of 205 barrels of oil per day.
• The company’s holdings in the Cory Moruga Block account for 7,443 acres. The company is in the process of obtaining a Certificate of Environmental Clearance for exploratory drilling after having completed 3D seismic of the area.
• The company’s holdings in the Block 3(b) farm-in are subject to ministerial approval. Primera has conducted extensive 3D seismic of the area and is currently waiting for approval before funding any exploration farm-in activities.
• At both the Cory Moruga Block and Block 3(b), Primera is awaiting the Ministry of Energy’s approval for future farm-in terms before beginning any exploration and production activities.
78
South American Offshore 5 November 2008
OPERATIONS
Block WD-4 – onshore
• The company’s holdings are in the southern part of the basin and consist of 700 acres. The target formation depth is estimated to be between 3,000 and 7,500 feet. Expected initial production is 80-100 barrels a day per well. Currently 10 wells are on production with an average production rate of 205 barrels a day. As of January 1, 2008, there are an estimated 1.119 million barrels of oil in remaining reserves (2P).
• The company is currently optimizing existing wells. During 2008, Primera plans to drill six wells at a total cost of $4.7 million.
Figure 75: Primera’s Block WD-4 operations
Note: Corporate presentation
Cory Moruga Block “E” – onshore
• The company’s holding in the Cory Moruga block consists of 7,443 acres. Primera’s holding is in close proximity (approximately 4 kilometres) to existing crude oil and natural gas infrastructure. The target formation depth in the area is between 3,500 and 12,000 feet, targeting Herrera and Karamat sands of Miocene age. The estimated potential of the block is 60 million barrels of oil equivalent.
• Primera recently completed a full 3D seismic of the block and is currently processing the data. The company is awaiting a Certificate of Environmental Clearance for exploration drilling and approval to be allowed farm-ins on the block. If the farm-in contract is approved, the company will have to pay 25% of minimum exploration costs (approximately $7.7 million) to earn a 25% interest in the block. Exploration costs will include the 85 square kilometre of 3D seismic and the drilling of a minimum of two exploration wells (approximately $5.1 million).
• Future work commitments include the drilling of two exploratory wells at a capital cost of $20.4 million.
79
5 November 2008 The Caribbean Report
• Exploration drilling adjacent to the block has resulted in several natural gas discoveries ranging from 8.2 million cubic feet a day to over 62.5 million cubic feet a day.
• The company’s holding in Block 3(b) consists of approximately 64,463 hectares, with a water depth range of 300-1,500 feet. The company is currently applying for farm-in rights on the block. If the Ministry of Energy approves the farm-in, then Primera will be granted a 15% working interest in the block. The current partners on the block are Kerr-McGee TT Offshore Petroleum Ltd. (34.5% WI), BHP Billiton Trinidad & Tobago (25.5% WI), Primera Block 3(b) Ltd. (25% WI), and Diamond Energy T&T Ltd. (15% WI).
• The estimated initial production from a successful well in this area is approximately 8,000-12,000 barrels a day.
• The company’s farm-in terms include paying 15% of total exploration expenditures (approximately C$7.4 million) excluding the first exploration well that has been drilled, to be granted a 15% interest in the block.
• The property has a minimum work commitment, which includes Phase 1 of the commitments, that has a four-year duration (ending in July 2009). Phase 1 includes acquiring a minimum 3D seismic, conducting geological studies, and drilling two exploration wells. To date the company has completed a 3D seismic program and is in the process of conducting geological studies. Additionally, Primera has drilled one well, which proved to be uneconomic. The location of the second exploratory well is under review; however, a Certificate of Environmental Clearance must be acquired before drilling can commence.
80
South American Offshore 5 November 2008
Figure 77: Primera’s Block 3(b) operations
Note: Corporate presentation
MANAGEMENT AND BOARD OF DIRECTORS Figure 78: Directors and officers
Name Position Patrick Acham Chief Executive Officer & Director Philip E. Collins President & Proposed Director William Koenig CFO &Director Kelvin Bainey Country Manager (Trinidad) Timothy Gabriel Joint Venture Advisor Denesh Ramnarace Joint Venture Advisor Gary Weir Geoscience Advisor Trevor Wong-Chor Corporate Secretary Geoffrey Leid Director Gordon Harris Director Johannes Kingma Director
Source: Corporate website
81
5 November 2008 The Caribbean Report
Voyager Energy Ltd.
PRIVATE COMPANY NOT RATED
COMPANY SUMMARY: Voyager Energy Ltd. is a private oil and gas exploration and production company with operations in Canada and onshore Trinidad.
Energy – Oil and Gas, Exploration and Production
Recent news highlights October 16, 2008: Voyager Energy announced that it has entered into a strategic alliance with Niko Resources Ltd. Specifically, the strategic alliance will enable the company to pursue opportunities in the Caribbean region as well as in Ghana in South America.
Company highlights The company holds two onshore exploration rights to Trinidad’s Central Range Block. Voyager holds 181,262 acres in the Shallow Horizon Block and 211,475 acres in the Deep Horizon Block. A minimum work commitment includes 2D seismic, 3D seismic, and the drilling of three shallow wells and one deep exploration well. Total estimated costs are $42.5 million.
82
South American Offshore 5 November 2008
OPERATIONS
Central Range blocks
• The company completed negotiating a production-sharing contract with the Ministry of Energy and Energy Industries (MEEI) to acquire exploration rights in the Deep Horizon Block and Shallow Horizon Block in the Central Range Block. The company was awarded 211,475 acres in the Deep Horizon Block and 181,262 acres in the Shallow Horizon Block.
• Currently, the company is a joint venture partner with Petro Andina in the area. Petro Andina will earn a 50% working interest in exchange for carrying out $5.0 million worth of the seismic program costs and guaranteeing any restrictions according to the production-sharing contract.
• According to the contract, there is a minimum work commitment over four years that includes 100 kilometres of 2D seismic, 250 square kilometres of 3D seismic, the drilling of three shallow wells and one deep well. Additionally, the company paid a $5.5 million signing bonus to be awarded the contract. The total estimated costs of the work commitment are $42.5 million, of which Voyager will pay $16.5 million. The company’s total commitment costs are approximately $20.5 million.
• The company has the option to extend the minimum work commitment period through two optional phases, each consisting of one year. Abandoning 40% of the original area is required after the first phase of the exploration period. Additionally, the Petroleum Company of Trinidad and Tobago (Petrotin) has the right to participate for a 35% interest in the Shallow Horizon Block and a 20% interest in the Deep Horizon Block during any development of either of these blocks. According to the production-sharing contract, a profit-sharing system is in place for the sharing with MEEI on a sliding scale basis that is dependant upon commodity prices and production volumes.
• Up to 50% of oil and 60% of gas revenues are available for cost recovery, while profit petroleum is divided between the MEEI and the contractors. Dependant upon production volumes and commodity prices, the contractor can keep up to 75% of oil and 84% of gas revenues. The company will be taxed at 55.1% of net profits.
83
5 November 2008 The Caribbean Report
Figure 79: Voyager’s Central Range Block interests
Note: Corporate presentation
MANAGEMENT AND BOARD OF DIRECTORS Figure 80: Voyager’s management team and board of directors
Name Position Gerold U. Fong President & Chief Executive Officer Tony D. Pantalone Director, Executive Vice President, Exploration & Operations Geoffrey P. Bury Chief Financial Officer & Vice President, Finance Marshall Abbott Director Peter Salamon Director John Poetker Director
Source: Company reports
84
South American Offshore 5 November 2008
APPENDIX: IMPORTANT DISCLOSURES
Analyst Certification: Each authoring analyst of Canaccord Adams whose name appears on the front page of this investment research hereby certifies that (i) the recommendations and opinions expressed in this investment research accurately reflect the authoring analyst’s personal, independent and objective views about any and all of the designated investments or relevant issuers discussed herein that are within such authoring analyst’s coverage universe and (ii) no part of the authoring analyst’s compensation was, is, or will be, directly or indirectly, related to the specific recommendations or views expressed by the authoring analyst in the investment research.
Site Visit: An analyst has visited Canadian Superior Energy Inc.’s head office in Calgary, Alberta. No payment or
reimbursement was received from the issuer for the related travel costs. An analyst has visited CGX Energy Inc.'s material operations head office in Calgary, Alberta. No payment or reimbursement was received from the issuer for the related travel costs. An analyst has visited Challenger Energy Corp.'s material operations head office in Calgary, Alberta. No payment or reimbursement was received from the issuer for the related travel costs.
Distribution of Ratings: Global Stock Ratings (as of 4 November 2008)
BUY: The stock is expected to generate risk-adjusted returns of over 10% during the next 12 months. HOLD: The stock is expected to generate risk-adjusted returns of 0-10% during the next 12 months. SELL: The stock is expected to generate negative risk-adjusted returns during the next 12 months. NOT RATED: Canaccord Adams does not provide research coverage of the relevant issuer. “Risk-adjusted return” refers to the expected return in relation to the amount of risk associated with the designated investment or the relevant issuer.
Risk Qualifier: SPECULATIVE: Stocks bear significantly higher risk that typically cannot be valued by normal fundamental
criteria. Investments in the stock may result in material loss. Canaccord Adams Research Disclosures as of 5 November 2008 Company Disclosure Canadian Superior Energy Inc. 7 CGX Energy Inc. 1A, 2, 7 Challenger Energy Corp. 1A, 2, 7
1 The relevant issuer currently is, or in the past 12 months was, a client of Canaccord Adams or its affiliated
companies. During this period, Canaccord Adams or its affiliated companies provided the following services to the relevant issuer: A. investment banking services. B. non-investment banking securities-related services. C. non-securities related services.
2 In the past 12 months, Canaccord Adams or its affiliated companies have received compensation for Corporate Finance/Investment Banking services from the relevant issuer.
3 In the past 12 months, Canaccord Adams or any of its affiliated companies have been lead manager, co-lead manager or co-manager of a public offering of securities of the relevant issuer or any publicly disclosed offer of securities of the relevant issuer or in any related derivatives.
4 Canaccord Adams acts as corporate broker for the relevant issuer and/or Canaccord Adams or any of its affiliated companies may have an agreement with the relevant issuer relating to the provision of Corporate Finance/Investment Banking services.
5 Canaccord Adams or any of its affiliated companies is a market maker or liquidity provider in the securities of the relevant issuer or in any related derivatives.
6 In the past 12 months, Canaccord Adams, its partners, affiliated companies, officers or directors, or any authoring analyst involved in the preparation of this investment research has provided services to the relevant issuer for remuneration, other than normal course investment advisory or trade execution services.
7 Canaccord Adams intends to seek or expects to receive compensation for Corporate Finance/Investment Banking services from the relevant issuer in the next six months.
85
5 November 2008 The Caribbean Report
8 The authoring analyst, a member of the authoring analyst’s household, or any individual directly involved in the preparation of this investment research, has a long position in the shares or derivatives, or has any other financial interest in the relevant issuer, the value of which increases as the value of the underlying equity increases.
9 The authoring analyst, a member of the authoring analyst’s household, or any individual directly involved in the preparation of this investment research, has a short position in the shares or derivatives, or has any other financial interest in the relevant issuer, the value of which increases as the value of the underlying equity decreases.
10 Those persons identified as the author(s) of this investment research, or any individual involved in the preparation of this investment research, have purchased/received shares in the relevant issuer prior to a public offering of those shares, and such person’s name and details are disclosed above.
11 A partner, director, officer, employee or agent of Canaccord Adams and its affiliated companies, or a member of his/her household, is an officer, or director, or serves as an advisor or board member of the relevant issuer and/or one of its subsidiaries, and such person’s name is disclosed above.
12 As of the month end immediately preceding the date of publication of this investment research, or the prior month end if publication is within 10 days following a month end, Canaccord Adams or its affiliate companies, in the aggregate, beneficially owned 1% or more of any class of the total issued share capital or other common equity securities of the relevant issuer or held any other financial interests in the relevant issuer which are significant in relation to the investment research (as disclosed above).
13 As of the month end immediately preceding the date of publication of this investment research, or the prior month end if publication is within 10 days following a month end, the relevant issuer owned 1% or more of any class of the total issued share capital in Canaccord Adams or any of its affiliated companies.
14 Other specific disclosures as described above. Canaccord Adams is the business name used by certain subsidiaries of Canaccord Capital Inc., including
Canaccord Adams Inc., Canaccord Adams Limited, and Canaccord Adams, a division of Canaccord Capital Corporation. Clients of Canaccord Adams, in the past 12 months, may have been clients of Canaccord Capital Corporation, Canaccord Capital (Europe) Limited, Canaccord Capital Corporation USA Inc., and/or Adams Harkness Financial Group Ltd. The authoring analysts who are responsible for the preparation of this investment research are employed by Canaccord Adams, a securities broker-dealer with principal offices located in Vancouver, Calgary, Toronto, Montreal (all Canada), Boston, New York, San Francisco (all US) and London (UK). In the event that this is compendium investment research (covering six or more relevant issuers), Canaccord Adams and its affiliated companies may choose to provide specific disclosures of the subject companies by reference, as well as its policies and procedures regarding the dissemination of investment research. To access this material or for more information, please send a request to Canaccord Adams Research, Attn: Disclosures, P.O. Box 10337 Pacific Centre, 2200-609 Granville Street, Vancouver, BC, Canada V7Y 1H2 or [email protected]. The authoring analysts who are responsible for the preparation of this investment research have received (or will receive) compensation based upon (among other factors) the Corporate Finance/Investment Banking revenues and general profits of Canaccord Adams. However, such authoring analysts have not received, and will not receive, compensation that is directly based upon or linked to one or more specific Corporate Finance/Investment Banking activities, or to recommendations contained in the investment research. Canaccord Adams and its affiliated companies may have a Corporate Finance/Investment Banking or other relationship with the company that is the subject of this investment research and may trade in any of the designated investments mentioned herein either for their own account or the accounts of their customers, in good faith or in the normal course of market making. Accordingly, Canaccord Adams or their affiliated companies, principals or employees (other than the authoring analyst(s) who prepared this investment research) may at any time have a long or short position in any such designated investments, Related designated investments or in options, futures or other derivative instruments based thereon. Some regulators require that a firm must establish, implement and make available a policy for managing conflicts of interest arising as a result of publication or distribution of investment research. This investment research has been prepared in accordance with Canaccord Adams’ policy on managing conflicts of interest, and information barriers or firewalls have been used where appropriate. Canaccord Adams’ policy is available upon request. The information contained in this investment research has been compiled by Canaccord Adams from sources believed to be reliable, but (with the exception of the information about Canaccord Adams) no representation or warranty, express or implied, is made by Canaccord Adams, its affiliated companies or any other person as to its fairness, accuracy, completeness or correctness. Canaccord Adams has not independently verified the facts, assumptions, and estimates contained herein. All estimates, opinions and other information contained in this investment research constitute Canaccord Adams’ judgement as of the date of this investment research, are subject to change without notice and are provided in good faith but without legal responsibility or liability.
86
South American Offshore 5 November 2008
Canaccord Adams salespeople, traders, and other professionals may provide oral or written market commentary or trading strategies to our clients and our proprietary trading desk that reflect opinions that are contrary to the opinions expressed in this investment research. Canaccord Adams’ affiliates, proprietary trading desk, and investing businesses may make investment decisions that are inconsistent with the recommendations or views expressed in this investment research. This investment research is provided for information purposes only and does not constitute an offer or solicitation to buy or sell any designated investments discussed herein in any jurisdiction where such offer or solicitation would be prohibited. As a result, the designated investments discussed in this investment research may not be eligible for sale in some jurisdictions. This investment research is not, and under no circumstances should be construed as, a solicitation to act as a securities broker or dealer in any jurisdiction by any person or company that is not legally permitted to carry on the business of a securities broker or dealer in that jurisdiction. This material is prepared for general circulation to clients and does not have regard to the investment objectives, financial situation or particular needs of any particular person. Investors should obtain advice based on their own individual circumstances before making an investment decision. To the fullest extent permitted by law, none of Canaccord Adams, its affiliated companies or any other person accepts any liability whatsoever for any direct or consequential loss arising from or relating to any use of the information contained in this investment research.
For Canadian Residents: This Investment Research has been approved by Canaccord Adams, a division of Canaccord Capital
Corporation, which accepts responsibility for this Investment Research and its dissemination in Canada. Canadian clients wishing to effect transactions in any Designated Investment discussed should do so through a qualified salesperson of Canaccord Adams, a division of Canaccord Capital Corporation in their particular jurisdiction.
For United Kingdom Residents:
This investment research complies with the Financial Services Authority’s Handbook chapter on Conduct of Business and is approved by Canaccord Adams Limited, which is authorized and regulated by the Financial Services Authority, in connection with its distribution in the United Kingdom. This material is not for distribution in the United Kingdom to retail clients, as defined under the rules of the Financial Services Authority. Canaccord Adams Limited accepts responsibility for this investment research and its dissemination in the United Kingdom. The information contained in this investment research is only intended for distribution in the UK to persons who qualify as professional clients or eligible counterparties, as defined under the rules of the Financial Services Authority.
For United States Residents:
Canaccord Adams Inc., a US registered broker-dealer, accepts responsibility for this Investment Research and its dissemination in the United States. This Investment Research is intended for distribution in the United States only to certain US institutional investors. US clients wishing to effect transactions in any Designated Investment discussed should do so through a qualified salesperson of Canaccord Adams Inc.
For European Residents: If this Investment Research is intended for disclosure in any jurisdiction other than the United Kingdom, the
US or Canada, then the relevant rules and regulatory requirements of that jurisdiction will apply. Additional information is available on request.