64
PHASE 1 PROGRAM DOCUMENT SOUTH ASIA REGIONAL TRAINING & TECHNICAL ASSISTANCE CENTER (SARTTAC) February 2017 I N T E R N A T I O N A L M O N E T A R Y F U N D
PHASE 1 PROGRAM DOCUMENT
SOUTH ASIA REGIONAL TRAINING & TECHNICAL ASSISTANCE CENTER(SARTTAC)
February 2017
I N T E R N A T I O N A L M O N E T A R Y F U N D

1
SOUTH ASIA REGIONAL TRAINING AND TECHNICAL
ASSISTANCE CENTER (SARTTAC)
PROGRAM DOCUMENT
(January 2017)

2
SARTTAC is an IMF initiative supported by the following member countries and partners:

3
I. ______________ REGIONAL TRAINING AND TECHNICAL ASSISTANCE CENTER IN SOUTH
ASIA __________ 7
A. An Integrated Approach to Capacity Development ________________________________ 7
B. The SARTTAC Vision ________________________________________________________________ 8
C. How Will SARTTAC be Organized to Attain the Vision? ___________________________ 10
II. _____________ HOW WILL SARTTAC HELP ADDRESS THE REGION’S MACROECONOMIC
AND FINANCIAL CHALLENGES? 12
A. Challenges Facing the SARTTAC Region __________________________________________ 12
B. Priority Areas for the Next Decade ________________________________________________ 16
III. ____________ SARTTAC’S OBJECTIVES BY TOPIC AREA 20
A. Fiscal Issues ________________________________________________________________________ 21
B. Monetary and Financial Issues _____________________________________________________ 27
C. Macroeconomic Statistics __________________________________________________________ 32
D. General Macroeconomic and Financial Training __________________________________ 34
IV. ____________ HOW WILL THE IMF ENSURE SARTTAC’S SUCCESS? 35
A. Integration of SARTTAC CD with Other IMF CD and Activities ____________________ 35
B. Integration and Synergies with Other CD Providers ______________________________ 37
C. Measuring How SARTTAC Achieves its Objectives ________________________________ 38
D. Evaluation of IMF CD _______________________________________________________________ 39
V. _____________ SARTTAC GOVERNANCE, OPERATIONS, AND FINANCIAL MANAGEMENT 40
A. Governance ________________________________________________________________________ 40
B. Operations _________________________________________________________________________ 41
C. Outreach and Visibility _____________________________________________________________ 44
D. Financial Management _____________________________________________________________ 44
E. Resource Needs ____________________________________________________________________ 45
F. Sustainability and Main Risks to the Program _____________________________________ 47
APPENDICES
I: Strategic Log frame ________________________________________________________________ 49
II: Country Background and Expected CD needs _____________________________________ 50
III: Selected Macroeconomic Indicators, 2010 – 2020 ________________________________ 58
IV: List of Development Partners and Other CD Providers ___________________________ 60
V: List of Development Partners and Other CD Providers ____________________________ 61
Table of Contents
4
List of Acronyms
AGAOA Association of Government Accounting Organizations of Asia
AML-CFT Anti-Money Laundering and Combating the Financing of Terrorism
APD IMF Asia and Pacific Department
ADB Asian Development Bank
BACS Budget and Accounting Classification System
BB Bangladesh Bank
BOP Balance of Payments
CB Central Bank
CBSL Central Bank of Sri Lanka
CD Capacity Development
CDIS Coordinated Direct Investment Survey
COFOG Classification of the Functions of Government
CPC Ceylon Petroleum Corporation
CPI Consumer Price Index
CPIA Country Policy and Institutional Assessment
DAC Development Assistance Committee
DMF II Debt Management Facility II
DSGE Dynamic Stochastic General Equilibrium
ECF Extended Credit Facility
EM Emerging Market
ESCAP Economic and Social Commission for Asia and Pacific
ESS External Sector Statistics
FAD IMF Fiscal Affairs Department
FAF Fiscal Analysis and Forecasting
FDI Foreign Direct Investment
FIRST Financial Sector Reform Strengthening Initiative
FPP Financial Programming and Policies
FSAP Financial Sector Assessment Program
FSI Financial Soundness Indicators
FSLC Financial Sector Liaison Committee
FX Foreign Exchange
FY IMF Fiscal Year
FYP Five-Year Plan
GDDS General Data Dissemination System
GDI G20 Data Gaps Initiative
GDP Gross Domestic Product
GFS Government Finance Statistics
GFSM Government Finance Statistics Manual
GMRA Global Master Repurchase Agreement
GNI Gross National Income
GST Goods and Services Tax
HFI High-Frequency Indicators
HQ IMF Headquarters
ICD IMF Institute for Capacity Development
IFC International Finance Corporation
5
IFMIS Integrated Financial Management Systems
IFRS International Financial Reporting Standards
IMF International Monetary Fund
IRD Inland Revenue Department
IsDB Islamic Development Bank
ISWGNA Inter-Secretariat Working Group on National Accounts
IT Information Technology
JSA Japan Administered Account for Selected IMF Activities
LCR Liquidity Coverage Ratio
LEG IMF Legal Department
MCM IMF Monetary and Capital Markets Department
MFP Macroeconomic Management and Fiscal Policy
MFS Monetary and Financial Statistics
MIRA Maldives Inland Revenue Authority
MNRW Managing Natural Resource Wealth
MPA Monetary Policy Analysis
MTEF Medium-term Expenditure Framework
MTFF Medium-term Fiscal Framework
NIPFP National Institute of Public Finance and Policy
NRS Nepal Rastra Bank
NSFR Net Stable Funding Ratio
OECD Organization for Economic Co-operation and Development
PEFA Public Expenditure and Financial Accountability
PFM Public Financial Management
PPI Producer Price Index
PPP Purchasing Power Parity
PRSPs Poverty Reduction Strategy Papers
QEDS Quarterly External Debt Statistics
QNA Quarterly National Accounts
RBI Reserve Bank of India
RBM Results-based Management
RBS Risk-based Supervision
REER Real Effective Exchange Rate
RES IMF Research Department
RMA Royal Monetary Authority
RSN Regional Strategy Note
RTAC Regional Technical Assistance Center
RTC Regional Training Center
SAARC South Asia Association for Regional Cooperation
SARTTAC South Asia Regional Capacity Development Center
SC Steering Committee
SDDS Special Data Dissemination Standard
SDGs Sustainable Development Goals
SEZ Special Economic Zones
SOCB State-Owned Commercial Bank
SOE State-Owned Enterprise
6
SRF Standardized Report Form
STA IMF Statistics Department
STI Singapore Regional Training Institute
SUT Supply-Use Table
TA Technical Assistance
TADAT Tax Administration Diagnostic Assessment Tool
TAOLAM Technical Assistance Office for the Lao PDR and the Republic of the Union
of Myanmar
TARC Tax Administration Reform Commission
TPA Tax Policy and Administration
TSA Treasury Single Account
TTF Topical Trust Fund
UFR Use of Fund Resources
UN United Nations
UNDP United Nations Development Programme
VAT Value Added Tax

7
A. An Integrated Approach to Capacity Development
1. This document describes the plan to establish the South Asia Regional Training
and Technical Assistance Center (SARTTAC) in New Delhi, India. The Center—a
collaborative venture between the IMF, the member countries, and development partners—is
geared toward supporting the capacity development (CD) needs of six countries: Bangladesh,
Bhutan, India, Maldives, Nepal, and Sri Lanka.1 SARTTAC’s strategic goal is to assist
member countries to build strong institutions and boost skills to design and implement sound
economic policies that promote growth and reduce poverty. SARTTAC operations will focus
on training and technical assistance (TA) in the IMF’s core areas of expertise, including
macroeconomic and financial policies; fiscal management and policies; monetary policy and
operations; financial sector regulation and supervision; and real sector statistics. The IMF is
one of the few organizations that deliver CD services in-house, stands by these services and
exercises rigorous quality control.
2. From its inception, SARTTAC will be a fully-integrated capacity development
center. By bringing together under one roof the two building blocks of CD—training and
TA—the new center will be positioned to exploit synergies, ensure that all CD activities
reflect country priorities, facilitate discussions with development partners, and benefit from
locational economies of scale. Well-coordinated training by the IMF’s departments will
promote the implementation of TA advice by providing analytical skills and supporting
institutional buy-in. SARTTAC will also selectively cater to the capacity building needs at
the subnational (state) level, especially in India.
3. The SARTTAC initiative supports core sustainable development goals (SDGs) in
the context of the Post-2015 Agenda. It comes on the heels of the Financing for
Development (FfD) conference in Addis Ababa and the SDG Conference in New York. The
FfD conference culminated in a multilateral consensus to promote domestic resource
mobilization, infrastructure development, income equity and inclusive growth, and to support
fragile and conflict-affected states.
4. SARTTAC will provide important opportunities for outreach to enhance the
effectiveness of capacity development work in South Asia. Engagement with a wider
community of stakeholders (academia, civil society, the media, development partners, donor
partners and parliamentarians) will inform thinking and foster understanding of the capacity
building activities. Outreach also serves to communicate that member countries’ and
1 Potentially, additional member countries could join SARTTAC at a later stage.
I.REGIONAL TRAINING AND TECHNICAL ASSISTANCE CENTER IN SOUTH ASIA

8
development partners’ contributions are used effectively, while giving them due recognition
for their support.
B. The SARTTAC Vision
5. SARTTAC will assist member countries in their efforts to strengthen
institutional and human capacities to sustain strong economic performance and build
resilience. SARTTAC will build upon the IMF’s in-depth experience in delivering CD on a
regional basis by combining the virtues of the IMF’s Regional Technical Assistance Centers
(RTACs) and Regional Training Centers (RTCs).2 The centers have a proven track record of
delivering well-targeted, efficient, and responsive IMF TA and training. Regional approach
to TA delivery fosters ownership by member countries, provides a tailored approach to local
circumstances and absorptive capacity, and allows for close follow-up on TA
implementation. Regional delivery of training is cost-effective and focused on the specific
needs of member countries. A center in South Asia will facilitate regional peer-to-peer
exchanges and foster the development of cross-country networks of member country officials
in the South Asia Association for Regional Cooperation (SAARC) region.3 The regional
approach will also promote close coordination with development partners and enhances the
ability to respond quickly to emerging needs.
IMF Global Capacity Development Footprint
2 The IMF currently maintains a network of nine Regional Technical Assistance Centers (RTACs) in Africa (5);
the Caribbean; Central America; the Middle East; and the Pacific that support capacity- and institution building;
together with four Regional Training Centers (RTCs) that offer macroeconomic training to country officials. 3 SAARC includes the six SARTTAC member countries plus Afghanistan and Pakistan.
9
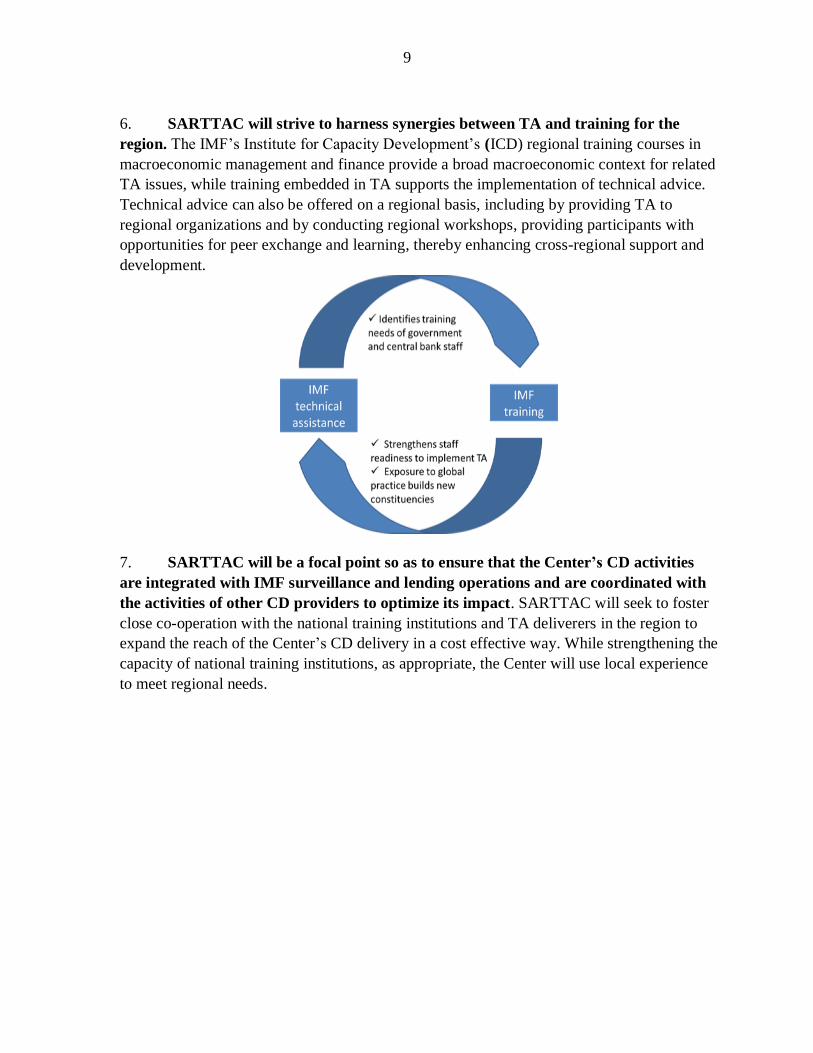
6. SARTTAC will strive to harness synergies between TA and training for the
region. The IMF’s Institute for Capacity Development’s (ICD) regional training courses in
macroeconomic management and finance provide a broad macroeconomic context for related
TA issues, while training embedded in TA supports the implementation of technical advice.
Technical advice can also be offered on a regional basis, including by providing TA to
regional organizations and by conducting regional workshops, providing participants with
opportunities for peer exchange and learning, thereby enhancing cross-regional support and
development.
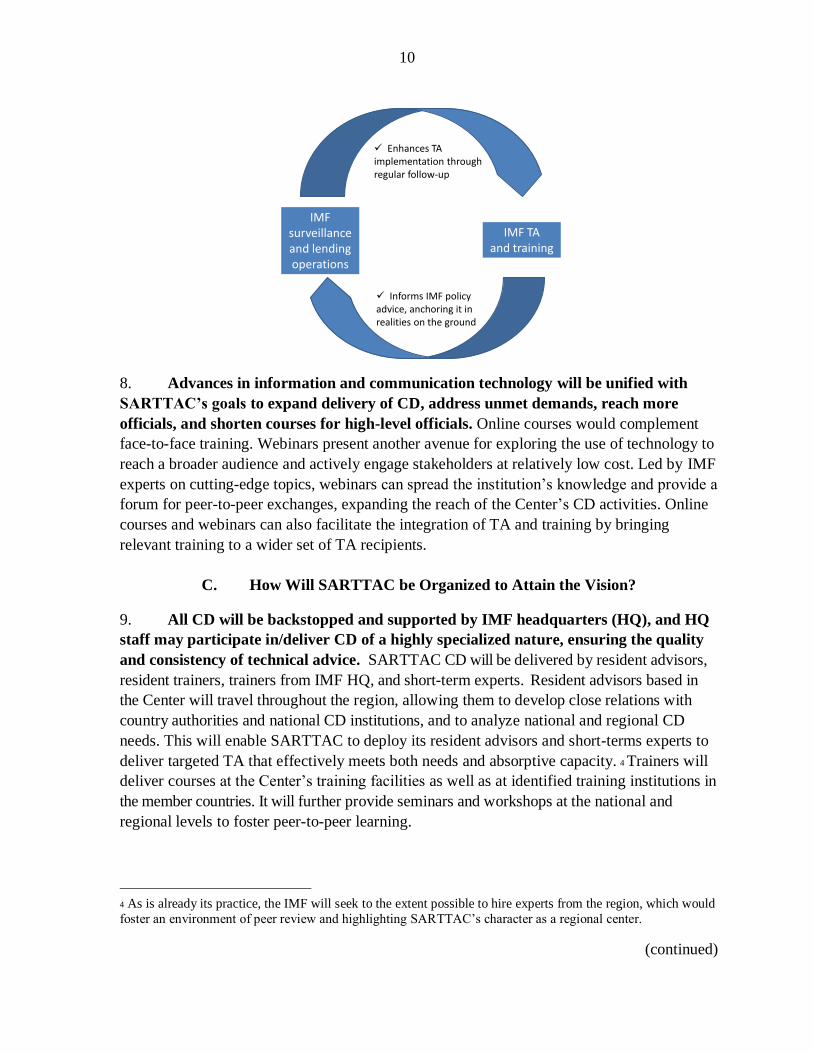
7. SARTTAC will be a focal point so as to ensure that the Center’s CD activities
are integrated with IMF surveillance and lending operations and are coordinated with
the activities of other CD providers to optimize its impact. SARTTAC will seek to foster
close co-operation with the national training institutions and TA deliverers in the region to
expand the reach of the Center’s CD delivery in a cost effective way. While strengthening the
capacity of national training institutions, as appropriate, the Center will use local experience
to meet regional needs.
10
8. Advances in information and communication technology will be unified with
SARTTAC’s goals to expand delivery of CD, address unmet demands, reach more
officials, and shorten courses for high-level officials. Online courses would complement
face-to-face training. Webinars present another avenue for exploring the use of technology to
reach a broader audience and actively engage stakeholders at relatively low cost. Led by IMF
experts on cutting-edge topics, webinars can spread the institution’s knowledge and provide a
forum for peer-to-peer exchanges, expanding the reach of the Center’s CD activities. Online
courses and webinars can also facilitate the integration of TA and training by bringing
relevant training to a wider set of TA recipients.
C. How Will SARTTAC be Organized to Attain the Vision?
9. All CD will be backstopped and supported by IMF headquarters (HQ), and HQ
staff may participate in/deliver CD of a highly specialized nature, ensuring the quality
and consistency of technical advice. SARTTAC CD will be delivered by resident advisors,
resident trainers, trainers from IMF HQ, and short-term experts. Resident advisors based in
the Center will travel throughout the region, allowing them to develop close relations with
country authorities and national CD institutions, and to analyze national and regional CD
needs. This will enable SARTTAC to deploy its resident advisors and short-terms experts to
deliver targeted TA that effectively meets both needs and absorptive capacity. 4 Trainers will
deliver courses at the Center’s training facilities as well as at identified training institutions in
the member countries. It will further provide seminars and workshops at the national and
regional levels to foster peer-to-peer learning.
4 As is already its practice, the IMF will seek to the extent possible to hire experts from the region, which would
foster an environment of peer review and highlighting SARTTAC’s character as a regional center.
(continued)
IMF surveillance and lending operations
IMF TA and training
✓ Enhances TA implementation through regular follow-up
✓ Informs IMF policy advice, anchoring it in realities on the ground

11
10. The establishment of SARTTAC will permit the IMF to deliver training that
directly fits the needs of its member countries. As a fully-integrated CD center, training is
envisaged to dove-tail with the TA provided to the member countries. A large part of the
training will be directly related to the TA being given to the constituent countries and be
delivered by IMF departments.5 At the same time, somewhat broader courses will be
provided at the Center aimed at improving officials’ understanding of the macroeconomic
context and the frameworks that underpin the related TA areas.
11. SARTTAC will be a joint undertaking between the IMF, the member countries,
development partners, and other CD providers. The Center will be financed by
contributions from development partners and member countries.6 The Center’s activities will
be closely coordinated with development partners, members, and the IMF. Close
collaboration on the ground will facilitate coordinated design, implementation, and
monitoring of ongoing CD programs in the region. Strategic CD advice from IMF
headquarters will be combined with the Center’s technical and implementation advice,
regional expertise, and national capacity-building institutions.
12. SARTTAC will be managed by a Center Director—an experienced IMF staff
member—and guided by a Steering Committee (SC). The SC will consist of
representatives from member countries, donor partners, other CD providers, and the IMF.
The SC will ensure that SARTTAC work plans reflect the needs of the region and are well
coordinated with the activities of other CD providers, including national institutions. The
Director will oversee the day-to-day operations of the Center and help in setting its broad
strategy, in consultation with the member countries and the IMF’s CD departments, including
through the preparation of annual work plans for consideration by the SC.
5 For instance, FAD would provide training on PFM; MCM would provide training on debt management and
banking supervision; and STA would provide training on real sector and GFS issues (including benefitting
subnational governments).
6 The IMF does not charge member countries for delivery of CD services, but member countries can make
voluntary contributions to finance CD services they receive from the IMF.
(continued)

12
A. Challenges Facing the SARTTAC Region
13. South Asia is home to some of the fastest growing economies in the world.7
Helped by strong growth in India (which accounts for about 90 percent of regional gross
domestic product (GDP) on a purchasing power parity (PPP) basis), South Asian growth
since the global crisis has been impressive. Bangladesh, Bhutan, India and Sri Lanka have
experienced average growth rates between 4-7½ percent in recent years, supported by
resilient domestic demand and, for the most part, steady export growth. Growth rates in
Maldives and Nepal have been slower than those of the above four countries in recent years,
influenced by fluctuations in tourist flows; food export revenue; and remittances.
Improvements to policy frameworks and steady implementation of product, labor, and
financial market reforms have broadly translated into rising living standards, lower rates of
poverty, and greater integration with the global economy over the past two decades.
14. Nevertheless, South Asia is also home to a substantial share of the world’s
poorest citizens, and institutional challenges mean that growth and poverty reduction are
vulnerable. Although the share of people in South Asia living on less than US$1.90/day fell
from 51 percent in 1990 to 19 percent in 20128, 34 percent of the world’s poor live in South
Asia – more than in Sub-Saharan Africa. Demographic trends favor robust growth, as South
Asian populations continue to expand, at an average of one percent per year. But young
7 Appendix II reviews the recent economic performance of each of the six SARTTAC countries (Bangladesh,
Bhutan, India, Maldives, Nepal, and Sri Lanka).
8 Source: Global Monitoring Report 2015/2016, World Bank Group
(http://pubdocs.worldbank.org/pubdocs/publicdoc/2015/10/503001444058224597/Global-Monitoring-Report-
2015.pdf)
0
1
2
3
4
5
6
7
8
South
Asi
a
South
Asi
aexc
l. In
dia
Em
erg
ing
Mark
ets
World
2015
2016
2017
Real GDP Growth(In percent, YoY)
Source: IMF, World Economic Outlook; and IMF staff estimates.
II. HOW WILL SARTTAC HELP ADDRESS THE REGION’S MACROECONOMIC AND FINANCIAL
CHALLENGES?

13
populations also pose a challenge, in that education and job creation are needed to capture the
“demographic dividend”.
South Asia: Human Development Index components
Source: UNDP (https://data.undp.org/dataset/Table-1-Human-Development-Index-and-its-components/myer-
egms)
15. SARTTAC countries span a range of income levels, but have several
characteristics in common. At one end, Maldives has a nominal income per capita of
around US$8900 (2015), while at the other end, Nepal’s income per capita is just above US$
700 (also 2015). Despite this variation in income, wider socio-economic indicators such as
the UN’s Human Development Index indicate that the countries are at broadly similar levels
– almost all SARTTAC countries are ranked above 100 (out of 187), with the exception of
Sri Lanka (ranked 73). Gini coefficients for all countries are in the range of 30-40 percent.
Economic structures are more heavily weighted toward the primary and tertiary sectors, with
the secondary sector share of GDP for SARTTAC countries generally in the range of 15-30
percent.
0
20
40
60
80
100
120
140
160
180
Bangladesh Bhutan India Maldives Nepal Sri Lanka
Sources: United Nation Development Programme
Note: Data as of 2014.
Human Development Indicator Rank
62
64
66
68
70
72
74
76
78
Bangladesh Bhutan India Maldives Nepal Sri Lanka
Life Expectancy at Birth(In years)
Sources: United Nation Development Programme.
Note: Data as of 2014.
0
2
4
6
8
10
12
Bangladesh Bhutan India Maldives Nepal Sri Lanka
Men Years of Schooling(In years)
Sources: United Nation Development Programme.
Note: Data as of 2014 or latest available.
0
2,000
4,000
6,000
8,000
10,000
12,000
14,000
Bangladesh Bhutan India Maldives Nepal Sri Lanka
GNI per Capita(In 2011 PPP U.S. Dollar)
Sources: United Nation Development Programme.
Note: Data as of 2014.

14
16. Despite healthy growth rates, inflation has generally been on the high side in
SARTTAC countries. Consumer Price Index (CPI) inflation has averaged over 6 percent in
recent years, with notably high levels in Bangladesh, India, and Nepal. The persistence of
high inflation reflects underlying supply bottlenecks, infrastructure gaps, weak control on
public expenditures, product and labor market rigidities that prevent resources from being
deployed optimally across sectors in response to demand-supply imbalances.
17. Overall fiscal balances point to incipient vulnerabilities in public finances in
several SARTTAC countries. Over the past five years, with the exception of Nepal (prior to
the devastating earthquakes in 2015), countries in the region have posted weak fiscal results.
Several countries have in place medium-term fiscal responsibility and budget management
frameworks, but slippages have occurred due to untargeted subsidies and weaker than
anticipated revenue growth.
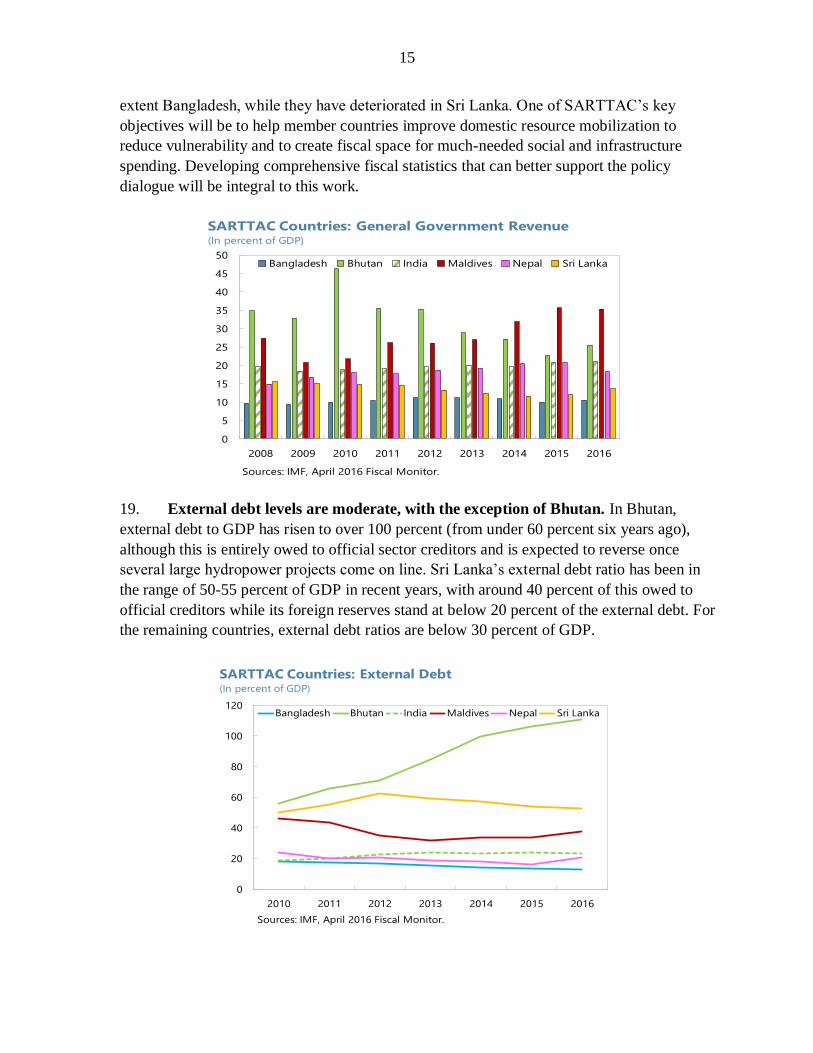
18. Weak general government revenue is a major challenge in South Asia. Most of
the countries in this region have very narrow revenue bases, and often rely greatly on trade-
related taxes. Revenue-to-GDP ratios have risen modestly in India, Nepal, and to a lesser
-20
-15
-10
-5
0
5
2010 2011 2012 2013 2014 2015 2016
Bangladesh Bhutan India Maldives Nepal Sri Lanka
SARTTAC Countries: Overall Fiscal Balance (In percent of GDP)
Source: IMF, April 2016 Fiscal Monitor.
0
2
4
6
8
10
12
14
2010 2011 2012 2013 2014 2015 2016
Bangladesh Bhutan India Nepal Maldives Sri Lanka
SARTTAC Countries: Inflation(In year-on-year percentage change)
Sources: IMF, World Economic Outlook.
0
2
4
6
8
10
12
2010 2011 2012 2013 2014 2015 2016
Bangladesh Bhutan India Nepal Maldives Sri Lanka
SARTTAC Countries: Real GDP Growth(In percent)
Sources: IMF, World Economic Outlook.
15
extent Bangladesh, while they have deteriorated in Sri Lanka. One of SARTTAC’s key
objectives will be to help member countries improve domestic resource mobilization to
reduce vulnerability and to create fiscal space for much-needed social and infrastructure
spending. Developing comprehensive fiscal statistics that can better support the policy
dialogue will be integral to this work.
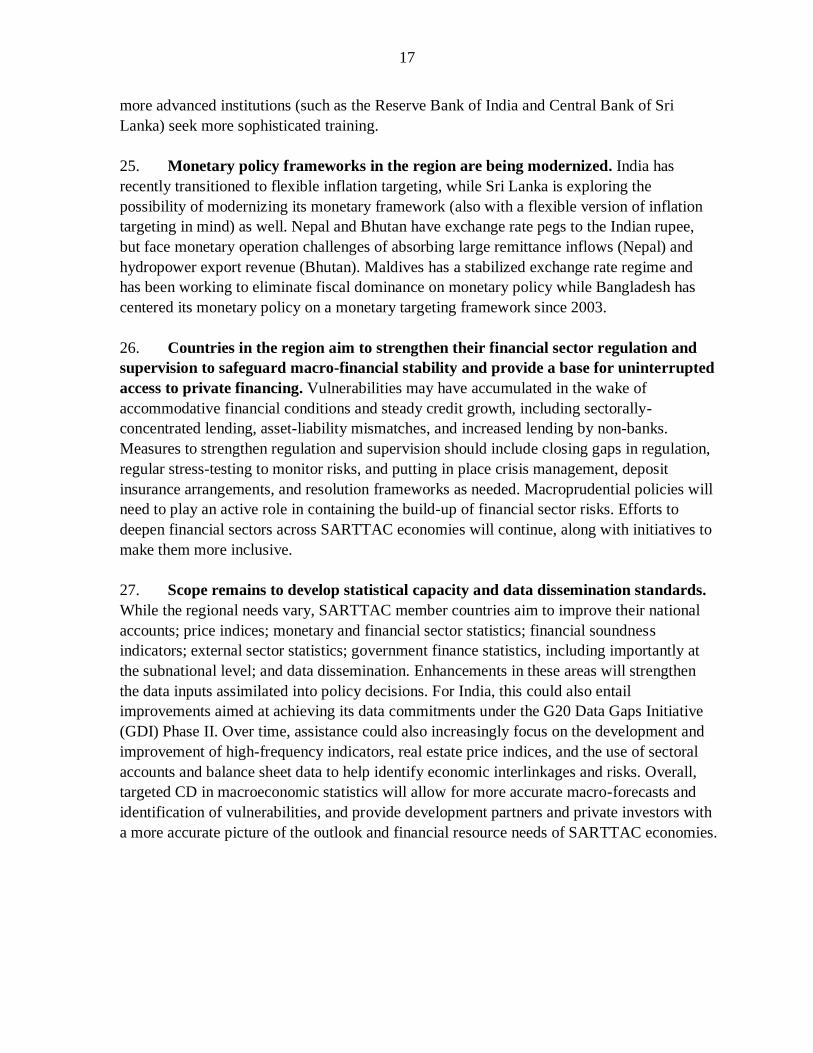
19. External debt levels are moderate, with the exception of Bhutan. In Bhutan,
external debt to GDP has risen to over 100 percent (from under 60 percent six years ago),
although this is entirely owed to official sector creditors and is expected to reverse once
several large hydropower projects come on line. Sri Lanka’s external debt ratio has been in
the range of 50-55 percent of GDP in recent years, with around 40 percent of this owed to
official creditors while its foreign reserves stand at below 20 percent of the external debt. For
the remaining countries, external debt ratios are below 30 percent of GDP.
0
5
10
15
20
25
30
35
40
45
50
2008 2009 2010 2011 2012 2013 2014 2015 2016
Bangladesh Bhutan India Maldives Nepal Sri Lanka
SARTTAC Countries: General Government Revenue(In percent of GDP)
Sources: IMF, April 2016 Fiscal Monitor.
0
20
40
60
80
100
120
2010 2011 2012 2013 2014 2015 2016
Bangladesh Bhutan India Maldives Nepal Sri Lanka
SARTTAC Countries: External Debt(In percent of GDP)
Sources: IMF, April 2016 Fiscal Monitor.

16
B. Priority Areas for the Next Decade
20. As the international community adopts a new set of Sustainable Development
Goals, it is timely to take stock of some of the priority action areas for the South Asia
region. The six countries in the region have made significant progress in reducing poverty
and improving macroeconomic performance. But consolidating these gains requires
important policy decisions and CD measures over the next decade, underpinned by strong
country ownership. While by no means exhaustive – and recognizing that this list will evolve
over the next few years – the action areas discussed here provide a broad snapshot of the
region’s current needs.
21. A sound macroeconomic policy environment and robust institutional framework
are critical for sustainable growth. Furthermore, rising macroeconomic and financial
cross-border spillover risks call for building macroeconomic and financial resilience. Parts of
South Asia are vulnerable to climate events and natural disasters, requiring adequate policy
responses. For example, Nepal, which was severely hit by a strong earthquake in 2015,
remains fragile with relatively weak institutions, while it was removed from IDA’s list of
fragile states effective July 2014 (FY2015).
22. In order to build resilience and sustain strong economic performance,
SARTTAC countries are keen to:
• Enhance mobilization of domestic fiscal resources and use available resources
effectively to fill infrastructure gaps and provide adequate social services; strengthen
the medium-term budget frameworks, expenditure allocation, cash and debt
management, and management of fiscal risk;
• Strengthen supervisory capacity and regulation of the financial system, and their
monetary policy framework and operations to protect macro-financial and
macroeconomic stability and support access to private financing;
• Build statistical capacity as a sound basis for informed macroeconomic policy
decision-making.
23. Developing and maintaining capacity to mobilize and effectively use domestic
fiscal resources require stronger revenue administration and public financial
management (PFM) systems. Stronger fiscal capacity will facilitate the efficient use of
public resources and reassure taxpayers, development partners, and creditors that funds are
being deployed effectively and that public finances are sustainable over the medium term.
24. Institution building through training of public administrators is a top priority in
a region as young as South Asia. About 60 percent of the population in SARTTAC
countries is under the age of 30. Macroeconomic training of incoming government officials is
frequently insufficient to the demands of complex modern economic management. South
Asian countries have voiced strong demand for basic courses in the IMF curriculum; even as
17
more advanced institutions (such as the Reserve Bank of India and Central Bank of Sri
Lanka) seek more sophisticated training.
25. Monetary policy frameworks in the region are being modernized. India has
recently transitioned to flexible inflation targeting, while Sri Lanka is exploring the
possibility of modernizing its monetary framework (also with a flexible version of inflation
targeting in mind) as well. Nepal and Bhutan have exchange rate pegs to the Indian rupee,
but face monetary operation challenges of absorbing large remittance inflows (Nepal) and
hydropower export revenue (Bhutan). Maldives has a stabilized exchange rate regime and
has been working to eliminate fiscal dominance on monetary policy while Bangladesh has
centered its monetary policy on a monetary targeting framework since 2003.
26. Countries in the region aim to strengthen their financial sector regulation and
supervision to safeguard macro-financial stability and provide a base for uninterrupted
access to private financing. Vulnerabilities may have accumulated in the wake of
accommodative financial conditions and steady credit growth, including sectorally-
concentrated lending, asset-liability mismatches, and increased lending by non-banks.
Measures to strengthen regulation and supervision should include closing gaps in regulation,
regular stress-testing to monitor risks, and putting in place crisis management, deposit
insurance arrangements, and resolution frameworks as needed. Macroprudential policies will
need to play an active role in containing the build-up of financial sector risks. Efforts to
deepen financial sectors across SARTTAC economies will continue, along with initiatives to
make them more inclusive.
27. Scope remains to develop statistical capacity and data dissemination standards.
While the regional needs vary, SARTTAC member countries aim to improve their national
accounts; price indices; monetary and financial sector statistics; financial soundness
indicators; external sector statistics; government finance statistics, including importantly at
the subnational level; and data dissemination. Enhancements in these areas will strengthen
the data inputs assimilated into policy decisions. For India, this could also entail
improvements aimed at achieving its data commitments under the G20 Data Gaps Initiative
(GDI) Phase II. Over time, assistance could also increasingly focus on the development and
improvement of high-frequency indicators, real estate price indices, and the use of sectoral
accounts and balance sheet data to help identify economic interlinkages and risks. Overall,
targeted CD in macroeconomic statistics will allow for more accurate macro-forecasts and
identification of vulnerabilities, and provide development partners and private investors with
a more accurate picture of the outlook and financial resource needs of SARTTAC economies.

18
South Asia: Selected Economic Indicators (as of October 2016)
28. As the international community adopts a new set of Sustainable Development
Goals, it is timely to take stock of some of the priority action areas for the South Asia
region. The six countries in the region have made significant progress in reducing poverty
and improving macroeconomic performance. But consolidating these gains requires
important policy decisions and CD measures over the next decade, underpinned by strong
country ownership. While by no means exhaustive – and recognizing that this list will evolve
over the next few years – the action areas discussed here provide a broad snapshot of the
region’s current needs.
Average
2001-10 2011 2012 2013 2014 2015 2016 2017 2018
Real GDP Growth 7.3 6.7 5.7 6.5 7.1 7.4 7.5 7.5 7.5
(Annual change; percent)
Bangladesh 5.8 6.5 6.3 6.0 6.3 6.8 6.9 6.9 7.0
Bhutan 8.4 9.7 6.4 3.6 3.8 5.2 6.0 6.4 11.3
India 7.6 6.6 5.6 6.6 7.2 7.6 7.6 7.6 7.7
Maldives 8.5 8.7 2.5 4.7 6.5 1.5 3.0 4.1 4.7
Nepal 4.0 3.4 4.8 4.1 6.0 2.7 0.6 4.0 3.8
Sri Lanka 4.8 8.4 9.1 3.4 4.9 4.8 5.0 5.0 5.0
Consumer Price Inflation 6.3 9.6 9.6 9.2 6.0 4.9 5.6 5.3 5.4(Year average; percent)
Bangladesh 6.3 11.5 6.2 7.5 7.0 6.4 6.7 6.9 6.6
Bhutan 4.6 7.3 9.3 11.3 9.9 6.3 4.4 4.6 5.1
India 6.1 9.5 9.9 9.4 5.9 4.9 5.5 5.2 5.3
Maldives 4.1 11.3 10.9 4.0 2.5 1.4 2.1 2.6 3.5
Nepal 6.2 9.6 8.3 9.9 9.0 7.2 10.0 9.9 8.0
Sri Lanka 11.1 6.7 7.5 6.9 3.3 0.9 4.1 5.3 5.1
General Gov. Overall Fiscal Balance -7.9 -7.8 -7.1 -7.2 -6.9 -6.7 -6.4 -6.4 -6.0
(Percent of GDP)
Bangladesh1 -2.9 -3.6 -3.0 -3.4 -3.1 -3.9 -4.3 -4.7 -4.2
Bhutan -2.2 -1.7 -2.4 -5.8 2.9 -0.2 -0.7 -2.5 -0.5
India -8.4 -8.2 -7.5 -7.6 -7.3 -6.9 -6.7 -6.6 -6.2
Maldives -7.5 -7.7 -7.9 -7.8 -9.4 -8.7 -13.7 -18.4 -19.1
Nepal -1.6 -1.3 -1.4 1.5 0.8 -0.7 0.6 -2.5 -2.2
Sri Lanka1-6.9 -6.2 -5.6 -5.2 -6.2 -7.0 -5.4 -4.7 -3.9
Current Account Balance -0.7 -4.1 -4.4 -1.6 -1.2 -1.0 -1.3 -2.0 -2.2
(Percent of GDP)
Bangladesh 0.5 -1.0 0.7 1.2 0.9 0.7 -0.1 -0.7 -1.1
Bhutan -13.1 -29.8 -21.5 -25.4 -26.4 -28.8 -27.8 -31.5 -20.7
India -0.8 -4.3 -4.8 -1.7 -1.3 -1.1 -1.4 -2.0 -2.2
Maldives -13.3 -16.5 -7.3 -4.5 -3.9 -9.5 -11.9 -14.1 -16.8
Nepal 2.5 -1.0 4.8 3.3 4.5 5.0 3.9 -0.9 -3.2
Sri Lanka -2.7 -7.1 -5.8 -3.4 -2.5 -2.5 -1.6 -3.0 -3.2
Sources: IMF, World Economic Outlook ; national monetary authorities; and IMF staff estimates and projections.1Central government.
Projections
Notes: Regional aggregates w eighted by PPP GDP. Variables reported on a f iscal year basis for India (April/March), Bhutan (July/June), Nepal
(August/July). Sri Lanka real GDP grow th numbers reflect projections based on the revised (2010 base) national accounts data published by the
authorities.

19
29. A sound macroeconomic policy environment and robust institutional framework
are critical for sustainable growth. Furthermore, rising macroeconomic and financial
cross-border spillover risks call for building macroeconomic and financial resilience. Parts of
South Asia are vulnerable to climate events and natural disasters, requiring adequate policy
responses. For example, Nepal, which was severely hit by a strong earthquake in 2015,
remains fragile with relatively weak institutions, while it was removed from IDA’s list of
fragile states effective July 2014 (FY2015).
30. In order to build resilience and sustain strong economic performance,
SARTTAC countries are keen to:
• Enhance mobilization of domestic fiscal resources and use available resources
effectively to fill infrastructure gaps and provide adequate social services; strengthen
the medium-term budget frameworks, expenditure allocation, cash and debt
management, and management of fiscal risk;
• Strengthen supervisory capacity and regulation of the financial system, and their
monetary policy framework and operations to protect macro-financial and
macroeconomic stability and support access to private financing;
• Build statistical capacity as a sound basis for informed macroeconomic policy
decision-making.
31. Developing and maintaining capacity to mobilize and effectively use domestic
fiscal resources require stronger revenue administration and public financial
management (PFM) systems. Stronger fiscal capacity will facilitate the efficient use of
public resources and reassure taxpayers, development partners, and creditors that funds are
being deployed effectively and that public finances are sustainable over the medium term.
32. Institution building through training of public administrators is a top priority in
a region as young as South Asia. About 60 percent of the population in SARTTAC
countries is under the age of 30. Macroeconomic training of incoming government officials is
frequently insufficient to the demands of complex modern economic management. South
Asian countries have voiced strong demand for basic courses in the IMF curriculum; even as
more advanced institutions (such as the Reserve Bank of India and Central Bank of Sri
Lanka) seek more sophisticated training.
33. Monetary policy frameworks in the region are being modernized. India has
recently transitioned to flexible inflation targeting, while Sri Lanka is exploring the
possibility of modernizing its monetary framework (also with a flexible version of inflation
targeting in mind) as well. Nepal and Bhutan have exchange rate pegs to the Indian rupee,
but face monetary operation challenges of absorbing large remittance inflows (Nepal) and
hydropower export revenue (Bhutan). Maldives has a stabilized exchange rate regime and

20
has been working to eliminate fiscal dominance on monetary policy while Bangladesh has
centered its monetary policy on a monetary targeting framework since 2003.
34. Countries in the region aim to strengthen their financial sector regulation and
supervision to safeguard macro-financial stability and provide a base for uninterrupted
access to private financing. Vulnerabilities may have accumulated in the wake of
accommodative financial conditions and steady credit growth, including sectorally-
concentrated lending, asset-liability mismatches, and increased lending by non-banks.
Measures to strengthen regulation and supervision should include closing gaps in regulation,
regular stress-testing to monitor risks, and putting in place crisis management, deposit
insurance arrangements, and resolution frameworks as needed. Macroprudential policies will
need to play an active role in containing the build-up of financial sector risks. Efforts to
deepen financial sectors across SARTTAC economies will continue, along with initiatives to
make them more inclusive.
35. Scope remains to develop statistical capacity and data dissemination standards.
While the regional needs vary, SARTTAC member countries aim to improve their national
accounts; price indices; monetary and financial sector statistics; financial soundness
indicators; external sector statistics; government finance statistics, including importantly at
the subnational level; and data dissemination. Enhancements in these areas will strengthen
the data inputs assimilated into policy decisions. For India, this could also entail
improvements aimed at achieving its data commitments under the G20 Data Gaps Initiative
(GDI) Phase II. Over time, assistance could also increasingly focus on the development and
improvement of high-frequency indicators, real estate price indices, and the use of sectoral
accounts and balance sheet data to help identify economic interlinkages and risks. Overall,
targeted CD in macroeconomic statistics will allow for more accurate macro-forecasts and
identification of vulnerabilities, and provide development partners and private investors with
a more accurate picture of the outlook and financial resource needs of SARTTAC economies.
III. SARTTAC’S OBJECTIVES BY TOPIC AREA
36. The dual focus on TA and training will contribute toward strengthening the
institutional and policy frameworks of member countries to underpin sustained
economic growth. This will permit them to build the buffers needed to reduce vulnerability
to adverse economic shocks or natural disasters. Stronger institutions and improved policy
track records would also boost investor confidence and improve access to the private
financing needed to maintain steady job creation and support growth. In some cases,
SARTTAC training will provide a supportive base for TA to be delivered from IMF
headquarters, facilitating the coordination of CD.
37. The specific agenda items envisaged for CD span the priority areas of fiscal,
monetary, and financial policies, as well as statistics.
21
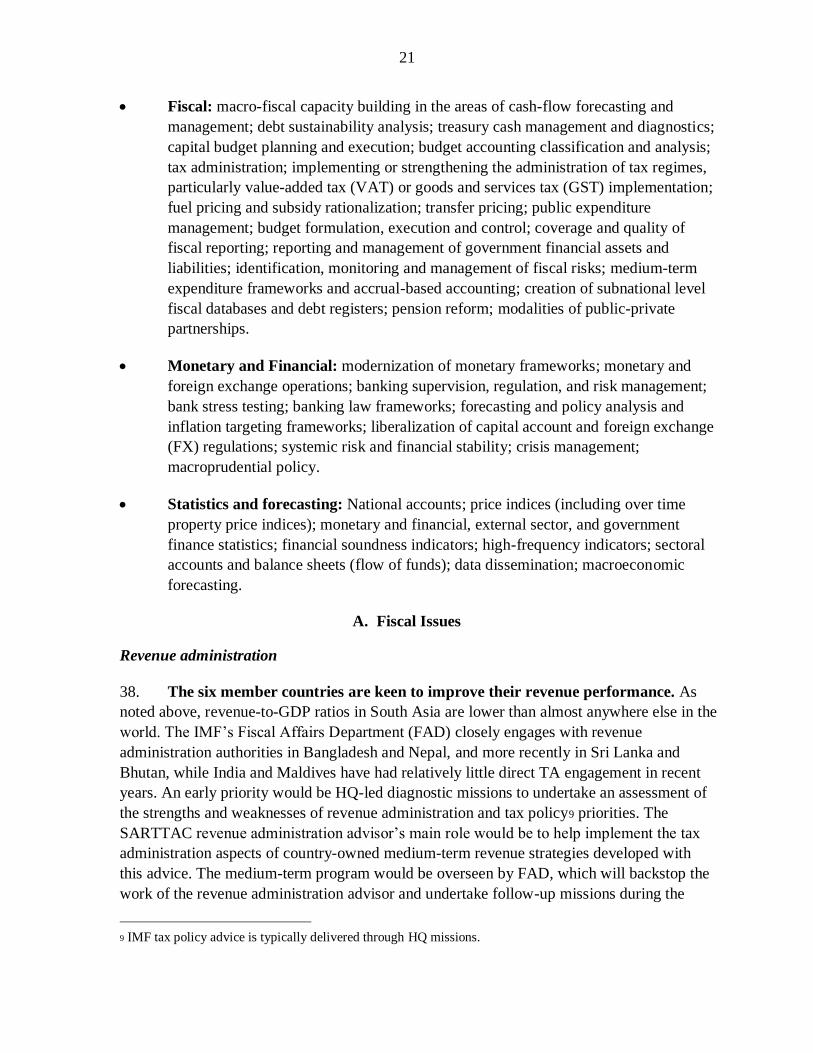
• Fiscal: macro-fiscal capacity building in the areas of cash-flow forecasting and
management; debt sustainability analysis; treasury cash management and diagnostics;
capital budget planning and execution; budget accounting classification and analysis;
tax administration; implementing or strengthening the administration of tax regimes,
particularly value-added tax (VAT) or goods and services tax (GST) implementation;
fuel pricing and subsidy rationalization; transfer pricing; public expenditure
management; budget formulation, execution and control; coverage and quality of
fiscal reporting; reporting and management of government financial assets and
liabilities; identification, monitoring and management of fiscal risks; medium-term
expenditure frameworks and accrual-based accounting; creation of subnational level
fiscal databases and debt registers; pension reform; modalities of public-private
partnerships.
• Monetary and Financial: modernization of monetary frameworks; monetary and
foreign exchange operations; banking supervision, regulation, and risk management;
bank stress testing; banking law frameworks; forecasting and policy analysis and
inflation targeting frameworks; liberalization of capital account and foreign exchange
(FX) regulations; systemic risk and financial stability; crisis management;
macroprudential policy.
• Statistics and forecasting: National accounts; price indices (including over time
property price indices); monetary and financial, external sector, and government
finance statistics; financial soundness indicators; high-frequency indicators; sectoral
accounts and balance sheets (flow of funds); data dissemination; macroeconomic
forecasting.
A. Fiscal Issues
Revenue administration
38. The six member countries are keen to improve their revenue performance. As
noted above, revenue-to-GDP ratios in South Asia are lower than almost anywhere else in the
world. The IMF’s Fiscal Affairs Department (FAD) closely engages with revenue
administration authorities in Bangladesh and Nepal, and more recently in Sri Lanka and
Bhutan, while India and Maldives have had relatively little direct TA engagement in recent
years. An early priority would be HQ-led diagnostic missions to undertake an assessment of
the strengths and weaknesses of revenue administration and tax policy9 priorities. The
SARTTAC revenue administration advisor’s main role would be to help implement the tax
administration aspects of country-owned medium-term revenue strategies developed with
this advice. The medium-term program would be overseen by FAD, which will backstop the
work of the revenue administration advisor and undertake follow-up missions during the
9 IMF tax policy advice is typically delivered through HQ missions.

22
course of the work program. We anticipate that tax administration rather than customs would
be the focus of SARTTAC initially.
39. SARTTAC countries face a number of practical challenges to modernizing their
tax administrations. These include establishing a strong basis for both deciding what to do,
but how and why cross-function linkages need to work. SARTTAC will play an important
role in following up on HQ mission advice with practical support for ensuring a solid
understanding of the concepts and assist in implementation, with a particular focus on
standardized procedures for the core tax functions. Over-arching priorities will be
implementing or strengthening the administration of tax regimes, particularly VAT/GST,
developing stronger HQ functions, better strategic and operational planning, improved basic
management practices and use of performance monitoring methods. Under the direction of
FAD, the SARTTAC revenue administration advisor will provide practical support to put
these in place.
40. SARTTAC support is expected to contribute to modernization and improvement
of tax administration performance. The areas of particular need are (1) development of an
overall strategy to ensure all taxpayers are registered and can be tracked; (2) compliance by
tax payers is ensured by better filing and payment systems; (3) dispute resolution is timely
and bolstered by clear lines of accountability and transparency; and (4) the tax administration
system is efficient, delivering strong revenue performance at reasonable administrative costs.
41. SARTTAC will be well positioned to host training workshops and events to
discuss effective revenue strategy and tax administration implementation challenges.
Regional workshops under the SARTTAC umbrella, as well as more general fiscal courses,
could support the development of a shared understanding of basic principles. Peer-to-peer
learning will help countries to make more and faster progress with essential reforms.

23
Revenue Administration - Indicative Log Frame
Improve the efficiency and effectiveness of tax administration by implementing stronger revenue
strategy
Topic
Objectives/Outcomes
Verifiable indicators
FY2021
Baseline
indicators FY16
General risks and
assumptions
Improved tax
administration
management and
governance
arrangements
1. A reform strategy and a
strategic management
framework are adopted
and institutionalized
2. Organizational
arrangements enable
more effective delivery
of strategy
3. Transparency and
accountability are more
effectively supported by
independent external
oversight and internal
controls
4. Corporate priorities are
better managed through
effective risk
management
5. Tax administrative
procedures are legally
established
To be developed
after SARTTAC
opens
1. Sufficient
ownership of
reform measures
and commitment
by authorities to
reach selected
milestones.
2. No major
exogenous shocks
and no
deterioration in
political
conditions in the
member countries
3. Close
collaboration with
other development
partners to avoid
duplication of
work.
4. Priorities are
agreed with
authorities
according to their
needs, capacities
and requests.
5. Authorities
allocate resources
and put in
governance
arrangements to
ensure reform
objectives are
achieved.
6. A willingness by
the authorities to
embrace newer
more modern tax
administration
approaches.
Improved tax
administration core
functions
1. The integrity of the
taxpayer base is
strengthened
2. A larger proportion of
taxpayers meet their
filing obligations as
required by law
3. A larger proportion of
taxpayers meet their
payment obligations as
required by law
4. Taxpayer services
initiatives to support
voluntary compliance are
strengthened
5. Audit and other
verification programs
more effectively ensure
accuracy of reporting 6. More independent, fair
and transparent dispute
To be developed
after SARTTAC
opens
24
Revenue Administration - Indicative Log Frame
Improve the efficiency and effectiveness of tax administration by implementing stronger revenue
strategy
Topic
Objectives/Outcomes
Verifiable indicators
FY2021
Baseline
indicators FY16
General risks and
assumptions
resolution mechanisms
are adopted
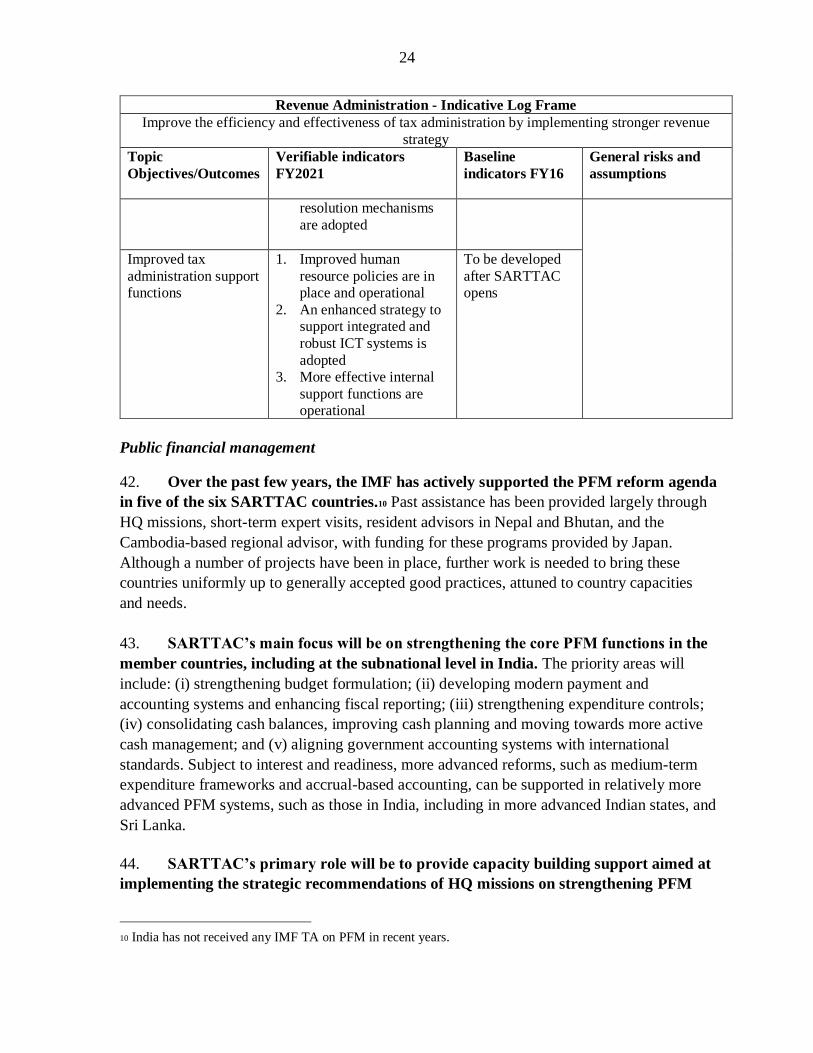
Improved tax
administration support
functions
1. Improved human
resource policies are in
place and operational
2. An enhanced strategy to
support integrated and
robust ICT systems is
adopted
3. More effective internal
support functions are
operational
To be developed
after SARTTAC
opens
Public financial management
42. Over the past few years, the IMF has actively supported the PFM reform agenda
in five of the six SARTTAC countries.10 Past assistance has been provided largely through
HQ missions, short-term expert visits, resident advisors in Nepal and Bhutan, and the
Cambodia-based regional advisor, with funding for these programs provided by Japan.
Although a number of projects have been in place, further work is needed to bring these
countries uniformly up to generally accepted good practices, attuned to country capacities
and needs.
43. SARTTAC’s main focus will be on strengthening the core PFM functions in the
member countries, including at the subnational level in India. The priority areas will
include: (i) strengthening budget formulation; (ii) developing modern payment and
accounting systems and enhancing fiscal reporting; (iii) strengthening expenditure controls;
(iv) consolidating cash balances, improving cash planning and moving towards more active
cash management; and (v) aligning government accounting systems with international
standards. Subject to interest and readiness, more advanced reforms, such as medium-term
expenditure frameworks and accrual-based accounting, can be supported in relatively more
advanced PFM systems, such as those in India, including in more advanced Indian states, and
Sri Lanka.
44. SARTTAC’s primary role will be to provide capacity building support aimed at
implementing the strategic recommendations of HQ missions on strengthening PFM
10 India has not received any IMF TA on PFM in recent years.
25
institutions, frameworks and practices. Hence, PFM training will accompany SARTTAC’s
TA delivery. FAD aims to develop more standardized PFM training programs, some of
which could be offered on-line. Collaboration and coordination with other development
partners—primarily the World Bank, the Asian Development Bank (ADB) and the United
Kingdom’s DFID— and with domestic training institutions, would ensure that synergies are
achieved and potential overlaps are avoided. Progress would be judged in the context of
periodic PEFA assessments and occasional fiscal transparency assessments, where needed. In
this context, coordination with the TA to be delivered by the IMF’s Statistics Department
(STA) is warranted, particularly in terms of fiscal reporting given that the Government
Finance Statistics Manual 2014 (GFSM 2014) is the reference standard for fiscal
transparency assessments.

26
Public Financial Management – Indicative Log Frame Assist member countries to strengthen core PFM functions and introduce progressively more advanced PFM
reforms Topic Objectives Topic Outcomes Verifiable
Indicators FY2020
Baseline for
INDICATORS
General
Risks/Assumptions
Comprehensive,
Credible, Policy-
based budget
Preparation
2.1 Credible MTFF,
and eventually
MTEF, is included
in budget
documentation.
PEFA PI 1, 2, 3 &
4
Most recent PEFA
score.
The authorities commit
to changing behaviors as
necessary to fully
implement new technical
methods.
There are no major
exogenous shocks or
deterioration in political
circumstances.
A regional approach
based on shared reform
opportunities can be
identified.
Coordination with other
development partners’
reform initiatives will
enable optimal work
scheduling and avoid
duplication.
Agreement with the
authorities is reached on
priorities based on their
needs and capacity.
2.2. Credible,
unified annual
budget is published.
PEFA PI 6 & 7
Improved Budget
Execution and
Control
3.1 Controls over
expenditure
commitments are
strengthened.
PEFA PI 18, 19 &
20
Most recent PEFA
score.
Improved Coverage
and Quality of
Fiscal Reporting
4.1 COA based on
international
standards
implemented.
PEFA PI 25 Most recent PEFA
score.
4.2 Comprehensive,
high quality fiscal
reports are
published.
PEFA PI 24 & 25
Improved
Reporting and
Management of
Government
Financial Assets
and Liabilities
5.1 Central
government
revenues and
expenditures
progressively
conducted through
TSA.
PEFA PI 17 Most recent PEFA
score.
5.2 Cash flow
forecasts for all of
central government
are accurate and
timely.
PEFA PI 16
Strengthened
Identification,
Monitoring &
Management of
Fiscal Risks
6.1 Central fiscal
oversight & analysis
of subnational
governments.
PEFA PI 8 Most recent PEFA
score.
6.2 Central fiscal
oversight & analysis
of public
corporations.
PEFA PI 9
6.3 Disclosure &
management of
contingent liabilities
and other country-
specific fiscal risks.
PEFA PI 9

27
B. Monetary and Financial Issues
Monetary and exchange operations
45. Monetary policy frameworks, instruments and operations vary substantially
across SARTTAC member countries. In addition to formal exchange rate pegs, these range
from reserve money targeting to transitioning to inflation targeting. Countries with evolving
monetary regimes and aspiring to move away from fixed exchange rate or monetary targeting
are keen to modernize their monetary policy frameworks. The authorities in those countries
have been eager to manage this transition as they need to specify a framework and a nominal
anchor to guide central bank actions and expectations of economic agents in a way that
reduces domestic money market volatility to facilitate financial market deepening.
46. Support would aim to offer options for moving monetary policy frameworks
forward, taking due account of country circumstances. In general, the approach is to
develop forward-looking and interest-rate focused operating frameworks in ways that are
aligned with existing capacities at the central bank, as well as with the country’s enabling
environment. Specific attention will be spent on the modalities of executing monetary
policies and deepening financial markets so as to facilitate transmission. For some countries,
attention to liquidity forecasting as well as the use of operational tools for managing liquidity
is relevant.
Financial sector regulation and supervision
47. The member countries’ aim to strengthen financial sector regulation and
supervision continues to be a fundamental requisite in the region. The member countries’
aim to strengthen financial sector regulation and supervision continues to be a fundamental
requisite in the region. SARTTAC capacity development work will promote international
best practices in financial sector regulation and supervision, macro-prudential policies, and
open financial systems to promote financial development and stability. It’s training will
cover topics such as current issues in banking supervision and regulation, as well as financial
development and integration. While SARTTAC will provide all aspects of capacity
development support on bank supervision, TA will continue to focus particular attention on
the implementation of risk-based supervision, effective and modernized on-and off-site
supervision, strengthened loan classification and provisioning processes, consolidated
supervision, and robust stress testing frameworks. TA will also ensure the appropriate
regulatory and legislative framework is in place to support financial stability.
48. Although banking supervision will be the principal focus of SARTTAC TA
delivery initially, regulation and supervision of non-bank financial institutions is
already relevant in some countries. As insurance supervision is generally less advanced in
the region, introducing and/or strengthening risk-based supervision and solvency frameworks
may evolve. Moreover, the enhancements of other forms of financial intermediation suggest

28
TA and training on financial development and inclusion will be necessary. Additionally, the
need to ensure effective coordination and information sharing across regulatory agencies will
reinforce a sound financial supervisory regime.
49. Significant capacity constraints hamper progress in the region and hands-on
training will remain central to the provision of TA. A TA program comprised of
individualized and peripatetic expert visits, as well as regional workshops would supplement
country TA programs.
29
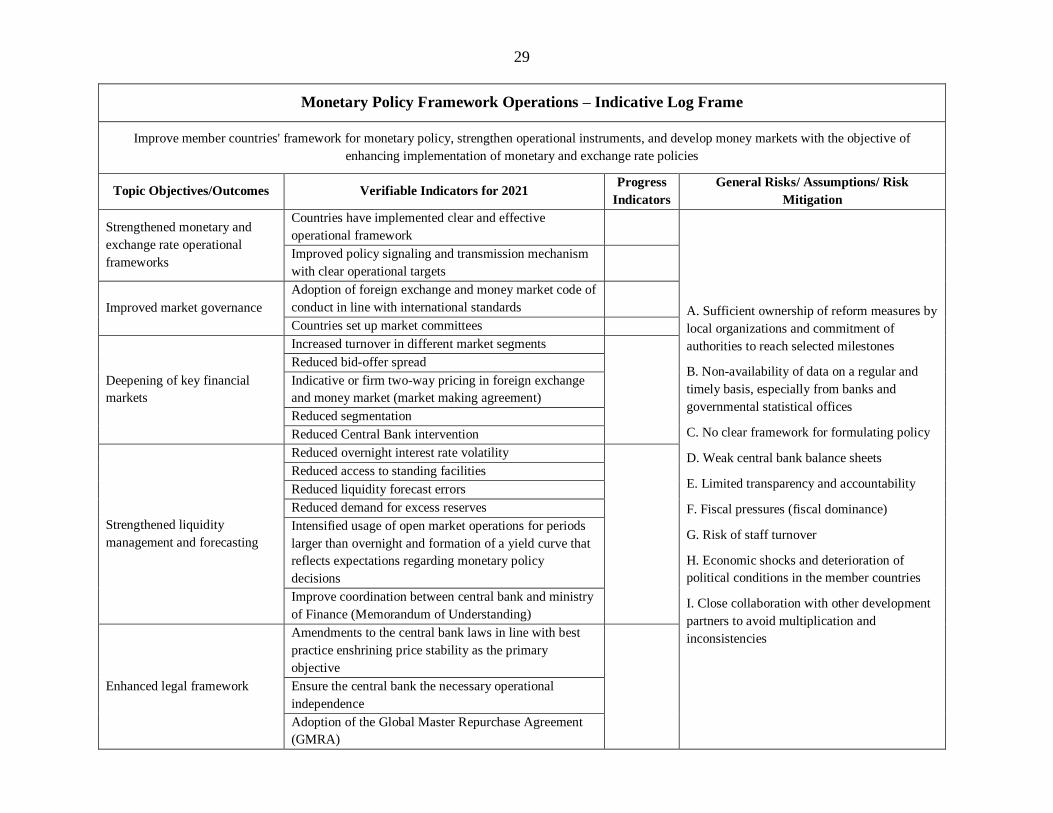
Monetary Policy Framework Operations – Indicative Log Frame
Improve member countries' framework for monetary policy, strengthen operational instruments, and develop money markets with the objective of
enhancing implementation of monetary and exchange rate policies
Topic Objectives/Outcomes Verifiable Indicators for 2021 Progress
Indicators
General Risks/ Assumptions/ Risk
Mitigation
Strengthened monetary and
exchange rate operational
frameworks
Countries have implemented clear and effective
operational framework
A. Sufficient ownership of reform measures by
local organizations and commitment of
authorities to reach selected milestones
B. Non-availability of data on a regular and
timely basis, especially from banks and
governmental statistical offices
C. No clear framework for formulating policy
D. Weak central bank balance sheets
E. Limited transparency and accountability
F. Fiscal pressures (fiscal dominance)
G. Risk of staff turnover
H. Economic shocks and deterioration of
political conditions in the member countries
I. Close collaboration with other development
partners to avoid multiplication and
inconsistencies
Improved policy signaling and transmission mechanism
with clear operational targets
Improved market governance
Adoption of foreign exchange and money market code of
conduct in line with international standards
Countries set up market committees
Deepening of key financial
markets
Increased turnover in different market segments
Reduced bid-offer spread
Indicative or firm two-way pricing in foreign exchange
and money market (market making agreement)
Reduced segmentation
Reduced Central Bank intervention
Strengthened liquidity
management and forecasting
Reduced overnight interest rate volatility
Reduced access to standing facilities
Reduced liquidity forecast errors
Reduced demand for excess reserves
Intensified usage of open market operations for periods
larger than overnight and formation of a yield curve that
reflects expectations regarding monetary policy
decisions
Improve coordination between central bank and ministry
of Finance (Memorandum of Understanding)
Enhanced legal framework
Amendments to the central bank laws in line with best
practice enshrining price stability as the primary
objective
Ensure the central bank the necessary operational
independence
Adoption of the Global Master Repurchase Agreement
(GMRA)

30
Financial Sector Regulation and Supervision – Indicative Log Frame
Strengthened financial sector supervision and regulation that contribute to a stable financial system
Topic Objectives/Outcomes Verifiable Indicators for 2021 Progress
Indicators
General Risks/ Assumptions/ Risk
Mitigation
Updated regulatory frameworks
underpinning the
implementation of risk-based
supervision and Basel II/III.
1. Work has begun to incorporate Basel II/III
requirements in the legislative and regulatory
framework
2. Supervisors implement the new requirements and
subsequent bank compliance
Central Bank (CB) management approval;
Cabinet/Parliamentary approval for legislation;
Capacity/resources at CB and banks to
implement the amended provisions;
Banks have the capacity to implement
regulations and supervisors can enforce
implementation;
Banks have necessary capacity and IT systems;
Compatibility between bank/CB systems;
Adequate CB resources to process
information;
CB management approval for changes
forthcoming; staff resources to implement
manuals;
Staff capacity and requisite resources to carry
out RBS;
At CB: Low staff turnover; base capacity of
staff; adequate staff numbers and competence;
etc.
Regulatory agencies have
effective risk assessment
frameworks
1. Databases and management practices modified to
ensure data adequacy and integrity
2. Reporting templates are upgraded to ensure most
relevant data
Strengthened institutional
structure and operational and
procedures for risk-based
supervision (RBS)
implementation
1. Supervisory structure and responsibilities are
adopted to allow more cooperation between
different functions, notably on-site and off-site
supervision
2. Staffing levels are reviewed and enhanced
3. Risk-based processes and manuals are implemented
4. On-site inspection scope and frequency are
performed based on risk and impact of banks and are
guided by off-site risk analysis
Banks have adequate capital
adequacy made up of high
quality capital, in line with
issued regulations on Basel
II/III.
1. Banks raise high quality capital to meet the
regulatory requirements
2. Banks’ disclosures demonstrate that their capital
adequacy and risk exposures are in line with new
requirements, and verified by supervisors
Banks’ have a robust liquidity
position to withstand crises and
shocks in the short-term and
have stable funding sources to
finance their long- term assets.
3. Banks’ liquidity coverage ratio (LCR) is above the
minimum requirement
4. Banks’ net stable funding ratio (NSFR) is above the
minimum requirements, as it becomes relevant

31
Financial Sector Regulation and Supervision – Indicative Log Frame
Strengthened financial sector supervision and regulation that contribute to a stable financial system
Topic Objectives/Outcomes Verifiable Indicators for 2021 Progress
Indicators
General Risks/ Assumptions/ Risk
Mitigation
Supervisors have sufficient
capacity to effectively
implement risk-based
supervision.
1. Supervisors fully trained to implement risk-based
supervision
2. Supervisory reports focus on key risk aspects of the
banking system, and provide appropriate
recommendations
3. Inspection reports of individual banks are more risk
oriented and identify key qualitative and quantitative
risks
Supervisors are gaining the
competencies to drive the
implementation process of
Basel II/III and to monitor
bank’s compliance with the
new requirements.
1. Supervisors attend various training and workshops
2. Supervisors actively engage in the development of
the new regulations

32
C. Macroeconomic Statistics
50. The IMF’s Statistics Department has a successful track record of providing CD
in South Asia. This has helped countries improve the compilation, production and
dissemination of high-quality statistics, which in turn has been supportive to sound economic
decision-making, identifying economic vulnerabilities and risks, and enhancing transparency.
All SARTTAC countries have adopted the Fund’s international standards for data
dissemination as a framework to improve the quality of their macroeconomic statistics: India
and Sri Lanka subscribe to the Special Data Dissemination Standard (SDDS) while the other
countries participate in the General Data Dissemination System (GDDS).
51. SARTTAC CD in macroeconomic statistics will build on progress already
achieved and address member countries’ largest remaining CD needs. STA CD through
SARTTAC will be geared toward further strengthening the methodological soundness and
accuracy of macroeconomic statistics compilation and improving data dissemination. CD
will cover real sector statistics (national accounts and price statistics), external sector
statistics (ESS), government finance statistics (GFS), financial soundness indicators (FSI),
monetary and financial statistics (MFS), and data dissemination. The CD strategy will
comprise both TA and training, consistent with STA’s successful track record in using both
modes as complements and seeing peer-learning as a key driver for reform. Some of the
missions, including diagnostic TA missions and workshops, will benefit from HQ staff
participation.
52. The CD strategy aims to provide a long term-expert (LTX) at SARTTAC for
real sector statistics and to use short-term/peripatetic missions to support all other
areas of macroeconomic statistics, as listed above. Interventions will be guided by the
differing needs of each country, based on their reform progress to date. The work will also
cover developing and improving statistical infrastructure, source data, serviceability and
metadata. Should more funding become available, a second LTX will be added for GFS
where major CD needs exist, including for subnational governments, with a view to
achieving sound general government statistical coverage for sound economic policy-making.
53. In providing CD, SARTTAC will collaborate with other development partners
to ensure consistent advice, optimal sequencing of CD, and maximizing synergies
among key players in the statistical area. Relevant partner agencies are the ADB, the UN
Economic and Social Commission for Asia and Pacific (ESCAP), and the World Bank. Close
coordination with CD provided by other departments, especially FAD (PFM and GFS are
closely intertwined), will be a mainstay of statistics CD.

33
Real Sector Statistics - Indicative Log Frame
Strengthen compilation and dissemination of national accounts and price statistics according to international
statistical standards, including developing/improving statistical infrastructure, source data, serviceability and
metadata. Topic
Objectives
Topic Outcomes Indicators – specific to each country Baseline for
INDICATORS
– specific to
each country
General
Risks/Assumpti
ons
Improved
national
accounts
statistics
Expand the scope of
the published
national accounts to
match the Inter-
Secretariat Working
Group on National
Accounts
(ISWGNA)
recommendations
Additional national accounts tables and
aggregates published, as agreed by each
country
Assessment of
current scope,
identifying
priority new
tables to
develop
The authorities
commit to
implement
recommendati
ons.
The authorities
consider high
quality
statistics a high
priority and
commit to
making
extensive use
of these
statistics in
policy making.
Where
appropriate,
regionally
shared
development
opportunities
are
implemented.
Coordination
with other
development
partners’
reform
initiatives will
enable optimal
work
scheduling and
avoid
duplication.
Agreement
with the
authorities is
reached on
priorities based
on their needs
and capacity.
Adequate source
data are available
Source data are available for benchmark
estimates, annual estimates and quarterly
estimates as appropriate to each country
Stocktake of
existing source
data; range,
quality,
timeliness, etc
Compilation uses
appropriate
statistical techniques
Benchmark estimates (in current price and
volume measures) are comprehensive in
coverage and acceptably recent
Assessment of
coverage and
vintage of
benchmark
Concepts and methodology follow 2008
System of National Accounts as closely as
possible
Assessment of
methodology
weaknesses,
prioritized
QNA-specific techniques are applied
appropriately (benchmarking, seasonal
adjustment, discrete time series)
Assessment of
methodology
weaknesses,
prioritized
Periodicity and
timeliness are
appropriate for
national needs
Periodicity and timeliness follow GDDS or
SDDS standards as relevant to each country
Assessment of
fitness for use
Improved
price
statistics
Expand the range of
price statistics
compiled and
disseminated to
meet national needs
Improved geographical coverage of CPI,
develop new or expand industry coverage of
PPI, develop new export/import or other
price indexes as relevant to each country
Assessment of
range and
coverage of
existing price
statistics
Adequate source
data are available
Improved price collections;
Recent and comprehensive base weight data
are available and used
Assessment of
existing price
collections and
weaknesses
prioritized
Compilation uses
appropriate
statistical techniques
Appropriate formulae are applied Assessment of
compilation
practices Quality control processes of price data are
applied appropriately
Base period and weight data are
appropriately current as per international
standards
34
D. General Macroeconomic and Financial Training
54. In addition to more targeted and customized training that closely relates to TA,
SARTTAC will deliver general macroeconomic and financial training in order to
complement the overall CD effort by helping develop a broader pool of qualified
officials able to absorb TA and more generally design their own policies. This training
will be based on courses the IMF currently offers, but be specifically tailored to the region.
All existing IMF training courses attempt to provide participants with explicit frameworks
and tools, leaving plenty of time for hands-on experimentation in workshops and case
studies. In SARTTAC there will be even more emphasis on examples and workshops that
utilize the experiences and data of the six SARTTAC countries than in the other training
centers (which have a broader country base, such as the Singapore Regional Training
Institute).11 In addition, where possible SARTTAC will seek to leverage the existing training
infrastructure in the member countries, in particular by helping them modernize their training
curriculum and guidance material and partnering with them in training delivery, while
maintaining the IMF high quality standards.
55. The IMF—and— SARTTAC—approach differs substantially from academic
institutions and even from other international financial institutions’ training arms as it
is exclusively focused on the areas related to the IMF’s mandate and is focused on
practical application. Given the identified needs of the countries, the Center will offer
courses on general macroeconomic frameworks including general modeling,12 fiscal
sustainability and fiscal rules, monetary policy analysis (perhaps including the use of
Dynamic Stochastic General Equilibrium models), exchange rate and capital flow analysis,
financial development and inclusion, macroeconomic and financial surveillance and policies
(including macroprudential policies), and statistical frameworks for real, monetary, and
financial statistics.13 Although the courses would provide the backing for the TA being
offered in the region, they will also aim to adapt to—and perhaps in some cases lead to—
new TA projects over time.14
56. The training will be aimed at country officials involved in macroeconomic and
financial policy-making or related supporting activities, regardless of their formal
11 The Singapore Regional Training Institute will continue to train officials from the countries comprising
SARTTAC but as it has a larger number of countries within its ambit, the focus of its training will be broader
and less linked to specific SARTTAC TA programs.
12 ICD’s longest running course, Financial Programming and Policies (FPP), provides participants with an
understanding of the economic accounts used in macroeconomic analysis and their interrelations and will be
offered at least annually at the Center.
13 See above section for envisaged statistical areas.
14 As an initial assumption, the course offerings are assumed to be nine (two-week) courses per year, with six
basic course offerings the first year and three specialized courses, requiring training to be delivered by two HQ-
(continued)
35
economic training. Participants will be chosen mostly based on their existing and future use
of the knowledge conveyed in the course – on their need-to-know basis – rather than on their
acquired educational level.15 Country officials participating may include those at subnational
levels of government in India, where state governments are large and capacity building needs
are great. Thought will be given to courses for non-economists (parliamentarians).
57. The IMF’s online training offerings will support SARTTAC’s face-to-face
training. To bring potential participants up to a consistent level for face-to-face training, the
successful completion of specific IMF online courses could be made a prerequisite for some
of the courses. In this way, more individuals can be trained at a faster pace, while the
effectiveness and impact of face-to-face training would be enhanced. Several of the current
on-line offerings are already geared to areas for which TA is delivered in the region and
provide backing for more general courses.16 As new online deliveries are planned, they will
take into account the needs of the region.
IV. HOW WILL THE IMF ENSURE SARTTAC’S SUCCESS?
A. Integration of SARTTAC CD with Other IMF CD and Activities
58. All IMF CD, regardless of financing source or delivery mode, is mutually-
integrated and coordinated with the IMF’s lending and surveillance activities. In
consultation with country authorities, APD will integrate the reform agendas of SARTTAC
countries with the IMF’s own policy and surveillance perspectives, drawing on the technical
expertise of CD departments. Together they will identify needs for CD, set CD priorities, and
balance short- and medium-term considerations, relying on the expertise of the CD
department for prioritization, sequencing, and selecting the mode of delivery. This internal
process provides checks and balances that ensure that CD remains highly relevant while
taking into account regional developments. The resulting Regional Strategy Note (RSN)
overview for the Asia and Pacific region, which is shared with member countries and
development partners, sets out a medium-term CD vision for the region that is the basis for
coordination of all IMF CD activities and their integration into IMF surveillance and lending
operations. Open lines of communication, in part via CD department backstopping of RTACs
and external experts, ensure consistency, cross-fertilization, and operational relevance.
based staff and two resident trainers.
15 The goal of IMF training is to use the IMF staff experiences, as well as IMF staff’s specialized, practical
knowledge to support individuals actively involved in the course topics rather than train a cadre of official
trainers. That said, peer-to-peer learning is encouraged and integration of the practices learned into the day-to-
day work of the participants is an important benefit of IMF training.
16 Examples include Energy Subsidy Reform and Debt Sustainability Analysis.
36
59. To best meet country needs, specific delivery modes are chosen depending on the
complexity of the task and the country’s implementation capacity. In the case of
SARTTAC, it is expected that diagnostic HQ-led missions will continue to generate
blueprints for reforms and identify and prioritize the CD needs of each SARTTAC country.
Being close to clients, the activities of SARTTAC will be able to draw on a deep knowledge
of the region and member countries, such as cross-cutting and regional integration issues.
Frequent contact and missions of resident advisors in the region provide step-by-step
assistance with the nuts and bolts of putting reforms in place. Missions from both HQ and
SARTTAC will draw as needed on a vetted roster of external short-term experts to
complement their skill set. For follow-up on specialist issues or in areas outside of
SARTTAC’s core expertise, short-term advisers would conduct a series of regular follow-up
missions over a longer period of time.
60. The coexistence of multiple IMF CD delivery vehicles in countries covered by the
IMF regional centers calls for close IMF internal coordination in order to optimize the
added-value of the different instruments. With Topical Trust Funds (TTFs) taking in some
of the countries covered—especially fragile states— in an increasingly hands-on
implementation role (as in the tax administration area), and a clear delineation between the
country work undertaken by a TTF and by the regional center is needed to ensure that all the
work is fully coordinated and complementary. The same logic applies with regards to
bilateral projects, some of which support the posting of long-term resident advisors in
member countries. The coexistence of the different delivery channels is justified by the large
CD needs of a particular country, for which the use of a regional center’s resources would be
insufficient or which would reduce its capacity to respond to needs in other member
countries. The close integration of the regional centers’ work plans, for both TA and training,
with the RSN process supports the close coordination between the regional centers and other
IMF CD.

37
Capacity Development: Two Planks
B. Integration and Synergies with Other CD Providers
61. SARTTAC will provide a robust platform for implementing the aid effectiveness
principles outlined in high level forums (Paris, Accra, and Busan), which call for efforts
to harmonize, align, and manage aid for results. Given limited resources, the IMF seeks to
avoid duplication in coverage and strives to enhance complementarities and synergies with
other CD providers. CD activities will be coordinated with those of other CD providers
through the steering committee and the regional relationships and expertise of SARTTAC
staff and advisors, as well as close communication with APD mission teams and CD
departments and integrated with member country Poverty Reduction Strategy Papers
(PRSPs) and sector plans. Coordination is all the more important because some IMF CD is
supported by a number of other CD providers across the region (see development partner
matrix in Appendix IV).
62. SARTTAC will actively engage with national CD institutions to maximize the
impact of CD. The countries of the region have a large number of training institutions (some
of them operating at the regional level), providing macroeconomic and financial training in
areas related to the IMF’s work. SARTTAC will examine collaborating with these national
institutions to expand the reach of the Center CD, build the capacity of these institutions, and
benefit from their knowledge to refine CD delivery to meet regional needs.
• To help member governments improve and execute policy and support better institutions and tools
• Specialized technical advice on issues within IMF’s core mandate, e.g., monetary policy operations, banking supervision, tax policy/administration, public financial management, and statistics
Technical Assistance (TA)
• To help government officials analyze economic developments and implement effective macroeconomic and financial policies
• Policy-oriented courses for government officials focused on macroeconomic policies, finance, and statistics
Training
38
63. SARTTAC will emphasize coordination with other CD providers in its core
areas of expertise. Among institutions and countries providing CD to the region are the
Asian Development Bank, Australia, Austria, Canada, China, Denmark, the European Union
(EU), France, Germany, the International Finance Corporation (IFC), the Islamic
Development Bank (IsDB), Japan, Korea, the Netherlands, Norway, the United Kingdom
(UK), the United States (US), and the World Bank. To help ensure complementarities and
synergies with other CD, the SARTTAC Director will be the focal point for liaison with
bilateral and multilateral agencies in the field. SARTTAC advisors will also support
coordination, since they often have the closest contact with country authorities in their area
of expertise, as well as with experts financed by other partners. The Director will:
• Disseminate the RSN overview, which defines the IMF medium-term CD strategy for
the Asia and Pacific region including SARTTAC countries.
• Circulate TA reports prepared by RTAC experts to the SC and, upon request, other
relevant stakeholders if the TA recipient consent (consent by the TA beneficiary
would be given on a no-objection basis in line with the IMF’s dissemination policy).
This will provide SARTTAC beneficiary countries, development partners, and other
CD providers with the information they need to better coordinate with SARTTAC
CD.
• Launch a SARTTAC website with contact and work program information to foster
development partner coordination.
• Provide development partner briefings, including through IMF’s Resident
Representative Offices. Information on SARTTAC missions will be posted on the
SARTTAC website. SARTTAC missions will also seek to systematically brief
development partners in the field.
• Publish SARTTAC annual reports. SARTTAC will produce in-depth reports on the
work completed each year, focused on the progress made in achieving outputs and
outcomes for each project and topic area.
64. Development partner officials are welcome to participate in training courses and
events offered through SARTTAC. As for all other IMF training, the IMF asks participants
from advanced countries to cover the full cost of their attendance so as not to crowd out
resources for other participants.
C. Measuring How SARTTAC Achieves its Objectives
65. The IMF has introduced RBM frameworks, which are anchored in an annual
planning, implementation, and monitoring cycle. They identify the main objectives for
each area of work for the duration of the cycle and expected and achieved inputs, outputs,
and outcomes, as well as next steps. RBM frameworks also make explicit how IMF CD
support is linked to member country reforms and poverty-reducing strategies and to the
39
activities of other development partners. SARTTAC will use a standardized catalog of
objectives, outcomes and indicators and will take advantage of a new information technology
(IT) system for reporting and project management.
Box 1. Results-based Management in SARTTAC
RBM will be the main tool used to assess SARTTAC achievements. A robust framework of
SARTTAC results, based on the new IMF RBM framework, will make it possible to assess the
Center’s objectives, outcomes, and outputs.
SARTTAC will have a strategic log frame against which it can report on high-level results that
are defined at the Center and centralized IMF catalogue levels. The strategic log frame will set one
strategic objective for SARTTAC overall and will contain objectives and outcomes covering the
different topic areas covered by the Center. The result of both top-down and bottom-up exercises, it is
derived from the RSN and from the topical log frames that will define objectives, outputs, and
outcomes per topic area across all SARTTAC member countries. An indicative strategic log frame is
presented in Appendix I. Topical sections include indicative topical log frames. These log frames will
be refined as the process of formulating CD projects for the Center gets underway. This will include
setting baselines and medium-term targets.
Topical log frames will provide a management tool for SARTTAC work planning. The work plan
will be used to monitor and report on progress. Its format will be structured to provide a snapshot of
resource utilization linked to outputs achieved and progress made toward the outcomes. In addition to
short-term activities, multi-year projects will be developed, with the aim of facilitating the planning
and reporting of CD activities. Annual work plans will be prepared within the framework of the IMF
CD prioritization processes, managed through the RSN for the Asia and Pacific region. This will ensure
full coordination with other IMF CD in the region.
D. Evaluation of IMF CD
66. The IMF relies on a robust monitoring and evaluation program to ensure that its
CD services meet the needs of member countries. Regular evaluation is a crucial
component of a sound CD strategy to foster learning from past experiences and enhance
accountability. In order to strengthen the IMF’s monitoring and evaluation framework,
including incorporating feedback from evaluation results into the prioritization and delivery
of CD, the IMF decided to adopt a unified approach to evaluation that will help distill
lessons, including through independent external assessments.
67. The IMF is setting up a common evaluation framework for all of its CD sectors.
The aim in developing a common evaluation framework is to preserve the current strengths
of the IMF’s evaluation activities while addressing any shortcomings. The proposed common
evaluation framework is intended to streamline current practices and increase
standardization, e.g. by proposing a common four-step process that includes use of the
Organization for Economic Co-operation and Development (OECD) Development
Assistance Committee (DAC) criteria. Around this common core, the proposals aim to allow
40
flexibility to adapt evaluations to reflect the wide range of CD activities. For instance, pre-
and post-quizzes are used to evaluate progress of course participants. Use of a common
approach is intended to provide cross-activity and cross-IMF comparability, permit
aggregation and enable an overall assessment of performance.
68. Independent external evaluations have consistently given RTACs and RTCs high
marks for both the quality of their advice and training and their speed and flexibility in
responding to member country needs. They found that RTACs are well suited to
supporting institutional reform and economic policy design and implementation; they are an
excellent vehicle to support regional harmonization and integration; and their TA has helped
to improve fiscal and financial transparency, accountability, and control. External evaluations
have also commended the RTAC governance model, which is focused on close cooperation
between beneficiary countries, development partners, and IMF staff, fostering strong
ownership by beneficiary countries and effective development partner coordination guided
by aid effectiveness principles. RTCs have received excellent ratings on the quality and
relevance of their training. Evaluations also noted their high awareness of and responsiveness
to regional needs as well as high satisfaction of training participants.
69. It is proposed that an independent external evaluation of the work of SARTTAC
be carried out by a team of independent experts within three years of operation of each
program phase. The evaluation will assess SARTTAC’s effectiveness and sustainability of
its CD, bearing in mind the long-term nature of capacity building. The evaluation will
formulate recommendations for improvement, which will inform discussions on SARTTAC’s
future operations.
A. Governance
70. SARTTAC will be guided by a steering committee (SC) of representatives from
beneficiary countries, donor partners, and the IMF. The SC provides strategic guidance
and helps set SARTTAC’s priorities, endorses RTAC annual work plans and budgets,
reviews annual reports and is a vehicle for feedback on CD quality. The SC meets at least
annually, and additional meetings may be convened as necessary. The SC is usually chaired
on a rotating basis by the principal representative of one of the beneficiary countries (e.g., the
deputy governor of the central bank). Observers may be permitted from neighboring
countries, regional organizations, interested development partners, or other CD providers.
71. The current governance structure helps promote member country ownership, donor
involvement, and the center’s accountability.
V. SARTTAC GOVERNANCE, OPERATIONS, AND FINANCIAL MANAGEMENT
III.SARTTAC GOVERNANCE, OPERATIONS, AND FINANCIAL MANAGEMENT
IV.
V.SARTTAC GOVERNANCE, OPERATIONS, AND FINANCIAL MANAGEMENT
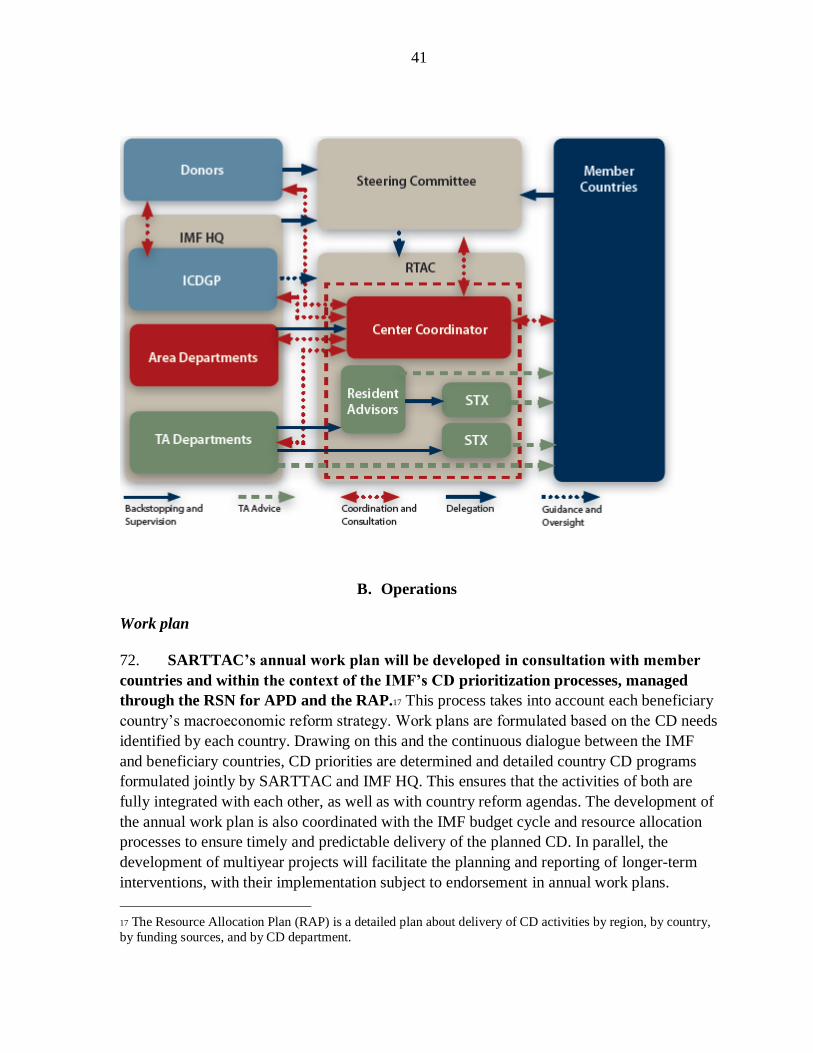
41
B. Operations
Work plan
72. SARTTAC’s annual work plan will be developed in consultation with member
countries and within the context of the IMF’s CD prioritization processes, managed
through the RSN for APD and the RAP.17 This process takes into account each beneficiary
country’s macroeconomic reform strategy. Work plans are formulated based on the CD needs
identified by each country. Drawing on this and the continuous dialogue between the IMF
and beneficiary countries, CD priorities are determined and detailed country CD programs
formulated jointly by SARTTAC and IMF HQ. This ensures that the activities of both are
fully integrated with each other, as well as with country reform agendas. The development of
the annual work plan is also coordinated with the IMF budget cycle and resource allocation
processes to ensure timely and predictable delivery of the planned CD. In parallel, the
development of multiyear projects will facilitate the planning and reporting of longer-term
interventions, with their implementation subject to endorsement in annual work plans.
17 The Resource Allocation Plan (RAP) is a detailed plan about delivery of CD activities by region, by country,
by funding sources, and by CD department.

42
73. Given finite resources, a main criterion in prioritizing the work plan is each
beneficiary country’s record of making effective use of previous CD. Peer review by the
country representatives on the SC should therefore reinforce cooperation, accountability, and
the effective use of resources.
74. The SARTTAC work plan will consist of member countries’ CD programs
(which may form part of broader regional projects), in-country training course
offerings, and regional workshops and seminars. The SARTTAC Director seeks strategic
guidance from SC members on the work plan including by asking them to send their requests
for CD needs, prior to seeking their formal endorsement. At each SC meeting, the Director
delivers a monitoring report on the progress of the activities outlined in the work plan and
lays out, in consultation with the chairman, some issues that the SC should discuss.
Center director
75. SARTTAC will be headed and managed by a Director who is an IMF staff
member. The Director is responsible for day-to-day management of SARTTAC and its
operations, with strategic guidance from the SC and general oversight from the IMF. The
Director is selected by APD and ICD in consultation with CD departments. He/she reports to
APD and ICD and works to ensure that the work of the Center is consistent with the overall
strategy of APD and the IMF. The Director maintains constant contact with the SC members
in the Center’s beneficiary countries and with APD and all relevant CD departments to
identify broad strategic priorities and emerging issues and needs for the Center.
Staff
76. SARTTAC employees will comprise the resident advisors and resident trainers
(supported by a pool of short-term experts for specific assignments) and locally recruited
office personnel. TA departments and ICD, in consultation with the Director, are responsible
for selecting and hiring SARTTAC resident advisors and resident trainers through external
international advertisements, and providing them with the substantive support and
backstopping required to ensure quality and consistency in their advice and activities. Short-
term experts for peripatetic assignments and to aid course delivery are recruited through IMF
HQ, based on a roster of qualified experts, and are backstopped (see also section on quality
control) by the resident advisors. While the IMF will select SARTTAC staff, the transparency
of the recruitment process will be ensured by regular reports to the SC. SARTTAC will
inform the SC of all forthcoming resident advisor vacancies and the Director will also report
on the person selected for the advertised position. In all recruitment of experts, due

43
consideration will continue to be given to qualified candidates from the region. Support staff
positions will be filled regionally.
Accountability and quality control
77. SARTTAC is designed and operated to ensure that the Center CD is delivered in
a manner that is responsive and accountable to the beneficiary countries. SARTTAC
must also meet and maintain the high quality standards that are expected of IMF CD.
SARTTAC will use an RBM framework to track the progress of CD projects and activities in
each country. Monitoring against pre-set objectives and outputs contributes to timely and
effective CD. RBM provides consistency, coherence, and predictability in the planning and
execution of SARTTAC CD.
78. Maintaining the quality of the CD advice and activities delivered by SARTTAC is
the responsibility of the IMF HQ and SARTTAC staff. Combining the recommendations
of previous surveillance and CD missions with the needs of the country, the CD departments
discuss with the resident advisors the objectives and outcomes of each mission with a view to
ensuring a proper sequencing of CD and improving its effectiveness in building capacity in
beneficiary countries. Throughout the mission of short-term experts and the presence of the
resident advisors, the CD departments provide supervision and support. In addition, short-
term experts are backstopped by resident advisors. CD departments review and authorize the
TA reports produced by the resident advisors and short-term experts.
79. The IMF’s dissemination policy18 on sharing TA information contributes to
accountability and facilitates coordination. Under the policy, TA reports may be shared
with the SC members with consent of the TA recipient on a no-objection basis, and on the
understanding that such information shall be kept confidential. Sharing of TA reports with
non-SC development partners will be determined case-by-case based on whether the
institution in question has a legitimate interest in the TA report in question, for example
through its engagement in related activities in the beneficiary country. To enhance
coordination, the SC members will also receive information on the need for complementary
CD.
80. It is a core objective of SARTTAC that the activities of the Center reflect the
ownership and commitment of its members. The IMF’s CD activities are driven by
demand from its member countries. Their planning and implementation require the full
involvement and buy-in of beneficiary countries to ensure effectiveness and sustainability of
the CD delivered. Inputs from beneficiary countries will be sought at various stages of the
work planning and operations of SARTTAC: during surveillance (“Article IV Consultations”)
programs and diagnostic CD missions that inform the CD planning process by APD and CD
18 See http://www.imf.org/external/np/pp/eng/2013/061013.pdf
44
departments in their preparation of CD strategies, and through the input and oversight of
SARTTAC’s SC.
81. The SC provides an additional forum for accountability. Member countries can
provide immediate feedback and recommendations on CD delivery and value. All SC
members will receive the information that allows them to guide SARTTAC’s work.
82. The IMF will provide internal institutional support to ensure focus and
targeting, as well as quality and consistency in the delivery of assistance. The combined
responsibilities of the Committee on Capacity Building, APD and the CD departments
constitute an institutional support framework for CD project delivery in the field. All projects,
whether internally or externally financed, whether delivered by HQ or by the IMF regional
centers, are supported equally by this framework.
C. Outreach and Visibility
83. SARTTAC will ensure visibility of the center and its external partners through a
variety of reporting, communication, and outreach channels. These include annual reports,
quarterly bulletins, social media and its own website and, close communication with donors
and other CD providers in the field.
84. SARTTAC will continue to recognize donor contributions and will look into further
raising donor visibility, including in the center’s outreach, during fundraising and other
events, in the local media, and through its publications.
D. Financial Management
85. Contributions from development partners and beneficiary countries will be
pooled into a multi-development partner SARTTAC Subaccount under the IMF’s
Framework Administered Account for Selected Fund Activities (the “SFA
Instrument”).19 The Subaccount will be used to receive and disburse financial contributions
for the Center’s activities; all resources contributed to the Subaccount will be for the sole use
of SARTTAC.
86. The basis for the financial arrangements between development partners and the
IMF will be a letter of understanding establishing the purposes of the contributions
related to this program document and subject to the terms and conditions of the
Subaccount, as well as the SFA framework instrument. The IMF manages the trust fund in
accordance with its financial regulations and other applicable IMF practices and procedures.
SARTTAC is an IMF office and complies with IMF procurement practices.
19 See http://www.imf.org/external/np/pp/eng/2009/030409.pdf

45
87. The IMF will provide development partners with reports on the Subaccount’s
expenditures and commitments through a secure external gateway. Separate reporting on
the execution of SARTTAC’s budget will be provided at each SC meeting. Costs will be on
an actual basis.20 The operations and transactions conducted through the Subaccount during the
financial year of the IMF will be audited as part of the IMF’s Framework Administered
Account and the report of the External Audit Firm is posted on the IMF’s external website as
part of the IMF’s Annual Report. SARTTAC is also subject to audits by the IMF’s internal
audit office.
20 See http://www.imf.org/external/np/pp/eng/2008/040308a.pdf
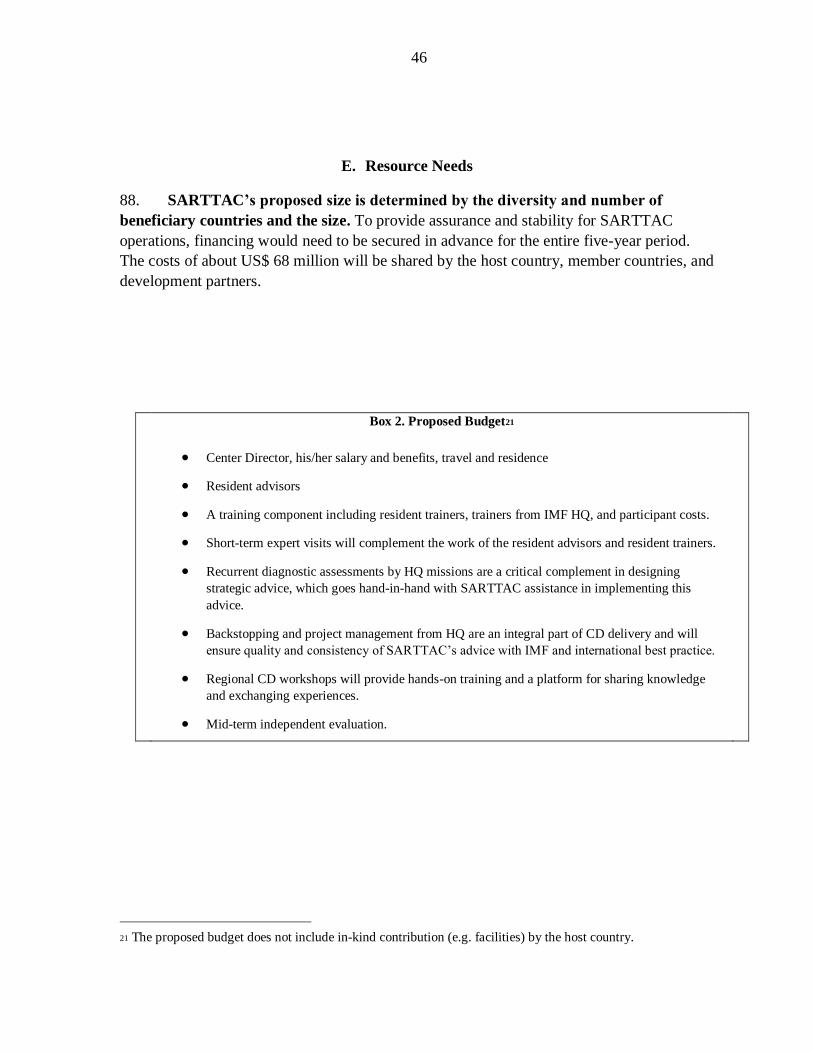
46
E. Resource Needs
88. SARTTAC’s proposed size is determined by the diversity and number of
beneficiary countries and the size. To provide assurance and stability for SARTTAC
operations, financing would need to be secured in advance for the entire five-year period.
The costs of about US$ 68 million will be shared by the host country, member countries, and
development partners.
Box 2. Proposed Budget21
• Center Director, his/her salary and benefits, travel and residence
• Resident advisors
• A training component including resident trainers, trainers from IMF HQ, and participant costs.
• Short-term expert visits will complement the work of the resident advisors and resident trainers.
• Recurrent diagnostic assessments by HQ missions are a critical complement in designing
strategic advice, which goes hand-in-hand with SARTTAC assistance in implementing this
advice.
• Backstopping and project management from HQ are an integral part of CD delivery and will
ensure quality and consistency of SARTTAC’s advice with IMF and international best practice.
• Regional CD workshops will provide hands-on training and a platform for sharing knowledge
and exchanging experiences.
• Mid-term independent evaluation.
21 The proposed budget does not include in-kind contribution (e.g. facilities) by the host country.

47
F. Sustainability and Main Risks to the Program
89. Strong commitment of beneficiary countries will be critical for SARTTAC’s
success. Without it, no lasting results will be achieved. It is therefore expected that
beneficiary countries will take full ownership of SARTTAC’s CD services and drive project
implementation by, among other things, appointing senior government officials as SC
members and covering travel and per diem expenses so that they can attend SC meetings.
Where necessary, SARTTAC beneficiary countries might also be approached to assist with
administrative and logistical support for in-country training and other SARTTAC events.
90. Given the long-term nature of developing human and institution capacity, it is
expected that SARTTAC’s funding will be continued beyond the first cycle. SARTTAC
will emphasize to build up regional expertise. The IMF will also continue to expand its roster
Capacity Development (by activity) 48.7
Public Financial Management 12.5
Revenue Administration 9.7
Financial Sector 3.1
Monetary and Exchange Operations 3.1
Real Sector Statistics 7.0
General Macroeconomic Training 13.3
Administration 1/ 11.0
Staff 4.5
Facilities, Communication, Miscellaneous 2 6.5
Governance 1.3
Project Management 1.0
Steering Committee 0.3
Evaluation 0.3
Trust Fund Management fee 4.3
Start-up cost (estimate) 1/ 3.0
Total 68.6
Source: Institute for Capacity Development, Global Partnerships Division.
1/ Cost for the period prior to the beginning of the phase is covered by
startup project.
2/ Includes cost of renting office facilities.
Table 2. South Asia Regional Training and TA Center (SARTTAC)
Proposed Budget, 2017-2022
(in milllions of U.S. dollars)
Start-up Costs 3,000,000
Source: Institute for Capacity Development, Global Partnerships Division.
SARTTAC Estimated Start-up Costs(In U.S. dollars)

48
of regional experts. The sustainability of SARTTAC operations would also be assessed by
the external mid-term evaluation.
91. Financial sustainability considerations have been incorporated into the strategy.
A threefold approach is taken to risk mitigation: (i) establishing long-term strategic
partnerships with key development partners; (ii) aiming at a diversified development partner
base; and (iii) voluntary member country contributions. Member contributions are essential
to demonstrate country ownership of the Center and for development partner support.
92. The main risks associated with establishing SARTTAC are with regard to
ownership and sustainability.
• Ownership. This will be the region’s first experience with a fully integrated regional
CD center that delivers training and TA in a seamless way. Contributions by member
countries, together with close and continuous dialogue with the Fund and
development partners, will foster members’ ownership of the Center. Member needs
vary quite widely, depending on existing capacity and policy agenda. Disparate needs
could impede consensus among members regarding the Center’s priorities and
resource allocation. Over time, such difficulties could make it more difficult to secure
buy-in and engagement. Confronting this risk will require continuous dialogue with
all stakeholders.
• Sustainability. Strong ownership by the member countries, and the support of
bilateral development partners, will be key in ensuring the long-term sustainability of
the Center. The IMF seeks to forge strategic partnerships with development partners
that have long-standing commitment to the region.

49
Appendix I: Strategic Log Frame
Topic Objectives/OutcomesVerifiable Indicators for
FY2021
PROGRESS on
INDICATORS
General Risk/Assumptions/Risk Mitigation
(as necessary)
1. Revenue administration. Improve the efficiency
and effectiveness of tax administration by
implementing stronger revenue strategy
100 percent
implementation of topic
outcome indicators
2. Public Financial Management. Assist member
countries to strengthen core PFM functions and
introduce progressively more advanced PFM
reforms
100 percent
implementation of topic
outcome indicators
3. Monetary policy framework operations. Improve
member countries' framework for monetary policy,
strengthen operational instruments, and develop
money markets with the objective of enhancing
implementation of monetary and exchange rate
policies.
100 percent
implementation of topic
outcome indicators
4. Financial sector regulation and supervision.
Strengthened financial sector supervision and
regulation that contribute to a stable financial
system.
100 percent
implementation of topic
outcome indicators
5. Real sector statistics. Strengthen compilation and
dissemination of national accounts and price
statistics according to international statistical
standards, including developing/improving
statistical infrastructure, source data, serviceability
and metadata.
100 percent
implementation of topic
outcome indicators
A. Sufficient ownership of policy agendas by the
country authorities.
B. Sufficient financing for SARTTAC Phase I is
mobilized.
C. Complementary HQ and other donor's TA is
available, where appropriate.
D. No major exogenous shocks and political stability in
the member countries.
Risk mitigation measures include:
- Securing voluntary financial contributions from the
member countries.
- Further strengthen the linkage between TA and
surveillance, while providing capacity development
services that integrate TA and training.
- Enhanced coordination with the donor community to
avoid duplication while enhancing synergy.
SARTTAC Log Frame - Strategic
50
Appendix II: South Asia—Recent Economic Developments and Outlook
(October 2016)
South Asia’s economies have continued to hold up well against the background of a generally
subdued global economic environment. Regional real GDP growth is expected to remain
around 7½ percent in both 2016 and 2017, with relatively stable inflation (apart from inflation
upticks in Nepal and Sri Lanka). However, there are disparities within the region, with robust
activity continuing to be driven to a large extent by the strong economic performance of India
and Bangladesh. Limited progress is foreseen in tackling the region’s remaining
macroeconomic vulnerabilities, as fiscal deficits are expected to narrow only modestly in 2016
and 2017, despite continued consolidation in India and Sri Lanka. External current account
balances are projected to deteriorate across South Asian countries to reach a deficit of about
2 percent of regional GDP by 2017, with particularly large imbalances in the Maldives and
Bhutan. Key policy priorities differ across countries in the region, although all would benefit
from continued structural reforms to address supply-side bottlenecks; improvements to the
functioning of product and factor markets; and enhanced intra-regional trade.
Global and Regional Economy
Global growth continues, but at a modest pace. The October 2016 World Economic Outlook
forecasts global growth to slow to 3.1 percent in 2016 before recovering to 3.4 percent in
2017, a fall of 0.1 percent for both 2016 and 2017 when compared with the April 2016 WEO
forecasts. This downward revision continues the pattern of downward revisions in global
growth forecasts of recent years. Growth prospects for different countries and country groups
vary widely. In Asia, regional growth is forecast at 5.4 percent in 2016–17, led by China and
India, with Asia continuing to deliver two-thirds of global growth (see IMF Asia-Pacific
Department’s October 2016 Regional Economic Outlook Update).
Global economic activity is expected to be driven to a large extent by emerging market and
developing economies, where growth is projected to strengthen to 4.2 percent in 2016 and
accelerate further in 2017, after five consecutive years of decline. In advanced economies,
recent data points to more subdued growth in the near term, with growth marked down to just
1.6 percent in 2016 owing to a weaker outlook for the United States, while uncertainty
following the Brexit vote is weighing on the outlook for several European countries. Some
pick-up in advanced economy growth is expected for 2017, but longer-term prospects remain
muted, given demographic headwinds and weak productivity growth.
Downside risks continue to dominate the outlook, and revolve around the ramifications of a
bumpier transition in China; asynchronous monetary developments in advanced economies;
the long-run impact of Brexit, and other geopolitical risks The stalling or reversal of
structural reforms (including new trade barriers) could exacerbate headwinds from low
productivity growth, remaining crisis legacies, and deficient demand (the so-called “new
mediocre”).

51
Against this generally challenging global background, South Asia’s economies are expected
to continue to perform well. Growth in 2016 is expected to rise slightly to 7.5 percent for the
region, with all countries but Nepal either maintaining or accelerating their rates of
expansion. Growth will be supported by still favorable terms of trade and financial
conditions, and is expected to continue at the same rate in 2017. With strong growth,
inflation is expected to rise slightly in 2016 to 5.6 percent and decline modestly thereafter.
Limited progress is foreseen in addressing the region’s remaining macroeconomic
vulnerabilities. Fiscal deficits remain sizeable in a number of countries and are expected to
narrow only modestly on aggregate in 2016 and 2017. As a result, general government debt
levels are forecast to decline only very gradually. After falling for three consecutive years,
the region’s current account deficit is expected to rise somewhat to 1.3 percent and
1.9 percent of GDP in 2016 and 2017, respectively.
Policy priorities differ across countries in the region. Fiscal consolidation is urgent in the
Maldives and should continue gradually in several other countries, including India.
Relatively high levels of distressed assets are weighing on the banking systems of a number
of countries in the region and should be addressed. In all countries, structural reforms to
overcome supply-side bottlenecks and enhance the functioning of product and factor markets
would help support continued high and inclusive growth.
India
The Indian economy continues on a recovery path, helped by a large terms of trade gain,
positive policy actions including implementation of key structural reforms, and a return to
normal monsoonal rainfall. After bottoming at 5.6 percent in FY2012/13, growth has risen
steadily, reaching 7.6 percent during FY2015/16 and is projected to remain broadly
unchanged at 7.6 percent in FY2016/17 and FY2017/18. Between FY2013/14 and
FY2015/16 there was a cumulative 13 percent increase in India’s terms of trade, largely due
to low oil and energy prices, which boosted economic activity, contributed to a further
improvement in India’s current account and fiscal positions, and enabled a sharp decline in
inflation. As a result of reduced external vulnerabilities, improved growth prospects and
continued relaxation in FDI ceilings, India has experienced large FDI and portfolio capital
inflows, a real appreciation of the rupee, and a robust rebound in foreign exchange reserves
(reaching an all-time high of over US$370 billion or about 8 months of import cover).
Nonetheless, macroeconomic challenges remain as growth is constrained by supply-side
bottlenecks and continuing weaknesses in the corporate and banking sectors.
CPI inflation moderated to 5.1 percent in August 2016, down from an average of almost 10
percent during 2011–13, reflecting the authorities’ relatively tight monetary policy stance,
and continued low global commodity (oil and food) prices. CPI inflation is projected at
around 5.5 percent by end-2016/17, and to be close to the Reserve Bank of India’s objective
of 5 percent by Q1 2017. The current account deficit has narrowed from a high of 4.8 percent
of GDP in FY2012/13 to an average of around 1.2 percent of GDP during FY2013/14–
FY2015/16, and is projected at about 1.4 percent of GDP in FY2016/17. Sluggish global

52
economic growth prospects, particularly in key advanced economy trading partners, pose
headwinds to an export recovery.
The Indian Parliament passed unanimously the long-awaited Goods and Services Tax (GST)
Constitutional Amendment Bill in August 2016, enabling a major reform of the Indian tax
system, as the GST will replace a plethora of cascading center, state, inter-state, and local
taxes with a single, nationwide, value-added tax on goods and services. Next steps include
drafting and passing the detailed GST Law, and technical preparations, with implementation
set for April 2017.
The FY2016/17 Budget envisages a welcome return to fiscal consolidation with an annual
decline in the central government deficit from 3.9 to 3.5 percent of GDP (authorities’
definition). Nonetheless, further reductions in fuel and food subsidies and tax reforms,
including implementation of the recently-approved GST and improving tax administration,
are needed to achieve fiscal consolidation plans over the medium term.
The Government of India has implemented multiple structural reforms in 2016, including:
adoption of a formal medium-term inflation target (4 percent median CPI inflation with a
symmetric 2 percent band) in August 2016; passage of the GST in August 2016; passage of a
new Bankruptcy Code in May 2016; supply-side measures to contain food inflation; and
improvements in financial inclusion and domestic bond markets. These should help raise
medium-term GDP growth rates in India.
Bangladesh
Activity and demand have been stronger than expected in FY2016 (ending June 2016), with
real GDP growth estimated at about 7 percent. Headline inflation eased further in FY2016,
with annual average CPI inflation reaching 5.9 percent in June 2016, compared to 6.4 percent
in June 2015. Food inflation has eased on the back of a good harvest and declining global
prices. On the external front, the current account balance continued to be positive in FY2016.
External reserves have risen to a comfortable level of over six months of import cover.
Inbound remittances recovered in FY2015, but weakened in FY2016 due to persistent low oil
prices.
The outlook for Bangladesh remains broadly positive, but subject to downside risks. Real
GDP growth is expected to reach 6.9 percent in FY2017 and to remain around 7 percent over
the medium term. The fiscal deficit will widen on the back of the hike in public sector pay,
but should remain sustainable assuming the new VAT comes into full effect in the near term.
On the back of investment-led growth, the current account surplus is expected to decline and
turn into a slight deficit over the medium term, with international reserves remaining
adequate.
Headline inflation is projected to pick up moderately from recent lows, with nonfood
inflation facing upward pressure from higher public sector wages, but should remain below 7
percent. The announced monetary policy statement for the second half of 2016 points to a
continued prudent monetary policy stance. Broad money growth at 15.5 percent is broadly in
line with nominal GDP growth. Despite the recent decline, the authorities should remain

53
vigilant against upside risks to inflation from higher public sector salaries and minimum
wages in the garment industry, as well as the recent increases in electricity and gas tariffs.

54
Sri Lanka
Real GDP growth fell from 5.2 percent (y/y) in 2016 Q1 to below expectations in Q2, at
2.6 percent (y/y), reflecting floods in May and soft activity in construction and
manufacturing. Growth is expected to pick up in the second half of the year owing to
stronger performance in tourism and resumption of construction. Headline inflation stood at
3.9 percent (y/y) in September 2016, and core inflation remained elevated at 4.2 percent. Sri
Lanka’s external current account deficit in the first half of the year narrowed to 2 percent of
GDP, helped by a slightly improved trade balance and strong inflows in remittances and
tourism. The EMBI spreads continued to fall in 2016 Q2 reflecting an increase in market
confidence and prudent macroeconomic policies. Following the issuance of US$1.5 billion in
international sovereign bonds at favorable yields in early July, gross foreign exchange
reserves recovered to about US$6.4 billion at end-September 2016 after falling for most of
the year.
The fiscal deficit expanded to 6.9 percent of GDP in 2015, compared with 6.2 percent in
2014. A revised budget was implemented in January 2015 following national elections,
bringing a significant increase in wages, salaries, transfers and other categories of recurrent
spending. The expanded deficit and depreciation of the rupee led to an increase in Sri
Lanka’s debt-to-GDP ratio from 70.7 percent in 2014 to 76 percent in 2015. As part of their
consolidation agenda under a three-year IMF-supported program, the government has
committed to reduce the overall fiscal deficit to 5.4 percent of GDP in 2016, and to
3.5 percent by 2020—reflecting an underlying shift to a primary surplus of 1 percent of GDP
to ensure a continued decline in the debt-to-GDP ratio over the medium term.
Nepal
Real GDP growth decelerated sharply to 0.6 percent in 2015/16 (mid-July 2015 to mid-July
2016) due to the disruption to trade and economic activity from the 4½-month stand-still at
Nepal’s southern border. Inflation rose to 10.4 percent (y/y) in July 2016 in part reflecting
shortages of fuel and other essential goods related to the trade disruption and earlier
earthquakes. With average inflation in Nepal at close to 10 percent in 2015/16, the inflation
wedge with India widened to almost 5 percentage points. With the currency pegged to the
Indian rupee, the real effective exchange rate appreciated further.
Nepal’s external position has remained strong. On the back of resilient remittances, the
external current account has now been in surplus for five years. Remittances amounted to
US$6.3 billion or 30 percent of GDP in 2015/16, up from 29 percent of GDP the year before,
despite an 18 percent decline in the number of migrants moving abroad for work. Central
Bank international reserves (including gold and SDR holdings) increased by 20 percent over
the past year to a new high of US$8.6 billion (10.8 months of prospective goods and services
imports) in July 2016.
Nepal’s general government balance recorded a surplus in 2015/16, reflecting subdued
capital spending and better-than-expected revenue performance. The latter was partly related
to a one-off increase in capital gains taxes on the sale of a mobile network provider. Despite
55
the large reconstruction and development needs, budget under-implementation worsened in
2015/16 with the execution rate for capital expenditure falling to 53 percent. Moreover, half
of the spending took place in the last month of 2015/16. Together with an increase in
domestic borrowing that was not spent, the government increased its cash holdings at the
central bank by Rs.94 billion (4.2 percent of GDP) during 2015/16. Reflecting the overall
surplus, net government debt remained on a declining path, falling to 22 percent of GDP (net
of government deposits at the Central Bank) in July 2016, down from 34 percent of GDP
four years ago.
Growth is set to recover as economic activity returns to normal and capital expenditure picks
up as the government plans to raise spending to expedite post-earthquake reconstruction
activity, including accelerating the overdue delivery of housing grants to earthquake-affected
households. Nevertheless, risks to growth are tilted to the downside reflecting persistent
under-execution of the budget and a loose monetary policy stance. Other risks include
financial sector vulnerabilities arising from the earthquakes and trade disruption. The longer-
term challenge is to boost the economy through well-managed fiscal policy to accommodate
stepped-up capital spending, appropriate monetary policy to support the exchange rate peg
and contain inflation, continued financial sector reforms, and structural policies to boost
inclusive growth.
Bhutan
The outlook for Bhutan remains generally favorable. Growth is on a recovery path, driven by
a pick-up in mining, services and on-going hydropower related construction. In the medium-
term, commissioning of new hydropower projects will boost output and exports, as well as
fiscal revenues. At the same time, inflation has eased—headline inflation fell to 3.3 percent
in 2016Q2 from 6.7 percent in 2014Q4. Inflation is projected to pick up but remain low,
benefitting partly from India’s improved inflation outlook and stable rupee to which Bhutan’s
currency is pegged.
The large fiscal deficit in FY2012/13 turned into a sizable surplus in FY2013/14, reflecting
substantially lower capital spending at the beginning of the Eleventh Five-Year Plan and
higher-than-expected project-tied grants. With a gradual pickup in capital spending and
public sector salary increase, the fiscal balance turned into a small deficit in FY2014/15, and
is projected to remain in deficit in FY2015/16. Strengthening domestic revenue collection
will be important in the medium-term to ensure fiscal sustainability. To that effect, the
planned implementation of a modern goods and services tax will be key.
Regarding the external sector, the current account deficit is projected to remain high until
2017/18 as large hydropower projects remain in the construction phase. The deficit will
continue to be financed mainly by loans and grants from India. However, over the medium-
term, a sharp increase in hydropower exports with the commissioning of new hydropower
plants is projected to improve the current account balance. As a result, foreign exchange
reserves, currently at about US$1 billion (over 9 months of imports) are projected to increase
further.
56
Maldives
Real GDP growth is estimated to have slowed sharply from 6.5 percent in 2014 to around 1.5
percent in 2015, following a sharp fall in tourist arrivals from China. Growth is expected to
pick up moderately to 3 percent in 2016, underpinned by a scaling up of infrastructure
spending. Inflation has slowed since earlier in the year mainly due to food prices and was
almost flat in July at 0.1 percent (y/y). The current account deficit is projected to have
widened to around 12 percent of GDP in 2016, despite lower oil prices, following a sharp
pick up in non-oil imports. Gross foreign reserves stood at US$538 million as of end-August
(2.2 months of import cover), down by US$135 million compared to the same period last
year, while parallel market rates have risen since the most recent Article IV mission in
January this year. Strong revenues resulted in a better than expected outturn for the fiscal
deficit in 2015 (at around 9 percent of GDP). However, sustained high deficits have placed
the public debt-to-GDP ratio above the 60 percent limit in the Fiscal Responsibility Law and
on a rising trajectory.
After reducing the deficit in 2015, the 2016 budget turned expansionary, driven by capital
spending. Fiscal developments so far in 2016 are consistent with the deficit widening from
8.7 percent of GDP in 2015 to 13.7 percent of GDP in 2016. Non-tax revenues have fallen
short of budget targets, prompting the government to streamline domestically-funded capital
projects; strictly enforce an employment freeze; expand the green tax to guesthouses; and
introduce a remittances tax. Going forward, a durable fiscal adjustment of around 5.5 percent
of GDP is needed over the medium term. To attain this, the priorities are: firmer control of
current spending (including the wage bill and healthcare costs); better targeting of subsidies;
and prioritization of capital expenditures. Stronger public financial management, including
over capital budgets, would also support fiscal adjustment. In addition, the well-administered
tax system should be leveraged to generate higher revenues, through base broadening and
higher tax rates.

57
South Asia: Selected Economic Indicators (as of October 2016)
0
1
2
3
4
5
6
7
8
South
Asi
a
South
Asi
aexc
l. In
dia
Em
erg
ing
Mark
ets
World
2015
2016
2017
Real GDP Growth(In percent, YoY)
Source: IMF, World Economic Outlook; and IMF staff estimates.
0
1
2
3
4
5
6
7
8
South
Asi
a
South
Asi
aexc
l. In
dia
Em
erg
ing
Mark
ets
World
2015
2016
2017
Inflation(In percent, YoY)
Source: IMF, World Economic Outlook; and IMF staff estimates.
-7
-6
-5
-4
-3
-2
-1
0
South
Asi
a
South
Asi
aexc
l. In
dia
Em
erg
ing
Mark
ets
World
2015
2016
2017
Fiscal Balance(In percent of GDP)
Source: IMF, World Economic Outlook; and IMF staff estimates.
-2.0
-1.5
-1.0
-0.5
0.0
0.5
South
Asi
a
South
Asi
aexc
l. In
dia
Em
erg
ing
Mark
ets
World
2015
2016
2017
Current Account Balance(In percent of GDP)
Source: IMF, World Economic Outlook; and IMF staff estimates.
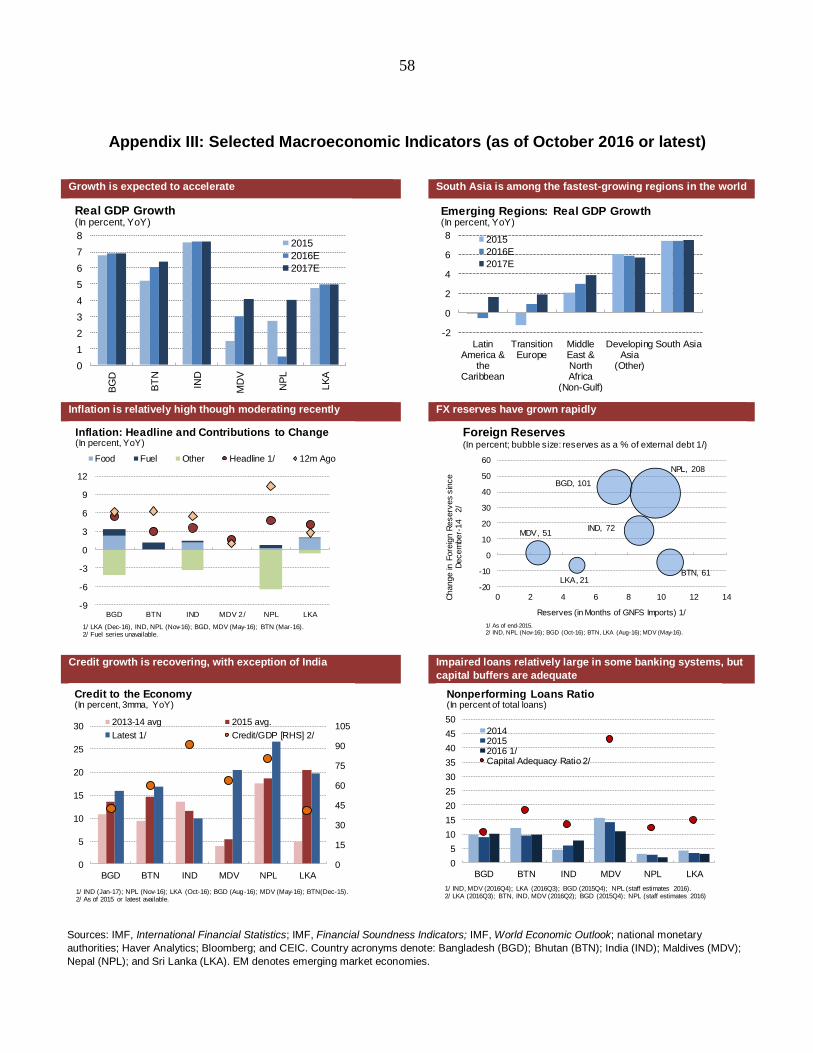
58
Appendix III: Selected Macroeconomic Indicators (as of October 2016 or latest)
Sources: IMF, International Financial Statistics; IMF, Financial Soundness Indicators; IMF, World Economic Outlook; national monetary
authorities; Haver Analytics; Bloomberg; and CEIC. Country acronyms denote: Bangladesh (BGD); Bhutan (BTN); India (IND); Maldives (MDV);
Nepal (NPL); and Sri Lanka (LKA). EM denotes emerging market economies.
Growth is expected to accelerate South Asia is among the fastest-growing regions in the world
Inflation is relatively high though moderating recently FX reserves have grown rapidly
Credit growth is recovering, with exception of India Impaired loans relatively large in some banking systems, but
capital buffers are adequate
0
1
2
3
4
5
6
7
8
BG
D
BT
N
IND
MD
V
NP
L
LK
A
2015
2016E
2017E
Real GDP Growth(In percent, YoY)
-2
0
2
4
6
8
LatinAmerica &
theCaribbean
TransitionEurope
MiddleEast &NorthAfrica
(Non-Gulf)
DevelopingAsia
(Other)
South Asia
2015
2016E
2017E
Emerging Regions: Real GDP Growth(In percent, YoY)
-9
-6
-3
0
3
6
9
12
BGD BTN IND MDV 2/ NPL LKA
Food Fuel Other Headline 1/ 12m Ago
Inflation: Headline and Contributions to Change(In percent, YoY)
1/ LKA (Dec-16), IND, NPL (Nov-16); BGD, MDV (May-16); BTN (Mar-16).2/ Fuel series unavailable.
BGD, 101
BTN, 61
IND, 72MDV, 51
NPL, 208
LKA, 21-20
-10
0
10
20
30
40
50
60
0 2 4 6 8 10 12 14
Foreign Reserves(In percent; bubble size: reserves as a % of external debt 1/)
Reserves (in Months of GNFS Imports) 1/
Change in
Fore
ign R
eserv
es s
ince
Decem
ber-
14 2
/
1/ As of end-2015.2/ IND, NPL (Nov-16); BGD (Oct-16); BTN, LKA (Aug-16); MDV (May-16).
0
15
30
45
60
75
90
105
0
5
10
15
20
25
30
BGD BTN IND MDV NPL LKA
2013-14 avg 2015 avg.
Latest 1/ Credit/GDP [RHS] 2/
Credit to the Economy(In percent, 3mma, YoY)
1/ IND (Jan-17); NPL (Nov-16); LKA (Oct-16); BGD (Aug-16); MDV (May-16); BTN(Dec-15).2/ As of 2015 or latest available.
0
5
10
15
20
25
30
35
40
45
50
BGD BTN IND MDV NPL LKA
201420152016 1/Capital Adequacy Ratio 2/
Nonperforming Loans Ratio(In percent of total loans)
1/ IND, MDV (2016Q4); LKA (2016Q3); BGD (2015Q4); NPL (staff estimates 2016).2/ LKA (2016Q3); BTN, IND, MDV (2016Q2); BGD (2015Q4); NPL (staff estimates 2016)

59
Appendix III: Selected Macroeconomic Indicators (as of October 2016 or latest)
Sources: IMF, International Financial Statistics; IMF, Financial Soundness Indicators; IMF, World Economic Outlook; national monetary
authorities; Haver Analytics; Bloomberg; and CEIC. Country acronyms denote: Bangladesh (BGD); Bhutan (BTN); India (IND); Maldives (MDV);
Nepal (NPL); and Sri Lanka (LKA). EM denotes emerging market economies.
Exchange rates flexibility: a policy feature in some economies Cross currency movements a more prominent driver of real
effective exchange rates recently
Trade links to advanced economies and large EMs are key South Asia’s share of world trade is small, but continues to
grow
Regional debt remains high Public debt ratios are stabilizing
80
85
90
95
100
105
110
Jan-1
4
Mar-
14
May-1
4
Jun-1
4
Aug-1
4
Oct-14
Dec-1
4
Feb-1
5
Apr-
15
Jun-1
5
Aug-1
5
Oct-15
Dec-1
5
Feb-1
6
Apr-
16
Jun-1
6
Aug-1
6
Oct-16
Dec-1
6
Exchange Rates(USD/LCU, Index, Jan 1 2014 = 100, 5-day moving average) 1/ 2/
1/ LCU = Local currency unit.2/ BTN and NPL have pegs w ith the Indian rupee.
BGDMDV
LKA
NPLIND
BTN
-2
-1
0
1
2
3
4
5
6
7
8
BGD BTN IND MDV NPL LKA
NEER Relative PriceChange Differential
REER
Contributions to changes in REER 1/(In percent, YoY)
1/ As of December 2016 or latest.
-25
-20
-15
-10
-5
0
5
10
15
20
BGD IND MDV NPL LKA
EU China US South Asia Other
Contributions to Export Growth 1/(In percent, YoY)
1/ As of September 2016.
0
2
4
6
8
TransitionEurope
LatinAmerica &
theCaribbean
Middle East& North
Africa (Non-Gulf)
DevelopingAsia
(Other)
South Asia
2015
2016E
2017E
EM's Exports of Goods & Services(As a share of w orld exports)
0
10
20
30
40
50
60
70
80
TransitionEurope
DevelopingAsia
(Other)
LatinAmerica &
theCaribbean
Middle East& NorthAfrica
(Non-Gulf)
South Asia
2015
2016E
2017E
EM's Government Debt by Region(In percent of GDP)
0
100
200
300
400
500
600
700
0
20
40
60
80
100
120
2015
2016
2015
2016
2015
2016
2015
2016
2015
2016
2015
2016
BGD BTN IND MDV NPL LKA
Debt/GDP
Debt/Revenue [RHS]
South Asia: Public Debt(In percent)
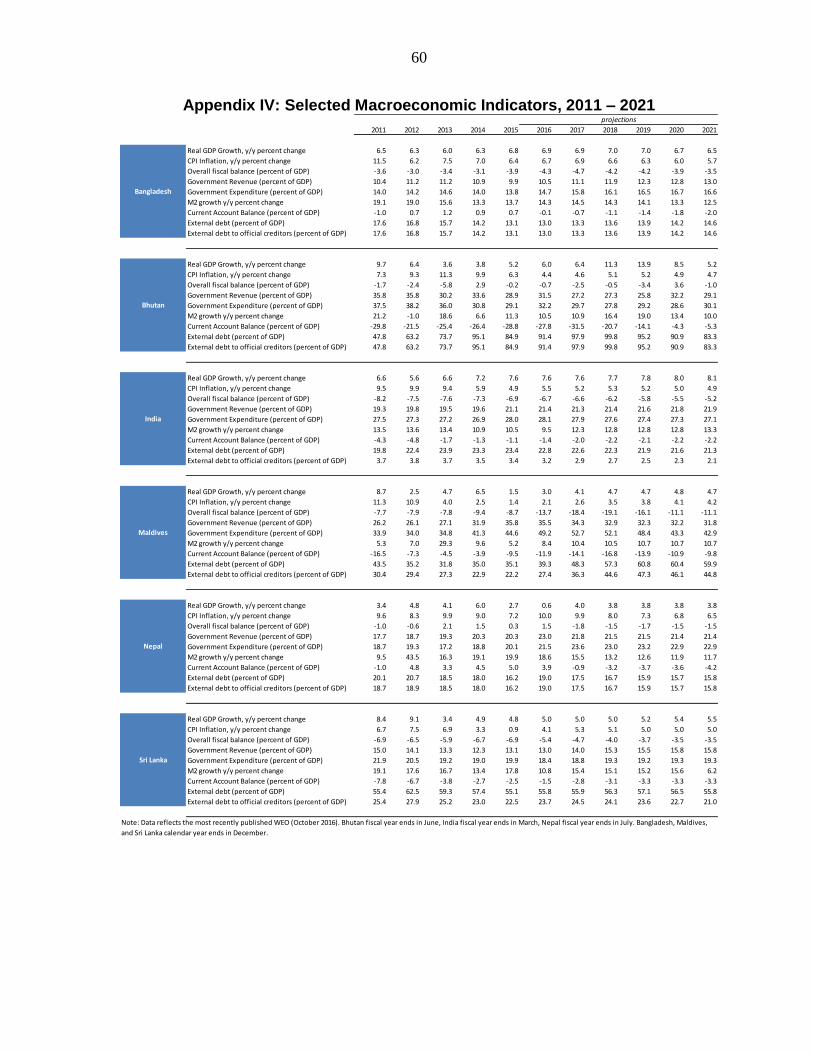
60
Appendix IV: Selected Macroeconomic Indicators, 2011 – 2021
2011 2012 2013 2014 2015 2016 2017 2018 2019 2020 2021
Real GDP Growth, y/y percent change 6.5 6.3 6.0 6.3 6.8 6.9 6.9 7.0 7.0 6.7 6.5
CPI Inflation, y/y percent change 11.5 6.2 7.5 7.0 6.4 6.7 6.9 6.6 6.3 6.0 5.7
Overall fiscal balance (percent of GDP) -3.6 -3.0 -3.4 -3.1 -3.9 -4.3 -4.7 -4.2 -4.2 -3.9 -3.5
Government Revenue (percent of GDP) 10.4 11.2 11.2 10.9 9.9 10.5 11.1 11.9 12.3 12.8 13.0
Government Expenditure (percent of GDP) 14.0 14.2 14.6 14.0 13.8 14.7 15.8 16.1 16.5 16.7 16.6
M2 growth y/y percent change 19.1 19.0 15.6 13.3 13.7 14.3 14.5 14.3 14.1 13.3 12.5
Current Account Balance (percent of GDP) -1.0 0.7 1.2 0.9 0.7 -0.1 -0.7 -1.1 -1.4 -1.8 -2.0
External debt (percent of GDP) 17.6 16.8 15.7 14.2 13.1 13.0 13.3 13.6 13.9 14.2 14.6
External debt to official creditors (percent of GDP) 17.6 16.8 15.7 14.2 13.1 13.0 13.3 13.6 13.9 14.2 14.6
Real GDP Growth, y/y percent change 9.7 6.4 3.6 3.8 5.2 6.0 6.4 11.3 13.9 8.5 5.2
CPI Inflation, y/y percent change 7.3 9.3 11.3 9.9 6.3 4.4 4.6 5.1 5.2 4.9 4.7
Overall fiscal balance (percent of GDP) -1.7 -2.4 -5.8 2.9 -0.2 -0.7 -2.5 -0.5 -3.4 3.6 -1.0
Government Revenue (percent of GDP) 35.8 35.8 30.2 33.6 28.9 31.5 27.2 27.3 25.8 32.2 29.1
Government Expenditure (percent of GDP) 37.5 38.2 36.0 30.8 29.1 32.2 29.7 27.8 29.2 28.6 30.1
M2 growth y/y percent change 21.2 -1.0 18.6 6.6 11.3 10.5 10.9 16.4 19.0 13.4 10.0
Current Account Balance (percent of GDP) -29.8 -21.5 -25.4 -26.4 -28.8 -27.8 -31.5 -20.7 -14.1 -4.3 -5.3
External debt (percent of GDP) 47.8 63.2 73.7 95.1 84.9 91.4 97.9 99.8 95.2 90.9 83.3
External debt to official creditors (percent of GDP) 47.8 63.2 73.7 95.1 84.9 91.4 97.9 99.8 95.2 90.9 83.3
Real GDP Growth, y/y percent change 6.6 5.6 6.6 7.2 7.6 7.6 7.6 7.7 7.8 8.0 8.1
CPI Inflation, y/y percent change 9.5 9.9 9.4 5.9 4.9 5.5 5.2 5.3 5.2 5.0 4.9
Overall fiscal balance (percent of GDP) -8.2 -7.5 -7.6 -7.3 -6.9 -6.7 -6.6 -6.2 -5.8 -5.5 -5.2
Government Revenue (percent of GDP) 19.3 19.8 19.5 19.6 21.1 21.4 21.3 21.4 21.6 21.8 21.9
Government Expenditure (percent of GDP) 27.5 27.3 27.2 26.9 28.0 28.1 27.9 27.6 27.4 27.3 27.1
M2 growth y/y percent change 13.5 13.6 13.4 10.9 10.5 9.5 12.3 12.8 12.8 12.8 13.3
Current Account Balance (percent of GDP) -4.3 -4.8 -1.7 -1.3 -1.1 -1.4 -2.0 -2.2 -2.1 -2.2 -2.2
External debt (percent of GDP) 19.8 22.4 23.9 23.3 23.4 22.8 22.6 22.3 21.9 21.6 21.3
External debt to official creditors (percent of GDP) 3.7 3.8 3.7 3.5 3.4 3.2 2.9 2.7 2.5 2.3 2.1
Real GDP Growth, y/y percent change 8.7 2.5 4.7 6.5 1.5 3.0 4.1 4.7 4.7 4.8 4.7
CPI Inflation, y/y percent change 11.3 10.9 4.0 2.5 1.4 2.1 2.6 3.5 3.8 4.1 4.2
Overall fiscal balance (percent of GDP) -7.7 -7.9 -7.8 -9.4 -8.7 -13.7 -18.4 -19.1 -16.1 -11.1 -11.1
Government Revenue (percent of GDP) 26.2 26.1 27.1 31.9 35.8 35.5 34.3 32.9 32.3 32.2 31.8
Government Expenditure (percent of GDP) 33.9 34.0 34.8 41.3 44.6 49.2 52.7 52.1 48.4 43.3 42.9
M2 growth y/y percent change 5.3 7.0 29.3 9.6 5.2 8.4 10.4 10.5 10.7 10.7 10.7
Current Account Balance (percent of GDP) -16.5 -7.3 -4.5 -3.9 -9.5 -11.9 -14.1 -16.8 -13.9 -10.9 -9.8
External debt (percent of GDP) 43.5 35.2 31.8 35.0 35.1 39.3 48.3 57.3 60.8 60.4 59.9
External debt to official creditors (percent of GDP) 30.4 29.4 27.3 22.9 22.2 27.4 36.3 44.6 47.3 46.1 44.8
Real GDP Growth, y/y percent change 3.4 4.8 4.1 6.0 2.7 0.6 4.0 3.8 3.8 3.8 3.8
CPI Inflation, y/y percent change 9.6 8.3 9.9 9.0 7.2 10.0 9.9 8.0 7.3 6.8 6.5
Overall fiscal balance (percent of GDP) -1.0 -0.6 2.1 1.5 0.3 1.5 -1.8 -1.5 -1.7 -1.5 -1.5
Government Revenue (percent of GDP) 17.7 18.7 19.3 20.3 20.3 23.0 21.8 21.5 21.5 21.4 21.4
Government Expenditure (percent of GDP) 18.7 19.3 17.2 18.8 20.1 21.5 23.6 23.0 23.2 22.9 22.9
M2 growth y/y percent change 9.5 43.5 16.3 19.1 19.9 18.6 15.5 13.2 12.6 11.9 11.7
Current Account Balance (percent of GDP) -1.0 4.8 3.3 4.5 5.0 3.9 -0.9 -3.2 -3.7 -3.6 -4.2
External debt (percent of GDP) 20.1 20.7 18.5 18.0 16.2 19.0 17.5 16.7 15.9 15.7 15.8
External debt to official creditors (percent of GDP) 18.7 18.9 18.5 18.0 16.2 19.0 17.5 16.7 15.9 15.7 15.8
Real GDP Growth, y/y percent change 8.4 9.1 3.4 4.9 4.8 5.0 5.0 5.0 5.2 5.4 5.5
CPI Inflation, y/y percent change 6.7 7.5 6.9 3.3 0.9 4.1 5.3 5.1 5.0 5.0 5.0
Overall fiscal balance (percent of GDP) -6.9 -6.5 -5.9 -6.7 -6.9 -5.4 -4.7 -4.0 -3.7 -3.5 -3.5
Government Revenue (percent of GDP) 15.0 14.1 13.3 12.3 13.1 13.0 14.0 15.3 15.5 15.8 15.8
Government Expenditure (percent of GDP) 21.9 20.5 19.2 19.0 19.9 18.4 18.8 19.3 19.2 19.3 19.3
M2 growth y/y percent change 19.1 17.6 16.7 13.4 17.8 10.8 15.4 15.1 15.2 15.6 6.2
Current Account Balance (percent of GDP) -7.8 -6.7 -3.8 -2.7 -2.5 -1.5 -2.8 -3.1 -3.3 -3.3 -3.3
External debt (percent of GDP) 55.4 62.5 59.3 57.4 55.1 55.8 55.9 56.3 57.1 56.5 55.8
External debt to official creditors (percent of GDP) 25.4 27.9 25.2 23.0 22.5 23.7 24.5 24.1 23.6 22.7 21.0
Note: Data reflects the most recently published WEO (October 2016). Bhutan fiscal year ends in June, India fiscal year ends in March, Nepal fiscal year ends in July. Bangladesh, Maldives,
and Sri Lanka calendar year ends in December.
projections
Maldives
Nepal
Sri Lanka
Bangladesh
Bhutan
India

61
Appendix V: List of Development Partners and Other CD Providers
macro-economic
analysis
revenue
administrationPFM
financial sector
regulation
monetary policy
and operations
macroeconomic
statistics
major
development
partners
BangladeshWorld Bank, IFC,
UK, AsDB
World Bank, EU,
UK, Canada, USWorld Bank, AsDB AsDB World Bank
Japan, UK, US,
Australia,
Germany,
Denmark,
Netherlands,
Canada,
World Bank, AsDB,
IFC, IsDB
Bhutan AsDB EU Japan
Japan, UK,
Denmark, India,
Austria, World
Bank, AsDB
India World Bank US, World Bank
Japan, UK,
Germany, US,
Norway, Australia
World Bank, ADB,
Global Fund, EU
Maldives AsDB, World Bank World Bank World Bank Japan
Japan, Australia
AsDB, World Bank,
EU
NepalGermany,
Denmark
World Bank,
AsDB,
Japan
World Bank,
AsDB,
UK
World Bank AsDB
UK, Japan,
Germany, US,
Australia,
Denmark, Norway,
Germany, Korea,
China
World Bank, AsDB,
EU
Sri LankaWorld Bank, AsDB,
Japan
World Bank, AsDB,
Japan
World Bank, AsDB,
Japan, USWorld Bank
Japan, Korea,
Australia, Norway,
France
AsDB, World Bank,
EU
List of develoment partners and other CD providers in the SARTTAC region

62

Institute for Capacity Development Global Partnerships Division
700 19th Street NWWashington, DC 20431USATel.: 1-202-623-7646Email: [email protected]
INTERNATIONAL MONETARY FUND SOUTH ASIA REGIONAL TRAINING AND TECHNICAL ASSISTANCE CENTER
6th Floor, Worldmark 2 Aerocity, New Delhi 110037, IndiaTel: +91 11 4928 1000Email: [email protected]
www.imf.org/capacitydevelopment #IMFCapDev


