98
South Australians and the Environment 2016 Prepared for: Kim Krebs Natural Resources Adelaide & Mount Lofty Ranges Project Number: 8904 Report Date: October 2016

South Australians and the Environment 2016
Prepared for: Kim Krebs
Natural Resources Adelaide & Mount Lofty Ranges Project Number: 8904 Report Date: October 2016

South Australians and the Environment 2016 Page 2 of 98
CONTENTS
1. PROJECT BACKGROUND ................................................................................ 5
1.1 Project Background and Objectives ............................................................................ 6
1.2 Methodology .................................................................................................................. 6
1.3 Context: Contemporary Issues .................................................................................... 8
2. EXECUTIVE SUMMARY .................................................................................. 10
2.1 Environment in the Public Eye ................................................................................... 11
2.2 Important Natural Resources and Responsible Parties ........................................... 11
2.3 Concern for and Perceptions of Environmental Issues in South Australia............ 12
2.4 Environmental Behaviours ......................................................................................... 12
2.5 Awareness and Understanding of NRM .................................................................... 13
2.6 Environmental Information ......................................................................................... 14
2.7 South Australian’s Environmental Positioning ........................................................ 14
2.8 Segmentation ............................................................................................................... 15
3. PRINCIPAL FINDINGS..................................................................................... 21
3.1 Environment in the Public Eye ................................................................................... 22
3.1.1 Most Important Issues at a State Level .......................................................... 22
3.1.2 Primary versus Secondary State Issues ........................................................ 23
3.1.3 Most Important Environmental Issues in South Australia ............................... 24
3.1.4 State Environmental Action ............................................................................ 26
3.2 Most Important Natural Resources and Responsible Parties ................................. 28
3.2.1 Most Important Natural Resources in South Australia ................................... 28
3.2.2 Responsibility for Natural Resource Management ......................................... 29
3.3 Concern for and Perceptions of Environmental Issues in South Australia............ 32
3.3.1 General Level of Concern .............................................................................. 32
3.3.2 Reasons Unconcerned .................................................................................. 33
3.3.3 Perceived Change in Environmental Situations in South Australia ................ 34

South Australians and the Environment 2016 Page 3 of 98
3.4 Environmental Behaviours ......................................................................................... 38
3.4.1 Frequency of Environmentally Friendly Behaviours ....................................... 38
3.4.2 Triggers of Environmental Behaviours ........................................................... 42
3.4.3 Barriers to Environmental Behaviours ............................................................ 44
3.4.4 Visitation of Environmental Areas .................................................................. 46
3.5 Awareness and Understanding of NRM .................................................................... 49
3.5.1 Awareness of the term NRM .......................................................................... 49
3.5.2 Identification of the term NRM ........................................................................ 50
3.5.3 Overall Awareness of NRM ............................................................................ 51
3.5.4 Awareness of NRM Board Activities .............................................................. 52
3.6 Environmental Information ......................................................................................... 55
3.6.1 Sources of Environmental Information ........................................................... 55
3.6.2 Environmental Aspects of Interest ................................................................. 56
3.7 Environmental Positioning Statements ..................................................................... 58
4. SEGMENTATION ............................................................................................. 64
4.1 Attitudinal and Behavioural Segments ...................................................................... 65
4.2 Segment Defining Characteristics ............................................................................. 67
4.2.1 Level of Concern about Environmental Issues ............................................... 67
4.2.2 Willingness to Engage in Environmental Behaviours ..................................... 68
4.2.3 Environmental Accountability and Impact ...................................................... 68
4.2.4 Core Beliefs ................................................................................................... 69
4.2.5 Interest in and Knowledge of the Environment ............................................... 70
4.2.6 Lifestyle and Outlook ..................................................................................... 71
4.3 Segment Demographics ............................................................................................. 73
4.4 Segment Responses to Core Survey Questions ...................................................... 76
4.5 Segment Summaries ................................................................................................... 79
APPENDIX A1: DEMOGRAPHICS ........................................................................... 84
APPENDIX A2: QUESTIONNAIRE .......................................................................... 88

South Australians and the Environment 2016 Page 4 of 98
TABLE OF FIGURES
Fig.1: Environmental Positioning Statements Collapsed Agree/Disagree (Summary) ..................................................... 15
Fig.2: Segment Spectrum (Summary) .............................................................................................................................. 16
Fig.3: Most Important Issues at State Level ..................................................................................................................... 22
Fig.4: Primary versus Secondary Issues at State Level ................................................................................................... 24
Fig.5: Most Important Environmental Issues in SA ........................................................................................................... 25
Fig.6: Most Important Environmental Government Action ................................................................................................ 27
Fig.7: Most Important Natural Resources in SA ............................................................................................................... 28
Fig.8: Perception of Responsibility for Natural Resources in SA ...................................................................................... 30
Fig.9: Level of Concern about Environmental Issues in SA .............................................................................................. 32
Fig.10: Reasons for Lack of Environmental Concern ......................................................................................................... 33
Fig.11: Perceived Changes in Environmental Situations in SA .......................................................................................... 35
Fig.12: Perceptions of Environmental Situations Subgroup Differences ............................................................................ 36
Fig.13: Perceptions of Environmental Situations Subgroup Differences - Don’t Know ....................................................... 37
Fig.14: Participation in Environmental Behaviours ............................................................................................................. 39
Fig.15: Participation in Environmental Behaviours Subgroup Differences ......................................................................... 41
Fig.16: Motivators/Triggers of Environmental Behaviours by Behaviour ............................................................................ 43
Fig.17: Barriers/Difficulties Participating in Environmental Behaviours by Behaviour ........................................................ 45
Fig.18: Frequency of Visitation to Environmental Areas ..................................................................................................... 47
Fig.19: Frequency of Visitation to Environmental Areas Subgroup Differences ................................................................. 48
Fig.20: Heard of Term NRM ............................................................................................................................................... 49
Fig.21: Identification of NRM Initialism ............................................................................................................................... 50
Fig.22: Overall Awareness of NRM .................................................................................................................................... 51
Fig.23: Activities NRM Boards Undertake .......................................................................................................................... 53
Fig.24: Sources of Environmental Information .................................................................................................................... 55
Fig.25: Interest in Environmental Aspects .......................................................................................................................... 57
Fig.26: Environmental Positioning Statements Collapsed Agree/Disagree ........................................................................ 58
Fig.27: Environmental Positioning Statements ................................................................................................................... 60
Fig.28: Environmental Positioning Subgroup Differences .................................................................................................. 63
Fig.29: Segment Prevalence .............................................................................................................................................. 65
Fig.30: The Four Segments ................................................................................................................................................ 66
Fig.31: Segment Characteristics; Level of Concern about Environmental Issues in SA .................................................... 67
Fig.32: Segment Characteristics; Environmental Actions and Behaviour ........................................................................... 68
Fig.33: Segment Characteristics; Environmental Accountability and Impact ...................................................................... 69
Fig.34: Segment Characteristics; Core Environmental Beliefs ........................................................................................... 70
Fig.35: Segment Characteristics; Environmental Interest and Knowledge ......................................................................... 71
Fig.36: Segment Characteristics; Lifestyle and Outlook ..................................................................................................... 72
Fig.37: Segment Key Demographics .................................................................................................................................. 73
Fig.38: Core Survey Questions by Segments ..................................................................................................................... 77
Fig.39: Participation in Environmental Behaviours by Segment ......................................................................................... 78
Fig.40: Segment Spectrum ................................................................................................................................................. 79

South Australians and the Environment 2016 Page 5 of 98
1. PROJECT BACKGROUND

South Australians and the Environment 2016 Page 6 of 98
1.1 Project Background and Objectives
Adelaide and Mount Lofty Ranges Natural Resources Management Board (AMLR NRM Board), in collaboration with the South Australian Murray-Darling Basin Management Board (SAMDB NRM Board), commissioned Harrison Research to develop and undertake a large scale research project with South Australian residents to develop a benchmark understanding of South Australian’s knowledge, attitudes and behaviours in relation to the environment.
Partially informed by research of a similar nature conducted interstate and previous South Australian research, the intention of the research was broadly to establish a measure of South Australian residents’ environmental beliefs, values knowledge, attitudes and behaviours. Specific lines of questioning include:
Where the environment ranks in terms of importance as an issue within South Australia today
Environmental issues that are on the minds of the South Australia population
How South Australian’s think these issues should be tackled
Which of South Australia’s natural resources are considered to be the most important
Awareness and understanding of who is responsible for looking after natural resources in South Australia
The general level of concern surrounding environmental issues in South Australia today
Perceptions of how well South Australia has adapted to recent and ongoing environmental situations
The frequency of undertaking environmentally friendly behaviours and the motivators/barriers related to such behaviours
The frequency of visitation to nature areas within South Australia
Awareness of NRM Boards and the activities they undertake
Where South Australian’s seek information on the environment
A secondary objective of the research was to establish a ‘framework of understanding’ by undertaking a Segmentation Analysis. The aim of this Analysis was to identify distinct groups or ‘segments’ within the population who share similarities in their positions towards the environment (along with the demographic, psychographic and behavioural characteristics of each group) to aid in the development of communication and policy strategies.
1.2 Methodology
In order to quantify the key information requirements of the project, to generate reliable results across demographic subgroups and to produce a clear Segmentation, a large-scale Computer Aided Telephone Interviewing (CATI) Survey of 1,000 South Australian residents aged 15 and over was proposed.
The questionnaire, developed by Harrison Research in conjunction with Natural Resources Adelaide and Mount Lofty Ranges, was informed by research conducted by NSW Office of Environment and Heritage and previous research conducted in South Australia.

South Australians and the Environment 2016 Page 7 of 98
As research of this nature had not been previously undertaken in South Australia, a two stage approach in was utilised to fine tune the survey questions and optimise outcomes:
Pilot stage: The draft questionnaire was piloted among a random sample of n=50 South Australians across four geographic areas of interest. Feedback from the pilot in terms of timing, wording, logic, flow, participant experience, data collection and output was used to improve the final survey tool.
Final stage: The optimised final survey (see Appendix A2) was conducted with a target of n=1000 completed surveys.
To ensure adequate samples were collected from regional and rural areas and from the participating NRM boards of interest, the following quotas were imposed:
500 completed surveys in the Adelaide metropolitan area, covering the inner and outer suburbs
125 completed surveys in the AMLR NRM Board area outside of the Adelaide metropolitan area
125 completed surveys in the SAMDB NRM area
250 completed surveys in regional areas of South Australia outside of the AMLR NRM and SAMDB NRM areas, including the major regional centres such as Mount Gambier, Port Lincoln, Whyalla and Port Pirie
To avoid the need for gender and age quotas, the “last birthday” random sampling technique was utilised, in which interviewers asked to speak to the person in the household who was last to have a birthday. However, in order to obtain minimum threshold samples of people aged 20 to 39 (well known to be the most difficult to reach), interviewers targeted those in the household under the age of 40 in the first instance.
All interviews were conducted by Harrison Research, from a random sample extracted from an electronic residential landline and mobile phone listing. The pilot was conducted from the 11th until the 13th of August 2016 and the full ‘optimised’ survey was conducted from the 25th of August to the 17th of September 2016. All interviews were conducted by Harrison Research’s experienced interviewers in accordance with the Market and Social Research Privacy Principles (M&SRPPs) and Harrison Research’s ISO 20252 accredited processes. The average length of the survey was just over 18 minutes.
The target sample of n=1,000 was achieved. A final sample of this size offers a margin of error of ±3.10% to 95% confidence at the total sample level.
Upon completion of the fieldwork, the raw data was weighted by gender within age within region to ensure that the sample was largely in line with true population distribution across South Australia (sourced from ABS Census 2011 population data, unfortunately Census 2016 data was not yet available at the time of the research). Unweighted versus weighted number and proportions can be found in Appendix A1: Demographics.
Analysis has been undertaken to highlight statistically significant differences between key demographic and geographic subgroups where possible. Please note the following general and specific geographic subgroups were used during analysis in order to provide the best subgroup analysis possible:
Metropolitan South Australian, i.e. Greater Adelaide (as defined by Australian Bureau of Statistics boundaries) residents

South Australians and the Environment 2016 Page 8 of 98
Regional South Australian residents
Regional AMLR NRM Board catchment area residents
SAMDB NRM Board catchment area residents
Residents of other areas of regional South Australia (all regional areas outside of the AMLR NRM Board and SAMDB NRM Board catchment areas)
1.3 Context: Contemporary Issues
As the research captures a snapshot in time it is useful to include a summary of issues that were attracting the community’s attention in the immediate period preceding and during the research. This is done so that, in future years in particular, research results can be considered in the context of the times in terms of community experiences, public debate and media attention. While context is particularly important when considering the findings from the first question in the survey, it may also have an effect on other responses and as such provides a setting for interpreting any longitudinal trends.
The following areas received elevated media attention prior to and during the period in which the fieldwork was conducted (25th August – 17th September 2016):
Storm weather and references to climate change - Prior to and during the survey there was ongoing media coverage in regards to severe storm weather overseas, interstate and intrastate. During the course of the fieldwork (winter 2016) there were several powerful storms/weather systems that occurred in South Australia, with record rainfalls, flooding and damaging high winds. The storm resulted in walking trail closures and a large scale clean-up of debris in the River Torrens, which received negative media attention. Although it cannot be said what influence these occurrences may have had it should be noted that some media make reference to climate change when such events occur.
Also of note, a state-wide blackout occurred in late September 2016, following which discussions and debate surrounding energy infrastructure and renewable energy ensued. However, fieldwork had been completed prior to this event.
Nuclear waste dump - The South Australian Government was running a mass media campaign (including television) regarding the proposed nuclear waste dump. The intent of the campaign was to encourage South Australians to “discover the facts, discuss as a community and decide on South Australia’s role in the nuclear fuel cycle”. In a television advertisement running on prime time television South Australian residents were encouraged to seek more information online, engage in conversations with friends and family and contribute to public submissions.
Exploration drilling in the Great Australian Bight - During the time of the survey BP was still active (since lapsed) in their proposal to explore for oil and gas by drilling four wells in the Great Australian Bight off the South Australian coast. The proposal was met by opposition from some in the community, including environmental groups.
Health issues - During this time period, as part of an ongoing coverage of health issues, media attention was given to cost increases and further delays to the completion of the new Royal Adelaide Hospital and the associated legal action between the South Australian government and the builder and consortium, SA Health Partnerships. Further, there was mention in the media of possible bed closures and of job losses for nursing, allied health and administration positions as part of the government’s Transforming Health Plan.

South Australians and the Environment 2016 Page 9 of 98
Economy and employment - There was ongoing media coverage concerning South Australia’s economic performance and level of unemployment/underemployment evident during the period leading up to and during the survey.
Energy costs - There was ongoing media coverage regarding price spikes in wholesale electricity prices in South Australia, with South Australian energy prices in being among the highest in Australia.
Same sex marriage plebiscite - There was ongoing media coverage and political debate surrounding the conduct of a plebiscite assessing Australian’s opinions on granting same sex individuals the right to marry.
NRM Levy - Prior to the survey (January – August 2016), there had been a significant amount of regional media coverage around the increase and/or change to the SA NRM Levy. This media (and community) interest coincided with the NRM Boards’ public consultation around levy changes, and the subsequent receipt by home owners of their first rates invoice.

South Australians and the Environment 2016 Page 10 of 98
2. EXECUTIVE SUMMARY

South Australians and the Environment 2016 Page 11 of 98
The following Executive Summary covers the findings of the research split into key sections.
2.1 Environment in the Public Eye
In order to measure the importance of the environment in relation to other state issues, all 1,000 South Australian residents surveyed were asked what they consider to be the two most important issues at a state level that need attention from the State Government at present. The core issues that were identified most commonly were health/hospitals/healthcare (44%) unemployment/ underemployment (29%) and education/schools (21%). The environment ranked 11th, with 4% of the total sample naming the environment as one of their two most important issues.
The most important environmental issues in South Australia today as identified by those surveyed were water supply/conservation/drought (21%), energy/fuel/nuclear power (20%) and water pollution/ water quality (19%). Other environmental issues commonly raised were:
Renewable energy (14%)
Forest/bushland preservation/biodiversity issues (13%)
Nuclear dump (12%)
Air pollution/air quality (9%)
Climate change (9%)
When asked what they believe is the single most important thing the South Australian Government can do to protect and look after the environment over the next few years, one in five respondents (21%) were unable to suggest an environmental action for the South Australian Government to undertake. Of the remainder, the most common actions suggested were:
Promote renewable energy (14%)
Address climate change/reduce greenhouse gas emissions (9%)
Not proceed with a nuclear dump (9%), and
Protect our water resources/waterways (9%)
2.2 Important Natural Resources and Responsible Parties
When asked to name the most important natural resources in South Australia around one in three named South Australia’s mineral wealth, including gas/mining (33%) and South Australia’s water quality/quantity (30%). These were followed by South Australia’s food production capability/agriculture/farmland (16%), national parks/conservation parks/state forests (13%), the River Murray (11%) and the Sun (10%).

South Australians and the Environment 2016 Page 12 of 98
In an assessment of South Australian’s awareness and understanding of who is responsible for the protection and management of the States natural resources, almost half of those surveyed placed responsibility with the State Government (47%), but were unable to provide any further detail (i.e. specific department, subdivision, etc.). One third of respondents (32%) placed responsibility with Local Government or Local Councils, 22% of respondents placed responsibility with the Federal Government (but were unable to provide any further information) and just over one quarter (28%) stated that “all of us/everyone” are responsible for the protection and management of the environment in South Australia.
Specific organisations were named by a minority of respondents, however of these DEWNR was the most commonly mentioned (9%), followed by NRM Boards (6%) and then the Environmental Protection Authority (4%).
2.3 Concern for and Perceptions of Environmental Issues in South Australia
The vast majority of South Australians surveyed (72%) were concerned about environmental issues in South Australia to some degree; 24% indicated that they were very concerned, while 48% were quite concerned.
On the other hand, 14% indicated a lack of concern with environmental issues in South Australia (12% ‘not very concerned’ and 2% ‘not at all concerned’). The remaining 15% of respondents were on the fence or unsure.
Of those who were unconcerned, one in three (32%) reasoned they feel this way because the condition of the environment is good/well managed and one in five (20%) stated they feel that way because environmental issues do not impact them personally.
Respondents were then assessed on their perceptions of progress regarding environmental issues in South Australia. This was accomplished by asking if they thought South Australia had become better, had not changed or had become worse in regards to nine environmental situations. The majority of those surveyed considered South Australia to have become better at the following to some degree:
Reducing water over consumption (55%)
Maintaining healthy rivers, streams and wetlands (55%)
Using alternatives to motor vehicles (51%), and
Using our soils, plants and water sustainably (51%)
Conserving the marine environment and producing food sustainably were the environmental situations which received the highest proportions of “worse” responses (18% and 16% of the total sample, respectively).
2.4 Environmental Behaviours
In an assessment of engagement in environmentally friendly behaviours all respondents were asked how often (often, sometimes, occasionally or never) they had participated in a number of specific environmentally friendly behaviours in the past 12 months.

South Australians and the Environment 2016 Page 13 of 98
Overall, the results indicate that the majority of South Australians engage in environmentally friendly behaviours on a regular or semi-regular basis. The majority of those surveyed had often avoided putting oil/fat/turps/paints or chemicals down the sink, drain or toilet (87%), taken steps to reduce energy consumption (72%), tried to reduce their household waste (68%), made an effort to reduce water consumption (60%) and chosen household products that are better for the environment (55%).
The most common driving forces or ‘triggers’ behind initiating these environmentally friendly behaviours were a general concern for the environment, to save money or for some other personal benefit. On the other hand, the level of difficulty involved with performing a behaviour was the most common barrier preventing respondents from engaging in these environmentally friendly activities or performing them more often. Other common barriers included time constraints, cost and a perceived lack of impact.
In a measure of the visitation and frequency of visitation to environmental areas within South Australia, local parks and beaches/oceans had the highest visitation overall, with nine in ten respondents having visited these locations at least once in the past 12 months (89% had visited a local park and 90% had visited a beach/ocean). Just over three quarters of respondents (77%) had visited a national park, conservation park or state forest at least once, with 22% being frequent visitors to these types of areas.
2.5 Awareness and Understanding of NRM
Three in ten South Australian’s surveyed had heard of the term NRM (30%), 66% indicated they had not and the remainder were unsure (4%).
Of those who had heard of the term NRM (n=302), almost three quarters (72%) were able to correctly identify that NRM stands for Natural Resources Management, 13% provided an incorrect account of the acronym (the most common of which being National Resources Management) and the remainder (16%) were unsure.
When expressed as a proportion of the total sample, 22% of South Australian’s surveyed had heard of the term NRM and were able to correctly identify it as standing for Natural Resources Management. A further 8% of the total sample were aware of the term but unable to correctly state what it stands for and 70% were either unaware or were not sure of their awareness of the term NRM prior to the survey.
When asked to name the activities they think Natural Resources Management Boards in South Australia undertake, the most common response was look after/manage water resources (quality and quantity), which was identified by one third of the total sample (33%). Other activities more identified by at least one in ten respondents included:
Look after/manage national parks/conservation parks (29%)
Protect native vegetation (20%)
Look after/manage coast/marine ecosystems (18%)
Look after/manage the River Murray (16%)
Protect native birds and animals (12%)
Support/work with landholders, sustainability of food/agricultural production/land (11%)

South Australians and the Environment 2016 Page 14 of 98
2.6 Environmental Information
The overwhelming majority (75%) of those surveyed stated they use the internet when looking for information on the environment. Although only mentioned by small proportions of respondents, other sources of information commonly identified were Local Council (14%), word of mouth (8%), books/library/magazines (6%) and newspapers (6%).
When asked if there is some aspect that they are interested in learning more about, four in ten respondents (42%) indicated their interest and specified an environmental topic, the most common of which were:
Marine/river/ocean life or ecosystems (9%)
The protection/conservation of native flora and fauna (6%)
Agriculture and sustainability (5%)
General or specific information about flora and fauna (5%)
2.7 South Australian’s Environmental Positioning
All 1,000 South Australian residents surveyed were read out 19 statements (randomised for each participant) and asked to provide their level of agreement with each on a scale of 1 to 5 where 1 was strongly disagree and 5 was strongly agree. The primary purpose of these statements was to generate an Attitudinal and Behavioural Segmentation of the South Australian population, however, the results at the total sample level provide some valuable measures of the core attitudes, behaviours, views and values of South Australian’s as a whole.
Based on the results of the representative sample, the responses to the statements suggest that almost all South Australian’s generally value interacting with nature and strongly believe in the importance of conserving and protecting the natural environment. The majority engage or were willing to engage in various environmental behaviours and most were generally aware of the effect they have on the environment, displaying understanding and accountability for their actions. However, in a notable exception, only one third (36%) consider the environment when deciding on their transport options.
The vast majority of respondents (77%) indicated they had some interest in environmental issues, half felt they were well informed about the environment (51%) and yet 76% felt that there are environmental issues they do not understand. This is perhaps indicative of a discrepancy between knowledge of the environment and a practical understanding of particular environmental issues.
Although three quarters of the South Australian’s surveyed disagreed with the statement “I think that climate change is a myth” (74%), 13% agreed and a further 13% were unsure or neutral. This suggests that around a quarter of the South Australian population do not believe in, or have reservations about, the validity of climate change. Further to this, 21% of respondents agreed with the statement “a lot of the threats to the environment are exaggerated”.

South Australians and the Environment 2016 Page 15 of 98
The following table summarises these results from the highest level of overall agreement to the lowest:
Agree Neutral Disagree
Conserving the natural environment is of critical importance 94% 3% 3%
I like to interact with nature 89% 7% 4%
Regular participation in recreation and leisure outdoors is important to me 88% 6% 6%
Energy ratings are of vital importance when I purchase household appliances
86% 8% 6%
I am highly aware of the impacts that my family and I have on the environment
78% 13% 9%
There are things I can do to reduce the impacts of climate change 77% 11% 12%
I strongly believe what I personally do makes a difference to the environment
76% 14% 10%
I feel there are some environmental issues that I don't understand 76% 12% 12%
I am happy to pay more for environmentally friendly products 72% 15% 13%
There is not enough emphasis on protecting our natural habitats 70% 15% 15%
I am willing to make considerable sacrifices to improve the quality of natural resources in SA
66% 23% 11%
I am well informed about the environment 51% 24% 25%
I consider myself to be a strong environmentalist 45% 25% 30%
I am pessimistic about the future 38% 19% 43%
I consider the environment when I decide on my transport options 36% 19% 44%
A lot of threats to the environment are exaggerated 21% 16% 63%
I think that climate change is a myth 13% 13% 74%
I have little interest in environmental issues 11% 12% 77%
The environment is not my problem 5% 4% 91%
Fig.1: Environmental Positioning Statements Collapsed Agree/Disagree (Summary)
2.8 Segmentation
In order to aid in the development of communication and policy strategies, a Segmentation or Cluster Analysis was undertaken. Using respondents answers to the nineteen agree/disagree statements above as well as their stated level of concern for environmental issues in South Australia, the analysis employed pattern recognition to discover groups or ‘segments’ that exist within the South Australian population.

South Australians and the Environment 2016 Page 16 of 98
Based on patterns within the data, four distinct segments were identified. The names assigned to each segment and proportion of the total sample of each were as follows:
Environmentally Engaged and Aware (35% of the total sample)
Environmentally Concerned Sceptics (22%)
Environmentally Unenlightened (28%)
Environmentally Disengaged (15%)
These four segments displayed a general spectrum from those who were extremely environmentally engaged, active and aware through to though who were relatively uninformed, disengaged and disinterested (or uncaring).
Fig.2: Segment Spectrum (Summary)
There was one critical exception to this rule. Despite being generally quite environmentally aware, concerned and engaged, Concerned Sceptics (seen in blue above) were more likely to be sceptical about climate change and other threats to the environment to a similar degree to Disengaged (in red above).
The following ‘one pagers’ summarise each segment.
Segment Spectrum Most engaged,
active concerned and aware
Least engaged, active
concerned and aware

South Australians and the Environment 2016 Page 17 of 98
Who am I more likely to be?
• Those aged between 30 and 49 years old
• Residents of the Adelaide metropolitan area
• Full time workers
• Those who are university educated, especially postgraduate level
• Those involved with or belong to an environmental, land care or similar group
I am more likely to…
• Display awareness of numerous environmental issues in South Australia
• Consider water quality/quantity and national parks/conservation parks/state forests as the most important natural resources in South Australia
• Engage regularly in a range of environmental behaviours
• Frequent many of South Australia’s nature areas • Be aware of NRM Boards and the activities they undertake
• Use the internet when looking for information on the environment • Be interested in learning more about an aspect of the environment
What are my defining characteristics?
• I am less likely to think that climate change is a myth
• I am less likely to think that a lot of threats to the environment are exaggerated
• I am more likely to be interested in environmental issues
• I am more likely to think there are things I can do to reduce the impacts of climate change
• I am more likely to think there is not enough emphasis on protecting our natural habitats
Engaged and Aware
Behaviourally disengaged
Unaware
Unconcerned
In regards to the environment, and environmental issues, I am…
Sceptical
Behaviourally engaged
Aware
Concerned
Believer
35
% o
f th
e p
op
ula
tio
n

South Australians and the Environment 2016 Page 18 of 98
Concerned Sceptics
Who am I more likely to be?
• People over the age of 60 and retirees
• Residents of regional South Australia (in townships)
• Those who own their own homes • Live as a mature couple without children at home
• Have secondary school as their highest level of education
• Lower income earners, i.e. a household income of under $60,000 per annum
Behaviourally disengaged
Unaware
Unconcerned
Sceptical
Behaviourally
engaged
Aware
Concerned
Believer
What are my defining characteristics?
• I am more likely to consider myself to be a strong environmentalist
• I am more likely to consider myself to be well informed about the environment
• I am more likely to consider the environment when I decide on my transport options
• I am more likely to be highly aware of the impacts that my family and I have on the environment
However…
• I am more likely to think that climate change is a myth
• I am more likely to think that a lot of threats to the environment are exaggerated
I am more likely to…
• Be concerned about environmental issues in South Australia but consider a number of environmental situations to have become better
• Regularly engage in a number of environmentally friendly behaviors (to a slightly lesser degree than Engaged and Aware)
• Frequent environmental areas in South Australia (but to a lesser degree than Engaged and Aware and in some cases, the Unenlightened)
• Listen to the radio and read newspapers to get information on the environment
22
% o
f th
e p
op
ula
tio
n

South Australians and the Environment 2016 Page 19 of 98
Unenlightened
Who am I more likely to be?
• Those aged under 50, especially skewed to those aged under 30
• Households comprising of a young family, i.e. a single or couple with most children under the age of six
What are my defining characteristics?
• I am are less likely to think I am informed about the environment
• I am more likely to indicate that there are environmental issues they do not understand
• I am are less likely to consider myself to be strong environmentalist
• I am less likely to consider the environment when deciding on my transport options
However…
• I am very unlikely to think that climate change is a myth
I am more likely to…
• Be neither concerned nor unconcerned about environmental issues in South Australia
• Be unsure if some environmental issues facing South Australia have gotten better or worse
• Generally not know what the South Australian Government can do to protect and look after the environment in the next few years (though they were slightly more likely than others to suggest promoting renewable energy)
I am less likely to…
• Regularly engage in activities that are beneficial for the environment • Visit Botanic Gardens, but visit other places in line with the sample average
• Know what the term NRM stands for or be able to name activities NRM Boards undertake
Behaviourally disengaged
Unaware
Unconcerned
Sceptical
Behaviourally Engaged
Aware
Concerned
Believer
28
% o
f th
e p
op
ula
tio
n

South Australians and the Environment 2016 Page 20 of 98
Disengaged
Who am I more likely to be?
• Male • People aged over 50, especially those aged over 60
• Residents of regional South Australia (and those residing on farms)
• Live as a mature couple without children at home • Retirees
• Those who have trade or TAFE qualification as their highest level of education
What are my defining characteristics?
• I am more likely to think that climate change is a myth
• I am less likely to think that there are things they can do to reduce the impacts of climate change
• I am less likely to be interested in environmental issues
• I am much less likely to consider myself a strong environmentalist
• I am less likely to be happy to pay more for environmentally friendly products
• I am less likely to want to interact with nature
I am less likely to…
• Identify any important environmental issues facing South Australia today
• Be concerned about environmental issues in South Australia
• Engage in activities that are beneficial for the environment • Frequent environmental areas in South Australia
• Look for information on the environment • Identify activities NRM Boards in South Australia undertake, although awareness of the
term Natural Resources Management is on par with Concerned Sceptics
• Belong to, volunteer for or be involved with an environmental, land care or similar group
I am more likely to…
• Name mineral wealth including gas/mining as the most important natural resource in South Australia
Behaviourally disengaged
Unaware
Unconcerned
Sceptical
Behavioural Engagement
Aware
Concerned
Believer
15
% o
f th
e p
op
ula
tio
n

South Australians and the Environment 2016 Page 21 of 98
3. PRINCIPAL FINDINGS

South Australians and the Environment 2016 Page 22 of 98
3.1 Environment in the Public Eye
Most Important Issues at a State Level 3.1.1
In order to measure the importance of the environment in relation to other state issues, all 1,000 South Australian residents surveyed were asked what they consider to be the two most important issues at a state level that need attention from the State Government at present1 (unprompted).
The three core issues that need attention from the State Government as identified by respondents were health/hospitals/healthcare (44%) unemployment/ underemployment (29%) and education/schools (21%). The environment ranked 11th, with 4% of respondents naming it among their two most important issues.
Fig.3: Most Important Issues at State Level
1 In analysing the results of a question like this it is important to take into account salient issues within the news and media at the time of the survey (these are discussed in section 1.3 Context).
6%
6%
1%
1%
1%
2%
2%
3%
4%
4%
4%
5%
6%
7%
8%
8%
9%
12%
21%
29%
44%
0% 20% 40% 60% 80% 100%
Don't know/not sure
Other
Immigration
Mining
Marriage equality
Traffic flow/congestion
Taxation
Nuclear waste dump
Crime/law and order/vandalism
Ageing population and associated issues
Environment
Child welfare/protection
Public transport
Government performance
Cost of living
Energy/fuel/nuclear power
Road maintenance
Economy/economic growth
Education/schools
Unemployment/underemployment
Health/hospitals and healthcare
% of respondents (incl. multiple responses)
Q1. What would you say are the two most important issues at a state level that need attention from the State Government at present?
(Base: total sample, n=1000)

South Australians and the Environment 2016 Page 23 of 98
Compared to the total sample, several subgroups were found to be significantly more likely to name the environment among their top two issues, they were:
Regional respondents (7%), especially those residing in the SAMDB NRM Board and regional (i.e. non-metropolitan) AMLR Board catchment areas (both 9%)
Those who live in a rural or remote area on a farm (11%)
Those who volunteer for or belong to land care or environment protection groups (13%)
When focussing on other issues of importance to those surveyed, the following subgroup demographic and geographic subgroup variances were identified:
Gender:
There was a clear gender split in the core issues identified. Males were more likely to name unemployment/underemployment (35% males vs 24% females), economy/economic growth (18% vs 7%) and road maintenance (12% vs 6%). On the other hand, females more likely to name health/hospitals/healthcare (52% vs 36% males), education/schools (28% vs 15%), child welfare/protection (7% vs 3%) and ageing population and associated issues (7% vs 2%).
Age:
Respondents aged 70 and over were more likely to name health/hospitals and healthcare (53%), government performance (13%) and ageing population and associated issues (12%), while those aged between 15 and 29 were more likely to state that they did not know of or were unsure of any important issues that require attention from the State Government at present (14%).
Location:
Residents of regional South Australia (all regional areas) were more likely to raise the issue of road maintenance (13%). Those within the SAMDB NRM Board area were more likely to raise economy/economic growth (19%) and government performance (14%) as issues of concern to them. Regional respondents outside of the AMLR and SAMDB NRM Board areas were significantly more likely to identify the issue of the proposed nuclear waste dump (6%).
Primary versus Secondary State Issues 3.1.2
As respondents were asked to state what they consider to be the two most important issues that need attention from the State Government at present, the following chart distinguishes between respondents primary and secondary responses.
As seen in the following chart health/hospitals/healthcare, unemployment/underemployment were the most common primary responses (27% and 21% of primary responses, respectively). Health/hospitals/ healthcare and education/schools were most common secondary responses (17% and 12% of secondary responses, respectively). Just 2% of those surveyed considered the environment to be the most important issue requiring State Government attention and a further 2% identified the environment as their second most important issue.

South Australians and the Environment 2016 Page 24 of 98
Fig.4: Primary versus Secondary Issues at State Level
Most Important Environmental Issues in South Australia 3.1.3
Respondents were asked what they perceive to be the most important environmental issues in South Australia today. Responses were unprompted and multiple responses were accepted.
The most important environmental issues identified were water supply/conservation/drought (21%), energy/fuel/nuclear power (20%) and water pollution/water quality (19%), each identified by around one fifth of respondents.
Of interest, 16% of respondents were unable to name any important environmental issues facing South Australia today and this response was almost twice as common among respondents aged over 70 (30%).
16%
4%
2%
2%
2%
3%
4%
4%
4%
4%
5%
7%
12%
8%
17%
6%
2%
2%
2%
2%
2%
2%
3%
3%
4%
4%
5%
9%
21%
27%
0% 20% 40% 60% 80% 100%
Don't know/not sure
Other
Ageing population and associated issues
Crime/law and order/vandalism
Environment
Child welfare/protection
Public transport
Energy/fuel/nuclear power
Government performance
Cost of living
Road maintenance
Economy/economic growth
Education/schools
Unemployment/underemployment
Health/hospitals and healthcare
% of respondents
Most important issues at a state level that need attention from the State Government at present?
- First versus second response, main responses only (Base: total sample, n=1000)
First most important
Second most important

South Australians and the Environment 2016 Page 25 of 98
As seen in the chart below, other environmental issues commonly raised were:
Renewable energy (14%)
Forest/bushland preservation/biodiversity issues (13%)
Nuclear dump (12%)
Air pollution/air quality (9%)
Climate change (9%)
Fig.5: Most Important Environmental Issues in SA
There was little variation in the environmental issues raised when analysed by gender. Notable subgroup variations within other demographic and geographic groups are discussed under their respective headings below:
16%
2%
1%
1%
1%
3%
4%
5%
6%
7%
7%
9%
9%
12%
13%
14%
19%
20%
21%
0% 20% 40% 60% 80% 100%
Don't know/not sure
Other
Oceans/beaches preservation/biodiversity issues
Over population
Carbon tax
Parks/open spaces
Development and planning
Other pollution
Land degradation
Waste
Mining
Climate change
Air pollution/air quality
Nuclear dump
Forest/bushland preservation/biodiversity issues
Renewable energy
Water pollution/water quality
Energy/fuel/nuclear power
Water supply/conservation/drought
% of respondents (incl. multiple responses)
Q2. What would you say are the most important environmental issues in South Australia today?
(Base: total sample, n=1000)

South Australians and the Environment 2016 Page 26 of 98
Age
In addition to those aged over 70 being more likely to respond ‘don’t know/not sure’ (mentioned above), those between the ages of 50 and 69 were more likely to state that energy/fuel/nuclear power (26%) as one of their most important environmental issues.
Location
Respondents living in regional South Australia were more likely to name mining (11%), especially those residing in regional areas outside of the AMLR and SAMDB NRM Board areas (17%).
Those residing in the SAMDB NRM Board area were more likely to name water supply/ conservation/drought (36%) and water pollution/water quality (28%). Residents of regional AMLR NRM Board areas (i.e. not metropolitan) were also more likely to name water pollution/water quality (27%) as well as energy/fuel/nuclear power (30%) and renewable energy (21%).
Education
University educated (either undergraduate or postgraduate) individuals were more likely to name renewable energy (20%) and climate change (18%), while those with postgraduate qualifications were also more likely to name forest/bushland preservation/biodiversity issues (20%) and land degradation (11%).
State Environmental Action 3.1.4
Next respondents were asked what they believe is the single most important thing the South Australian Government can do to protect and look after the environment over the next few years. Respondents were unprompted, but only one response was allowed.
One in five respondents (21%) were unable to suggest an environmental action for the South Australian government to undertake. Of the remainder, the most common actions suggested were:
Promote renewable energy (14%)
Address climate change/reduce greenhouse gas emissions (9%)
Not proceed with a nuclear dump (9%)
Protect our water resources/waterways (9%)
o Notably, this response was more likely to be raised by residents of regional South Australia (13%), particularly those residing in the SAMDB NRM Board catchment area (20%)

South Australians and the Environment 2016 Page 27 of 98
Fig.6: Most Important Environmental Government Action
Responses to this question were consistent across gender. However, by age:
Respondents aged under 50 were significantly more likely to suggest that the State Government should promote renewable energy; this response was provided by 19% of 15 to 29 year olds and 18% of 30 to 49 years olds (compared to 11% of 50 to 69 year olds and just 5% of those aged 70 and over).
o A related subgroup; young families (i.e. couples or singles with most children under six) were the subgroup displaying the highest mention of this action (26%)
Those aged 50-69 were significantly more likely to suggest the Government should not proceed with nuclear dump (13%)
Respondents over the age of 70 were more likely to state that they didn’t know or weren’t sure (31%)
21%
6%
1%
1%
1%
1%
1%
2%
2%
3%
3%
4%
4%
5%
5%
9%
9%
9%
14%
0% 20% 40% 60% 80% 100%
Don't know/not sure
Other
Provide more funding/power to enviro agencies
Impose regulations on businesses/industries
Control of non-native pest animals (e.g. rabbits, foxes)
Protect threatened species
Control of native pest animals (e.g. kangaroos, koalas)
Introduce nuclear power
Education/promote discussion/awareness
Reduce water pollution
Invest in more research/consult more experts
Protect native vegetation/flora
Landcare/weed control/erosion control
Maintain our national parks and bushland
Recycle more waste
Protect our water resources/waterways
Not proceed with a nuclear dump
Address climate change/reduce greenhouse emissions
Promote renewable energy
% of respondents
Q3. What would you say is the single most important thing the South Australian Government can do to protect and look after the environment
over the next few years? (Base: total sample, n=1000)

South Australians and the Environment 2016 Page 28 of 98
3.2 Most Important Natural Resources and Responsible Parties
Most Important Natural Resources in South Australia 3.2.1
To examine which of South Australia’s natural resources the population values most, those surveyed were asked what they consider to be the most important natural resources in South Australia. Around one in three respondents named South Australia’s mineral wealth, including gas/mining (33%) and South Australia’s water quality/quantity (30%).
These were followed by South Australia’s food production capability/agriculture/farmland (16%), its national parks/conservation parks/state forests (13%), the River Murray (11%) and the Sun (10%).
Fig.7: Most Important Natural Resources in SA
1%
9%
3%
2%
3%
3%
5%
6%
6%
7%
7%
9%
10%
11%
13%
16%
30%
33%
0% 20% 40% 60% 80% 100%
Don't understand what you mean by natural resources
Don't know/not sure
Other
Soil
Air quality
Fauna/animal life
Other rivers/lakes
Fisheries/Fishing
Landscape
Wind
Flora/plant life
Beaches/oceans
Sun
River Murray
National Parks/Conservation Parks/State Forests
Food production/agriculture/farmland
Water quality/quantity
Mineral wealth, including gas/mining
% of respondents (incl. multiple responses)
Q4. What do you think are the most important natural resources in South Australia?
(Base: total sample, n=1000)

South Australians and the Environment 2016 Page 29 of 98
The following subgroup variances were identified:
Males were more likely to identify South Australia’s mineral wealth as one of its most important natural resources (42% vs 24% females), as were older respondents (38% of those aged 50-69, and 45% of respondents aged over 70) and those in lower income households (i.e. gross household income of less than $60,000 per annum, 40%)
Those aged between 30 and 49 were more likely to name water quality/quantity (40%), while those aged between 15 and 29 were twice as likely to state they didn’t know or were unsure of South Australia’s most important natural resources (18%)
Respondents residing in the SAMDB NRM Board catchment area were almost three times more likely to name the Murray River (30%)
Those surveyed who indicated they were full time/commercial farmers were more likely to name food production/agriculture/farmland as one of South Australia’s most important natural resources (32%)
Responsibility for Natural Resource Management 3.2.2
In an assessment of South Australian’s awareness and understanding of who is responsible for the protection and management of the natural resources in South Australia, all respondents were asked to name who they think is responsible for natural resources in their region.
If respondents named a level of Government but offered no further detail they were asked if they could be more specific (i.e. assessing their ability to name specific departments or organisational bodies within the Government). If the respondent was unable to be more specific these were recorded as the level of Government specified with “no further information”.
As can be seen in the chart that follows, almost half of those surveyed named the State Government (47%) but were unable to identify which department, subdivision or organisational body within the State Government. Similarly, just over one fifth of respondents (22%) placed responsibility with the Federal Government but were unable to provide any further information or detail.
One third of respondents (32%) placed responsibility with Local Government or Local Councils, while 28% stated that “all of us/everyone” is responsible for the protection and management of the environment.
DEWNR (9%) was the most common specific organisational body named (9%), followed by NRM Boards (6%) and the Environmental Protection Authority (4%).

South Australians and the Environment 2016 Page 30 of 98
Fig.8: Perception of Responsibility for Natural Resources in SA
Residents of regional South Australia were significantly more likely to place the responsibility of looking after natural resources with NRM Boards (11%), especially those in the SAMDB NRM area (16%). On the other hand, respondents residing in the Adelaide metropolitan area were significantly less likely to name NRM Boards (4%) and more likely to name the State and Federal Governments – no further information (51% and 25%, respectively).
Other subgroups which showed a higher propensity to name NRM boards included:
Respondents who resided on semi-rural blocks (17%)
Those who live on a rural or remote farm (16%)
Hobby farmers (16%)
Full-time/commercial farmers (19%)
Respondents who belong to or volunteer for land care of another environmental group (16%)
No demographic subgroups were more likely to name DEWNR.
8%
5%
1%
2%
2%
2%
3%
4%
4%
6%
9%
22%
28%
32%
47%
0% 20% 40% 60% 80% 100%
Don't know/not sure
Other
Primary Industries and Regions SA
SA Water
Big business/private sector
Land care/Land management groups
Farmers/landholders
Department of Environment (and Heritage)
Environment Protection Authority
NRM Boards
Department of Environment Water and Natural Resources
Federal Government - no further information
All of us/everyone
Local Government/Councils
State Government - no further information
% of respondents (incl. multiple responses)
Q5. Who do you think is responsible for looking after natural resources like water, soil, native vegetation and coasts in your region?
(Base: total sample, n=1000)
2% AMLR NRM Board 1% SAMDB NRM Board 3% NRM Boards – no further information

South Australians and the Environment 2016 Page 31 of 98
There were no gender differences observed in the responses to this question, however, when analysed by age, the following significant variances were identified:
Respondents between the ages of 15 and 29 were more likely to state they didn’t know or were unsure (12%)
Those aged between 30 and 49 were more likely to say “all of us/everyone” (34%)
50 to 69 year olds were more likely to identify the now defunct Department of Environment and Heritage (7%)

South Australians and the Environment 2016 Page 32 of 98
3.3 Concern for and Perceptions of Environmental Issues in South Australia
General Level of Concern 3.3.1
The vast majority of South Australians surveyed (72%) indicated they were concerned about environmental issues in South Australia to some degree; 24% stated that they were very concerned, while 48% were quite concerned.
On the other hand, a total of 14% indicated a lack of concern with environmental issues in South Australia (12% ‘not very concerned’ and 2% ‘not at all concerned’). The remaining 15% of respondents were on the fence or unsure2.
Fig.9: Level of Concern about Environmental Issues in SA
Compared to the total sample, demographic subgroups which were significantly more likely to be concerned about environmental issues in South Australia to some extent (i.e. either very concerned or quite concerned) were:
Females (74% vs 68% of males)
Residents of the SAMDB NRM Board area (81%)
Respondents aged between 50 and 69 years old (78%)
Those residing in lone person households (80%)
Respondents who belong to, or volunteer for land care or another environmental group (88%)
2 Please note that it is not usual to group neutral and unsure responses, however it was done in this case so that this question could be included in the Segmentation Analysis (see Section 4).
0%
20%
40%
60%
80%
100%
Veryconcerned
Quiteconcerned
Neutral/unsure
Not veryconcerned
Not at allconcerned
24%
48%
15% 12%
2%
% o
f re
spo
nd
ents
Q6. In general, how concerned are you about environmental issues in South Australia?
(Base: total sample, n=1000)

South Australians and the Environment 2016 Page 33 of 98
Subgroups which were more likely to be unconcerned to some extent (i.e. either ‘not very’ or ‘not at all’ concerned) were:
Males (17%)
Those aged 15 to 29 years old (22%)
Respondents residing in inner suburban Adelaide - i.e. within 10km of the CBD (19%)
In a further level of analysis, the results of this question were also analysed by Question 2 (“What would you say are the most important environmental issues in South Australia today?”). Those who considered climate change, the proposed nuclear waste dump and forest/bushland preservation/biodiversity to be one of the two most important environment issues in South Australia today were significantly more likely to be concerned about environmental issues in South Australia (88%, 82% and 81% ‘very’ or ‘quite’ concerned, respectively). On the other hand, respondents who were unsure of any important environmental issues facing South Australia in Question 2 were more likely to be unconcerned (24%)
Reasons Unconcerned 3.3.2
Of those who indicated they were unconcerned about environmental issues in South Australia (n=140), one in three (32%) reasoned they feel this way because they perceive the condition of the environment is good/well managed whilst one in five (20%) stated they feel that way because environmental issues do not impact them personally.
Fig.10: Reasons for Lack of Environmental Concern
3%
4%
5%
5%
6%
9%
10%
12%
13%
20%
32%
0% 20% 40% 60% 80% 100%
Don't know/not sure
Other
I do not have the information or knowledge
I am already doing enough/all I can
Not interested /not care about the environment
Someone else is taking care of it
It is beyond my control
The problem is not as bad as they say/issues are exaggerated
It is a low priority for me compared to other things
Does not impact me personally
The condition of the environment is good/is well managed
% of respondents
Q6A. For what reasons would you say that you are not concerned about environmental issues?
(Base: not concerned about environmental issues, n=140)

South Australians and the Environment 2016 Page 34 of 98
Due to the smaller number of respondents who qualified for this question, individual subgroups were not large enough to be able to reliably identify significant differences between the subgroups, with one exception; respondents residing in inner suburban Adelaide (i.e. within 10km of the CBD) were significantly more likely to provide the reason that “it is beyond my control” (17%).
Perceived Change in Environmental Situations in South Australia 3.3.3
All respondents were then assessed on their perceptions of progress or regression regarding environmental issues in South Australia. This was accomplished by asking if they thought South Australia had generally become much better, a bit better, a bit worse, much worse or if there had been little or no change in reference to nine specific environmental situations. The order in which the situations were assessed was randomised for each participant.
For almost all environmental situations assessed the general consensus was that things have become better to some extent. The following environmental situations received the highest proportions of ‘better’ responses:
Reducing water over consumption (55% ‘much better’ or ‘a bit better’)
Maintaining healthy rivers, streams and wetlands (55%)
Using alternatives to motor vehicles (51%)
Using our soils, plants and water sustainably (51%)
The one exception to the general consensus was in regards to ‘adapting to climate variability, where the most common evaluation was that there had been ‘little or no change’ in this area (48% vs 34% ‘better’ and 10% ‘worse’).
Although still a minority response, the environmental situations which achieved the highest proportions of ‘worse’ responses were ‘conserving the marine environment’ and ‘producing food sustainably’ (16% and 18% ‘a bit worse’ or ‘much worse’, respectively).

South Australians and the Environment 2016 Page 35 of 98
Fig.11: Perceived Changes in Environmental Situations in SA
When analysed by demographic and geographic subgroups a vast number of significant variations in responses were identified. Therefore, the following table simplifies these results by displaying which subgroups were significantly more likely to consider a situation to have become better to some extent (i.e. ‘a bit better’ or ‘much better’) and those which were significantly more likely to consider a situation to have become worse to some extent (i.e. ‘a bit worse’ or ‘much worse’).
4%
10%
12%
9%
10%
11%
12%
11%
14%
30%
32%
33%
39%
38%
40%
39%
44%
41%
48%
33%
36%
34%
27%
31%
31%
27%
28%
7%
12%
6%
9%
11%
8%
9%
9%
9%
3%
6%
5%
3%
5%
4%
7%
5%
4%
7%
6%
9%
6%
8%
6%
3%
5%
4%
0% 20% 40% 60% 80% 100%
Adapting to climate variability
Producing food sustainably
Protecting and conservingendangered plants and animals
Reducing greenhouse emissions
Conserving the marine environment
Using our soils, plants and watersustainably
Using alternatives to motor vehicles,such as public transport, cycling or walking
Maintaining healthy rivers,streams and wetlands
Reducing water over consumption
% of respondents
Q7. Change in environmental situations in South Australia (Base: total sample, n=1000)
Much better A bit better Little or no change A bit worse Much worse Don't know/not sure

South Australians and the Environment 2016 Page 36 of 98
Better Worse
Reducing water over consumption
Semi-rural residents (66%) Postgraduate education (64%)
70+ year olds (22%) Regional residents (all areas, 17%)
Rural town residents (19%) Lower income earners (16%)
Maintaining healthy rivers, streams and wetlands
Regional AMLR area residents (64%) 50-69 year olds (59%)
Semi-rural residents (64%) Mature couples (62%)
Mature families (22%)
Using alternatives to motor vehicles, such as public transport, cycling or walking
Metro residents (55%) 15-29 year olds (62%)
Inner suburban residents (60%) Students (68%) Renters (59%)
Outer suburban residents (21%) Home owners (17%)
Mature couples (20%) Lower income earners (19%)
Using our soils, plants and water sustainably
Males (55%) 50-69 year olds (57%)
Full time/commercial farmers (65%)
TAFE/Trade education (17%)
Conserving the marine environment
Males (54%) Lifestyle/hobby farmers (63%)
Mature couples (54%) Full time workers (56%)
50-69 year olds (20%) Lone person households (22%) Lower income earners (19%)
Reducing greenhouse emissions
50-69 year olds (53%) Mature couples (54%)
Retirees (56%)
Lone person households (18%)
Protecting and conserving endangered plants and animals
50-69 year olds (51%) Mature couples (53%)
Retirees (52%) Secondary school education (50%)
Regional AMLR area residents (19%) Semi-rural residents (17%)
Lone person households (17%) Belong to enviro group (20%)
Producing food sustainably
Regional (excl. AMLR/SAMDB, 55%) Rural town residents (50%)
Lifestyle/hobby farmers (51%) Full time/commercial farmers (58%)
Outer suburban residents (22%) Lone person households (25%) Lower income earners (24%)
Adapting to climate variability 50-69 year olds (40%) Mature couples (43%)
Retirees (42%)
SAMDB area residents (18%) Undergraduate education (15%)
Households of unrelated adults (20%) Lower income earners (14%)
Fig.12: Perceptions of Environmental Situations Subgroup Differences
In the case of this question a higher incidence of ‘don’t know/not sure’ responses among any given subgroup is also informative as it implies a lack of knowledge of the environmental issue assessed. Therefore, the following table displays the demographic and geographic subgroups which were significantly more likely to give a ‘don’t know/not sure’ response when asked to assess a given environmental situation.

South Australians and the Environment 2016 Page 37 of 98
Don’t know
Reducing water over consumption 15-29 year olds (7%) Young couples, no children (10%)
Maintaining healthy rivers, streams and wetlands 70+ year olds (11%) Young couples, no children (10%)
Using alternatives to motor vehicles, such as public transport, cycling or walking
Regional residents (all areas, 6%) SAMDB area residents (9%)
Part time workers (6%)
Using our soils, plants and water sustainably Females (9%)
Conserving the marine environment Students (21%)
Reducing greenhouse emissions
70+ year olds (13%)
Protecting and conserving endangered plants and animals Inner suburban residents (12%)
Producing food sustainably 15-29 year olds (9%) Students (12%)
Adapting to climate variability Lone person households (12%)
Fig.13: Perceptions of Environmental Situations Subgroup Differences - Don’t Know

South Australians and the Environment 2016 Page 38 of 98
3.4 Environmental Behaviours
Frequency of Environmentally Friendly Behaviours 3.4.1
In an assessment of South Australian’s engagement in environmentally friendly behaviours, all respondents were asked how often (often, sometimes, occasionally or never) they had participated in ten environmentally friendly behaviours.
Overall, the South Australian residents surveyed appeared to engage in environmentally friendly behaviours reasonably frequently. Out of the ten behaviours assessed, the majority of those surveyed stated they had often participated in the following five behaviours:
Avoided putting oil/fat/turps/paints or chemicals down the sink, drain or toilet (87%)
Taken steps to reduce their energy consumption (72%)
Reduced the amount of waste their household throws out (68%),
Made an effort to reduce their water consumption (60%), and
Chosen household products that are better for the environment (55%)
Although the proportion undertaking these behaviours often was lower, the majority of respondents had at least sometimes grown some of their own food (53%) and 49% had at least sometimes bought food from a farmers market.
The activities with the lowest engagement were:
Attending tree planting or other volunteer environmental event (77% of respondents had never undertaken this activity in the past 12 months)
Tring to encourage someone else to change an activity or practice they thought was harmful to the environment (36%)
Of note, the incidence of engaging in the compositing of food or garden refuse, or using a worm farm was relatively evenly split across respondents, with 47% stating they had undertaken this activity often in the past 12 months, while 40% had not engaged in this behaviour at all.

South Australians and the Environment 2016 Page 39 of 98
Fig.14: Participation in Environmental Behaviours
7%
20%
27%
36%
47%
55%
60%
68%
72%
87%
6%
25%
22%
17%
6%
23%
20%
17%
14%
5%
10%
18%
23%
15%
7%
11%
10%
8%
7%
4%
77%
36%
27%
31%
40%
9%
9%
6%
5%
4%
1%
1%
1%
1%
0% 20% 40% 60% 80% 100%
Attended a tree planting or other environmental volunteer event
Tried to encourage someone else to change an activity or practice that you thought washarmful to the environment
Bought food from a farmers markets
Grown at least some of your own food
Composted food or garden refuse, or used a worm farm
Chosen household products that are better for the environment
Made an effort for environmental reasons to reduce water consumption
Reduced the amount of waste your household throws out
Taken steps to reduce your energy consumption
Avoided putting things like oil, fat, turps, paint or chemicals down the sink, drain or toilet
% of respondents
Q8. In the past twelve months, how often have you participated in the following activities: (Base: total sample, n=1000)
Often Sometimes Occasionally Never Don't know/not sure

South Australians and the Environment 2016 Page 40 of 98
The following table displays the subgroups which were significantly more likely to have ‘often’ engaged in a given behaviour in the last 12 months and those which were significantly more likely to have ‘never’ undertaken a given behaviour:
More likely to have often undertaken
behavior in past 12 months More likely to have never undertaken
behavior in past 12 months
Avoided putting things like oil, fat, turps, paint or chemicals down the sink, drain or toilet
Rural town residents (91%) Mature couples (91%)
70+ year olds (7%)
Taken steps to reduce your energy consumption
50-69 year olds (78%) TAFE/Trade education (78%)
Mature couples (78%) Retirees (77%)
Belong to enviro group (83%)
Higher income earners (10%)
Reduced the amount of waste your household throws out
Females (72%) 50-69 year olds (73%)
SAMDB area residents (77%) Lifestyle/hobby farmers (77%)
Mature couples (76%) Retirees (73%)
Belong to enviro group (83%)
Rural/remote farm residents (13%) Households of unrelated adults (14%)
Higher income earners (13%)
Made an effort for environmental reasons to reduce water consumption
Females (65%) 50-69 year olds (71%)
Regional residents (all areas, 68%) SAMDB area residents (78%) Lifestyle/hobby farmers (77%)
Rural/remote farm residents (72%) Semi-rural residents (71%) Rural town residents (67%)
Postgraduate education (69%) Lone person households (69%)
Retirees (68%) Belong to enviro group (72%)
15-29 year olds (15%) Full-time workers (12%)
Higher income earners (15%)
Chosen household products that are better for the environment
Females (61%) Regional AMLR area residents (68%)
Semi-rural residents (75%) Lifestyle/hobby farmers (72%)
Mature couples (62%) Retirees (60%)
Belong to enviro group (70%)
15-29 year olds (16%) Students (19%)
Composted food or garden refuse, or used a worm farm
SAMDB area residents (57%) Semi-rural residents (61%)
Lifestyle/hobby farmers (74%) Mature couples (56%)
Retirees (54%) Home owners (50%)
Belong to enviro group (73%)
15-29 year olds (47%) Households of unrelated adults (54%)
Lone person households (48%)

South Australians and the Environment 2016 Page 41 of 98
More likely to have often undertaken
behavior in past 12 months More likely to have never undertaken
behavior in past 12 months
Grown at least some of your own food
Regional residents (all areas, 52%) SAMDB area residents (58%)
Regional AMLR area residents (57%) Regional (excl. AMLR/SAMDB, 47%)
Semi-rural residents (52%) Rural town residents (45%)
Rural/remote farm residents (73%) Home owners (40%)
Mature couples (42%) Belong to enviro group (48%)
Metro residents (35%) 70+ years old (48%)
Renters (41%) Lone person households (43%)
Households of unrelated adults (41%) Retirees (45%)
Lower income earners (38%)
Bought food from a farmers markets
Regional AMLR area residents (39%) 30-49 year olds (31%)
Lifestyle/hobby farmers (38%) Young couples, no children (39%)
70+ year olds (42%) Lone person households (46%)
Retirees (36%) Lower income earners (35%)
Tried to encourage someone else to change an activity or practice that you thought was harmful to the environment
Females (23%) Lifestyle/hobby farmers (29%) TAFE/Trade education (24%) Belong to enviro group (33%)
70+ year olds (54%) Secondary school education (48%)
Lone person households (50%) Retirees (48%)
Lower income earners (46%)
Attended a tree planting or other environmental volunteer event
Males (9%) 59-69 year olds (9%)
Semi-rural residents (13%) Rural/remote farm residents (14%)
Lifestyle/hobby farmers (16%) Full time/commercial farmer (19%)
Belong to enviro group (37%)
Metro residents (79%) Renters (82%)
Fig.15: Participation in Environmental Behaviours Subgroup Differences

South Australians and the Environment 2016 Page 42 of 98
Triggers of Environmental Behaviours 3.4.2
Of the behaviours a respondent said they undertake ‘often’ or ‘sometimes’, one behaviour was randomly selected and they were asked what had prompted them to start this activity.
As can be seen from the table that follows, concern for the environment was the most common driving force or ‘trigger’ overall, it was the most common reason given for initiating the following behaviours:
Avoiding putting oil/fat/turps/paints/chemicals down sinks and toilets
Reducing household waste
Choosing products that are better for the environment
Composting food or garden refuse, or using a worm farm
Trying to encourage someone else to change an activity or practice that they thought was harmful to the environment
Attending a tree planning or other environmental volunteer event
‘To save money’ was the overwhelmingly dominant reason provided for reducing energy consumption (88%). It was also the one of the three main reasons behind making an effort to reduce their water consumption (39%), along with ‘concern for the environment’ (29%) and ‘drought’ (29%).
On the other hand the most common reasons behind growing some of their own food were ‘personal benefit’ (54%) and ‘lifestyle/hobby’ (43%). ‘Personal benefit’ (34%) and ‘lifestyle/hobby’ (32%) were the two of the most common reasons behind starting to buy food from farmers markets, other than ‘to support the local community’ (39%).

South Australians and the Environment 2016 Page 43 of 98
Behaviour
Avoided putting
things like oil, fat, turps,
paint or chemicals down the
sink, drain or toilet
(n=135)3
Taken steps to reduce
your energy consumption
(n=162)
Reduced the amount of waste your household throws out
(n=137)
Made an effort for
environmental reasons to reduce water consumption
(n=154)
Chosen household
products that are better for
the environment
(n=156)
Composted food or garden
refuse, or used a worm
farm (n=59)
Grown at least some of your own
food (n=72)
Bought food from a
farmers markets (n=59)
Tried to
encourage someone
else to change an activity or
practice that you thought was harmful
to the environment
(n=50)
Attended a tree planting
or other environmental volunteer
event (n=10)
Wha
t pro
mpt
ed th
e ac
tivity
Concern for the environment 55% 24% 57% 29% 63% 46% 9% 4% 69% 52%
Save money 1% 88% 10% 39% 6% 1% 20% 22% 5% 0%
Personal benefit 13% 7% 16% 11% 16% 21% 54% 34% 6% 24%
Because I care 13% 5% 23% 14% 15% 10% 3% 3% 27% 0%
Lifestyle/hobby 11% 3% 9% 6% 8% 22% 43% 32% 6% 13%
Education 16% 3% 8% 6% 7% 9% 13% 0% 7% 20%
Drought 0% 0% 0% 29% 0% 0% 0% 0% 3% 0%
Change the behaviours of others 0% 2% 5% 5% 3% 2% 2% 1% 30% 11%
Support the local community 1% 0% 2% 0% 0% 0% 1% 39% 1% 4%
Clogs/not good for pipes/septic tank 10% 0% 0% 0% 2% 0% 0% 0% 0% 0%
Quality of food/healthier 0% 0% 0% 0% 0% 0% 7% 17% 0% 0%
Legal requirements 2% 1% 0% 2% 0% 0% 0% 0% 0% 0%
Other 2% 2% 6% 3% 6% 10% 2% 1% 0% 0%
Don't know/not sure 2% 1% 3% 2% 2% 0% 0% 0% 0% 0%
Fig.16: Motivators/Triggers of Environmental Behaviours by Behaviour
3 n= is the number of respondents who said they perform the behaviour ‘often’ or ‘sometimes’ and were asked the question in regards to that behaviour (via random selection).

South Australians and the Environment 2016 Page 44 of 98
Barriers to Environmental Behaviours 3.4.3
Of the behaviours a respondent said they undertake ‘occasionally’ or ‘never’, one behaviour was randomly selected and the participant was asked for what reason they find that activity difficult to do or difficult to do more often4. The results are displayed on the table that follows,
Across all behaviours the most common barrier to was that it is simply too difficult to do, with no further information provided, this was the most common reason provided for the following behaviours:
Composting food or garden refuse, or using a worm farm
Growing at least some of your own food
Trying to encourage someone else to change an activity or practice that you thought was harmful to the environment
Buying food from a farmers markets (although this was closely followed by too far to go – distance)
Reducing the amount of waste your household throws out
Avoiding putting things like oil, fat, turps, paint or chemicals down the sink, drain or toilet
Cost was identified as the main barrier preventing respondents from choosing household products that are better for the environment and reducing their energy consumption (presumably in reference to the cost of converting to power saving devices, appliances and lighting options).
Lastly, “I already do all I can” was the dominant barrier to reducing water consumption.
Of note, some respondents stated they were “already doing all I can”, “doing something else instead” or “I haven’t needed to/the situation hadn’t arisen” in regards to some activities. This indicates that some of the ‘occasionally’ or ‘never’ responses were not because the participant did not engage in the behaviour but because they are unable to do more than they are currently (e.g. had already reduced their water consumption as much as possible) or are doing something else which negated the need for that behaviour (e.g. feeding food waste to chickens instead of composting) or they had not had the opportunity to engage in such a behaviour. Therefore the proportion of respondents who engage in environmentally friendly behaviours is likely to be somewhat underestimated in the current research.
4 Please note the randomiser excluded “attended a tree planting or other environmental volunteer event”. As most people have only occasionally or never attended such an event it was selected at a much greater frequency by the randomiser during pilot testing and greatly reduced the selection of other behaviours. Therefore it was removed to achieve a better understanding of the barriers behind the other, more common, environmental behaviours.

South Australians and the Environment 2016 Page 45 of 98
Behaviour
Composted food or garden
refuse, or used a worm
farm (n=177)
Tried to
encourage someone else to change an
activity or practice that you thought was harmful
to the environment
(n=192)
Grown at least some of
your own food
(n=151)
Bought food from a
farmers markets (n=167)
Chosen household
products that are better for
the environment
(n=64)
Made an effort for
environmental reasons to
reduce water consumption
(n=48)
Reduced the amount of waste your household throws out
(n=36)
Taken steps to reduce
your energy consumption
(n=34)
Avoided putting things
like oil, fat, turps, paint or
chemicals down the
sink, drain or toilet
(n=19)
Rea
son
don'
t do
activ
ity
Too difficult to do 40% 43% 55% 33% 20% 22% 39% 14% 38%
Don't have time 16% 4% 14% 19% 6% 6% 4% 6% 27%
Doing something else instead 7% 3% 4% 10% 6% 7% 6% 2% 7%
Lack of tools 6% 0% 3% 0% 4% 0% 0% 0% 2%
Health reasons 1% 0% 5% 0% 0% 0% 0% 0% 0%
Don't have enough help 3% 0% 1% 0% 0% 0% 0% 0% 0%
Already do all I can 1% 0% 1% 0% 0% 25% 4% 15% 0%
Haven't needed to/situation hasn't arisen 0% 15% 0% 0% 0% 0% 0% 0% 0%
Other things are more important 4% 5% 1% 3% 10% 1% 5% 23% 0%
Don't have enough information 7% 2% 1% 3% 19% 3% 5% 0% 0%
Not enough space/not allowed 9% 0% 10% 0% 0% 0% 2% 4% 0%
Not enough impact to warrant the time 9% 9% 2% 4% 9% 14% 9% 13% 0%
Cost too much/finances 1% 0% 8% 7% 22% 20% 0% 32% 0%
Too far to go - distance 1% 2% 1% 31% 0% 0% 0% 2% 0%
Other 5% 9% 6% 3% 5% 5% 11% 2% 0%
Don't know/not sure 4% 10% 1% 2% 9% 6% 19% 0% 25%
Fig.17: Barriers/Difficulties Participating in Environmental Behaviours by Behaviour

South Australians and the Environment 2016 Page 46 of 98
Visitation of Environmental Areas 3.4.4
In an assessment of how often South Australians frequent nature areas within South Australia, all respondents were asked how often they had visited the following five environmental areas of interest in the past 12 months.
1. Any beach or ocean
2. Botanic gardens
3. Local parks
4. National Parks/Conservation Parks/State Forests
5. The River Murray
As would perhaps be expected, local parks and beaches/oceans had the highest visitation overall. Nine in ten respondents had visited each of these locations at least once in the past 12 months (89% and 90% respectively). Just over three quarters of respondents (77%) had visited a national park, conservation park or state forest at least once in the past 12 months.
Local parks also saw the highest frequency of visitation; 62% of respondents stated they had visited a local park many times in the past 12 months and a further 20% had visited at least a few times. Almost half of the South Australian’s surveyed frequent beaches regularly (48%) and just over one fifth were regular visitors to national parks, conservation parks or state forests (22% indicated they had visited many times in the last 12 months).
The areas which displayed the lowest overall visitation and frequency of visitation were the River Murray and Botanic Gardens; less than 15% of the total sample indicated they regularly visit these areas, while around four in ten had not visited these areas in the last 12 months (44% had not visited the River Murray and 42% had not visited Botanic Gardens).

South Australians and the Environment 2016 Page 47 of 98
Fig.18: Frequency of Visitation to Environmental Areas
Again there were there were a vast number of demographic and geographic differences in the visitation of environmental areas. The following table displays the subgroups which were significantly more likely to have visited a given area many times in the past 12 months and those which were significantly more likely to have not visited the areas at all in the past 12 months.
More likely to have visited many times
More likely to have not visited at all
Park in a local area Metro residents (64%) 30-49 year olds (73%)
Postgraduate education (73%) Young families (84%) Middle families (77%)
Higher income earners (76%) Belong to enviro group (76%)
50-69 year olds (14%) 70+ year olds (25%)
Lone person households (23%) Retirees (22%)
Mature couples (15%) Rural/remote farm residents (18%)
Any beach or ocean Regional (excl. AMLR/SAMDB, 56%) 30-49 year olds (55%)
Young couples, no kids (64%) Young families (62%)
Higher income earners (65%) Full time workers (53%)
SAMDB area residents (28%) Lone person households (19%)
Retirees (15%) Lower income earners (16%)
9%
13%
22%
48%
62%
19%
18%
29%
28%
20%
30%
25%
26%
15%
7%
42%
44%
24%
10%
11%
0% 20% 40% 60% 80% 100%
Botanic Gardens
The River Murray
National Park/Conservation Park/State Forest
Any beach or ocean
Park in local area
% of respondents
Q9. How often have you visited the following places in the past twelve months?
(Base: total sample, n=1000)
Many times A few times Once or twice Not at all

South Australians and the Environment 2016 Page 48 of 98
More likely to have visited many times
More likely to have not visited at all
National Park/ Conservation Park/ State Forest
30-49 year olds (27%) Lifestyle/hobby farmers (29%) Postgraduate education (30%)
Full time workers (29%) Middle income earners (28%) Belong to enviro group (35%)
50-69 year olds (28%) 70+ year olds (58%)
Lone person households (43%) Pensioners (41%)
Lower income earners (37%) Rural town residents (32%)
The River Murray Regional residents (all areas, 26%) SAMDB area residents (59%) Rural town residents (24%)
Rural/remote farm residents (28%) TAFE/Trade education (19%) Middle income earners (17%) Belong to enviro group (24%)
Metro (48%) 70+ year olds (56%)
Lone person households (53%) Retirees (50%)
Lower income earners (53%)
Botanic Gardens Belong to enviro group (22%) Regional residents (all areas, 58%) Regional (excl. AMLR/SAMDB, 65%) Regional AMLR area residents (51%)
SAMDB area residents (53%) Rural town residents (59%)
Rural/remote farm residents (52%) 50-69 year olds (47%) 70+ year olds (63%)
Lone person households (55%) Retirees (54%)
Fig.19: Frequency of Visitation to Environmental Areas Subgroup Differences

South Australians and the Environment 2016 Page 49 of 98
3.5 Awareness and Understanding of NRM
Respondents were asked a series of questions to assess their awareness of the term NRM, what the letters stand for and the function of NRM Boards in South Australia.
Awareness of the Term NRM 3.5.1
In the first of these questions all respondents were asked if they had heard of the term NRM. Three in ten South Australian’s surveyed had (30%), 4% were unsure and the remainder 66% indicated they had not.
Fig.20: Heard of Term NRM
Demographic and geographic subgroups which were significantly more likely to have heard of the term NRM were:
Males (34%)
Respondents aged 30 to 49 (37%)
Those who reside in regional areas of South Australia (46%) and the following related subgroups:
o Full time/commercial farmers (82%), Lifestyle/hobby farmers (50%) and those residing on rural/remote farms (65%)
o Residents of regional areas outside of the AMLR and SAMDB NRM Board areas (47%)
o Those within the SAMDB NRM Board area (47%)
o Those within the regional AMLR NRM Board area (42%)
o Respondents residing in semi-rural areas, with, larger blocks of land in between (44%)
o Those residing in rural townships (39%)
Those with a university education (37% of undergraduates and 40% of postgraduates)
Those in full time employment (44%)
Respondents from upper and middle income households (42% and 35% respectively)
Those who belong to or volunteer for land care or other environmental group (49%)
30%
66%
4%
Q10. Have you heard of the term NRM? (Base: total sample, n=1000)
Yes
No
Don't know/not sure

South Australians and the Environment 2016 Page 50 of 98
Subgroups which were significantly less likely to have heard the term were:
Females (27%)
15 to 29 year olds (13%)
Those residing in metropolitan South Australia (25%), including the related subgroups:
o Inner suburban residents (i.e. within 10km of the CBD, 22%)
o Outer suburban residents (i.e. >10km from the CBD but still metropolitan, 25%)
Those residing in a group household of unrelated adults (20%)
Those from whom secondary school is their highest level of education (14%)
Students (7%)
Lower income households (25%)
Identification of the Term NRM 3.5.2
Those who indicated their awareness of the term NRM (n=302) were then asked to state what the letters stand for. Almost three quarters (72%), were able to correctly identify Natural Resources Management, while just over one in ten (13%) provided an incorrect account of the acronym (the most common of which being National Resources Management, 11%) and the remainder (16%) were unsure.
Fig.21: Identification of NRM Initialism
Retired respondents, those in lower income households and those who stated that secondary school was their highest level of education were significantly less likely to correctly identify Natural Resources Management (55%, 61% and 60% correct respectively).
0%
20%
40%
60%
80%
100%
NaturalResources
Management
NationalResources
Management
Other Don't know/notsure
72%
11% 2%
16%
% o
f re
spo
nd
ents
Q11. Can you tell me what the letters NRM stand for? (Base: heard of term NRM, n=302)

South Australians and the Environment 2016 Page 51 of 98
Overall Awareness of NRM 3.5.3
The findings of the previous two questions were combined to provide a total sample overview of the awareness of NRM and the ability to correctly identify it as standing for Natural Resources Management among the South Australian’s surveyed.
As seen in the pie chart below, when expressed as a proportion of the total sample 22% of South Australian’s surveyed had heard of the term NRM and were able to correctly identify it as standing for Natural Resources Management. A further 8% were aware of the term but unable to correctly state what it stands for and a final 70% were either unaware or were not sure of their awareness of the term NRM prior to the survey.
Fig.22: Overall Awareness of NRM
Subgroups which were significantly more likely to have heard of the term NRM and correctly identify the Natural Resources Management were:
Males (25% males vs 18% of females)
Respondents aged between 30 and 49 (28% vs just 10% of 15 to 29 year olds)
Regional respondents (34% of all regional residents vs 17% of metropolitan residents) and the following related subgroups:
o The regional AMLR NRM Board area (33%)
o The SAMDB NRM Board area (35%)
o Other regional areas outside of the AMLR and SAMDB NRM Board areas (37%)
o Semi-rural areas, with, larger blocks of land in between (30%)
o Rural townships (28%)
o Rural/remote farms (54%)
o Lifestyle/hobby farmers (37%) and
o full time/commercial farmers (67%)
Those who indicated their highest level of education was a university qualification (31% of each undergraduates and postgraduates vs 14% of those with a secondary school education)
22%
8%
70%
Overall awareness of NRM (Base: total sample, n=1000)
Heard of the term NRMand correctly identifiedinitialism
Heard of the term NRMbut unable to correctlyidentify initialism
Not heard of/unsure ifheard of the term NRM

South Australians and the Environment 2016 Page 52 of 98
Those in full time employment (34% vs 7% of students and 14% of retirees)
Respondents from higher and middle income households (33% and 28% respectively compared to 15% of lower income households)
Those who belong to or volunteer for land care or other environmental group (39%)
Awareness of NRM Board Activities 3.5.4
Those who had not heard of the term NRM or had incorrectly identified the basis of the initialism in the previous questions were informed that NRM stands for Natural Resources Management before proceeding. All respondents were then asked “What activities do you think the Natural Resources Management Boards in South Australia undertake?”
The most common activity attributed to NRM Boards as identified by respondents was “look after/manage water resources (quality and quantity)”, which was identified by one third of the total sample (33%). The second most common was “look after/manage national parks/conservation parks” (29%). Other activities more identified by at least 10% of respondents were:
“Protect native vegetation” (20%)
“Look after/manage coast/marine ecosystems” (18%)
“Look after/manage the River Murray” (16%)
“Protect native birds and animals” (12%)
“Support/work with landholders, sustainability of food/agricultural production/land” (11%)
An ‘other’ response were provided by 5% of respondents (or n=51 individuals). These responses included answers that were either too general to classify (e.g. “save the environment”, “reduce waste”), were negative (e.g. “take all our money”) or displayed an incorrect understanding of activities NRM Boards undertake (e.g. “check on local solar panel manufacturers and suppliers to make sure they are doing fair deals”). A full list of these responses is supplied in a document supplementary to this report.

South Australians and the Environment 2016 Page 53 of 98
Fig.23: Activities NRM Boards Undertake
29%
5%
3%
3%
4%
4%
4%
5%
5%
8%
9%
11%
12%
16%
18%
20%
29%
33%
0% 20% 40% 60% 80% 100%
Don't know/not sure
Other
Education - Youth/schools
Provide information (brochures, Facebook, newspapers, etc.)
Education - Landholder training and information
Support/work with - Environmental groups
Water Allocation Planning
Control - Pest animals
Support/work with - Local government on environmental outcomes
Control - Pest plants/weeds
Environmental compliance - impose fines and prosecutions
Support/work with - Landholders, sustainability of food/agricultural…
Protect - Native birds and animals
Look after/manage - River Murray
Look after/manage - Coast/marine ecosystems
Protect - Native vegetation
Look after/manage - National parks/conservation parks
Look after/manage - Water Resources (quality and quantity)
% of respondents
Q12. What activities do you think the Natural Resources Management Boards in South Australia undertake? (Base: total sample, n=1000)

South Australians and the Environment 2016 Page 54 of 98
Respondents residing in metropolitan Adelaide were slightly (yet significantly) more likely to not be able to name any activities undertaken by NRM Boards in South Australia (32% don’t know/not sure), whereas regional respondents were more likely to name at least one activity (24% don’t know/not sure).
Results were consistent across respondents residing in regional AMLR and SAMDB NRM Board areas, however, compared to the total sample those residing in regional areas outside of the AMLR and SAMDB NRM Board areas were significantly more likely to name four activities, these were:
“Control pest plants/weeds” (17% vs 8% of the total sample)
“Protect native birds and animals” (17% vs 12%)
“Control pest animals” (11% vs 5%)
“Support/work with environmental groups” (8% vs 4%)
By age and gender, there were only two significant differences of note:
Males were more likely to indicate that NRM Boards “support and work with landholders in regards to the sustainability of food, agricultural production and their land” (15% males vs 8% females)
Compared to the total sample, respondents aged 70 and over were much more likely to say that NRM Boards in South Australia “protect native birds and animals” (21% vs 12%)
3.5.4.1 Awareness of Youth/School Education
Respondents who indicated that Natural Resource Management Boards in South Australia undertake education with youth or schools (n=28, or 3% of all respondents) were asked how they became aware of this function of NRM Boards.
The main source of such education programs was via a respondents work as school teacher or being related to a school teacher. Other minority sources included through their children/children’s school, through a local library or community group, via advertising and via some other connection/affiliation with NRM Boards or NRM Board staff.

South Australians and the Environment 2016 Page 55 of 98
3.6 Environmental Information
Sources of Environmental Information 3.6.1
In order to examine the sources through which South Australians gather information on the environment, all respondents were asked where they go when looking for such information. Respondents were encouraged to give multiple sources if applicable.
As seen in the chart below, the overwhelming majority (75%) of those surveyed use the internet to search for information on the environment and this was mentioned more than five times as often as any other source. While only mentioned by small proportions of respondents, other sources of information used more commonly included Local Council (14%), word of mouth (8%), books/library/magazines (6%) and newspapers (6%).
Fig.24: Sources of Environmental Information
When analysed by gender there was only one observation of note, with almost one in five females indicating they look for such information via the Local Council (17%) compared to one in ten males (11%).
1%
6%
4%
2%
2%
2%
2%
2%
2%
4%
6%
6%
8%
14%
75%
0% 20% 40% 60% 80% 100%
Don't look for such information
Don't know/not sure
Other
Television - news
The Department for the Environment
Radio
Volunteer groups such as Landcare, Trees for Life etc.
Television - nature shows/ag shows
National Parks/Conservation Parks
Natural Resource Management Boards
Newspapers
Books/library/Magazines
Neighbour/friends/relatives/colleagues - word of mouth
Local Council
The internet
% of respondents (incl. multiple responses)
Q13. Where do you go when looking for information on the environment? Base: total sample (n=1000)

South Australians and the Environment 2016 Page 56 of 98
Compared to the total sample, regional respondents were twice as likely to seek such information from NRM Boards (9%), especially those residing in the SAMDB NRM Board area (16%). Those who reside on rural or remote farms and full time commercial farmers were also more likely to use the NRM Boards as a source of information on the environment (both 18%).
As would perhaps be expected, respondents under the age of 50 were significantly more likely to search for such information via the internet (88%), those aged 50 to 69 were less likely (68%) and those aged over 70 were the least likely (38%). Alternatively, when compared to the total sample, those over the age 50 were twice as likely to source their information from newspapers (11%), television (4%) and the radio (4%). Respondents over the age of 70 were also almost four times as likely to say they don’t know where they would go to find information on the environment (23% provided this response).
A number of subgroups which are strongly skewed to those aged under 50 were also more likely to search for information on the environment via the internet and these included:
Full time workers (84%)
Group households of unrelated adults (84%)
Young couples (94%)
Young and middle families, i.e. most children under the age of 15 (91%)
Those with middle and higher gross annual household incomes (84% and 87% respectively)
Those with postgraduate (86%) or undergraduate (83%) university educations
Environmental Aspects of Interest 3.6.2
When asked if there is some aspect that they are interested in learning more about, four in ten respondents (42%) indicated their interest and specified an environmental topic, 56% did not have any particular environmental interests or were not interested in learning more about the environment and 2% were unsure.
When the specified topics of interest were analysed quantitatively, the main topic areas of interest were identified as being
Marine/river/ocean life or ecosystems (9%)
The protection/conservation of native flora and fauna (6%)
Agriculture and sustainability (5%)
General or specific information about flora and fauna (5%)
A full list of the verbatim responses received is supplied in a document supplementary to this report.

South Australians and the Environment 2016 Page 57 of 98
Fig.25: Interest in Environmental Aspects
Subgroups more likely to have an interest in learning more about an aspect of the environment were:
Those with an undergraduate or postgraduate education (both 50%)
Respondents who rent their place of residence (52%)
Those who belong to, volunteer for, or involved with an environmental group (57%)
Subgroups that were less likely to be interested were:
Those who did not seek further education after secondary school (29%)
Retirees (36%)
There were few sizable subgroup differences in the topics of interest specified, the exceptions were:
Respondents aged 15 to 29 , those who rent their place of residence, those with a TAFE or trade education and those who reside in a group household of related or unrelated adults were more likely to state they were interested in topics relating to marine/river/ocean life/ecosystems (13%, 14%, 14% and 14%, respectively)
Those who volunteer for or belong to Landcare or another environmental group were almost three times more likely to be interested in protection of native fauna/flora/conservation (17%)
4%
1%
1%
1%
2%
2%
3%
3%
4%
5%
5%
6%
9%
42%
2%
55%
0% 20% 40% 60% 80% 100%
Other
Everything
How to help/volunteer
Mining/fracking
Nuclear energy/waste
Pollution/waste/recycling
Water conservation/management
Climate change/global warming
Renewables
General or specific information about flora/fauna
Agriculture and sustainability
Protection/conservation of native fauna/flora
Marine/river/ocean life/ecosystems
Yes
Don't know/not sure
No
% of respondents
Q14. Is there some aspect of the environment that you are interested in learning more about?
(Base: total sample, n=1000)

South Australians and the Environment 2016 Page 58 of 98
3.7 Environmental Positioning Statements
All participants were read out 19 statements associated to a range of attitudinal and behavioural positions towards the environment (randomised for each participant). For each statement they were asked to rate their level of agreement on a scale of 1 to 5, where 1 was strongly disagree and 5 was strongly agree.
The primary purpose of these statements was to generate an Attitudinal and Behavioural Segmentation of the South Australian population (see Section 4). However, given that the research attained a large representative sample of the South Australian population, the results at the total sample level provide a valuable indication of the core attitudes, behaviours, views and values South Australian’s in general hold in relation to the environment.
The following table displays the results when collapsing agree (i.e. ratings of 4-5) and disagree (i.e. ratings of 1-2) responses (ordered by highest to lowest level of overall agreement), while a chart located on page 60 provides a breakdown of each response type.
Agree Neutral Disagree
Conserving the natural environment is of critical importance 94% 3% 3%
I like to interact with nature 89% 7% 4%
Regular participation in recreation and leisure outdoors is important to me 88% 6% 6%
Energy ratings are of vital importance when I purchase household appliances
86% 8% 6%
I am highly aware of the impacts that my family and I have on the environment
78% 13% 9%
There are things I can do to reduce the impacts of climate change 77% 11% 12%
I strongly believe what I personally do makes a difference to the environment
76% 14% 10%
I feel there are some environmental issues that I don't understand 76% 12% 12%
I am happy to pay more for environmentally friendly products 72% 15% 13%
There is not enough emphasis on protecting our natural habitats 70% 15% 15%
I am willing to make considerable sacrifices to improve the quality of natural resources in SA
66% 23% 11%
I am well informed about the environment 51% 24% 25%
I consider myself to be a strong environmentalist 45% 25% 30%
I am pessimistic about the future 38% 19% 43%
I consider the environment when I decide on my transport options 36% 19% 44%
A lot of threats to the environment are exaggerated 21% 16% 63%
I think that climate change is a myth 13% 13% 74%
I have little interest in environmental issues 11% 12% 77%
The environment is not my problem 5% 4% 91%
Fig.26: Environmental Positioning Statements Collapsed Agree/Disagree

South Australians and the Environment 2016 Page 59 of 98
Based on the results of the representative sample, the responses to the statements suggest that South Australian’s generally enjoy and value interacting with the nature and strongly believe in the importance of conserving and protecting the natural environment, with high levels of overall agreement with the following statements;
“I like to interact with nature” (89% agreed or strongly agreed)
“Regular participation in recreation and leisure outdoors is important to me” (88%)
“Conserving the natural environment is of critical importance” (94%)
“There is not enough emphasis on protecting our natural habitats” (70%)
Almost half of the South Australian’s surveyed (45%) considered themselves to be strong environmentalists, 25% were neutral on the matter or unsure and the remainder (30%) would not consider themselves to be strong environmentalists.
Respondents were generally aware of the effect they have on the environment and displayed some accountability. Only 5% of the South Australian’s surveyed agreed with the statement “the environment is not my problem” (91% disagreed), while over three quarters of respondents agreed with the following:
“I strongly believe what I personally do makes a difference to the environment” (76%)
“I am highly aware of the impacts that my family and I have on the environment” (78%)
“There are things I can do to reduce the impacts of climate change” (77%)
The majority of respondents engage or were willing to engage in various environmental behaviours assessed in the statements, including:
“Energy ratings are of vital importance when I purchase household appliances” (86% agreed, although they may do so as part of a cost saving measure)
“I am happy to pay more for environmentally friendly products” (72%)
“I am willing to make considerable sacrifices to improve the quality of natural resources in SA” (66%)
However, only 36% agreed that they consider the environment when deciding on their transport options.
In a particularly interesting finding, 77% of respondents indicated they had some interest in environmental issues and 51% of respondents indicated they were well informed about the environment, yet 76% felt that there are environmental issues they do not understand. This is perhaps indicative of a discrepancy between knowledge of the environment and a practical understanding of particular environmental issues.
Although the vast majority of South Australian’s disagreed with the statement “I think that climate change is a myth” (74%), 13% of the total sample agreed and a further 13% were unsure or neutral. This suggests that around a quarter (26%) of the South Australian population do not believe in, or have reservations about, the validity of climate change. Furthermore, 21% of respondents agreed to some extent that “a lot of the threats to the environment are exaggerated”.

South Australians and the Environment 2016 Page 60 of 98
1%
2%
4%
3%
7%
8%
7%
8%
15%
24%
18%
27%
21%
25%
24%
38%
49%
44%
53%
4%
9%
9%
18%
29%
30%
38%
43%
52%
46%
54%
49%
55%
52%
54%
48%
39%
45%
42%
4%
12%
13%
16%
19%
19%
25%
24%
23%
15%
15%
14%
12%
11%
13%
8%
6%
7%
3%
35%
42%
29%
40%
35%
32%
24%
22%
10%
13%
11%
8%
9%
10%
8%
5%
5%
3%
2%
57%
35%
45%
23%
9%
11%
6%
3%
1%
2%
3%
1%
3%
2%
1%
1%
1%
1%
1%
0% 20% 40% 60% 80% 100%
The environment is not my problem
I have little interest in environmental issues
I think that climate change is a myth
A lot of threats to the environment are exaggerated
I consider the environment when I decide on my transport options
I am pessimistic about the future
I consider myself to be a strong environmentalist
I am well informed about the environment
I am willing to make considerable sacrifices to improve the quality of natural resources in SA
There is not enough emphasis on protecting our natural habitats
I am happy to pay more for environmentally friendly products
I strongly believe what I personally do makes a difference to the environment
I feel there are some environmental issues that I don't understand
There are things I can do to reduce the impacts of climate change
I am highly aware of the impacts that my family and I have on the environment
Energy ratings are of vital importance when I purchase household appliances
Regular participation in recreation and leisure outdoors is important to me
I like to interact with nature
Conserving the natural environment is of critical importance
% of respondents
Environmental Positioning Statements (Base: total sample, n=1000) Strongly agree Agree Neutral Disgree Strongly disagree
Fig.27: Environmental Positioning Statements

South Australians and the Environment 2016 Page 61 of 98
The table below displays the demographic and geographic subgroups significantly more likely to agree to some extent (i.e. agree or strongly agree) and those significantly more likely to disagree to some extent (i.e. disagree or strongly disagree) with each statement:
More likely to agree More likely to disagree
Conserving the natural environment is of critical importance
Females (96%) Lower income earners (5%)
I like to interact with nature
Full time workers (93%) Lower income earners (7%)
Regular participation in recreation and leisure outdoors is important to me
30-49 year olds (94%) Young families (97%) Middle families (94%)
Full time workers (93%) Middle income earners (92%) Belong to enviro group (95%)
70+ year olds (16%) Retirees (13%)
Lone person households (11%) Lower income earners (10%)
Energy ratings are of vital importance when I purchase household appliances
50-69 year olds (90%) Semi-rural residents (94%)
Lifestyle/hobby farmers (94%) Mature couples (92%)
Belong to enviro group (94%)
70+ year olds (14%) Lone person households (14%)
Retirees (10%) TAFE/Trade education (9%)
I am highly aware of the impacts that my family and I have on the environment
Females (82%) 50-69 year olds (86%) Mature couples (88%)
Retirees (87%) Lower income earners (84%) Belong to enviro group (94%)
15-29 year olds (15%)
There are things I can do to reduce the impacts of climate change
Metro residents (79%) 30-49 year olds (84%)
Outer suburban residents (81%) Renters (84%)
Middle families (84%) Postgraduate education (88%) Middle income earners (83%) Belong to enviro group (94%)
70+ year olds (24%) Regional (excl. AMLR/SAMDB, 18%)
TAFE/trade education (16%) Mature families (20%)
Retirees (18%) Lower income earners (16%)
I feel there are some environmental issues that I don't understand
Females (81%) Young couples (86%)
-
I strongly believe what I personally do makes a difference to the environment
Lifestyle/hobby farmers (84%) Lower income earners (81%) Belong to enviro group (86%)
-
I am happy to pay more for environmentally friendly products
Females (77%) Outer suburban residents (76%) Postgraduate education (86%) Belong to enviro group (85%)
Secondary school education (17%) Retirees (19%) Students (22%)
Lower income earners (19%)

South Australians and the Environment 2016 Page 62 of 98
More likely to agree More likely to disagree
There is not enough emphasis on protecting our natural habitats
Metro residents (73%) Young couples (82%)
Undergraduate education (78%) Belong to enviro group (80%)
Rural/remote farm residents (28%) Full time/commercial farmers (36%)
I am willing to make considerable sacrifices to improve the quality of natural resources in SA
Belong to enviro group (78%) 50-69 year olds (14%) Regional (excl. AMLR/SAMDB, 17%) Full time/commercial farmers (20%)
I am well informed about the environment
Regional (all areas, 56%) SAMDB area residents (65%)
Home owners (54%) Rural/remote farm residents (61%)
Lifestyle/hobby farmers (63%) Mature couples (59%)
Retirees (58%) Middle income earners (56%) Belong to enviro group (72%)
Lone person households (33%) Households of unrelated adults (38%)
I consider myself to be a strong environmentalist
SAMDB area residents (61%) 50-69 year olds (51%)
Rural/remote farm residents (56%) Lifestyle/hobby farmers (60%) Postgraduate education (56%)
Mature couples (52%) Retirees (55%)
Lower income earners (50%) Belong to enviro group (70%)
15-29 year olds (38%) TAFE/trade education (35%)
Part time/casual workers (39%)
I am pessimistic about the future
Inner suburban residents (45%) Renters (47%)
Secondary school education (43%) Lone person households (47%) Lower income earners (47%)
Females (47%) 50-69 year olds (48%)
Outer suburban residents (52%) Mature couples (51%)
Postgraduate education (51%)
I consider the environment when I decide on my transport options
Young couples (51%) Renters (44%)
Lower income earners (42%) Belong to enviro group (48%)
TAFE/Trade education (51%) Part time/casual worker (51%)
A lot of threats to the environment are exaggerated
Regional residents (all areas, 26%) Regional (excl. AMLR/SAMDB, 29%)
50-69 year olds (28%) 70+ year olds (34%)
Rural town residents (27%) Rural/remote farm residents (32%) Full time/commercial farmer (44%)
Mature couples (27%) Retirees (31%)
Secondary school education (30%) Lower income earners (29%)
Metro residents (65%) Females (69%)
30-49 year olds (74%) Semi-rural residents (73%)
Middle families (72%) Undergraduate education (69%) Postgraduate education (72%) Higher income earners (74%)

South Australians and the Environment 2016 Page 63 of 98
More likely to agree More likely to disagree
I think that climate change is a myth
Regional residents (all areas, 20%) Regional (excl. AMLR/SAMDB, 23%)
50-69 year olds (20%) Rural town residents (21%)
Rural/remote farm residents (25%) Full time/commercial farmers (38%) Secondary school education (20%)
Mature couples (18%) Lower income earners (17%)
Metro residents (77%) 15-29 year olds (84%)
Renters (81%) Undergraduate education (86%) Postgraduate education (86%) Belong to enviro group (87%)
I have little interest in environmental issues
50-69 year olds (15%) 70+ year olds (17%)
Mature couples (17%) Retirees (19%)
Lower income earners (17%)
SAMDB area residents (88%) Undergraduate education (85%)
Belong to enviro group (90%)
The environment is not my problem
SAMDB area residents (9%) 70+ year olds (10%)
Rural town residents (8%) Secondary school education (9%)
Lone person households (9%) Retirees (10%)
Lower income earners (9%)
30-49 year olds (96%) Semi-rural residents (97%)
Undergraduate education (96%) Postgraduate education (96%)
Young couples (100%) Middle families (97%)
Full time workers (97%) Middle income earners (97%) Belong to enviro group (98%)
Fig.28: Environmental Positioning Subgroup Differences

South Australians and the Environment 2016 Page 64 of 98
4. SEGMENTATION

South Australians and the Environment 2016 Page 65 of 98
4.1 Attitudinal and Behavioural Segments
The technique used to determine the segments was a Cluster Analysis. Cluster Analysis or Clustering, is a technique that employs pattern recognition to assign objects or observations to groups based on their similarities. In the case of the current research the segments were derived from respondents answers to the nineteen agree/disagree statements (see section 3.7) as well as their general level of concern for environmental issues in South Australia (see section 3.3.1).
Based on patterns within the data (similarities in respondents’ environmental attitudes, behaviours and beliefs), four distinct segments were identified. The names assigned to each segment and proportion of the total sample of each were as follows:
Environmentally Engaged and Aware (35% of the total sample)
Environmentally Concerned Sceptics (22%)
Environmentally Unenlightened (28%)
Environmentally Disengaged (15%)
Fig.29: Segment Prevalence
The following radar chart displays the pattern of responses from each segment based on the mean score (on the 1-5 agreement scale) of each segment. Points plotted toward the centre of the chart indicate higher levels of disagreement and points plotted towards the outside indicate a higher level of agreement. As seen on this chart, the identified segments formed somewhat of a spectrum. The segment named Engaged and Aware typically displayed attitudes and behaviours that were most environmentally conscious and friendly, followed by Concerned Sceptics, Unenlightened and lastly Disengaged. A more in depth analysis of the characteristics of each segment follows in section 4.2.

South Australians and the Environment 2016 Page 66 of 98
Fig.30: The Four Segments

South Australians and the Environment 2016 Page 67 of 98
4.2 Segment Defining Characteristics
To better grasp the core differences attitudinally and behaviourally across the segments the following section discusses the positioning of each segment comparatively. Firstly in terms of their general concern about environmental issues and then in terms of overall level of agreement when the statements are split into five key areas:
Current engagement or willingness to engage in environmentally friendly actions
Accountability for the environment and perceived impact
Core beliefs in regards to the environment
Interest and knowledge in environmental issues
Lifestyle and outlook
Level of Concern about Environmental Issues 4.2.1
As seen in the chart below, Engaged and Aware displayed an extremely high level of concern about environmental issues in SA, with nine in ten (91%) indicating they were concerned to some degree. They were closely followed by Concerned Sceptics, of whom 80% indicated they were concerned.
On the other end of the spectrum, a total of 46% of Disengaged were unconcerned about environmental issues in South Australia and only 30% were concerned to any extent. Lastly, Unenlightened displayed moderate concern (62%), however, a large proportion were unsure/neutral or not very concerned (38%).
Fig.31: Segment Characteristics; Level of Concern about Environmental Issues in SA
10%
36%
25%
25%
5%
0%
13%
25%
49%
13%
1%
7%
12%
52%
28%
1%
4%
4%
53%
38%
2%
12%
15%
48%
24%
0% 20% 40% 60% 80% 100%
Not at all concerned
Not very concerned
Neutral/unsure
Quite concerned
Very concerned
% of respondents
Q6. In general, how concerned are you about environmental issues in South Australia?
Total sample
Engaged and Aware
Concerned Sceptics
Unenlightened
Disengaged

South Australians and the Environment 2016 Page 68 of 98
Willingness to Engage in Environmental Behaviours 4.2.2
As seen in the chart below, Engaged and Aware were generally the most likely to agree with statements assessing proclivity and willingness to engage in behaviours that are environmentally friendly, however, they were followed very closely or matched by Concerned Sceptics. While the majority of Unenlightened agreed with most of the statements below (with the exception of “I consider the environment when deciding on transport options”), Disengaged were much less likely to agree with all statements. Furthermore, compared to all segments they were less than half as likely to agree with “I would be happy to pay more for environmentally friendly products” and “I am willing to make considerable sacrifices to improve the quality of natural resources in SA”.
Fig.32: Segment Characteristics; Environmental Actions and Behaviour
Environmental Accountability and Impact 4.2.3
Engaged and Aware and Concerned Sceptics displayed a stronger sense of accountability and responsibility for the impact they may have on the environment.
Unenlightened were generally not far behind in their agreement with statements of this nature and displayed the same high level of overall agreement with “there are things I can do to reduce the impacts of climate change” as Concerned Sceptics (81%).
Disengaged displayed much lower levels of accountability than all other segments. Furthermore they had the highest agreement with the statement “the environment is not my problem” (10%).
17%
27%
29%
67%
19%
54%
64%
77%
51%
81%
80%
95%
49%
83%
90%
95%
36%
66%
72%
86%
0% 20% 40% 60% 80% 100%
I consider the environment when I decide on mytransport options
I am willing to make considerable sacrifices toimprove the quality of natural resources in SA
I am happy to pay more for environmentallyfriendly products
Energy ratings are of vital importance when Ipurchase household appliances
% of respondents agree or strongly agree
Actions and Behaviours
Total Engaged and Aware Concerned Sceptics Unenlightened Disengaged

South Australians and the Environment 2016 Page 69 of 98
Fig.33: Segment Characteristics; Environmental Accountability and Impact
Core Beliefs 4.2.4
Thus far, Engaged and Aware and Concerned Sceptics appear to be very similar in their positioning, with Engaged and Aware generally displaying slightly higher agreement with most pro-environment statements than the Concerned Sceptics. These seemingly similar segments begin to differ when assessed on their core beliefs and we see the reasoning behind the name “Concerned Sceptics”.
Despite the importance they place on conserving the environment (and the care they have for it as seen in their accountability and behaviours), four out of ten Concerned Sceptics (39%) agreed with the statement “a lot of threats to the environment are exaggerated”. Furthermore, 34% of Concerned Sceptics agreed with “I think climate change is a myth”, which was on par with the Disengaged (36%). This result is in stark contrast to Engaged and Aware and Unenlightened where only 1% of respondents within each of these segments indicated that they believe climate change to be a myth.
10%
38%
27%
46%
5%
63%
81%
65%
8%
93%
80%
96%
0%
92%
93%
92%
5%
76%
77%
79%
0% 20% 40% 60% 80% 100%
The environment is not my problem
I strongly believe what I personally do makes adifference to the environment
There are things I can do to reduce the impacts ofclimate change
I am highly aware of the impacts that my family andI have on the environment
% of respondents agree or strongly agree
Accountability and Impact
Total Engaged and Aware Concerned Sceptics Unenlightened Disengaged

South Australians and the Environment 2016 Page 70 of 98
Fig.34: Segment Characteristics; Core Environmental Beliefs
Interest in and Knowledge of the Environment 4.2.5
The following chart displays each segments overall agreement with three statements assessing their interest in and knowledge of the environment. The results of this comparison show the core reasons behind the name “Unenlightened”.
Respondents in the Unenlightened segment were the least likely to agree with “I am well informed about the environment” and the most likely to agree with “I feel there are some environmental issues that I don’t understand”. Interestingly, the remaining three segments were relatively similar in their levels of agreement with “I feel there are some environmental issues that I don’t understand”, indicating that a lack of understanding of some environmental issues is universal regardless of levels of concern and care for the environment.
Lastly in regards to interest and knowledge, over one third of those in the Disengaged segment agreed with “I have little interest in environmental issues” (36%) which aligns with many of their other positions on the environment. However, a sizable minority of Concerned Sceptics also indicated have little interest in environmental issues (14%), despite the importance they place on conserving the environment (and the care they have for it as seen in their accountability and behaviours).
36%
44%
12%
39%
74%
1%
19%
12%
65%
97%
34%
39%
70%
70%
96%
1%
2%
69%
87%
100%
13%
21%
45%
70%
94%
0% 20% 40% 60% 80% 100%
I think that climate change is a myth
A lot of threats to the environment areexaggerated
I consider myself to be a strong environmentalist
There is not enough emphasis on protecting ournatural habitats
Conserving the natural environment is of criticalimportance
% of segment agree or strongly agree
Core Beliefs in Regards to the Environment
Total Engaged and Aware Concerned Sceptics Unenlightened Disengaged
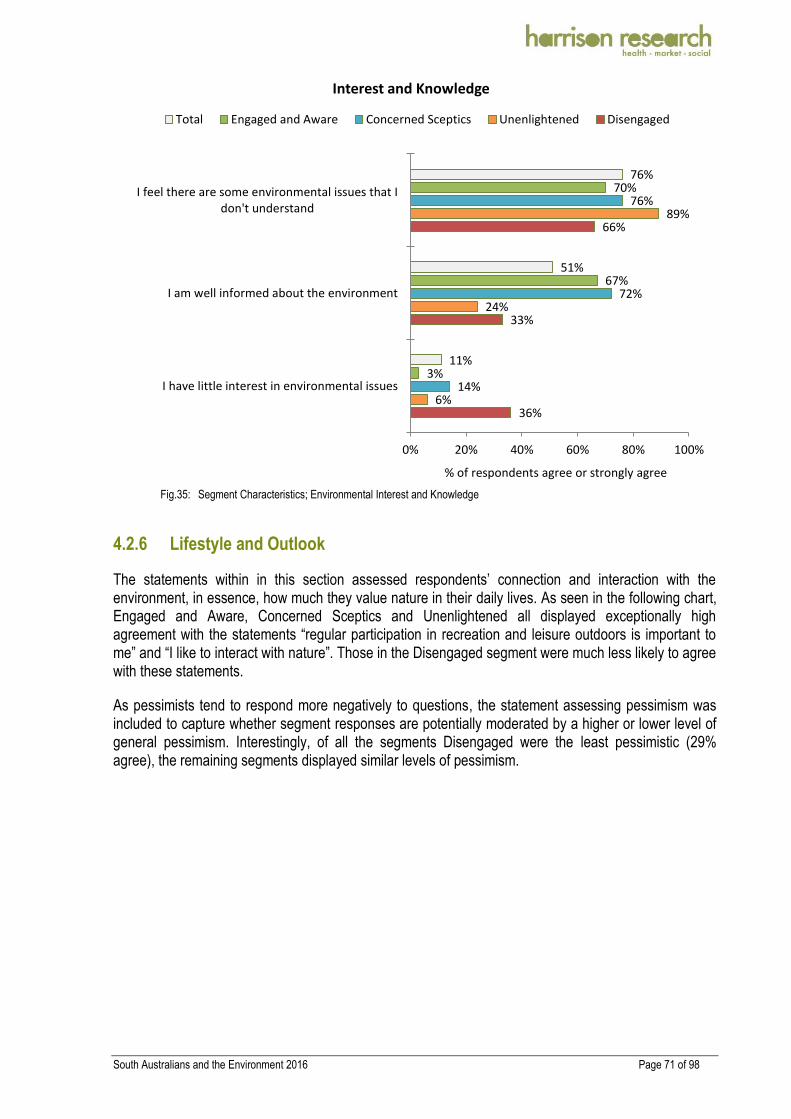
South Australians and the Environment 2016 Page 71 of 98
Fig.35: Segment Characteristics; Environmental Interest and Knowledge
Lifestyle and Outlook 4.2.6
The statements within in this section assessed respondents’ connection and interaction with the environment, in essence, how much they value nature in their daily lives. As seen in the following chart, Engaged and Aware, Concerned Sceptics and Unenlightened all displayed exceptionally high agreement with the statements “regular participation in recreation and leisure outdoors is important to me” and “I like to interact with nature”. Those in the Disengaged segment were much less likely to agree with these statements.
As pessimists tend to respond more negatively to questions, the statement assessing pessimism was included to capture whether segment responses are potentially moderated by a higher or lower level of general pessimism. Interestingly, of all the segments Disengaged were the least pessimistic (29% agree), the remaining segments displayed similar levels of pessimism.
36%
33%
66%
6%
24%
89%
14%
72%
76%
3%
67%
70%
11%
51%
76%
0% 20% 40% 60% 80% 100%
I have little interest in environmental issues
I am well informed about the environment
I feel there are some environmental issues that Idon't understand
% of respondents agree or strongly agree
Interest and Knowledge
Total Engaged and Aware Concerned Sceptics Unenlightened Disengaged

South Australians and the Environment 2016 Page 72 of 98
Fig.36: Segment Characteristics; Lifestyle and Outlook
29%
55%
64%
38%
89%
90%
41%
98%
92%
39%
98%
94%
38%
89%
88%
0% 20% 40% 60% 80% 100%
I am pessimistic about the future
I like to interact with nature
Regular participation in recreation and leisureoutdoors is important to me
% of respondents agree or strongly agree
Lifestyle and Outlook
Total Engaged and Aware Concerned Sceptics Unenlightened Disengaged

South Australians and the Environment 2016 Page 73 of 98
4.3 Segment Demographics
Although the segments were derived based on the attitudinal and behavioural positioning of respondents as discussed above, analysis was then undertaken to examine the demographic and geographic make up of each of the segments, and how they differ from one another.
The following chart displays how the different segments are skewed in the key demographics collected, i.e. gender, age and residential location. A full description of each segments demographic tendencies follows.
Fig.37: Segment Key Demographics
32%
68%
16%
47%
20%
17%
39%
61%
22%
78%
8%
26%
41%
24%
53%
47%
32%
68%
17%
47%
24%
11%
55%
45%
20%
80%
6%
39%
40%
15%
52%
48%
25%
75%
11%
38%
34%
17%
51%
49%
0% 20% 40% 60% 80% 100%
Regional
Metropolitan
70 and over
50-69 years
30-49 years
15-29 years
Female
Male
Are
aA
geG
end
er
% of respondents
Gender, Age and Area
Total sample (n=1000)
Engaged and Aware (n=354)
Concerned Sceptics (n=221)
Unenlightened (n=278)
Disengaged (n=147)

South Australians and the Environment 2016 Page 74 of 98
Engaged and Aware 4.3.1
Those in the Engaged and Aware segment were in line with the gender split of the total South Australian population, however, compared to the total sample they were more likely to:
be 30 to 49 years old (40% of this segment vs 34% of the total sample)
live in metropolitan South Australia (80% vs 75% of the total sample)
be in full-time employment (42% vs 37% of the total sample)
have a university education (49% vs 36% of the total sample) o especially a postgraduate university education (26% vs 17% of the total sample)
belong to, volunteer or be involved with an environmental, land care or similar group (15% vs 9% of the total sample)
live semi-rurally i.e. on a large block with land in between (13% vs 9% of the total sample)
Rural or semi-rural landholders within this segment were slightly more likely to be lifestyle/hobby farmers (50% vs 40% of all rural/semi-rural landholders).
Concerned Sceptics 4.3.2
Respondents within this segment were also in line with the gender split of the total South Australian population, however, compared to the total sample they were more likely to:
be aged 50+ (64% of this segment vs 49% of the total sample)
live in regional South Australia (32% vs 25% of the total sample), specifically within a rural township (19% vs 14% of the total sample)
be retired (36% vs 25% of the total sample)
own their own home (84% vs 78% of the total sample)
be in a mature couple household with no children at home (32% vs 26% of the total sample)
state that secondary school is their highest level of education (44% vs 32% of the total sample)
be lower income earners with a gross annual income of under $60,000 per annum (44% vs 35% of the total sample)
Unenlightened 4.3.3
Respondents within this segment were generally in line with the total South Australian population, however, compared to the total sample they were more likely to:
be skewed towards people aged under 50 (65% of this segment vs 51% of the total sample) o especially skewed to those aged under 30 (24% vs 17% of the total sample)
live in a household comprising of a young family, i.e. a single or couple with most children under the age of six (14% vs 10% of the total sample)
Lastly, rural and semi-rural landholders within this segment were less likely to use their land for growing food or keeping livestock (47% use their land for some form of farming vs 58% of all rural/semi-rural landholders).

South Australians and the Environment 2016 Page 75 of 98
Disengaged 4.3.4
Disengaged was the only segment to display a gender skew; compared to the total sample people in this segment were much more likely to be male (61% male and 39% female). People within this segment were also more likely to:
be aged over 50 (63% of this segment vs 49% of the total sample), with many aged over 70 (16% vs 11% of the total sample)
be retired (33% vs 25% of the total sample)
reside in regional South Australia (32% vs 25% of the total sample)
live on a rural or remote farm (10% vs 6% of the total sample)
be in a mature couple household with no children at home (33% vs 26% of the total sample)
give TAFE or a trade as their highest level of education (37% vs 29% of the total sample)
Notably, they were much less likely to belong to, volunteer for or be involved with an environmental, land care or similar group (1% vs 9% of the total sample).

South Australians and the Environment 2016 Page 76 of 98
4.4 Segment Responses to Core Survey Questions
After defining the segments and their demographic and geographic skews, analysis was undertaken to observe how each of the segments responded differentially to the other questions asked within the survey. The table below displays the notable significant variations in the responses of each segment to each of the core survey questions.
Question Segment response variations of note
Q1. Two most important issues at a state level that need attention from the State Government at present?
Engaged and Aware more likely to name the environment as one of their two most important issues, despite being completely unprompted (7% vs 3% of all other segments)
Unenlightened were more likely to name education/schools (26%) and crime/law and order and vandalism (6%)
Disengaged more likely to not be able to name any important issues at a state level (13% don’t know/not sure)
Q2. Most important environmental issues in South Australia today?
Engaged and Aware were more likely to raise a number of environmental issues, including water supply/conservation/drought (27%), water pollution/water quality (24%), renewable energy (21%), climate change (17%) and overpopulation (3%)
Disengaged were more likely to not know or be unsure of important environmental issues in South Australia today (31% don’t know)
Q3. Most important thing the South Australian Government can do to protect and look after the environment over the next few years?
Engaged and Aware more likely to suggest not proceeding with the nuclear dump (12%)
Unenlightened were more likely to state that they don’t know what the Government should do (27%), however they were also more likely than any other segment to advocate the promotion of renewable energy (19% vs 14% of the total sample)
Disengaged were more likely to state ‘don’t know/not sure’ (40%)
Q4. Most important natural resources in South Australia?
Engaged and Aware more likely to name water quality/quantity (36%), National Parks/Conservation Parks/State Forests (19%), beaches/oceans (13%), flora/plant life (10%) and rivers/lakes (8%)
Disengaged were more likely to name mineral wealth including gas/mining (45%)
Q5. Who is responsible for looking after natural resources like water, soil, native vegetation and coasts in your region?
Engaged and Aware more likely to name DEWNR (11%), NRM Boards (8%), Department of Environment and Heritage (6%), the Environmental Protection Authority (6%) and Primary Industries and Regions South Australia (3%)
Q7. Perceptions of change in environmental situations in South Australia
Engaged and Aware more likely to state that two environmental situations have gotten a bit worse or much worse; maintaining healthy rivers, streams and wetlands (17% vs 13% total sample) and protecting and conserving endangered plants and animals (15% vs 11%)
Concerned Sceptics were more likely to state that the following environmental situations have gotten a bit better or much better in the last few years:
o Using our soils, plants and water sustainably (58% vs 51% of the total sample
o Protecting and conserving endangered plants and animals (55% vs 45%) o Reducing greenhouse emissions (56% vs 48%) o Adapting to climate variability (40% vs 34%)

South Australians and the Environment 2016 Page 77 of 98
Question Segment response variations of note
Unenlightened were in line with the total sample responses with one exception; compared to the total sample they were more likely to indicate that they were unsure if South Australia has gotten better or worse in terms of adapting to climate variability (12% vs 7% of the total sample)
Disengaged were more likely to respond ‘don’t know/not sure’ in regards to almost all environmental situations
Q8. Participation in environmental behaviours in past 12 months
There was a general trend of higher to lower engagement in environmental behaviours from Engaged and Aware through to Disengaged. A radar chart of these results is displayed on page 78 below
Q9. Frequency of vitiation to environmental areas in past 12 months
There was a general trend of higher to lower visitation and frequency of visitation from Engaged and Aware through to Disengaged. Exceptions to this rule were that Unenlightened were more likely to have visited parks in a local area and beaches/oceans many times in the past year compared to Concerned Sceptics
Q10 & 11. Awareness and identification of term NRM
Engaged and Aware were more likely to have heard of the term NRM and correctly identify the source of the initialism (29%)
Unenlightened were less likely (13%)
Interestingly Disengaged were able to identify the initialism to the same degree as their more environmentally minded counterparts (21% vs 20% of Concerned Sceptics)
Q12. What activities do you think the Natural Resources Management Boards in South Australia undertake?
Engaged and Aware were more likely to identify a number of activities NRM Boards in South Australia undertake, specifically; look after/manage national/conservation parks (38%), protect native vegetation (24%), look after/manage coast/marine ecosystems (22%), support/work with landholders on the sustainability of their land and agricultural production (16%), control pest plans/weeds (13%), support work with local government on environmental outcomes (8%) and the control of pest animals (7%)
Disengaged were more likely to not be able to name any activities NRM Boards in South Australia undertake (43% don’t know/not sure)
Q13. Where do you go when looking for information on the environment?
Engaged and Aware were more likely to search for such information via the internet (85%)
Concerned Sceptics were less likely to search for such information via the internet (66%) and more likely to get their information via newspapers (12%) and radio (5%)
Disengaged were more likely to respond ‘don’t know/not sure’ (18%) and ‘I don’t look for such information’ (7%)
Q14. Is there some aspect of the environment that you are interested in learning more about?"
Engaged and Aware were much more likely than all other segments to have an aspect of the environment that they would be interested in learning more about (58% vs 39% and 38% of Concerned Sceptics and Unenlightened, respectively)
o Engaged and Aware were more likely to be interested in learning more about the protection of native fauna/flora (12%), Marine/river/ocean life/ecosystems (12%), agriculture and sustainability (8%) and nuclear energy/waste (4%)
o Concerned Sceptics were more likely to be interested in water conservation/management (7%)
Disengaged were less likely to display an interest in learning (17%)
Fig.38: Core Survey Questions by Segments

South Australians and the Environment 2016 Page 78 of 98
The following chart displays each segments average engagement in the environmental behaviours assessed (based on each segments mean score on the 4-point scale; i.e. often, sometimes, occasionally, never). Points plotted toward the outside indicate more frequent engagement and those towards the middle indicate less frequent engagement.
Fig.39: Participation in Environmental Behaviours by Segment
Avoided putting things like oil, fat, turps, paintor chemicals down the sink, drain or toilet
Taken steps to reduce your energyconsumption
Reduced the amount of waste your householdthrows out
Made an effort for environmental reasons toreduce water consumption
Chosen household products that are better forthe environment
Composted food or garden refuse, or used aworm farm
Grown at least some of your own food
Bought food from a farmers markets
Tried to encourage someone else to change anactivity or practice that you thought was
harmful to the environment
Attended a tree planting or otherenvironmental volunteer event
Participation in Environmental Behaviours by Segment Engaged and Aware
Concerned Sceptics
Unenlightened
Disenaged
Never
Often
Sometimes
Occasionally

South Australians and the Environment 2016 Page 79 of 98
4.5 Segment Summaries
These four segments displayed a general spectrum of attitudes and behaviours from those who were extremely environmentally engaged, active and aware through to those who were relatively uninformed, disengaged and disinterested (or uncaring). This idea is illustrated in the following diagram.
Fig.40: Segment Spectrum
The following four pages summarise each of the segments characteristics in terms of their core attitudes and behaviours which the segments are defined on. Also outlined are the segments demographic and geographic skews which were identified after the attitudinal and behavioural segmentation was performed.
Segment Spectrum Most engaged,
active concerned and aware
Least engaged, active
concerned and aware

South Australians and the Environment 2016 Page 80 of 98
Who am I more likely to be?
• Those aged between 30 and 49 years old
• Residents of the Adelaide metropolitan area
• Full time workers
• Those who are university educated, especially postgraduate level
• Those involved with or belong to an environmental, land care or similar group
I am more likely to…
• Display awareness of numerous environmental issues in South Australia
• Consider water quality/quantity and national parks/conservation parks/state forests as the most important natural resources in South Australia
• Engage regularly in a range of environmental behaviours
• Frequent many of South Australia’s nature areas • Be aware of NRM Boards and the activities they undertake
• Use the internet when looking for information on the environment • Be interested in learning more about an aspect of the environment
What are my defining characteristics?
• I am less likely to think that climate change is a myth
• I am less likely to think that a lot of threats to the environment are exaggerated
• I am more likely to be interested in environmental issues
• I am more likely to think there are things I can do to reduce the impacts of climate change
• I am more likely to think there is not enough emphasis on protecting our natural habitats
Engaged and Aware
Behaviourally disengaged
Unaware
Unconcerned
In regards to the environment, and environmental issues, I am…
Sceptical
Behaviourally engaged
Aware
Concerned
Believer
35
% o
f th
e p
op
ula
tio
n

South Australians and the Environment 2016 Page 81 of 98
Concerned Sceptics
Who am I more likely to be?
• People over the age of 60 and retirees
• Residents of regional South Australia (in townships)
• Those who own their own homes • Live as a mature couple without children at home
• Have secondary school as their highest level of education
• Lower income earners, i.e. a household income of under $60,000 per annum
Behaviourally disengaged
Unaware
Unconcerned
Sceptical
Behaviourally
engaged
Aware
Concerned
Believer
What are my defining characteristics?
• I am more likely to consider myself to be a strong environmentalist
• I am more likely to consider myself to be well informed about the environment
• I am more likely to consider the environment when I decide on my transport options
• I am more likely to be highly aware of the impacts that my family and I have on the environment
However…
• I am more likely to think that climate change is a myth
• I am more likely to think that a lot of threats to the environment are exaggerated
I am more likely to…
• Be concerned about environmental issues in South Australia but consider a number of environmental situations to have become better
• Regularly engage in a number of environmentally friendly behaviors (to a slightly lesser degree than Engaged and Aware)
• Frequent environmental areas in South Australia (but to a lesser degree than Engaged and Aware and in some cases, the Unenlightened)
• Listen to the radio and read newspapers to get information on the environment
22
% o
f th
e p
op
ula
tio
n

South Australians and the Environment 2016 Page 82 of 98
Unenlightened
Who am I more likely to be?
• Those aged under 50, especially skewed to those aged under 30
• Households comprising of a young family, i.e. a single or couple with most children under the age of six
What are my defining characteristics?
• I am are less likely to think I am informed about the environment
• I am more likely to indicate that there are environmental issues they do not understand
• I am are less likely to consider myself to be strong environmentalist
• I am less likely to consider the environment when deciding on my transport options
However…
• I am very unlikely to think that climate change is a myth
I am more likely to…
• Be neither concerned nor unconcerned about environmental issues in South Australia
• Be unsure if some environmental issues facing South Australia have gotten better or worse
• Generally not know what the South Australian Government can do to protect and look after the environment in the next few years (though they were slightly more likely than others to suggest promoting renewable energy)
I am less likely to…
• Regularly engage in activities that are beneficial for the environment • Visit Botanic Gardens, but visit other places in line with the sample average
• Know what the term NRM stands for or be able to name activities NRM Boards undertake
Behaviourally disengaged
Unaware
Unconcerned
Sceptical
Behaviourally Engaged
Aware
Concerned
Believer
28
% o
f th
e p
op
ula
tio
n

South Australians and the Environment 2016 Page 83 of 98
Disengaged
Who am I more likely to be?
• Males • People aged over 50, especially those aged over 60
• Residents of regional South Australia (and those residing on farms)
• Live as a mature couple without children at home • Retirees
• Those who have trade or TAFE qualification as their highest level of education
What are my defining characteristics?
• I am more likely to think that climate change is a myth
• I am less likely to think that there are things they can do to reduce the impacts of climate change
• I am less likely to be interested in environmental issues
• I am much less likely to consider myself a strong environmentalist
• I am less likely to be happy to pay more for environmentally friendly products
• I am less likely to want to interact with nature
I am less likely to…
• Identify any important environmental issues facing South Australia today
• Be concerned about environmental issues in South Australia
• Engage in activities that are beneficial for the environment • Frequent environmental areas in South Australia
• Look for information on the environment • Identify activities NRM Boards in South Australia undertake, although awareness of the
term Natural Resources Management is on par with Concerned Sceptics
• Belong to, volunteer for or be involved with an environmental, land care or similar group
I am more likely to…
• Name mineral wealth including gas/mining as the most important natural resource in South Australia
Behaviourally disengaged
Unaware
Unconcerned
Sceptical
Behavioural Engagement
Aware
Concerned
Believer
15
% o
f th
e p
op
ula
tio
n

South Australians and the Environment 2016 Page 84 of 98
APPENDIX A1: DEMOGRAPHICS

South Australians and the Environment 2016 Page 85 of 98
The tables below show the raw sample achieved by the demographics, together with the weighted sample distributions.
SUB-GROUPS Unweighted Weighted
# % # %
GENDER
Male 408 41% 492 49%
Female 592 59% 508 51%
TOTAL 1000 100% 1000 100%
AGE GROUP
15-19 39 4% 38 4%
20-29 125 13% 129 13%
30-39 224 22% 227 23%
40-49 121 12% 113 11%
50-59 175 18% 171 17%
60-69 206 21 214 21%
70+ 110 11 108 11%
TOTAL 1000 100% 1000 100%
AREA
Metropolitan 520 52% 749 75%
Regional 480 48% 251 25%
TOTAL 1000 100% 1000 100%
NRM AREA
Metro AMLR NRM 500 50% 714 71%
Regional ALMR NRM 125 13% 91 9%
SAMDB NRM 125 13% 63 6%
Other 250 25% 132 13%
TOTAL 1000 100% 1000 100%
RESIDENTIAL LOCATION
Inner suburban; within 10km of Adelaide CBD 230 23% 341 34%
Outer Suburban, 10km+, still metro 283 28% 363 36%
Semi-rural, larger blocks with land in between 109 11% 94 9%
Rural area - in a town 264 26% 139 14%
Rural area – on a farm 113 11% 61 6%
Don’t know/not sure 1 0% 1 0%
TOTAL 1000 100% 1000 100%
HOME OWNERSHIP
Home owner 786 79% 779 78%
Renting 206 21% 213 21%
Refused 8 1% 8 1%
TOTAL 1000 100% 1000 100%

South Australians and the Environment 2016 Page 86 of 98
SUB-GROUPS Unweighted Weighted
# % # %
HOUSEHOLD COMPOSITION
Lone person household 169 17% 176 18%
Group Household of unrelated adults 87 9% 89 9%
Young couple: couple (<40) living together, no children 62 6% 67 7%
Young family: couple or single most children aged <6 100 10% 104 10%
Middle family: couple or single most children aged 6-15 150 15% 141 14%
Mature family: couple or single most children aged 15+ 149 15% 158 16%
Mature couple: couple (40+), no children at home 279 28% 260 26%
TOTAL 1000 100% 1000 100%
OCCUPATION
Full-time employment 355 36% 368 37%
Part-time/casual employment 235 24% 214 21%
Retired 241 24% 251 25%
Student 63 6% 65 7%
Home duties 53 5% 46 5%
Non age pensioner 24 2% 25 2%
Unemployed 28 2% 30 3%
Refused 1 0% 1 0%
TOTAL 1000 100% 1000 100%
EDUCATION
Primary School 27 3% 26 3%
Secondary School 360 36% 322 32%
TAFE/Trade 286 29% 294 29%
Undergraduate at University 179 18% 186 19%
Postgraduate at University 147 15% 170 17%
Refused 1 0% 1 0%
TOTAL 1000 100% 1000 100%
INCOME
Under $20k pa 80 8% 77 8%
$20-40k pa 173 17% 166 17%
$40-60k pa 110 11% 107 11%
$60-80k pa 143 14% 142 14%
$80-100k pa 120 12% 110 11%
$100-140k pa 126 13% 143 14%
$140-180k pa 54 5% 58 6%
$180k+ pa 36 4% 37 4%
Refused 158 16% 160 16%
TOTAL 1000 100% 1000 100%

South Australians and the Environment 2016 Page 87 of 98
SUB-GROUPS Unweighted Weighted
# % # %
FARMING (Base: rural or semi-rural homeowners)
Don’t use land for farming 169 41% 106 43%
Lifestyle/hobby farmer (relies on non-farm income) 162 39% 98 39%
Part time farmer (some on farm income) 26 6% 17 7%
Full time/commercial farmer 56 14% 28 11%
TOTAL 413 100% 249 100%
BELONG TO VOLUNTEER FOR ENVIRO GROUP
Yes (specifed)5 90 9% 88 9%
Don’t know/not sure 8 1% 7 1%
Don’t know 902 90% 905 90%
TOTAL 1000 100% 1000 100%
SEGMENTS
Engaged and Aware 334 33% 354 35%
Concerned Sceptics 248 25% 221 22%
Unenlightened 268 27% 278 28%
Disengaged 150 15% 147 15%
TOTAL 1000 100% 1000 100%
5 Please refer to the supplementary document that accompanies this report for a breakdown of the environmental groups respondents belong to or volunteer for.

South Australians and the Environment 2016 Page 88 of 98
APPENDIX A2: QUESTIONNAIRE

South Australians and the Environment 2016 Page 89 of 98
8904 SOUTH AUSTRALIAN’S AND THE ENVIRONMENT: COMMUNITY BENCHMARKING AND SEGMENTATION RESEARCH 2016
Introduction Hello my name is …………. from Harrison Research we are undertaking a community survey about issues that impact on South Australian’s daily lives now and into the future. Is there anyone in the household aged 15 to 39?
(If yes – ask to speak with that person or arrange call back. Reintroduce as required, If no – continue)
Could I please speak to the person in the household, aged 15 and over, who was the last to have a birthday?
(Reintroduce or call back as necessary, if last birthday person is unavailable ask to proceed with interview)
The survey will only take around 18 minutes, depending on your answers. We are an independent research company and participation in this survey is anonymous.
(If asked who survey is for, say ‘I can’t tell you at this stage as it may change your responses but it should become obvious as we go through and I can let you know at the end’)
Before we start, I just need to let you know that this call may be monitored by my supervisor for training and coaching purposes. May we begin? Thank you. Main questionnaire 1. What would you say are the two most important issues at a state level that need attention
from the State Government at present? Unprompted, multiple response - first mentioned and other mentioned
1. Ageing population and associated issues 2. Cost of living 3. Child welfare/protection 4. Crime/law and order/vandalism 5. Economy/economic growth 6. Education/schools 7. Energy/fuel/nuclear power 8. Environment (specify) 9. Government performance 10. Health/hospitals and healthcare 11. Immigration 12. Mining 13. Public transport 14. Road maintenance 15. Taxation 16. Traffic flow/congestion 17. Unemployment/underemployment 18. Waste (specify) 19. Water quality/quantity 20. Other (specify) --- 21. Don't know/not sure

South Australians and the Environment 2016 Page 90 of 98
2. What would you say are the most important environmental issues in South Australia today? Unprompted, first mentioned and other mentioned
1. Air pollution/air quality 2. Carbon tax 3. Climate change 4. Development and planning 5. Energy/fuel/nuclear power 6. Forest/bushland preservation/biodiversity issues 7. Land degradation 8. Mining 9. Other pollution 10. Over population 11. Parks/open spaces 12. Renewable energy 13. Waste 14. Water pollution/water quality 15. Water supply/conservation/drought 16. Other (specify) --- 17. Don't know/not sure
3. What would you say is the single most important thing the South Australian Government can do to protect and look after the environment over the next few years? Unprompted, single response
1. Address climate change/reduce greenhouse emissions 2. Control of pest animals – non-native (e.g. rabbits, foxes) 3. Control of pest animals –native (e.g. kangaroos, koalas) 4. Introduce nuclear power 5. Landcare/weed control/erosion control 6. Maintain our national parks and bushland 7. Not proceed with a nuclear dump 8. Promote renewable energy/solar/wind 9. Protect threatened species 10. Protect water resources/waterways 11. Protect native vegetation/flora 12. Recycle more waste 13. Reduce water pollution 14. Other (specify) 15. Don't know/not sure
4. What do you think are the most important natural resources in South Australia? Unprompted, multiple response, record first named, second named, etc.
1. Air quality 2. Beaches/oceans 3. Fauna/animal life 4. Fisheries/fishing 5. Flora/plant life 6. Food production/agriculture 7. Landscape 8. Mineral wealth, including gas

South Australians and the Environment 2016 Page 91 of 98
9. National Parks/Conservation Parks/State Forests 10. River Murray 11. Other rivers/lakes 12. Soil 13. Sun 14. Water quality/quantity 15. Wind 16. Other (specify) --- 17. Don't know/not sure 18. Don't understand what you mean by natural resources
5. Who do you think is responsible for looking after natural resources like water, soil, native vegetation and coasts in your region? Interviewer note: If Federal or State Government is named probe for further information
1. All of us/everyone 2. Department of Environment (and Heritage) 3. Department of Environment Water and Natural Resources (DEWNR) 4. Environment Protection Authority (EPA) 5. Farmers/landholders 6. Government – Local/Councils 7. Government – State – no further information 8. Government – Federal – no further information 9. Land care/Land management 10. NRM Board - Adelaide and Mount Lofty Ranges (AMLR) 11. NRM Board - South Australian Murray Darling Basin (SAMDB) 12. NRM Boards - no further information 13. PIRSA (Primary Industries South Australia) 14. SA Water 15. Other (specify) --- 16. Don't know/not sure
6. In general, how concerned are you about environmental issues in South Australia? Read out 1-5
5. Very concerned 4. Quite concerned 3. Neutral/unsure 2. Not very concerned 1. Not at all concerned
6a. If not concerned (codes 1-2 in Q6): For what reasons would you say that you are not concerned about environmental issues? Unprompted, multiple response, if “too old” probe for underlying reason
1. Does not impact me personally 2. I am already doing enough/all I can 3. I do not have the information or knowledge 4. It is a low priority for me compared to other things 5. It is beyond my control

South Australians and the Environment 2016 Page 92 of 98
6. Not interested /not care about the environment 7. Someone else is taking care of it 8. The environment is good/is well managed 9. The problem is not as bad as they say/issues are exaggerated 10. Other (specify) --- 11. Don't know/not sure
7. I am now going to read you a list of environmental situations. For each, can you tell me if you think South Australia has generally become much better, a bit better, a bit worse, much worse or there has been little or no change? Read out, Rotate
Much better
A bit better
Little or no change
A bit worse
Much worse
Don’t know
Adapting to climate variability
Conserving the marine environment
Maintaining healthy rivers, streams and wetlands
Producing food sustainably
Protecting and conserving endangered plants and animals
Reducing greenhouse emissions
Reducing water over consumption
Using alternatives to motor vehicles, such as public transport, cycling or walking
Using our soils, plants and water sustainably
8. In the past twelve months, how often have you participated in the following activities -
often, sometimes, occasionally or never? Read out, Rotate
Often Sometimes Occasionally Never Don’t
know/not sure
Made an effort for environmental reasons to reduce water consumption
Chosen household products that are better for the environment
Taken steps to reduce your energy consumption
Composted food or garden refuse, or used a worm farm
Reduced the amount of waste your household throws out

South Australians and the Environment 2016 Page 93 of 98
Avoided putting things like oil, fat, turps, paint or chemicals down the sink, drain or toilet
Bought food from a farmers markets
Attended a tree planting or other environmental volunteer event
Grown at least some of your own food
Tried to encourage someone else to change an activity or practice that you thought was harmful to the environment
8a. One activity randomly chosen from often or sometimes from Q8:
What prompted you to start this activity? Unprompted, multiple response
1. Because I care 2. Change the behaviours of others 3. Concern for the environment 4. Drought 5. Education 6. Legal requirements 7. Lifestyle/hobby 8. Personal benefit 9. Save money 10. Support the local community 11. Other (specify) --- 12. Don't know/not sure
8b. One activity randomly chosen from occasionally or never from Q8 – excluding volunteer event/tree planting:
What is the main reason that you find that activity difficult to do or do more often? Unprompted, multiple response
1. Cost too much/finances 2. Difficult to do 3. Doesn't have enough impact to warrant the time 4. Doing something else instead 5. Don't have enough help 6. Don't have enough information 7. Don't have time 8. Lack of tools 9. Other things are more important 10. Too far to go - distance 11. Other (specify) --- 12. Don't know/not sure

South Australians and the Environment 2016 Page 94 of 98
9. How often have you visited the following places in the past twelve months, would you say many times, a few times, once or twice or not at all? Read out, Rotate
Many times
A few times
Once or twice
Not at all Don’t
know/not sure
Any beach or ocean
The River Murray
Park in local area
Botanic Gardens
National Park/Conservation Park/ State Forest
10. Have you heard of the term NRM?
If no/don’t know inform NRM stands for Natural Resources Management
1. Yes 2. No 3. Don't know/not sure
11. If heard of NRM, 1 in Q10: Can you tell me what the letters NRM stand for? If don’t know/incorrect inform NRM stands for Natural Resources Management
1. Natural Resources Management - CORRECT 2. National Resources Management 3. National Research Management 4. Other (specify) 5. Don't know/not sure
12. ASK ALL: What activities do you think the Natural Resource Management Boards in South Australia undertake? Unprompted, multiple response
1. Control – Pest animals 2. Control – Pest plants/weeds 3. Education – Landholder training and information 4. Education – Youth/schools (SPECIFY HOW BECAME AWARE) 5. Environmental compliance - impose fines and prosecutions 6. Look after/manage – Coast/marine ecosystems 7. Look after/manage – National parks/conservation parks 8. Look after/manage – River Murray 9. Look after/manage – Water Resources (quality and quantity) 10. Protect – Native birds and animals 11. Protect – Native vegetation 12. Provide information (brochures, Facebook, newspapers, etc.) 13. Support/work with – Aboriginal people 14. Support/work with – Environmental groups 15. Support/work with – Landholders, sustainability of food/agricultural production/land 16. Support/work with – Local government on environmental outcomes 17. Water Allocation Planning 18. Other (specify)

South Australians and the Environment 2016 Page 95 of 98
--- 19. Don't know/not sure
13. Where do you go when looking for information on the environment? Unprompted, multiple response
1. Books 2. Local Council 3. National Parks/Conservation Parks 4. Natural Resource Management Boards 5. Neighbour/friends/relatives/colleagues - word of mouth 6. Newspapers 7. Radio 8. Television - nature shows/ag shows 9. Television - news 10. The Department for the Environment 11. The internet 12. Volunteer groups such as Landcare, Trees for Life etc. 13. Other (specify) --- 14. Don't know/not sure
14. Is there some aspect of the environment that you are interested in learning more about?
1. Yes (specify) 2. Don’t know/not sure 3. No
Segmentation Statements:
15. Please rate, on a scale of 1 to 5, where 5 is strongly agree and 1 is strongly disagree, your level of agreement with the following statements. Read out, rotate
1. I like to interact with nature 2. Regular participation in recreation and leisure outdoors is important to me 3. I am pessimistic about the future 4. I strongly believe what I personally do makes a difference to the environment 5. The environment is not my problem 6. There are things I can do to reduce the impacts of climate change 7. Energy ratings are of vital importance when I purchase household appliances 8. I am happy to pay more for environmentally friendly products 9. I am willing to make considerable sacrifices to improve the quality of natural resources in
South Australia 10. I consider the environment when I decide on my transport options 11. A lot of threats to the environment are exaggerated 12. I think that climate change is a myth 13. There is not enough emphasis on protecting our natural habitats 14. Conserving the natural environment is of critical importance 15. I consider myself to be a strong environmentalist 16. I am highly aware of the impacts that my family and I have on the environment 17. I am well informed about the environment 18. I have little interest in environmental issues 19. I feel there are some environmental issues that I don’t understand

South Australians and the Environment 2016 Page 96 of 98
Classifications:
16. Now to finish off, I just need to ask a few questions to help us analyse the results Record gender, do not ask unless can't tell
1. Male 2. Female
17. In which of the following age groups do you belong? Read out 1-7
1. 15-19 years 2. 20-29 years 3. 30-39 years 4. 40-49 years 5. 50-59 years 6. 60-69 years 7. 70 and over 8. Refused
18. Which of the following best describes the area you live in? Read out 1-5
1. Inner suburban, i.e. within 10km of Adelaide City 2. Outer suburban, more than 10kms from Adelaide City but still within the metropolitan area 3. Semi-rural, larger blocks with land in between 4. Rural area - in a town 5. Rural area - on a farm/remote 6. Don't know 7. Refused
19. Are you currently a home owner or are you renting?
1. Home owner 2. Renting 3. Refused
19a. If home owner and in rural/semi-rural area, i.e. 3-5 in Q18 and 1 in Q19: Approximately how large is the block you reside on? _if needed_ you can answer in metres squared, hectares or acres
1. Metres squared (specify) 2. Hectares (specify) 3. Acres (specify) 4. Don't know 5. Refused
19b. If home owner and in rural/semi-rural area, i.e. 3-5 in Q18 and 1 in Q19:
Do you use your land for growing food or keeping livestock? _If yes_ What kind of landholder are you? _Read out 2-4_
1. No - Don't use land for farming 2. Lifestyle/hobby farmer (relies on non-farm income)

South Australians and the Environment 2016 Page 97 of 98
3. Part time farmer (some on farm income) 4. Full time/Commercial famer 5. Refused
20. ASK ALL: Which of the following best describes your household? Read out 1-7
1. Lone person household 2. Group household of unrelated adults 3. Young couple: married or living together with no children in the home 4. Young family: couple or single parent with most children under 6 5. Middle family: couple or single parent with most children aged from 6-15 years 6. Mature family: couple or single parent with most children over 15 years and at least one
still living at home 7. Mature couple: couple in middle to late age groups (i.e. 40+) with no children in the home 8. Refused
21. What is your current employment status?
1. Full-time employment 2. Part-time/casual employment 3. Unemployed 4. Home duties 5. Unable to work because of disability/workcover/invalid 6. Retired/age pensioner 7. Student 8. Refused
22. What is your highest level of education? Read out codes 1-5
1. Primary School 2. Secondary School 3. TAFE/trade 4. Undergraduate at University 5. Postgraduate at University 6. Refused
23. Which of the following best describes your household income? Read out codes 1-8
1. Under $20,000 pa 2. $20,000-39,999 pa 3. $40,000-59,999 pa 4. $60,000-79,999 pa 5. $80,000-99,999 pa 6. $100,000-$139,999 pa 7. $140,000-$179,999 pa 8. $180,000+ pa 9. Refused
24. What is your postcode?

South Australians and the Environment 2016 Page 98 of 98
25. Do you belong to, volunteer for, or are you involved with, an environmental, landcare or similar group?
1. Yes - which group (specify) 2. Don't know / not sure 3. No
26. Would you prepared to participate in future research projects should they arise?
1. Yes 2. No - GO TO END
27. Excellent, may I please ask your first name? read back to ensure it is correct
28. Is the number I reached you on the best contact phone number for you? if so leave blank, if
not enter new number, read back to ensure it is correct
29. What is your email address? read back to ensure it is correct
END That concludes the survey, on behalf of the state NRM Boards and the Department of Environment, Water and Natural Resources thank you very much for your time.


