Prepared by: American Council for an Energy-Efficient Economy (Project Lead and Energy Efficiency Analysis) Max Neubauer, [email protected] Suzanne DesPortes Bryant Watson Skip Laitner Jacob Talbot Dan Trombley Anna Chittum Sarah Black Laura Furrey Summit Blue Consulting (Demand Response Analysis) Dan Violette Marca Hagenstad Stuart Schare ICF International (CHP Analysis) Kenneth Darrow Anne Hampson Bruce Hedman Synapse Energy Economics (Utility Avoided Costs Estimates) David White Rick Hornby Potomac Resources, Inc. (Water Efficiency Analysis) Edward Osann Disclaimer: While several organizations, including Summit Blue Consulting, ICF International, Synapse Energy Economics, and Potomac Resources, Inc. assisted ACEEE in the completion of this analysis and report, the ultimate viewpoints and recommendations expressed herein are those of ACEEE.
Contents Executive Summary................................................................................................................................iii Acknowledgments ................................................................................................................................viii About the American Council for an Energy-Efficient Economy ............................................................viii Glossary.................................................................................................................................................. x Introduction .............................................................................................................................................1
South Carolina's Resources...............................................................................................................1 Harnessing South Carolina's Efficiency Potential ..............................................................................2 ACEEE's Contribution ........................................................................................................................3
Background.............................................................................................................................................4 South Carolina Electricity Market .......................................................................................................5 Electricity Generation and Water Consumption .................................................................................7 Role of Energy Efficiency ...................................................................................................................8 Water Efficiency by Public Water Suppliers and Customers ...........................................................10
Project Approach and Methodology .....................................................................................................12 Overall Project Context: Why We Chose South Carolina ................................................................12 Stakeholder Engagement.................................................................................................................13 Analysis Methodology ......................................................................................................................14
Meta Analysis .......................................................................................................................................20 Regional Energy Efficiency Potential ...............................................................................................22 National Energy Efficiency Potential ................................................................................................23
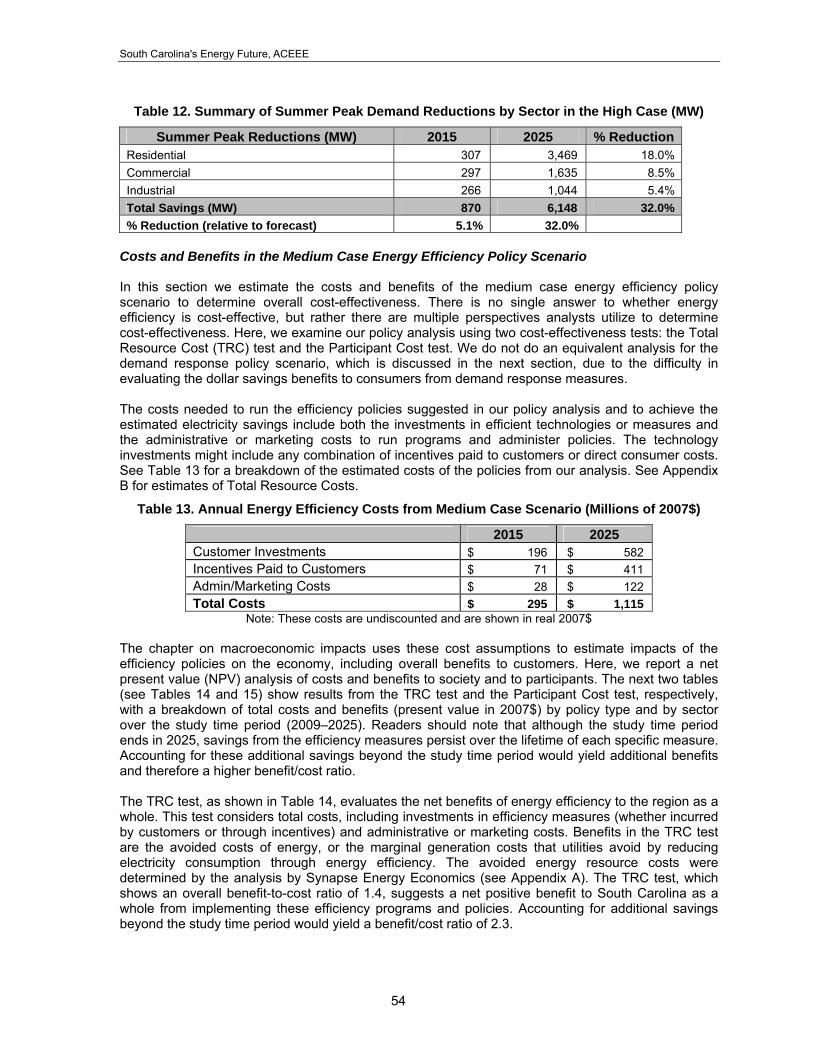
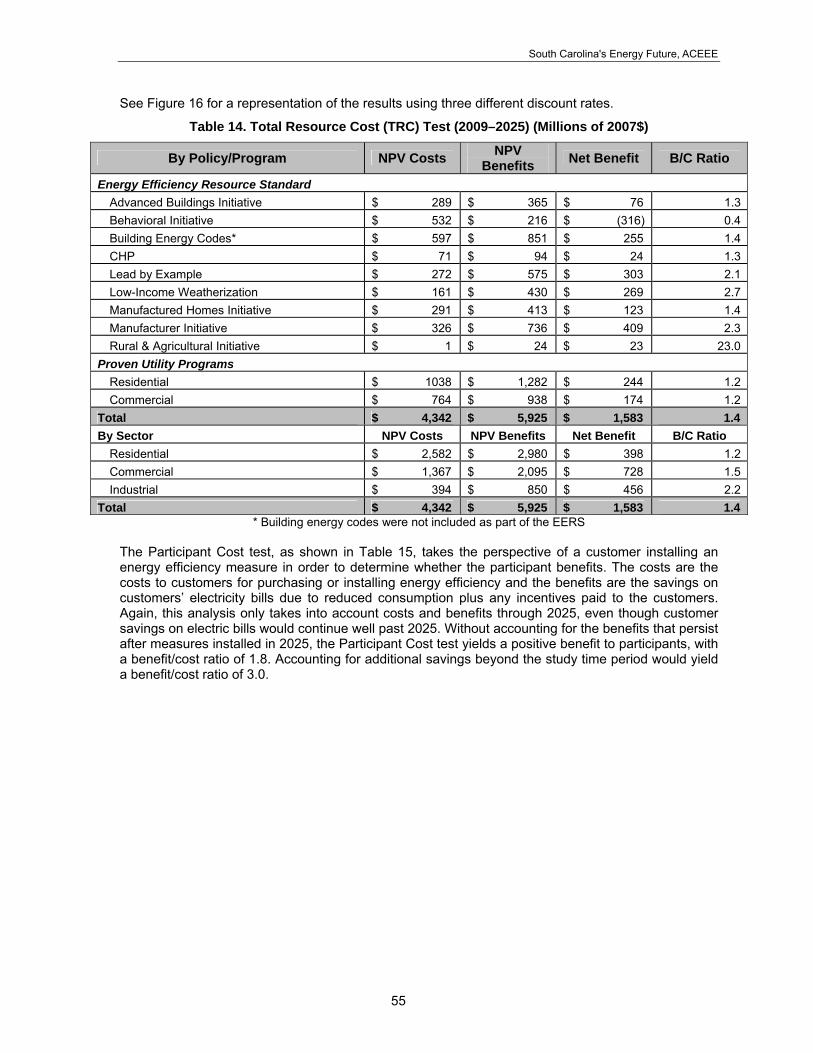
Energy Efficiency Policy Analysis.........................................................................................................25 Discussion of Electricity Policies ......................................................................................................28 Discussion of Proven Utility Programs.............................................................................................47 Examples of Proven Energy Efficiency Programs ...........................................................................47 Financing Options for Energy Efficiency ..........................................................................................49 Energy Efficiency Policy Scenario Results ......................................................................................50
Water Efficiency Policy Analysis...........................................................................................................57 Water Efficiency Policy Options for Public Water Supplies..............................................................57
Assessment of Demand Response Potential .......................................................................................62 Defining Demand Response ............................................................................................................62 Rationale for Investigating Demand Response................................................................................62 Demand Response in South Carolina—Background.......................................................................63 Role of Demand Response in South Carolina’s Resource Portfolio................................................63 Assessment of Demand Response Potential in South Carolina......................................................63 Recommendations ...........................................................................................................................65
Macroeconomic Impacts: Impact of Policies and Programs on South Carolina's Economy, Employment, and Energy Prices ..........................................................................................................66
Methodology.....................................................................................................................................67 Illustrating the Methodology: South Carolina Jobs From Efficiency Gains .....................................67 Impacts of Recommended Energy Efficiency Policies.....................................................................70
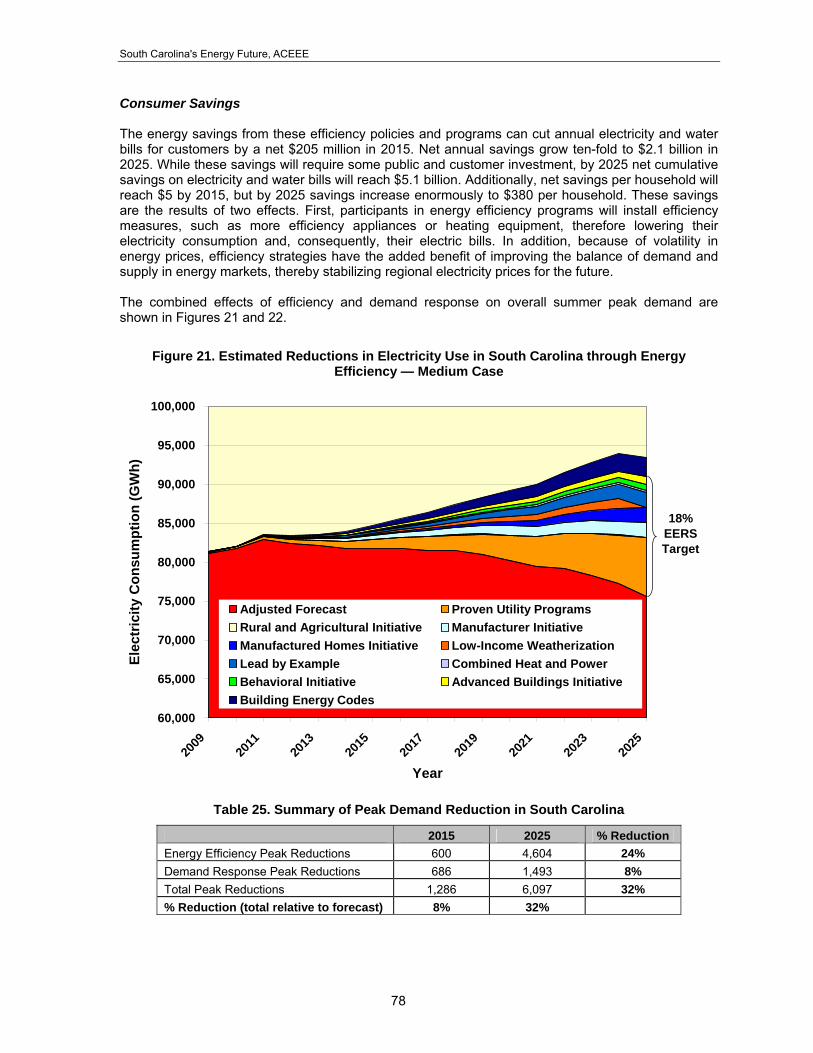
Emissions Impacts from Policy Scenarios............................................................................................74 Efficiency Impacts on Power Plant Water Use .....................................................................................75 Summary of Findings............................................................................................................................77
Energy Efficiency Resource Economic Potential .............................................................................77 Impacts of Energy Efficiency and Demand Response.....................................................................77 Macroeconomic Impacts ..................................................................................................................79
Discussion and Recommendations ......................................................................................................79 Potential Role of Key Policymakers .................................................................................................80 Program and Policy Implementation ................................................................................................81
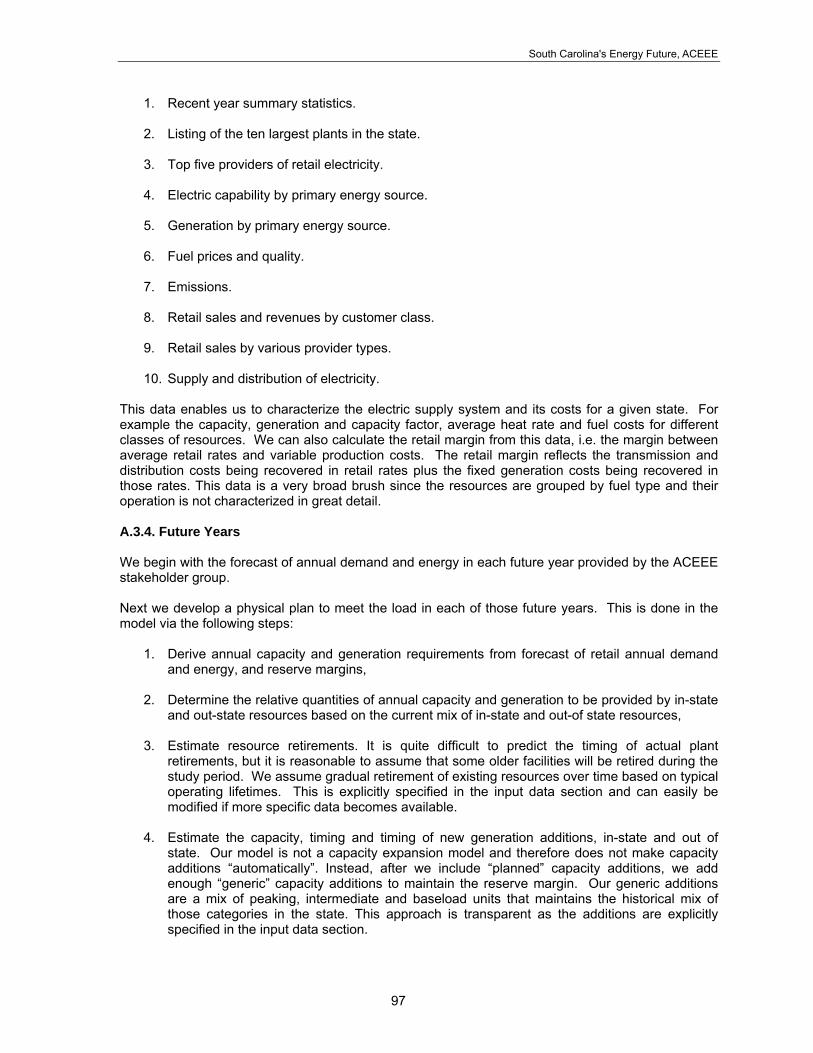
A.1 Projection of Electricity Consumption and Peak Demand .........................................................91 A.2. Projection of Supply Prices and Avoided Costs .......................................................................92 A.3. Electricity Planning and Costing Model ....................................................................................95 A.4. Reference Case Electricity Supply Prices and Avoided Costs.................................................99 A.5. Policy Case Electricity Supply Prices and Avoided Costs......................................................102
D.1. Introduction .............................................................................................................................113 D.2. Defining Demand Response...................................................................................................114 D.3. Rationale for Demand Response ...........................................................................................115 D.4. Assessment Methods .............................................................................................................116 D.6. Commercial and Industrial DR Potential in South Carolina....................................................128 D.7. Summary of DR Potential Estimates in South Carolina .........................................................136 D.8. Comparison of Estimated DR Potential with Results from Other Studies..............................137 D.9. Recommendations..................................................................................................................137
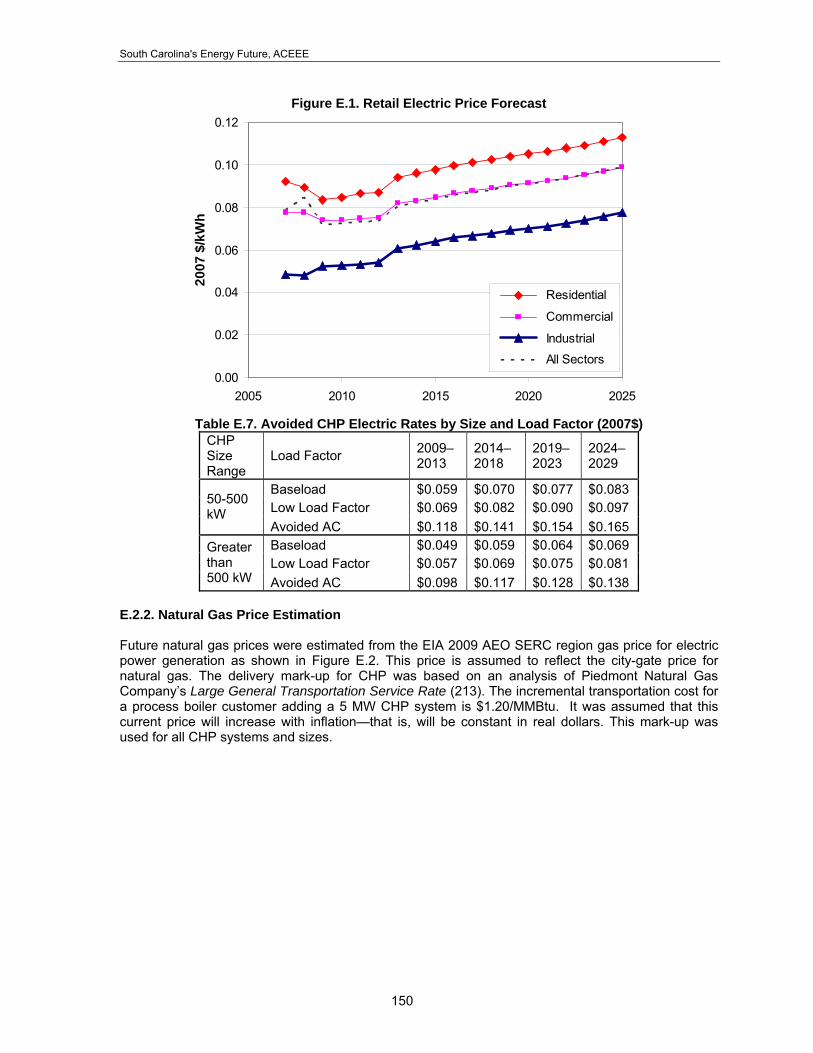
Appendix E—Combined Heat and Power ..........................................................................................141 E.1. Technical Potential for CHP....................................................................................................141 E.2. Energy Price Projections ........................................................................................................148 E.3. CHP Technology Cost and Performance ...............................................................................150
Appendix F—Additional Resources....................................................................................................161 Appendix G—The DEEPER Model and Macro Model .......................................................................163
South Carolina's Energy Future, ACEEE
iii
Executive Summary South Carolina’s leaders in both the public and private sectors are showing renewed interest in adopting energy efficiency policies and programs. For this reason, the American Council for an Energy-Efficient Economy (ACEEE) chose to work with the State of South Carolina as part of our State Clean Energy Resource Project. ACEEE reviewed many of the state’s existing and proposed energy efficiency-related efforts, and determined that South Carolina could benefit from an in-depth analysis of the potential within the state for greater efficiency investments. As this report clearly demonstrates, energy efficiency has the potential to provide short- and long-term economic and social benefits to South Carolina's consumers, such as creating new, local jobs; lowering consumer bills; and abating emissions, all of which will help to stimulate the economy. Recent developments in South Carolina have shown the state is making a number of prudent investments in energy efficiency that should pay off over time in terms of new jobs and economic growth. Commitments to reduce energy consumption in state-owned buildings, improve building energy codes, weatherize homes, and increase utility investment in electric efficiency programs highlight movement away from business as usual and towards a period of stronger economic and social development. South Carolina has been hit particularly hard by the recent recession. Growth in real gross state product (GSP) has been steadily declining since 2005, from 2.4% to 0.6%, positioning South Carolina 32nd in economic growth in the country. South Carolina's unemployment rate is the fifth highest in the nation, hovering around 11.6% as of October 2009. But current economic conditions should not preclude the state from exploring and exploiting its significant energy efficiency resources. In fact, in helping to revitalize its economy, energy efficiency should be regarded as the state's "first fuel." Looking beyond the state’s existing energy efficiency measures, ACEEE developed additional policy suggestions, which were analyzed as part of this report after extensive stakeholder discussions in the state over a series of months. The results show that South Carolina’s economy can benefit greatly by further investment in specific energy and water efficiency measures. For the first time in any of our state reports, ACEEE conducted an analysis of several water efficiency policies, as well as added three new energy efficiency measures of interest to the state: improved efficiency in manufactured housing; implementation of a behavioral awareness program; and a rural/agricultural initiative. This last initiative is of particular importance to a state such as South Carolina with a large population of rural residents. Electricity and Water Policy Recommendations For our energy and water policy analyses, we developed a suite of eleven energy and five water efficiency policy suggestions based on successful models implemented in other states and in-depth consultation with stakeholders in South Carolina. Of the eleven electricity policies we are recommending, there are eight that ACEEE suggests be eligible to contribute towards a utility savings target that would be required by an energy efficiency resource standard (EERS), which we suggest be set at 18% of projected sales in 2025. The EERS represents the core of these policies, providing a foundation upon which the other policies may be layered to achieve the greatest savings. But it is important to note that the EERS is simply an amalgamation of the savings generated by the individual policies and utility programs, so its absence does not preclude the efficacy of the policy and program recommendations included in this report. We estimate that the eight policies have the potential to meet 10% of South Carolina's electricity needs by 2025 in our medium case scenario, irrespective of the presence of an EERS.1 With an EERS in place, however, utilities would be required to meet the
1 Three of the policies—Lead by Example, Low-Income Weatherization, and the Manufactured Homes Initiative—are policies that have already been implemented in the state, and our analysis attempts to estimate the potential savings that could be realized over the program period and beyond.
South Carolina's Energy Future, ACEEE
iv
remaining 8% of the savings target by implementing their own efficiency programs. Our eleven energy policy recommendations, which include three enabling policies, are as follows:
A. Energy Efficiency Resource Standard 1) Advanced Building Initiative 2) Behavioral Initiative 3) Combined Heat and Power 4) Lead by Example 5) Low-Income Weatherization 6) Manufactured Homes Initiative 7) Manufacturer Initiative 8) Rural and Agricultural Initiative
B. Enabling Policies 9) Building Energy Codes 10) Workforce Development Initiative 11) Expanded Demand Response Programs
Figure ES-1 shows the contribution of the individual policies and utility programs we have recommended. Our suite of energy efficiency policies will contribute savings of 9,503 GWh, or 10% of South Carolina's electricity demand, by 2025. The remaining 8%, or 7,491 GWh of the EERS target, can be met readily by utility programs. In this report we highlight the best of these programs that have been proven to be effective at reducing electricity consumption in other states across the U.S.
Figure ES-1. Estimated Reductions in Electricity Use in South Carolina through Energy Efficiency
60,000
65,000
70,000
75,000
80,000
85,000
90,000
95,000
100,000
2009
2011
2013
2015
2017
2019
2021
2023
2025
Year
Ele
ctri
city
Co
nsu
mp
tio
n (
GW
h)
Adjusted Forecast Proven Utility Programs
Rural and Agricultural Initiative Manufacturer Initiative
Manufactured Homes Initiative Low-Income Weatherization
We also find that a suite of demand response (DR) recommendations, which focus on shifting energy from peak periods to off-peak periods and cutting back electricity needs during periods with the highest demand, is a critical component of reducing peak demand in South Carolina. Figure ES-2 presents the combined effects of energy efficiency and demand response on peak reductions.
South Carolina's Energy Future, ACEEE
v
Figure ES-2. Estimated Reductions in Peak Demand through Energy Efficiency and Demand Response
(2025 Peak Reduction = 6,097 MW or 32%)
-
4,000
8,000
12,000
16,000
20,000
24,000
2009
2011
2013
2015
2017
2019
2021
2023
2025
Pe
ak D
ema
nd
(M
W)
Adjusted Peak Load
Demand Response
Efficiency24%
8%
To assist South Carolina’s public water supply and wastewater treatment systems to meet the growing demand for water and wastewater service cost-effectively, we suggest five water efficiency policies as follows:
1) Plumbing Efficiency Standards 2) Replacement of Inefficient Plumbing in Pre-1995 Homes 3) Utility System Water Loss (Leakage) Reduction 4) Water Efficient Landscape Irrigation 5) Conservation Pricing of Water and Sewer Service2
In addition, we assume that electric utility efficiency programs will direct a portion of their customer incentives to the purchase of energy- and water-efficient clothes washers, and have estimated the water savings that will result. We also estimate the electricity savings that result from these water efficiency measures, both at the customers’ location and at water and wastewater utilities that pump and treat less water as a result of these policies. Table ES-1 shows the impact of our recommended water policies on water and electricity consumption.
2 Water savings from conservation pricing were not quantified, but we recommend its inclusion in state water policy in order to address current rate structures that may promote excessive water consumption.
South Carolina's Energy Future, ACEEE
vi
Table ES-1. Summary of Water and Electricity Savings by Water Efficiency Policy
Medium Case High Case
Annual Water Savings by Policy (mgd) 2015 2025 2015 2025
Total Electricity Savings from Water (GWh) 21.2 84.9 22.8 93.2 Notes 1. Recommended, but potential water savings not quantified. 2. Clothes washer water savings shown here; clothes washer energy savings are included in Utility Program electricity savings. 3. Indoor water use reductions yield offsite electricity savings of 3,239 KWh/mg; outdoor water use reductions yield offsite electricity savings of 2,061 KWh/mg.
To put these savings in perspective, the water savings estimated under the high case for 2025 (41.9 mgd) equates to 6.8% of the total water use reported by South Carolina’s public water suppliers in 2006. Finally, we make a first-order estimate of the impact that successful energy efficiency measures would have on the use of cooling water by thermoelectric power plants in South Carolina. Power plant cooling is the largest off-stream use of water in South Carolina, by far. The operations of baseload power plants will be largely unaffected by energy efficiency programs, but electricity savings will result in reduced generating hours at load-following plants. We estimate that energy efficiency policies under the medium case will reduce water withdrawals by 300 million gallons per day (mgd) in 2015 and over 1,800 mgd in 2025. Withdrawals are likely to be larger than these averages in summer months and lower than these averages in winter months. Given the distribution of the principal load-following thermoelectric plants in the state, we estimate that the bulk of these savings (80%) can be distributed as shown in Table ES-2. We have not assigned dollar values to these savings, but suggest that improvements in stream flows and attendant reliability of supplies for drinking water, fish and wildlife, and power generation itself are likely to result.
Table ES-2. Estimated Reductions in Thermoelectric Cooling Water Use Resulting from Medium Case Energy Efficiency, by Basin (mgd)
River Basin Withdrawals Consumption 2015 2025 2015 2025
Impacts on Employment and the Economy from Energy and Water Efficiency The energy savings from these efficiency policies and programs can cut the net annual electricity and water bills for customers by $9 million in 2015. Net annual savings grow to $1.3 billion in 2025. While these savings will require some public and customer investment, by 2025 net cumulative savings on electricity bills will reach $5.1 billion. These savings are the result of two effects. First, participants in energy and water efficiency programs will install efficiency measures, such as more efficient appliances or heating equipment, therefore lowering their electricity and water consumption and electric and water bills. In addition, because of the current volatility in energy prices, efficiency strategies have the added benefit of improving the balance of demand and supply in energy markets, thereby stabilizing regional electricity prices for the future. Investments in efficiency policies and programs can also help create new, high-quality "green-collar" jobs in South Carolina while increasing both wages and GSP. Our analysis shows that energy efficiency investments can create almost 22,000 new, local jobs in South Carolina by 2025 (see Table ES-3), including well-paying trade and professional jobs needed to design, install, and operate energy efficiency measures. These new jobs, including both direct and indirect employment effects, would be equivalent to 175 new manufacturing facilities locating to the state.
Table ES-3. Economic Impact of Energy Efficiency Investments in South Carolina
Macroeconomic Impacts 2010 2015 2020 2025
Jobs (Actual) 13,597 18,891 19,625 21,887
Wages (Million $2007) $402 $533 $515 $408
GSP (Million $2007) $767 $985 $716 $99
Conclusions South Carolina is at a turning point where the state and its policymakers can choose either to continue to depend upon conventional energy resource generation, or choose to slow—or even to reduce—future demand for electricity by investing in efficiency. As this assessment demonstrates, there are plenty of cost-effective energy and water efficiency opportunities in the state. However, as this report also discusses, these opportunities will not be realized without changes and additions to its current policies and programs. The state ranked 37th out of the 50 states in ACEEE’s recently released 2009 State Energy Efficiency Scorecard. That score can be improved significantly without harm to the economy—in fact with a positive outcome for both jobs and economic growth. These policy and program suggestions should not be viewed as definitive, but as the starting point for a dialog among stakeholders on how to better realize the resource that is energy efficiency. To facilitate this future dialog, ACEEE is funded to provide limited technical assistance for eighteen months following the release of the report. Since we intend this report to be used as a roadmap to guide future efficiency resource decisions, it is important that ACEEE remains available to stakeholders to help as needed and as staff resources allow. We do not, however, suggest that our efficiency policy suggestions will necessarily meet all of the state's future energy demand. Clearly there are other policies and programs that could be implemented to realize even more of the available energy efficiency resource. Most of the electric and water policies we suggest can also be augmented to realize even greater savings, which we analyze in our more aggressive “high case” policy scenario. Nonetheless, while energy efficiency is perhaps the only new energy resource available in the immediate future and can make an important contribution in the longer term, the state will likely need additional generation resources to meet the remainder of the new load and replace older, less efficient power plants in the coming years. But
South Carolina's Energy Future, ACEEE
viii
utilizing energy efficiency as South Carolina's first fuel resource will provide the time needed to engage in the important dialog over how the state will proceed to define its energy future.
Acknowledgments This report was funded by the Energy Foundation, the U.S. Environmental Protection Agency, the U.S. Department of Energy, and the Google Inc. Charitable Giving Fund of Tides Foundation. The authors and staff of ACEEE would like to thank these organizations for their support. Thank you also to the following people and organizations who aided our efforts through interviews and one-on-one meetings, or who reviewed and commented on an earlier draft of this report: The Honorable Paul G. Campbell, Jr.; The Honorable James E. Smith, Jr.; John Clark, Rick Grant, and Trish Jerman (South Carolina Energy Office); Dan Arnett, Florence Belser, Douglas Carlisle, Jr., Scott Dukes, John Flitter, Leigh Ford, Shannon Hudson, Jay Jashinsky, Willie Morgan, and Jeffrey Nelson (Office of Regulatory Staff); Jason Craig, Michael Koman, and Helen Ziegler (University of South Carolina); Felicia Rhue Howard (SCE&G); Gene Hogan; Joel Deason; Stephen Lehrman; Bradley Wright (Office of Speaker of the House); Jeff Schilz (Office of the Governor); John Tiencken (Tiencken Law Firm); Ann Shahid; Patricia Pierce; Dana Beach and Ben Moore (Coastal Conservation League); Cary Chamblee; Colin Hagan and John Wilson (Southern Alliance for Clean Energy); David Odell; Melody Birmingham-Byrd and Chris Edge (Progress Energy Carolinas); James "Buddy" Atkins; Otis Rawl (SC Chamber of Commerce); Cary Chamblee; Eliah Gilfenbaum; Lewis Gossett (South Carolina Manufacturers Alliance); Ben Gregg (South Carolina Wildlife Federation); Brian Henderson (Energy Management Consulting); John Irion and Charles Rampey (South Carolina Manufacturing Extension Partnership); Michael Juras (South Carolina Department of Health and Environmental Control); Ashlie Lancaster, Gregg McConkey, and Paul Younginer (South Carolina Governor's Office of Economic Opportunity); Ron Calcaterra, Michael Couick, and David Logeman (Central Electric Power Cooperative, Inc.); Carolee Williams (City of Charleston); Denver Merrill (Citizens for Sound Conservation); Paul Messerschmidt; Marcus Newberry; Larry Newton; John Ramsburgh and Ann Timberlake (Conservation Voters of South Carolina); Ted Schultz and Raiford Smith (Duke Energy); John Steedly and Mark Tye (Santee Cooper); Phillip Van Steenburgh; Arthur Von Lehe; Scott Winburn; David Wooley (The Energy Foundation); and Alex Laskey and Michael Sachse (OPower). It is not the intention of the authors in acknowledging these people and their organizations to indicate that there is an endorsement of the contents of the report—only to point out that they offered input and comment that made the analysis and final report possible and to thank them. We certainly hope there are none we overlooked but fear there probably are. A special note of appreciation goes out to our local media firm, The Gillespie Agency, and to its staff—Nola Armstrong and Donna Thorne—who most ably guided us through the roll out of this report.
About the American Council for an Energy-Efficient Economy ACEEE is a nonprofit organization dedicated to advancing energy efficiency as a means of promoting economic prosperity, energy security, and environmental protection. For more information, see www.aceee.org. ACEEE fulfills its mission by:
Conducting in-depth technical and policy assessments Advising policymakers and program managers Working collaboratively with businesses, public interest groups, and other organizations Organizing conferences and workshops Publishing books, conference proceedings, and reports Educating consumers and businesses
Projects are carried out by staff and selected energy efficiency experts from universities, national laboratories, and the private sector. Collaboration is key to ACEEE's success. We collaborate on
projects and initiatives with dozens of organizations including federal and state agencies, utilities, research institutions, businesses, and public interest groups. Support for our work comes from a broad range of foundations, governmental organizations, research institutes, utilities, and corporations.
South Carolina's Energy Future, ACEEE
x
Glossary
ENERGY POLICY AND ORGANIZATIONS (ASHRAE) American Society of Heating, Refrigerating and Air-Conditioning Engineers: Organization of
over 50,000 professionals in the air-conditioning, heating, refrigerating and ventilating fields. Support the integration of increased energy efficiency in building design via technological enhancements of these systems (www.ashrae.org/).
(EERS) Energy Efficiency Resource Standard: A simple, market-based mechanism to encourage more
efficient generation, transmission, and use of electricity and natural gas. An EERS consists of electric and/or gas energy savings targets for utilities. All EERS include end-user energy saving improvements that are aided and documented by utilities or other program operators. Often used in conjunction with a Renewable Portfolio Standard (RPS). (See ACEEE's fact sheet for state details: aceee.org/energy/ state/policies/2pgEERS.pdf.)
ENERGY STAR®: A joint program of the U.S. Environmental Protection Agency and the U.S. Department of
Energy helping residential customers save money and protect the environment through energy-efficient products and practices (energystar.gov/). Includes appliance efficiency standards and new building codes.
(EPAct) Energy Policy Act: Law directing U.S. energy policy; first passed in 1992 and major revisions were
passed in 2005 and 2007. (ESCO) Energy Service Company: Provides designs and implementation of energy savings projects. The
ESCO performs an in-depth analysis of the property, designs an energy-efficient solution, installs the required elements, and maintains the system to ensure energy savings.
(ESPC) Energy Service Performance Contracting: A financing technique that uses cost savings from reduced
energy consumption to repay ESCO's (see above) for the cost of installing energy conservation measures and other services.
(FERC) Federal Energy Regulatory Commission: Federal agency that “regulates and oversees energy
industries in the economic, environmental, and safety interests of the American public” (www.ferc.org). (IRP) Integrated Resource Plan: A comprehensive and systematic blueprint developed by a supplier,
distributor, or end-user of energy who has evaluated demand-side and supply-side resource options and economic parameters and determined which options will best help them meet their energy goals at the lowest reasonable energy, environmental, and societal cost (www.energycentral.com/ centers/knowledge/glossary/home.cfm).
(LIHEAP) Low-Income Home Energy Assistance Program: A federally funded program intended to assist low-
income households that pay a high proportion of household income for home energy, primarily in meeting their immediate home energy needs.
(SERC) Southeastern Electric Reliability Council: Located in 12 states in the Southeastern United States, it is
responsible for promoting, coordinating and ensuring the reliability and adequacy of the bulk power supply systems in its region.
GENERAL REPORT TERMINOLOGY
Cumulative Savings: Sum of the total annual energy savings over a certain time frame. Demand-Side Management (DSM): Programs that focus on minimizing energy demand by influencing the
quantity and use-patterns of energy consumption by end-users, as opposed to supply-side management, which focuses on investments in system infrastructure.
Energy Efficiency: The implementation of programs and policies that minimize the consumption of energy
Incremental Annual Savings: Energy savings occurring in a single year from the current year programs and policies only.
Potential: amount of energy savings possible:
- Achievable Potential: Potential that could be achieved through normal market forces, new state building codes, equipment efficiency, and utility energy efficiency programs
- Economic Potential: Potential based on both the Technical Potential and economic considerations (e.g., system cost, avoided cost of energy)
- Technical Potential: Potential based on technological limitations only (no economic or other considerations)
Retrocommissioning: Often abbreviated as RCx, this is a systematic process for optimizing building
performance post-construction. Through the RCx process, improvements to building systems and operations are identified that can yield significant energy and non-energy savings, such as extended equipment life, improved indoor air quality, and reduced O&M costs, among others.
Retrofit Measure: The act of replacing a technology with a more energy-efficient technology before its end of
life. Cost basis is the full cost of the new technology, including installation. Total Annual Savings: Energy savings occurring in a single year from the current year programs and policies
and counting prior year savings. Sum of all Incremental Annual Savings.
INDUSTRY and BUILDINGS TECHNOLOGY (CHP) Combined Heat and Power: method of using waste heat from electrical generation to offset traditional
process or space heating. Also called cogeneration (cogen). HVAC: Heating, ventilation, and air conditioning system. (NAICS) North American Industry Classification System: 6-digit code used to group industries by product.
UTILITY TERMS Avoided Costs: The marginal costs incurred by utilities for additional electric supply resources. Used by utilities
to evaluate the cost-effectiveness of energy efficiency programs. Demand Response: The reduction of customer energy usage at times of peak usage in order to help address
system reliability, reflect market conditions and pricing, and support infrastructure optimization or deferral. Demand response programs may include dynamic pricing/tariffs, price-responsive demand bidding, contractually obligated and voluntary curtailment, and direct load control/cycling.
Distributed Energy Resource: Electrical power generation or storage located at or near the point of use, as well
as demand-side measures. Distributed Generation: Electric power generation located at or near the point of use. Distributed Power: Electrical power generation or storage located at or near the point of use. Electricity Distribution: Regulating voltage to usable levels and distributing electricity to end-users from
substations. Electricity Generation: Converting a primary fuel source (e.g., coal, natural gas, or wind) into electricity. Electricity Transmission: Transport of electricity from the generation source to a distribution substation, usually
via power lines. (IOU) Investor-Owned Utility: Also known as a private utility, IOU’s are utilities owned by investors or
shareholders. IOU’s can be listed on public stock exchanges. (ISO) Independent System Operator: Entity that controls and administers nondiscriminatory access to electric
transmission in a region or across several systems, independent from the owners of facilities.
South Carolina's Energy Future, ACEEE
xii
Levelized Cost: The level of payment necessary each year to recover the total investment and interest payments at a specified interest rate over the life of the measure.
Peak Demand: The highest level of electricity demand in the state measured in megawatts (MW) during the
year. Power Pool: Two or more interconnected electric systems planned and operated to supply power in the most
reliable and economical manner for their combined load requirements and maintenance programs. Renewable Generation: Electric power generation from a renewable energy source such as wind, solar,
sustainably harvested biomass, or geothermal. (REC) Rural Electric Cooperative: REC’s are nonprofit, cooperative utilities that provide electricity to rural
areas and are owned by all customers of that utility. Wholesale Competition: A system in which a distributor of power would have the option to buy its power from a
variety of power producers, and the power producers would be able to compete to sell their power to a variety of distribution companies.
Wholesale Electricity: Power that is bought and sold among utilities, non-utility generators, and other wholesale
entities, such as municipalities. Wholesale Power Market: The purchase and sale of electricity from generators to resellers (that sell to retail
customers) along with the ancillary services needed to maintain reliability and power quality at the transmission level.
South Carolina's Energy Future, ACEEE
1
Introduction Recent policy developments in the State of South Carolina have shown that it is making prudent investments in its future for both the benefit of sustained economic growth across all sectors of its economy and, most importantly, for the perpetuation of a rich quality of life for its citizens. Commitments to minimize energy consumption in its state-owned buildings, improve its building energy codes, weatherize its homes, and increase utility-level spending on electric efficiency programs highlight movement away from business as usual and towards preparing the state and its resources for a period of strong economic and social vitality. In its pursuit of these goals, the state has weathered various periods of economic growth and stagnation over the years, often localized in certain areas or sectors of the state. In fact, South Carolina has been hit particularly hard by the recent recession, a situation that has left its policymakers scrambling to spur employment. Growth in real gross state product3 has been steadily declining since 2005, from 2.4% to 0.6%, positioning South Carolina 32nd in terms of economic growth (BEA 2009). Subsequently, as the economy contracts, industries weaken and factories close, forcing employers to shed jobs—an inescapable trend all too familiar across the U.S. at the moment, but one that has had particularly painful implications for the state: South Carolina's unemployment rate is the fifth highest in the nation, hovering just above 11.6% as of October (BLS 2009). South Carolina's Resources While the effort to restore equilibrium to South Carolina's economy moves forward, the state is also working to resolve issues concerning its energy and natural resources. Over 90% of the electricity generated in South Carolina is produced by nuclear and coal-fired power plants and two utilities are planning on co-investing large sums of capital to add to their fleets, due to the expectation that demand will grow in the future and that long-term generation requirements must be addressed sooner rather than later. But current and future economic and political factors are changing the investment landscape. Nuclear power plants may prove expensive to build, a difficulty compounded by banks' reluctance to issue credit given the condition of the national and most state economies. And although coal-fired plants are relatively less expensive to construct, compliance with more stringent emission limits under current law as well as impending federal climate legislation will likely increase their operating costs.4 Both types of generating facilities require at least ten years of planning, permitting, and construction before they are able to help meet the growing needs of the state. Increasing demand for energy and high unemployment requires the need for a quicker, cheaper, and cleaner resource in the short term—energy efficiency (see Figure 1).
3 Gross state product is the state counterpart of the national gross domestic product (GDP), where real GSP is "an inflation-adjusted measure of each state's gross product that is based on national prices for the goods and services produced within that state" (BEA 2009). 4 Santee Cooper recently scrapped its plans to build its Pee Dee Power Generation Plant in Florence. We discuss this further in our section on the South Carolina electricity market.
South Carolina's Energy Future, ACEEE
2
Figure 1. Levelized Electricity Resource Cost Estimates for 2020
0
2
4
6
8
10
12
Energy Efficiency(a)
Wind Natural Gas Coal Nuclear
Lev
eliz
ed c
ost
of
elec
tric
ity
(ce
nts
/kW
h)
(200
7$)
Source: EIA 2009(e), except for (a): Energy efficiency program costs are the estimate of current utility efficiency
program cost of saved energy (CSE), as described in Friedrich et al. (2009). As an added complexity, nuclear and coal-fired power plants both require substantial volumes of cooling water to operate; however, once-through cooling nuclear and coal-fired plants return almost all of the withdrawn water back to the water source. Given that the southeastern United States has experienced severe droughts over the last several years, expanding the state's generating capacity without first minimizing demand will be one component of the challenges the state faces in planning for future multi-use water supply. As an added concern, South Carolina filed a federal lawsuit against North Carolina in 2007 over one of its shared water resources, the Catawba River, citing that large municipal diversions just north of the state border could cripple South Carolina's water-dependent industries, including electricity generation. The ties between water and electricity are inextricable: municipal water suppliers require electricity for potable water treatment and wastewater treatment while thermoelectric power plants require cooling water to generate electricity. If South Carolina is intent on maintaining a reliable supply of electricity and water for its citizens in a time of volatile energy markets and declining water tables, it must first begin to utilize these resources more efficiently. Harnessing South Carolina's Efficiency Potential Energy efficiency and demand response can provide critical relief from short-term market impacts as they represent the least-cost resources available and are the quickest to deploy. And unlike supply-side energy resources, efficiency and demand response are the only resources that can begin to reduce electric bills by decreasing overall consumption, which will save the state and its consumers money that can then be reinvested in South Carolina's economy. Similarly, improved water efficiency by public water systems and their customers can reduce the cost of water and wastewater service, enhance the reliability of supply, and add to the energy savings and emission reductions of energy efficiency programs.
South Carolina's Energy Future, ACEEE
3
Investing in energy and water efficiency can also contribute to improving South Carolina's employment. An important facet of expanding energy and water efficiency in the state is the need for a trained workforce capable of identifying, implementing, and operating efficiency improvements. From auditors to operators, curtailing electricity and water demand will create tens of thousands of new, local, high quality "green-collar" jobs, a number that will grow over time as efficiency programs intensify and become more ubiquitous. The state has been given a remarkable opportunity to build a foundation for an efficient future. Funds appropriated through the American Recovery and Reinvestment Act will provide a catalyst to get South Carolina's efficiency programs off the ground and running. South Carolina's Energy Office (SCEO) was allocated $50 million through the State Energy Program (SEP) and submitted its application for this funding on May 12, 2009, which will be dispersed to five programs created by the SCEO to target efficiency improvements across all sectors of the economy. South Carolina was also allocated $31.5 million in competitive grants for state and local projects through the Energy-Efficiency and Conservation Block Grant Program (EECBGP), as well as $59 million for its Weatherization Assistance Program. If these resources are invested prudently, they will be a boon to programs at the state and local levels, helping to generate numerous new, local "green" jobs and thereby allowing South Carolina to lay the foundation for robust efficiency programs that will generate savings, jobs, and economic growth for years to come. ACEEE's Contribution The goal of this study is to inform policymakers and stakeholders of the opportunities for electric efficiency, demand response, and water efficiency in South Carolina, and also to suggest policies South Carolina could implement to facilitate the development of these resources. We present the results in a fashion designed to help educate policymakers and the general public about the importance of efficiency, as well as to inform policy development in South Carolina over the next several years by identifying policy and technical opportunities for achieving major efficiency benefits and savings. This is done with an eye to honoring the state’s own unique characteristics and needs as much as possible. It is not intended as a dictate to policymakers but rather as a guide to inform the state's future decision-making. Many states in the country are already moving forward and initiative taken by South Carolina can help propel it to the forefront of those states fashioning good energy policy that can pay off in added economic competitiveness. To help facilitate South Carolina's progress, ACEEE is funded to provide technical assistance for eighteen months following the release of this report. Since we intend this report to be used as a road map to guide future efficiency resource decisions, it is important that ACEEE remains available to stakeholders to help in whatever capacity is necessary. This report is organized into the following sections:
Background: Reviews the electricity and water markets in South Carolina, including recent actions and future opportunities regarding energy efficiency, demand response, and water efficiency.
Project Overview and Methodology: Provides a context for ACEEE's work with state-level energy efficiency and demand response potential studies and an overview of both the project approach and analysis methodology.
Reference Case: Discusses the reference case for electricity, peak demand, and price
forecasts used in this analysis.
Energy Efficiency Meta Analysis: Supplants our energy efficiency resource assessment featured in other studies by reviewing and summarizing key information from a variety of economic potential studies that have already been conducted in South Carolina, the greater Southeast region, and the nation as a whole.
South Carolina's Energy Future, ACEEE
4
Energy Efficiency Policy Analysis: Outlines the energy efficiency resource standard (EERS) and eleven individual suggested policies that South Carolina could adopt to tap into the energy efficiency resource potential. This section presents the electricity and peak demand impacts from energy efficiency as well as the reductions in thermoelectric cooling requirements attributable to the implementation of energy efficiency measures. Also presented are the associated costs and an evaluation of program costs using two cost-effectiveness tests (Total Resource Cost, or TRC, and the Participant Cost tests). Finally, this section includes an estimation of carbon dioxide emissions impacts.
Water Efficiency Policy Analysis: Evaluates the five potential policies that South Carolina
could adopt to capture cost-effective opportunities for public water systems and their customers to save water. This section presents potential water savings for public water systems and estimates the resulting onsite electricity savings. Also presented are the costs associated with each policy and estimates of their resulting cost-effectiveness.
Demand Response Analysis: Estimates the potential for increased demand response in
South Carolina and makes specific recommendations to the state.
Macroeconomic Impacts: Estimates the impact of energy and water efficiency policies on South Carolina's economy, employment, and energy prices.
Emissions Reductions: This section includes an estimation of carbon dioxide emissions
impacts both for the state and the Southeastern Electric Reliability Council (SERC).
Efficiency Impacts on Power Plant Water Use: Estimates the impact of projected electricity savings on the cooling requirements of South Carolina's principal load-following thermoelectric power plants.
In addition, we provide details and references to resources for most of these sections in the technical appendices that accompany the body of this report.
Background South Carolina's economy is one of the most energy intensive in the nation. As illustrated in Table 1 below, this is true whether one considers electricity alone or all forms of energy use. For 2007, South Carolina was ranked the 7th and 18th highest in the nation in electricity consumption per capita and total electricity consumption, the 15th and 13th highest in terms of energy consumption per capita and per dollar of GSP, and 22nd in total energy consumption (EIA 2009b, 2009d). South Carolina households consume an average of 14,500 kWh annually, compared to a national average of 11,000 kWh (EIA 2009b).
Table 1. Energy Intensity in South Carolina Relative to the Rest of the United States (1 = Most Energy Intensive)
Category Rank Electricity Consumption Per Capita* 7th Energy Consumption Per Capita 15th Energy Consumption Per Dollar of GSP 13th Total Electricity Consumption 18th Total Energy Consumption 22nd * ACEEE estimate (EIA 2009b, Economy.com 2009) In this section we discuss the current condition of the South Carolina electricity market and the overall role of energy efficiency and related opportunities available to meet the state's energy needs.
South Carolina's Energy Future, ACEEE
5
South Carolina Electricity Market In 2007, South Carolina generated 104,516 GWh, yet consumed only 81,948 GWh, making the state a net exporter of almost 22% of its electricity generation. Of the 81,948 GWh in sales, 37% of sales were purchased by the industrial sector, and 36% and 27% were purchased by the residential and commercial sectors, respectively (EIA 2009a). The majority of electricity generated in the state is produced using nuclear power (51%), while 40% is generated by coal-fired plants. But because not all of the electricity generated in South Carolina is actually consumed by South Carolinians, the relative dependence on generating resources is reversed: in 2007, of the electricity actually consumed by South Carolina customers, 61% was generated by coal-fired plants and 31% was generated by nuclear facilities, compared to national averages of 49% and 19%, respectively (ORS 2008; EIA 2009b).
Figure 2. Electricity Sales and Generation in South Carolina, 2000–2007
0
20,000
40,000
60,000
80,000
100,000
120,000
2000
2001
2002
2003
2004
2005
2006
2007
Un
its
of
Ele
ctri
city
(G
Wh
)
Sales Generation
Source: EIA (2009c)
South Carolina's Energy Future, ACEEE
6
Figure 3. 2007 South Carolina Electricity Generation by Fuel Type (Total Generation: 104,516 GWh)
Nuclear, 51%
Coal, 40%
Natural Gas, 6%
Other Gases, <1%
Hydroelectric, 1% Other Renewables, 2%
Source: EIA (2009a)
South Carolina delivers electricity to retail customers through four types of providers: investor-owned utilities (IOUs), rural electric cooperatives, municipal electric suppliers, and one state-owned utility. As shown in Figure 4, over 62% of electricity deliveries are from IOUs, with South Carolina Electric & Gas (SCE&G) and Duke Energy each accounting for 27% of the market. South Carolina's twenty cooperatives account for over 18% of state electricity sales, while state-owned Santee Cooper retains a 14% market share. Municipal utilities make up the remaining 5% of total sales.
Figure 4. Electricity Deliveries (GWh) by Supplier in 2007
IOU Sales, 62%
Coop Sales, 18%
Municipal Sales, 5%
Santee Cooper, 14%
Duke, 27%
Lockhart, <1%
Progress, 8%
SCE&G, 27%
Source: EIA (2009a)
South Carolina's Energy Future, ACEEE
7
Utility-Level Projects Regardless of the potential impact that energy efficiency can have on growing demand for electricity in South Carolina, the need to update generation resources and transmission/distribution infrastructure in the future, especially as older generation units are retired, means that utilities will always be investing in new plants and related infrastructure. Considering that 61% of the electricity consumed by South Carolinians in 2007 was generated by coal-fired plants, it seems likely that coal will continue to constitute a very large share of South Carolina's resource mix for decades. However, increasing costs of construction, lack of access to capital, and potential federal climate legislation are making investments in coal-fired power plants less and less attractive. These variables, along with a decline in the annual growth of electricity demand across the state as a result of the recession, will heavily influence utilities' investment decisions, allowing them to consider deferring investments in generating capacity and instead focus on adopting and implementing aggressive energy efficiency programs (Schlissel et al. 2009). Economic concerns were a major influence in Santee Cooper's board’s unanimous vote to suspend its commitment to build its Kingsburg coal-fired power plant, located near the Pee Dee River, on August 24, 2009; a commitment that was estimated to cost $1.25 billion.5 A power-purchasing agreement between Duke Energy Corporation and Santee Cooper also played a role, allowing Santee Cooper to meet growing demand in its service area without the need for heavy capital investments in new generation infrastructure. A few of South Carolina's investor-owned utilities are currently planning relatively modest investments in power plant construction as a means of meeting increasing demand, none of which will be coal-fired. According to their integrated resource plans (IRP), neither Duke nor Progress has plans for any new generation resources in South Carolina, including intermediate or peaking facilities.6 The only plans for capacity additions are for additional nuclear plants within SCE&G's fleet. On May 30, 2008, SCE&G filed an application with the SC PSC for permission to construct and operate two nuclear units, each of 1,100 MWs of generating capacity. The first unit is planned for commercial operation in 2016 and the second in 2019. SCE&G will own 55% of the units (614 MWs each) while Santee Cooper will own 45%. SCE&G expects up to a 325 MW capacity deficit until the first nuclear reactor is built in 2016. It is planning on satisfying that demand with DSM, renewables, and purchased capacity (SCE&G 2009). Electricity Generation and Water Consumption The two most water-intensive sources of electric power generation are thermal (or steam driven) generators powered by nuclear fission or coal combustion. In 2007, about two-thirds of the electric power generated in the United States was powered by coal and nuclear fuel (48.5% and 19.4%, respectively). However, over 90% of the electricity generated in South Carolina in 2007 came from coal and nuclear fuel (40.2% and 51.4 %, respectively) (EIA 2009b). Thus, electricity generation in South Carolina is significantly more water intensive than that of the nation as a whole. Power plant cooling is the single largest off-stream use of water in South Carolina, by far. In 2006, electric water use reported to the state for 19 power plants came to 9,780 mgd, or 89% of all off-stream uses, compared with 618 mgd (or 5.6%) for all reported use by 224 public water supply systems. Although cooling requirements vary somewhat from plant to plant depending on the combustion cycle and the cooling system, the water requirement for cooling South Carolina’s thermoelectric generating stations recently averaged 38,621 gallons per MWh, based on reported generation and water use from 2004 through 2006.
5 Other articles/documents cite the estimated cost at upwards of $2.5 billion. 6 There are several plans for new generation resources to meet North Carolina's growing demand, however. Both Duke and Progress have plans to add to their generation capacity in that state over the next decade.
South Carolina's Energy Future, ACEEE
8
Table 2. Water Intensity of Thermoelectric Power Generation in South Carolina
Average 2004–2006 38,621 * Thermoelectric = coal, petroleum, natural gas, nuclear, wood, and other biomass.
Source: EIA (2009c); SCDHEC (2004–2006) Water withdrawn for use in a once-through or open-loop cooling system is discharged back to receiving waters at a temperature that is typically 20 degrees F warmer or more. While nearly all the original volume of water is returned, the evaporation induced by the higher temperature results in levels of consumptive use estimated at 100, 300, and 400 g/MWh for natural gas combined cycle, coal, and nuclear generation, respectively. Withdrawals for closed-loop cooling systems such as cooling towers or ponds are markedly lower, ranging from approximately 230 g/MWh for cooling natural gas combined cycle generation to as much as 1,100 g/MWh for nuclear generation, although most of this is consumed by evaporation (DOE 2006). The rate of cooling water withdrawal in South Carolina is indicative of the prevalence of once-through cooling for power generation. At typical rates of evaporation, the consumptive use of water for utility thermoelectric cooling can be estimated to average about 90 mgd statewide, with rates somewhat lower in winter months and higher in summer months. Role of Energy Efficiency South Carolina's economic concerns should not preclude it from exploring and exploiting its vast energy efficiency resources. In fact, recent action by the state government and some utilities suggests that South Carolina could emerge as a regional leader in energy efficiency within several years. Considering that utilities operating in the state have virtually no plans to increase capacity in the near future, South Carolina must seize the opportunity to embrace energy efficiency as the state's "first fuel." Energy efficiency has the potential to provide short- and long-term economic and social benefits to South Carolina's consumers, such as creating new, local jobs, lowering consumer bills, and abating emissions, all of which will help to stimulate the economy. Though electricity is forecast to grow at a modest annual average of 0.8%, deploying energy efficiency in the short term will greatly reduce or delay the need for investment in infrastructure to maintain current services and to meet growing demand in the future, as demonstrated in other states around the country (such as Florida, Virginia, South Carolina, and Pennsylvania, among others). South Carolina's efforts to advance energy efficiency are captured in ACEEE's 2009 State Energy Efficiency Scorecard, which ranks states on eight energy efficiency policy and performance criteria. South Carolina claimed the 37th spot in our 2009 Scorecard, with the majority of its points coming as a result of relatively stringent building energy codes,7 though it also scored relatively well with regards to utility and public benefits programs and policies. While South Carolina's ranking limited it to the second-bottom tier of states overall, it ranks in the dead center relative to the other sixteen states in the South Census Region.8 Recent developments show that South Carolina is poised to make considerable progress in advancing energy efficiency across the state, which could thrust the state into a role as a regional leader if its efficiency investments are made prudently and are not only sustained, but also augmented as new and existing programs mature and others are introduced.
7 South Carolina received zero (0) points in our 2009 Scorecard for compliance, which significantly impacts the efficacy of stringent building codes. 8 Fifteen states and the District of Columbia make up the South Census Region.
South Carolina's Energy Future, ACEEE
9
One area where South Carolina has made impressive strides since the publication of our 2008 Scorecard was published is with respect to energy efficiency in state-owned buildings. On June 11, 2008, Governor Sanford signed H. 4766, an act obligating state agencies to develop energy conservation plans that codify what energy reduction measures will be implemented and to report on the progress of these measures as part of meeting an energy consumption reduction of at least 1% annually and a total of 20% by 2020, using the year 2000 as a baseline. Government buildings in South Carolina represent about 26% of commercial building energy use and almost 27% of commercial building electricity use in the state, or almost 6,000 GWh annually (EIA 2008b). The American Recovery and Reinvestment Act, through the State Energy Program (SEP), allocated $50 million to South Carolina's State Energy Office and, according to the SCEOs SEP application, $40 million of that total will be directed towards "Public Institution Energy Improvements." Of the $40 million, half will be dedicated to energy efficiency projects in local schools, while the other half will be dedicated to public universities and colleges as well as state agencies. South Carolina's utilities are also taking some initiative, evident by the energy efficiency and demand response programs they are offering to their customers across all sectors. Duke, Progress Energy, SCE&G, and Santee Cooper have all incorporated load management programs into their business operations, relying on various mechanisms, such as time-of-use rates and interruptible power services to reduce load during peak periods.9 And though the number and quality of efficiency programs varies by utility, at the very least each utility provides resources, either online or through other electronic and print media, to assist their customers in becoming more energy efficient. Home consultations/audits and financial incentives are also common. SCE&G rewards homeowners and builders who upgrade their new or existing homes to a high level of energy efficiency with a reduced electric rate (SCE&G 2009). Progress Energy offers customers a 5% discount on the energy and demand portions of their electricity bills when their homes are certified as meeting prescriptive standards set by Energy Star (Progress 2008). State-owned Santee Cooper provides low-interest loans to finance energy efficiency improvements up to $20,000 (Santee Cooper 2009). Several of South Carolina's cooperative utilities also offer financial incentives for energy efficiency, either in the form of low-interest loans or rebates (DSIRE 2009). In leading states, energy efficiency is meeting 1–2% of the state’s electricity consumption each year (Nadel 2007; Hamilton 2008) at a average cost of about 2.5¢ per kWh (Friedrich et al. 2009), compared with a utility avoided cost of about 4–11¢ per kWh in South Carolina (see Figure 1).10 States across the country, including California, Connecticut, Massachusetts, Minnesota, New York, and Vermont, are realizing the benefits of energy efficiency today, having enacted policies and programs that effectively tap into their energy efficiency resources. Results from these states show that energy efficiency represents an immediate low cost, low risk strategy to help meet the state’s future electricity needs (York, Kushler, and Witte 2008). Together, energy efficiency and demand response can delay the need for expensive new supply in the form of generation and transmission investments (Elliott et al. 2007; 2007b), thus keeping the future cost of electricity more affordable for the state and freeing up energy dollars to be spent on other resources that expand the state’s economy. In addition, a greater share of the dollars invested in energy efficiency go to local companies that create new jobs compared with conventional electricity resources, where much of the money flows out of state to external equipment manufacturers and energy suppliers.
9 The following information was taken from the most recent integrated resource plans that IOU's have filed with the PSC. 10 The avoided cost analysis does not take into account a cost of carbon that would be imposed under a federal cap and trade program.
South Carolina's Energy Future, ACEEE
10
Water Efficiency by Public Water Suppliers and Customers Public supply comprises the second largest off-stream use of water in South Carolina. Although, as noted above, thermoelectric cooling involves much larger total withdrawals, there are several reasons to assign high priority to improving water use efficiency in the public supply sector.
Public supply withdrawals are large and growing. From 2001 through 2006, reported withdrawals for public supply rose by 16.5%, or an average annual growth rate of over 3%. Although 2001 had a relatively mild summer that may have moderated demand somewhat in that year, the trend for public supply withdrawals is clearly upward. Additionally, the consumptive portion of public supply usage may easily be larger than the consumptive portion of thermoelectric use during critical summer months.11
Public supply makes greater use of groundwater than does thermoelectric use. Groundwater
resources must be carefully managed in many areas of the state, as indicated by the state’s system of groundwater control areas.
Public supply carries the highest requirements for reliability and quality, in order to meet safe
drinking water standards and maintain public health.
To achieve high levels of reliability and quality, public supplies require the highest levels of treatment, resulting in substantial embedded energy and financial costs for the construction and operation of drinking water treatment and distribution systems and wastewater collection and treatment systems.
Public water supply and wastewater treatment systems are large users of electric power. Nationwide, their use has been estimated at 75 billion KWh per year, or about 3% of U.S. energy consumption (EPRI 1994, in EPA 2008b). More recent estimates (TIAX 2006) have placed the operating requirements of public water systems for pumping and potable treatment at 2,290 KWh/mg, or 437 gal per KWh. Wastewater treatment requirements are estimated to be 1,682.5 KWh/mg or 594 gal per KWh. For purposes of this report, the portion of power requirements that vary with flow (and thus might be reduced with the implementation of water efficiency measures) are most relevant. We estimate 90% of water supply and 70% of wastewater treatment power requirements are flow–related, yielding a variable energy cost of 2,061 KWh/mg for public water supply and 1,178 KWh/mg for wastewater treatment. For reductions in outdoor water use, the water supply savings alone would apply, while reductions in indoor water use would yield combined savings of 3,239 KWh/mg. South Carolina’s Water and Wastewater Needs Newly developed public water supply is high cost water, and reducing or deferring investment in new public infrastructure offers a substantial financial benefit to local communities. Most publicly-supplied service areas produce wastewater discharges as well, and reductions in wastewater flows help achieve water quality objectives and hold down infrastructure costs that are in many cases as large as the cost of developing potable water supplies. And with many communities depending on a limited supply of state and federal financial assistance for improvements in their water supply or wastewater treatment systems, the case for efficiency is strong. Water efficiency programs can have noticeable effects on the size and timing of certain infrastructure investments. More communities can be assisted more quickly with a given amount of funds if improvement projects are sized and timed to take full advantage of water conservation savings. 11 During peak summer months, outdoor water use may make up 25 to 50% of total water use, and the majority of water applied outdoors will be lost to evaporation, drift, or evapotranspiration (ET) from landscape plant materials. For example, if public supply withdrawals average 900 mgd during summer months, with one-third of this total applied outdoors and one-half of that amount lost to evaporation and ET, public supply consumptive use would reach 150 mgd, as large or larger than the consumptive use by thermoelectric cooling.
South Carolina's Energy Future, ACEEE
11
Several categories of infrastructure investment are somewhat sensitive to changes in average flows or peak volumes that can be influenced by water efficiency programs. Among the range of investment needs articulated by EPA and the states for drinking water infrastructure, those most likely to be responsive to efficiency measures are:
Treatment—facilities for the removal of microbial contaminants, inorganic and organic chemicals, and the harmful byproducts of disinfection.
Storage—facilities such as tanks and small reservoirs within water systems, needed to
maintain positive water pressure throughout the system and accommodate peak demands for water.
Source—facilities to collect raw water, including dams, impoundments, intakes, and wells.
Transmission—large diameter pipe that transmits water from the system’s source to its treatment works, and then again from the treatment works to the smaller diameter distribution system.
All of the above, to a greater or lesser degree, carry costs that vary with the volume of storage or flow. A large remaining investment category—the small-diameter distribution system—is not considered a flow-related investment, although the reduction of water leaks that accompanies distribution system replacement can be a significant benefit. Regarding wastewater treatment, the categories of investment most likely to be flow-related are:
Secondary treatment—facilities to provide the minimum permissible level of treatment to attain specified levels of total suspended solids and biochemical oxygen demand in wastewater prior to discharge.
Advanced treatment—facilities providing advanced treatment needed to remove unconventional pollutants or to reduce conventional pollutants to a greater degree than provided by secondary treatment.
Interceptor Sewers—major sewer lines, consisting of large diameter pipe and associated pumping stations that convey wastewater from networks of smaller collector sewers to a treatment plant and/or other interceptor sewer.
Combined Sewer Overflow Controls—measures to reduce the frequency, duration, and volume of untreated discharges of sanitary wastewater and storm water from combined storm and sanitary sewer systems.
Categories of wastewater investment considered unresponsive to changes in fluid volume include small-diameter collector sewers, solids handling facilities, and most investments in non-point source pollution control. Recent estimates of the capital requirements for water and wastewater infrastructure facing South Carolina’s communities total well over one billion dollars, as indicated in the following table.
South Carolina's Energy Future, ACEEE
12
Table 3. Flow-Related Water and Wastewater Infrastructure Needs in South Carolina
Total Flow-Related Infrastructure Needs 2007$ (million) Water and Wastewater Infrastructure 1,547
Sources: Water (EPA 2009a); Wastewater (EPA 2008a) * Value estimated at 1/3 of reported combined need for transmission and distribution.
The degree to which any individual system can reduce or defer capital costs by implementing water efficiency measures is subject to a system specific evaluation. Tools are available for determining an individual water or wastewater utility’s avoided cost of water, which equates to the value of saved water to the utility (CUWCC 2006). For purposes of this report, the value of saved water will be conservatively estimated to be equal to the current average retail cost of water to residential customers. Based on the average reported rates in effect on July 1, 2008 in ten South Carolina communities (AWWA-Raftelis 2008), the value assigned to indoor water savings is $5.50 per thousand gallons and the value assigned to outdoor water savings is $2.00 per thousand gallons. Based on trends reported for utilities in South Carolina and across the country, these rates are assumed in this report to increase at 2% per year through 2025.
Project Approach and Methodology Overall Project Context: Why We Chose South Carolina For a number of years ACEEE has published state clean energy scorecards, the first editions ranking utility-sector energy efficiency program spending and performance data, and more recently comprehensively ranking state energy efficiency policies and identifying exemplary programs and policies within several energy efficiency policy categories. The 2009 Scorecard (Eldridge et al. 2009) was the third edition of this more comprehensive approach and the policy categories included:
1. Utility and Public Benefits Efficiency Programs and Policies a. Spending on Efficiency Programs (electricity) b. Annual Savings from Efficiency Programs (electricity) c. Spending on Efficiency Programs (natural gas) d. Targets (Energy Efficiency Resource Standards) e. Utility Incentives/Removal of Disincentives
2. Transportation 3. Building Energy Codes 4. Combined Heat and Power 5. State Government Initiatives 6. Appliance Efficiency Standards
Identifying the states we choose for our efficiency potential reports is primarily contingent upon the existence of current efficiency policies and the evidence of progress towards new and expanded policies. For example, those states that appear in the top tier states, as shown in Figure 5, need little or no help to continue to improve their energy efficiency programs and policies. Rather it is the middle
South Carolina's Energy Future, ACEEE
13
tier of states, which are moving relatively slowly towards better energy efficiency programs but are showing laudable progress, that offer the best opportunity to encourage a more rapid transition to greater energy efficiency. In ACEEE’s 2009 Scorecard, South Carolina ranked # 37 as shown on the map and was, therefore, considered a middle-tier state.
Figure 5. 2009 State Efficiency Scorecard Results
Source: Eldridge et al. (2009)
Despite its low ranking, there are many indications that South Carolina is carefully plotting its rise as a leader in efficiency in the South Atlantic region. Along with stringent building codes and increased efficiency program activity amongst utilities, recent initiative taken by Governor Sanford and his administration resulted in the signing of H. 4766 on June 11, 2008, an act obligating state agencies to develop energy conservation plans as part of meeting an energy consumption reduction of at least 1% annually and a total of 20% by 2020, using the year 2000 as a baseline. While these policies will serve as a solid foundation for South Carolina as it continues to incorporate efficiency across all sectors of its economy, ACEEE determined that the state might benefit from an analysis of how energy efficiency and complementary demand response initiatives could facilitate this work in a cost-effective manner. Stakeholder Engagement Building an awareness of the demographics and political climate in South Carolina was an integral part of the formulation of the policy recommendations that we are suggesting. Each state is different and we do not presume that any one policy or set of policies will work universally. Identifying and engaging a wide variety of stakeholders in South Carolina, therefore, was imperative to the acceptance and usefulness of our analysis and final report. We endeavored to meet individually and in person with as many different representative groups as possible in order to better understand South Carolina's specific political climate, energy structure, and economic needs. For those we were unable to meet with personally, we conducted telephone conferences to best ensure we reached out and heard as many voices as possible. This included utilities, business and industry representatives, the environmental community, various State House and Senate offices, and state government
South Carolina's Energy Future, ACEEE
14
representatives such as the SC State Energy Office, members of the Governor's staff, legislative representatives, and the Office of Regulatory Staff. Analysis Methodology The following is a description of the energy efficiency analysis methodology:
Reference Case Forecasts: The first step in conducting an energy efficiency potential study for South Carolina was to collect data and to characterize the state's current and expected patterns of electricity consumption over the time period of the study (2009–2025). Our reference case was vetted with our stakeholders.
Regional/State Energy Efficiency Potential Study Meta Analysis: In our meta analysis we
first compiled a selection of statewide, regional, and national energy efficiency potential studies. From these studies we collected data on the economic potential scenarios and reported these findings as both raw totals (kWh/Btu) and on a percentage basis. We reviewed and summarized the variances in both assumptions and scope of the studies that led to a range of projected energy savings potentials. As noted in the meta analysis, while these variances made 1:1 comparisons between studies unreliable, the similarities that we found in economic savings potential (on a percentage basis) provide insight into the level of savings that South Carolina can expect from adopting a comprehensive suite of cost-effective energy efficiency measures.
Energy and Water Efficiency Policy Analyses: For these analyses, we developed a suite
of energy and water efficiency policy recommendations based on successful models implemented in other states and in consultation with stakeholders in South Carolina. This analysis assumes a reasonable program and policy penetration rate, and therefore is less than the overall resource potential. We draw upon our resource assessment and evaluations of these policies in other states to estimate the energy and water savings and the investments required to realize the savings. The policy list for stakeholder review is presented after the meta analysis section in this document. Our policy recommendations were also vetted with our stakeholders in order to garner feedback on their economic and political feasibility.
Demand Response Analysis: The demand response analysis, which was prepared by
Summit Blue Consulting, assesses current demand response activities in South Carolina, uses benchmark information to assess the potential for expanded activities in the state, and offers policy recommendations that could foster DR contributing appropriately to the resource mix in South Carolina that could be used to meet electricity needs. Potential load reductions are estimated for a set of DR programs that represent the technologies and customer types that span a range of DR efforts, and are in addition to the demand reductions resulting from expanded energy efficiency investments.
Macroeconomic Impacts: Based on the energy and water savings, program costs, and
investment results from the policy analysis, we ran ACEEE's macroeconomic model, DEEPER, to estimate the individual and overall impacts of the policy recommendations on jobs, wages, and gross state product in South Carolina.
Media Release: ACEEE contracted a local media firm from Columbia with statewide
experience and expertise to assist with the roll out of the analysis and report. The Gillespie Group also helped guide the process of connecting with appropriate media and press as well as identifying venues for the actual release event. Hiring a local media firm is invaluable to the release of the report in order to guarantee it is presented to the individuals who can best utilize its results and ensure it is dropped in the hands of those engaged in crafting energy and water efficiency policy.
South Carolina's Energy Future, ACEEE
15
Reference Case The first task in developing an energy efficiency potential assessment is to develop a reference case forecast of electricity consumption, peak demand, and electricity prices in the state for a "business as usual" scenario. In this section we report the reference case assumptions for the analysis time period, 2009–2025. One caveat to note in developing forecasts is that all projections are subject to uncertainty, particularly during a time when the economic outlook is a major unknown. It is important to understand that while the forecast will affect the final numbers, it has no impact on the effectiveness of the proposed policies. Our concern is the change in consumption, or the deltas, that the policies affect, and these are static regardless of the forecast. Modified Reference Case The consumption forecast we developed is essentially an aggregate of sales projections by each individual utility. But forecasts often do not account for reduced consumption that arises from energy efficiency and demand response programs initiated by utilities, nor do they account for energy savings from consumers' purchase of more efficient appliances and equipment. These savings should not be ignored as their accumulation lessens the burden of achieving any state-mandated savings target, such as an energy efficiency resource standard. While South Carolina has not implemented its own appliance efficiency standards, the Department of Energy is actively developing and mandating standards and is scheduled to implement standards on over two dozen products by 2013.12 The following section provides greater detail about our "modified" reference case, which is our consumption forecast net any savings accumulated through utility efficiency programs and federal appliance standards. We use the modified reference case as the base case consumption forecast through which we analyze the percent savings of the individual policies and utility programs. Electricity (GWh) and Peak Demand (MW) The development of the reference case for South Carolina is the foundation of the quantitative analysis of this report. Our electricity consumption forecast is based on 2008 sales, the most recent year for which sales have been reported, and is projected through 2025. Historical sales were taken from the EIA's Electric Power Annual (EIA 2009b), which publishes sales data on a state-by-state basis, and includes sales data from 2000–2007. To estimate projected consumption, we calculated annual growth rates for each sector by utility, which we derived from the integrated resource plans (IRP) filed by South Carolina's four investor-owned utilities with the Public Service Commission and from a load forecast created by GDS Associates for Santee Cooper and South Carolina's 20 cooperative utilities. With the annual sector-specific growth rates calculated for each utility, we then estimated statewide annual weighted-average growth rates for each sector, which we then applied to the sales data reported by the EIA for 2008. After calculating annual projected sales, we adjusted the sales to account for savings generated by energy efficiency and demand-side management programs being implemented by utilities—as reported in the aforementioned IRPs filed by IOUs and from the GDS study—as well as savings from new and updated federal appliance standards implemented between 2009 and 2013. This adjusted references case we refer to as our "modified" reference case. Using this methodology, we estimate that total electricity consumption in the state will grow at an average annual rate of 0.8% between 2009 and 2025, and 1.2%, 1.3%, and 0.1% in the residential, commercial, and industrial sectors, respectively (see Figure 6). 12 The Department of Energy is scheduled to implement new federal appliance and equipment standards, as well as update current standards, for 26 products between 2009 and 2013. Included are standards for fluorescent and incandescent reflector lamps, central air conditioners and heat pumps, furnace fans, and residential water heaters, which represent some of the most energy-intensive appliances and equipment on the market. The analysis of the potential savings of these standards can be found in the Appliance Standards Awareness Project (ASAP) and ACEEE report entitled Ka-Boom! The Power of Appliance Standards: Opportunities for New Federal Appliance and Equipment Standards (Neubauer and deLaski 2009).
South Carolina's Energy Future, ACEEE
16
To forecast peak demand we adjusted our data from electricity sales forecast using a system load factor, which we assumed to be 62.7%. Using this methodology, we estimated peak demand growing at an average annual rate of 1.0% over the 2008–2025 period. In 2009, peak demand is expected to reach 16,136 MW, increasing to 16,900 MW by 2015 and 19,229 MW in 2025 (see Figure 7).
Figure 6. Electricity Forecast by Sector in the Modified Reference Case, 2009–2005
0
20,000
40,000
60,000
80,000
100,000
120,000
2000
2002
2004
2006
2008
2010
2012
2014
2016
2018
2020
2022
2024
So
uth
Ca
rolin
a P
roje
cte
d C
on
su
mp
tio
n G
row
th (
GW
h)
Total Consumption Residential Commercial Industrial
Figure 7. South Carolina Peak Demand Forecast, 2009–2025
5,000
10,000
15,000
20,000
25,000
2009
2011
2013
2015
2017
2019
2021
2023
2025
Year
So
uth
Car
olin
a P
eak
Dem
and
(M
W)
0.94% Average Annual Growth
Utility Avoided Costs Synapse Energy Economics developed high-level projections of utility production and avoided marginal costs for use in our policy analysis. Estimating these costs is important because they reflect the reduced cost to utilities from avoided electricity generation as a result of energy efficiency. The electricity, and therefore money, saved over time can accumulate to a point where utilities are able to delay or completely avoid the need for investing in additional generation capacity and its pertinent infrastructure. ACEEE used these results from Synapse’s analysis to estimate the cost-effectiveness of energy efficiency measures and assess the macroeconomic impacts. Readers should note that the avoided cost estimates are based upon a number of simplifying and conservative assumptions. These simplifications include use of a single annual average avoided energy cost to evaluate the economics of energy efficiency measures rather than different avoided energy costs for energy efficiency measures with different load shapes. We also did not include a cost of compliance with anticipated greenhouse gas regulations. As a result, the production and avoided cost estimates should be viewed as conservative. Synapse's analysis also assumed a cost of carbon, which would impact avoided costs in the sense that it represents additional operating costs to fossil fuel generation plants. The assumption of imposed carbon allowances is predicated on evidence that the passing of federal climate legislation by Congress is a near certainty. Synapse conducted a study in 2008 noting that "political support for serious climate change legislation has expanded significantly in Federal and State governments […]" Through the examination of reports conducted by over a dozen federal, academic, and non-governmental organizations, Synapse was able to ascertain the factors influencing allowance prices and estimate three forecasts, a low, middle, and high case. For this report, Synapse used their middle case, which estimates a base-level cost of carbon at $15/ton starting in 2013, increasing to around $54/ton by 2030 (Schlissel et al. 2008).
South Carolina's Energy Future, ACEEE
18
Implications of the Avoided Cost Assumptions Because the level of energy efficiency and demand response measures assessed in this study significantly change the requirements of future resources, we developed two sets of production and avoided costs projections with which to measure the potential savings. The first case reflects the market conditions that would be anticipated in the modified reference case. The second case, or our policy case, reflects the incorporation of our policy recommendations, which we discuss later on in this report. These policy recommendations have the potential to generate significant electricity savings, which, as mentioned above, will change the composition of utilities' future generation resources. Unfortunately, it is virtually impossible to predict how the generation mix will change, but we are required to make assumptions about this mix in order to estimate avoided costs in the policy case. Given the generation projects currently being funded—as discussed above in the section on utility-level projects, we were presented with two possible scenarios. The first scenario assumes that utilities will react to lower projected consumption by continuing to invest in the construction of the two nuclear plants (the joint venture between SCE&G and Santee Cooper), which would then displace existing coal-fired capacity. This is the scenario that we anticipate to be the path followed by utilities in South Carolina and thus these assumptions are used to estimate avoided costs in our policy case. Our reasoning for assuming this scenario is based on several factors. First, over the last 36 months, the coal market has exhibited considerable volatility while the overall condition of the national economy has severely constricted access to capital (Maher 2008; Wilen 2008; Johnson 2009; Smith 2009). Second, compliance with possible national climate legislation in the future could increase operating costs significantly, especially for aging coal-fired plants reliant on outdated technology. Incorporating any carbon-capture and sequestration into new or existing coal-fired units in order to comply with climate legislation will further increase utilities' costs. Additionally, assuming investment in nuclear power supplants existing coal-fired generation guarantees, there may be a net job increase as a result of the construction of the nuclear plants, an important effect given that South Carolina has one of the highest unemployment rates in the country. The other possible scenario would be to assume that the construction of one, if not both, of the nuclear plants are be shelved and the current generation mix, which includes coal-fired capacity, would be maintained. While this scenario is also plausible, it is less reflective of recent political and market trends and ignores the probability of federal climate legislation and its potential impacts on utilities' operating costs. This scenario would also deny South Carolina any job gains that would arise from investments in the new nuclear units. Estimates of Avoided Costs As would be anticipated, the policy case produced modestly lower avoided resource costs than the reference case for the majority of the analysis period, as can be seen in Figure 8. As a further conservative measure in our analysis, we used this second, lower set of costs in valuing the savings that result from the analyzed policies and programs. A detailed discussion of the assumptions and avoided cost estimates can be found in Appendix A.
South Carolina's Energy Future, ACEEE
19
Figure 8. Estimates of Average Annual Avoided Resource Costs
$0.020
$0.040
$0.060
$0.080
$0.100
$0.120
2007
2009
2011
2013
2015
2017
2019
2021
2023
Year
$/k
Wh
SC Reference Case SC Policy Case
These projections are a highly stylized representation of costs, so we suggest that a more detailed assessment of costs be undertaken as part of South Carolina's energy planning process in order to reflect the locational and temporal variations across the state and throughout the year. Retail Price Forecast ACEEE also developed a possible scenario for retail electricity prices in the reference case. Readers should note the important caveat that we do not intend to project future electricity prices in South Carolina precisely for either the short or the long term. Rather, our goal is to suggest a possible scenario, based on data from credible sources, and to use that scenario to estimate impacts from energy efficiency on electricity customers in South Carolina. Table 4 shows 2007 electricity prices in South Carolina (EIA 2008a) and our estimates of retail rates by customer class over the study period. This price scenario is based on three key factors. First, we use the average generation cost of electricity in South Carolina over the study period as calculated by Synapse Energy Economics (see above). Next, we use estimates of retail rate adders (the difference between generation costs and retail rates, which accounts for transmission and distribution costs) from the Annual Energy Outlook for the Southeastern Electric Reliability Council (SERC) (EIA 2009d). Finally, we estimate short-term decreases from falling generation costs due to lower prices in the cost of fuel inputs.
Table 4. Retail Electricity Price Forecast Scenario in Reference Case (cents per kWh in 2007$)
2007 2010 2015 2020 2025 Average
Residential 9.19 8.47 9.75 10.51 11.28 9.88
Commercial 7.74 7.41 8.45 9.14 9.86 8.59
Industrial 4.83 5.29 6.39 7.00 7.75 6.43
All Sector Average 7.88 7.23 8.37 9.10 9.89 8.56 Note: These figures are in real, 2007-year dollars and there do not take into account inflation.
South Carolina's Energy Future, ACEEE
20
Meta Analysis The meta analysis reviews and summarizes key information from a variety of economic potential studies that have already been conducted in South Carolina, the greater Southeast region, and the nation as a whole. The meta analysis supplants the sector-specific economic potential analyses we conducted in our previous state reports. South Carolina Energy Efficiency Potential Our analysis of the energy efficiency potential for South Carolina examined two studies. Both of these studies evaluated the energy efficiency potential for the service territories of specific utility companies, as opposed to the state as a whole. The analysis revealed that the two studies estimated economic potential between 16% and 20% of electricity consumption in 2030 and 2017, respectively. However, for several reasons it is not possible to make direct comparisons from one study to another. First, these studies evaluated the energy efficiency potential for the service territories of two different utilities rather than that of the state as a whole. Second, these studies examined two different time frames, 10 and 20 years. Attempts to extrapolate savings in the GDS report beyond those estimated through 2017, so as to provide a better comparison across the two studies, revealed an anomaly in the GDS methodology that generated an unjustifiable estimation for savings through 2025. Third, the studies we examined look at different efficiency measures and used different methodologies for estimating cost-effective potential. The threshold at which efficiency measures were considered cost-effective ranged from $0.06 to $0.087 per kWh. While we do not advise making direct comparisons between these studies, it is noteworthy that the two studies found relatively similar potential for energy efficiency savings for their respective service territories. Due to the varying methodologies used in the studies we examined, we have displayed savings potential on a percentage basis. Although this is still an imperfect method, it does allow for the best available comparison between studies. Forefront Economics Inc., H. Gil Peach & Associates LLC, and PA Consulting Group Duke Energy Carolinas DSM Action Plan: South Carolina Draft Report The Duke Energy Draft Report examined the technical and economic potential for energy efficiency savings as well as the potential for demand-side management programs for the Duke Energy Carolinas—South Carolina service territory (DEC-SC). During the period of analysis, the DEC-SC included 528,591 customers, comprised of 447,324 residential customers (85% single-family homes and 15% multifamily) and 81,267 commercial and industrial customers. Combined, these customers use 18,332 GWh of electricity annually. Non-residential customers, consisting of the commercial and industrial sectors, use 65% of electricity, or 11,913 GWh. Residential customers account for the remaining 35%, or 6,418 GWh of electricity demand. On a per capita basis, this amounts to 14,348 kWh per residential customer and 146,596 kWh per non-residential customer every year. The base case scenario in this study projected total electricity demand to rise to 22,403 GWh by the year 2026 (Duke 2007). In the technical potential assessment, 40 residential and 31 non-residential measures were examined. Of these, 14 residential measures and 21 non-residential measures were deemed cost-effective and included in the economic potential analysis, which combined could realize 3,576 GWh in energy savings. This savings potential is roughly split between residential and non-residential efficiency measures, with the former accounting for 48% and the latter contributing the remaining 52% of potential. Only energy efficiency measures with a cost of saved energy of $0.06 per kWh or less were included in the economic potential assessment (Duke 2007).
South Carolina's Energy Future, ACEEE
21
The DSM action plan projected that DSM could provide another 1.2% savings, or 276 GWh, in 2026. 15 programs were evaluated and 12 were recommended in the evaluation. The study reviewed residential, non-residential, and multi-sector DSM programs, and all but two of the recommended DSM programs were deemed cost-effective (Duke 2007). GDS Associates, Inc. Electric Energy Efficiency Potential Study for Central Electric Power Cooperative, Inc. The GDS study for Central Electric Power Cooperative, Inc. (CEPCI) analyzed three energy efficiency potential scenarios for the CEPCI service territory: technical potential, achievable potential, and achievable cost-effective potential. GDS also evaluated three market penetration scenarios, consisting of 20%, 50%, and 80% market penetration rates, for both the achievable potential and achievable cost-effective potential scenarios. Using these scenarios, GDS calculated the potential for energy efficiency in the residential, commercial, and industrial sectors. Across all three sectors, the CEPCI service territory included 678,197 customers during this period of analysis, amounting to 14,740 GWh in electricity sales in 2006 at an average cost of $0.087 per kWh. The study examined a 10-year time period from 2008 to 2017, with demand projected to rise to 20,418 GWh by 2017 in the base case scenario (GDS 2007). GDS estimated that the achievable cost-effective savings with an 80% market penetration rate would amount to 4,008 GWh in 2017, or 19.6% savings over the base case scenario. The residential sector would provide 66% of this potential, while the commercial and industrial sectors would contribute the remaining 24% and 10%, respectively. In order to be considered cost-effective, energy efficiency measures had to have a cost of conserved energy lower than the average cost per kWh (GDS 2007).
Table 5. Comparison of Efficiency Potential across State Potential Studies
Study Base Case
(GWh) Efficiency
Potential (GWh) Percent Savings
Cost of Saved Energy
Time Frame
GDS 2007 20,418 4,008 19.60% <$0.087 2008–2017, 10 years
Duke 2007 22,403 3,576 16% <=$0.06 2007–2026, 20 years
Figure 9. South Carolina Energy Efficiency Potential
19.60% 16%
0.00%
5.00%
10.00%
15.00%
20.00%
South Carolina Energy Efficiency Potential
GDS 2007
Duke 2007
South Carolina's Energy Future, ACEEE
22
Regional Energy Efficiency Potential Our meta analysis of regional energy efficiency potential evaluates two studies in two different regions. Both of these studies included all or part of North Carolina, while only the Southeast Energy Opportunities report included an evaluation of the efficiency potential in South Carolina. As with the statewide potential assessments, it is not possible to draw definitive conclusions about potential for the Carolinas by comparing or averaging these two analyses, due to their variations in scope and methodology. It is of note, however, that both studies projected an economic energy efficiency potential of at least 20% for their respective regions. Southeast Energy Efficiency Alliance Energy Efficiency in Appalachia: How Much More Is Available, At What Cost, And By When? The Southeast Energy Efficiency Alliance (SEEA) analyzed the economic energy efficiency potential for the Appalachian region, spanning all of West Virginia and parts of Alabama, Georgia, Kentucky, Maryland, Mississippi, New York, North Carolina, Ohio, Pennsylvania, South Carolina, Tennessee, and Virginia. This region contains nearly 8% of the U.S. population. Using 2006 as a baseline for energy use, SEEA projected that the Appalachian region’s energy consumption would increase from 7.94 quadrillion Btu to 10.14 quadrillion Btu in 2030, a nearly 28% growth in demand. This region currently uses nominally more energy per capita than the nation as a whole; however, the projected rate in demand is significantly higher than the 19% growth forecast for the entire United States (SEEA 2009). The analysis covered four end-use sectors (residential, industrial, commercial, and transportation) and three fuel types (electricity, natural gas, and fuel oil). Cumulatively, SEEA projected that the measures included in this study would save about 23.2 quadrillion Btu through 2030, a 32.6% savings over the base case scenario. Cost of saved energy was not provided, but all measures included were deemed cost-effective. To determine cost-effectiveness, the study assessed the benefit/cost ratio, and “[i]f the net present value of [the participants] benefits is greater than the net present value of their costs, then the benefit/cost ratio is greater than 1.0 and the policy is cost-effective (SEEA 2009).” The commercial sector offers the greatest potential for energy savings, with an estimated 45.6% potential over the base case scenario. The transportation and residential sectors are projected to save 30.1% and 18.7% over the base case, respectively. The industrial could realize between 21.7 and 27.9% savings over the base case scenario (SEEA 2009). Southeast Energy Opportunities Power of Efficiency In its April 2009 WRI Issue Brief, Southeast Energy Opportunities (SEO) assessed the potential for energy efficiency to help meet electricity demand in the southeastern United States, consisting of Georgia, Florida, North Carolina, and Virginia. The report evaluated electricity use in three sectors—residential, commercial, and industrial, while acknowledging that future development of electric cars could increase electricity demand and offer the potential for further energy efficiency savings. Across these three sectors, the region currently uses about 20% more electricity per capita than the nation as a whole, and in the residential sector alone, per capita energy use is nearly 40% greater than the nationwide average. The SEO projected that electricity demand would grow from 922,000 GWh in 2005 to 1,220,000 GWh in 2025, a 32% increase in 20 years. Through 2025, energy efficiency potential was projected to reach 20%, or 80% of the growth in demand. These savings amount to 244,000 GWh at a cost of saved energy of less than $0.05 per kWh (Creech et al. 2009).
South Carolina's Energy Future, ACEEE
23
Table 6. Comparison of Efficiency Potential across Regional Potential Studies
Study Base Case Efficiency
Potential (GWh) Percent Savings
Cost of Saved Energy
Time Frame
SEEA 2009 10.14
quadrillion Btu
23.2 quadrillion Btu cumulative
savings 32.6% N/A
2010–2030, 20 years
Creech et al. 2009
1,220,000 GWh
244,000 GWh 20% <$0.05 per kWh 2009–2025,
17 years
Figure 10. Regional Energy Efficiency Potential
32.60% 20%
0.00%
5.00%
10.00%
15.00%
20.00%
25.00%
30.00%
35.00%
Regional Energy Efficiency Potential
SEEA 2009
Creech et al. 2009
National Energy Efficiency Potential This meta analysis of national energy efficiency potential examines one recent nationwide study conducted by McKinsey & Company, and two meta analyses conducted by ACEEE in 2004 and 2008. Combined, these meta analyses evaluated 49 statewide, regional, and national energy efficiency potential studies, providing a useful perspective on both the range and average potential energy savings across the country. Notably, the two meta analyses and the McKinsey study found very similar potential for energy efficiency savings in the United States, with a range of less than 2%. McKinsey & Company Unlocking Energy Efficiency Potential in the U.S. Economy The McKinsey & Company study evaluated the energy efficiency potential across the residential, commercial, and industrial sectors in the U.S., and calculated both end-use energy savings and primary energy savings (the Btus of coal, natural gas, or oil prior to their transmission into “secondary” forms of energy such as electricity). In the interest of consistency, we have focused on the study’s evaluation of end-use energy savings in our meta analysis. Using a 7% discount rate, this study examined only the economic potential (net present value positive) for efficiency, not the technical or achievable potentials (McKinsey 2009). The base case scenario assumed that energy demand in the nation would grow at an annual rate of 0.7% from 2008 to 2020, reaching 39.9 quadrillion Btus. With an upfront investment of $520 billion, overall energy efficiency potential across the three sectors reaches 23%, or 9.1 quadrillion Btus. This investment would realize $1.2 trillion in savings over the 22-year period. The industrial sector
South Carolina's Energy Future, ACEEE
24
currently consumes the majority (51%) of energy, yet comprises only 40% of the efficiency potential. Residential energy use provides consumes another 29% of energy and offers 35% of the efficiency potential, while the final 20% of energy use and 25% of efficiency potential comes from the commercial sector (McKinsey 2009). The average cost of saved energy for residential efficiency measures in McKinsey’s analysis was $4.40/Btu, 68% less than the business-as-usual cost of energy in 2020, as projected in EIA’s Annual Energy Outlook 2008 (EIA 2009d). American Council for an Energy-Efficient Economy Positive Returns: State Energy Efficiency Analyses Can Inform U.S. Energy Policy Assessments This 2008 meta analysis, conducted by ACEEE, examined the economic potential in 48 statewide, regional, and national energy efficiency potential studies. The periods of analysis ranged from 5 to 26 years, with an average of 12 years. Likewise, efficiency potential also varied greatly, from 6% to 33% over the base case projections. The average efficiency potential was 23%, with an average benefit-cost ratio of 1.95, meaning that efficiency improvements generally resulted in savings of about double the cost of investment (Laitner and McKinney 2008). American Council for an Energy-Efficient Economy The Technical, Economic and Achievable Potential for Energy Efficiency in the U.S.—A Meta-Analysis of Recent Studies For this 2004 meta analysis, ACEEE reviewed 11 energy efficiency potential studies released between 2000 and 2004. Across these studies, the average efficiency potential for electric and gas measures was about equal, reaching 21.5% and 22%, respectively. Residential measures offered an average of 27% savings over the base case scenario, while commercial measures provided another 14% savings over business-as-usual energy consumption (Nadel et al. 2004).
Table 7. Comparison of Efficiency Potential across National Potential Studies
Study Base Case
(GWh)
Efficiency Potential
(GWh)
Percent Savings
Cost of Saved Energy
Time Frame
McKinsey 2009 39.9 quadrillion
Btu 9.1 quadrillion
Btu 23%
$4.40/MMBtu for Residential Measures
2008–2020, 23 years
Laitner & McKinney 2008
N/A N/A 23% N/A 12 year average
Nadel et al. 2004 –Electric
Potential N/A N/A 21.5% N/A 14 years
Nadel et al. 2004 –Gas Potential
N/A N/A 22% N/A 14 years
South Carolina's Energy Future, ACEEE
25
Figure 11. National Energy Efficiency Potential
23% 23% 21.5% 22%
21%
21%
22%
22%
23%
23%
National Energy Efficiency Potential
McKinsey 2009
Laitner & McKinney 2008
Nadel et al. 2004 - ElectricPotential
Nadel et al. 2004 - GasPotential
Energy Efficiency Policy Analysis In this section we present the energy efficiency resource standard (EERS) and the suite of eleven individual policies that we suggest South Carolina implement in order to enhance electric efficiency in the state. We then estimate the resulting energy savings, costs, and consumer energy bill savings ($) that can be realized from their implementation, though costs and benefits are quantified only for nine of the electric policies.13 Each policy is analyzed within a three scenario framework: our base case or modified reference case scenario only reflects savings from utility energy efficiency programs filed with the PSC and savings from federal appliance standards; our medium case scenario reflects a significant commitment to efficiency and is the scenario on which we focus the publication of our results; and our high case scenario represents a more aggressive approach where the state takes greater advantage of its available, cost-effective resource potential. The three scenarios are shown in the matrix below (see Table 8) for both our energy and water efficiency policy analyses, the latter following this section. Following the policy discussions we estimate the resulting energy savings, costs, and consumer energy bill savings ($) that can be realized from their implementation. At the end of this section we briefly examine the sorts of programs that utilities can implement in order to satisfy the remaining savings obligation as stipulated by our EERS policy.
13 The Workforce Development Initiative is not analyzed quantitatively as it is an enabling policy and does not have direct savings associated with it. Our Expanded Demand Response (DR) policy is assessed separately in the policy analysis by Summit Blue Consulting. The Energy Efficiency Resource Standard is an aggregation of eight of the policies and contributions from proven utility programs, so its benefits and costs are not individually quantified.
South Carolina's Energy Future, ACEEE
26
Table 8. Matrix of Energy and Water Efficiency Policies in Modified, Medium, and High Case Scenarios
Electricity* Scenario One: Modified Reference Case
Same as Scenario Two plus greater participation rates and savings
3 Behavioral Initiative None Customer end-use information provided through utility billing statements
Same as Scenario Two plus greater participation and savings + feedback mechanisms, e.g., smart meters
4 Building Energy Codes Current Track Increase code by 15% by 2012 and 30% by 2015; enhance code enforcement and compliance
Increase code by 15% by 2012, 30% by 2015 and 50% by 2021; enhance code enforcement and compliance
5 Combined Heat & Power (CHP)
Current Policies $500 incentives and removal of disincentives toward CHP
$1000 incentives and removal of disincentives toward CHP
6 Demand Response Programs**
Current Policies Deployment of smart technologies and smart tariffs
Same as Scenario Two
7 Lead by Example (EE In State and Local Government Agencies)
Current Policies At least 1% annually and 20% reduction by 2020
Scenario Two plus expanded ESCO initiative and increased savings by 2025
8 Low-Income Weatherization Current Policies Weatherize 6500 homes over three years with ARRA grant, plus ~500 homes over two years from DOE WAP
Scenario Two plus even greater participation rates/savings
9 Manufactured Homes Initiative
None Weatherize 200 manufactured homes annually plus other EE upgrades for additional 600 manufactured homes
Scenario Two plus even greater participation rates/savings
10 Manufacturer Initiative None Expanded State Manufacturer Initiatives More aggressive state manufacturing initiative combined with economic development incentives
11 Rural & Agricultural Initiative None
Based on similar programs from Wisconsin Focus on Energy; create systems benefit charge to provide funds for matching USDA-REAP grants
Same as Scenario Two
12 Workforce Development Initiative***
Enabling Policy Enabling Policy Enabling Policy
* All policies except for demand response and the workforce initiative are included in the EERS. ** The assessment of demand response potential is covered in the next chapter and in Appendix D. *** This policy is included in the recommendations, but ACEEE does not quantify costs or savings as it is an enabling policy.
South Carolina's Energy Future, ACEEE
27
Water Scenario One Scenario Two: Medium Case
Scenario Three: High Case
1 Water Loss (Leakage) Reduction
No policy
Consistent annual reporting of water losses—statewide; elimination of 50% of economically recoverable water losses by 2025 in 10 largest counties
Same as Scenario Two but eliminating 90% of economically recoverable water losses by 2025
2 Plumbing Efficiency Standards
Current federal standards Adopt efficiency standards for new residential toilets, faucets, and showerheads beginning 2012—statewide
Same as Scenario Two
3 Replacement of Inefficient Plumbing
No policy Replace inefficient plumbing upon resale of homes in 10 largest counties
Same as Scenario Two + 15 counties in Capacity Use Areas
4 Water Efficient Landscape Irrigation Ordinances
No policy Adopt water-efficient ordinance applicable to newly-installed landscapes in 10 largest counties
Same as Scenario Two + 15 counties in Capacity Use Areas
5 Conservation Pricing of Water & Sewer Service*
Declining block rates offered by several utilities
Policy Discussion Policy Discussion
* Savings from this policy were not quantified, but we include a discussion of the piece as its inclusion in state water policy is extremely important in order to address the current rate structures in the state that do not dissuade excessive consumption.
South Carolina's Energy Future, ACEEE
28
Discussion of Electricity Policies This section provides greater detail on each of our recommended electricity efficiency policies, as well as the assumptions used in their analyses. Many of these policies will require state funding, but money gained through the federal government's American Recovery and Reinvestment Act creates a tremendous opportunity to leverage state funding towards state or local projects, such as weatherization or appliance and equipment replacement programs. While federal funds are only temporary, the volume of these appropriations provides South Carolina with a foundation upon which it can design and implement successful policies and programs that could continue to generate energy and economic savings for the state long after the funds have been expended. Energy Efficiency Resource Standard An EERS is a quantitative, long-term energy savings target for utilities that is met by implementing energy efficiency programs in order to help customers save energy in their homes and businesses. Typically this target is only required to be met by investor-owned utilities, though cooperatives are sometimes given the choice to opt in. Currently twenty states have enacted energy savings goals through legislation while another five have an EERS pending. This approach contrasts with many earlier state-legislated targets that were set in terms of funding levels or were short term. EERS targets are typically set independently of specific program, technology, or market targets in order to give utilities maximum flexibility to find the least-cost path toward meeting the targets (Nadel et al. 2006; ACEEE 2008). In the medium and high case scenarios, we suggest that the implementation of an EERS set a savings target of 18% and 24%, respectively, of projected sales in 2025. To minimize the burden on utilities, eight of the eleven individual electricity policies we are recommending are policies that ACEEE suggests be eligible to contribute towards the EERS, which we estimate have the potential to meet 10% and 16% of South Carolina's electricity needs by 2025 in the medium and high case scenarios, respectively. It is important to note that these savings are simply the amalgamation of the contributions of the individual policies and, thus, could be generated even in the absence of an EERS. The establishment of an EERS with the savings targets outlined above would require utilities to contribute savings of 8% in both scenarios through efficiency programs of their own.14 ACEEE recommends that EERS targets start at modest levels, around 0.25% of annual sales, and ramp-up over several years to savings levels currently achieved by the most successful states, or around 1.25% to 2.0% of annual sales. The types of efficiency policies that are allowed to contribute towards meeting an EERS target is ultimately a choice to be made be state legislators. Essentially, any savings that are generated by state policies and programs reduce the responsibility of the state's utilities. As mentioned above, we recommend that South Carolina allow eight of the policies to contribute towards the savings requirements to minimize the burden on utilities. See Table 8 for a list of these policies. In our medium case scenario, we propose South Carolina establish an EERS with a target of 18% cumulative savings by 2025, using 2025 projected sales as the focus, and set annual savings requirements relative to sales from the previous year. We estimate electricity consumption of 95,103 GWh in 2025, which would mean a cumulative savings target of around 17,200 GWh by 2025. Of the 18% target, we estimate that our policy recommendations would reach 10.3% by 2025, leaving almost 8% of the EERS savings target to be satisfied by utility programs, or about 7,500 GWh. Mandating annual savings requirements for utilities that begin at 0.25% and ramp up to 2.0% by 2025 would reach this goal. We assume annual requirements of 0.25% between 2009 and 2013, 0.5%
14 Three of the policies—Lead by Example, Low-Income Weatherization, and the Manufactured Homes Initiative—are policies that have already been implemented in the state, and our analysis attempts to estimate the potential savings that could be realized over their program periods and beyond.
South Carolina's Energy Future, ACEEE
29
between 2014 and 2018, 1.0% between 2019 and 2022, 1.5% between 2023 and 2024, and 2.0% in 2025. In our high case scenario, we propose South Carolina establish an EERS with a target of 23% cumulative savings by 2025, again using 2025 projected sales as the focus, and set annual savings requirements relative to sales from the previous year. Given base projected sales in 2025 of 95,103 GWH, this would amount to a cumulative target of around 22,000 GWh. Of the 23% target, we estimate that our policy recommendations would reach 15% by 2025, leaving around 8% of the EERS savings target to be satisfied by utility programs, or about 7,800 GWh. Mandating annual savings requirements for utilities that begin at 0.25% and ramp up to 2.0% by 2025 would reach this goal. We assume the similar annual requirements for utilities as in our medium case scenario, or annual requirements of 0.25% between 2009 and 2013, 0.5% between 2014 and 2018, 1.0% between 2019 and 2021, 1.5% between 2022 and 2024, and 2.0% in 2025. ACEEE has recently created guidance language for creating an EERS, illustrating basic provisions that should be considered for inclusion in a state-level EERS, with accompanying explanations for each provision. This example is intended to provide state legislators, regulators, and other stakeholders with a starting point in drafting a state-specific EERS and as an initial framework from which the negotiation process may advance, taking into consideration the regulatory environment of the individual state. ACEEE’s guidance language is available at www.aceee.org/energy/state/toolkit.htm.15 Advanced Buildings Initiative Across the United States, residential and commercial buildings account for 37% and 36% of total electricity consumption.16 Identifying opportunities for implementing energy efficiency in new and existing buildings in both sectors beyond what is required by energy codes can generate tremendous savings for South Carolina. To be truly effective, however, these programs must focus on a whole-building approach, where the building envelope is tightly sealed and appropriate windows are installed, allowing for a proper sizing of the HVAC system and followed by the installation of efficient lighting and appliances. Traditionally, advancing efficiency in buildings was limited to efficient lighting and upgrades that focused on replacing individual pieces of equipment, but more and more emphasis is being placed on overall building performance, system optimization, and interactions among building systems, especially in commercial buildings. But whether in residential or commercial settings, even the most efficient systems cannot maximize their savings potential if they are sized or operated improperly, or are installed in buildings with porous shells. Residential Buildings South Carolina has several active programs that are aimed at incorporating energy efficiency in low-income households, such as the state Weatherization Assistance Program (WAP) and Low-Income Home Energy Assistance Program (LIHEAP), which are funded at the federal level but administered by the Governor's Office of Economic Opportunity (OEO) in coordination with 14 community action agencies that serve South Carolina's 46 counties (both discussed below). Additional funding through the American Recovery and Reinvestment Act and allocated towards South Carolina's State Energy Program (SEP) has allowed the SC Energy Office (SCEO) to create a retrofit and evaluation program that targets energy conservation retrofits for low-income residents of manufactured housing (also discussed below). In order to maximize energy savings from efficient residential buildings, South Carolina must expand its efficiency programs to assist homeowners of all income levels in both new and existing homes. 15 Given that the energy industry is becoming increasingly more dynamic, this document will continue to change and will consistently be a “work in progress,” attempting to capture the most recent developments in energy efficiency resources standards. 16 We were unable to procure data showing electricity consumption of residential and commercial buildings in South Carolina.
South Carolina does not offer any state-level financial incentives for efficiency improvements in residential buildings beyond manufactured homes, which we discuss below. While low-income programs focus on weatherization of the thermal envelope in existing homes and energy codes target other areas of building thermal dynamics in new construction, such as windows, a significant amount of savings can also be achieved by incentivizing the purchase of efficient heating and cooling (HVAC) systems and other household appliances, such as refrigerator/freezers or clothes dryers. These incentives could be promoted either by utilities, or by the state through federal funding from the stimulus bill, and should establish a minimum savings of at least 20%, with greater incentives for products that generate higher savings. This sort of financial incentive can be crafted to encourage homeowners to purchase energy-efficient appliances for their existing home as well as encourage contractors to purchase similar equipment when building new homes.17 There are many resources that South Carolina can reference when developing its residential building programs. Home Performance with ENERGY STAR program is designed as a comprehensive, whole-house approach to improving energy efficiency and comfort in existing homes. The ENERGY STAR New Homes program, which is a similarly designed program that focuses on efficiency improvements during construction, can increase the efficiency of new homes 15% compared to homes built to the 2004 International Residence Code (IRC). Both programs focus not only on improving the efficiency of the home envelope, but also integrate efficient equipment, such as ENERGY STAR appliances and HVAC equipment. The incorporation of these myriad efficiency measures typically makes new homes 20–30% more efficient than standard homes. In our medium case scenario, we assume 0.5% savings throughout the analysis period. Participation in the program starts at 0.5%, increasing annually by 0.5% until 2018 and by 1% annually until 2023, then growing by 2.5% for the final two years of the analysis period so that participation reaches 15% by 2025. Savings from new construction assumes 50% savings above the current code (IECC 2006), thereby decreasing when updated energy codes become effective in 2012 and 2015 (see building energy codes policy below). In 2010 we assume an initial participation rate of 5%, increasing annually by 1% throughout the analysis period, so that participation is at 20% by 2025. Under these assumptions, we estimate cumulative savings of 512 GWh by 2025. For our high case scenario, we assume that existing homes achieve 0.5% savings until 2015 and 1% savings for the remainder of the analysis period. Participation in the program starts at 0.5%, increasing by 0.5% annually until 2018 and by 2.5% until 2024, where participation then increases by 5% for the final year of the analysis period, reaching 25% by 2025. For new construction, savings from new construction again assumes 50% savings above the current code (IECC 2006), thereby decreasing when updated energy codes become effective in 2012 and 2015. In 2021, when the 2018 IECC becomes effective, delivering 50% savings beyond the 2006 IECC, we assume an additional 20% savings beyond the 2018 IECC are achievable. Participation starts at 5%, increasing by 1% annually through 2020, where participation increases by 2% annually for the remainder of the analysis period, so that participation is 25% by 2025. Under these assumptions, we estimate cumulative savings of 803 GWh by 2025. Commercial Buildings Expanding energy efficiency in commercial buildings is inhibited by three factors: 1) the need for assessments that identify energy efficiency opportunities; 2) access to building-specific expertise (e.g., healthcare, hospitality, office); and 3) the need for an expansion of the trained buildings systems workforce with energy efficiency experience, from certificate-level training to engineers. Traditionally, advancing efficiency in commercial buildings was limited to efficient lighting and upgrades that focused on replacing individual pieces of equipment. While small commercial buildings will continue to reap benefits from small-scale improvements, such as regular maintenance and
17 Homeowners can claim federal tax credits for efficiency improvements—an incentive program funded by the American Recovery and Reinvestment Act—for 30% of the cost of installation, capped at $1,500 (TIAP 2009).
South Carolina's Energy Future, ACEEE
31
individual equipment upgrades, larger commercial buildings require much broader improvements—through retrocommissioning, for example, which has been estimated to generate whole-building energy savings of 15% (Mills et al. 2004)—in order to maximize energy savings. Many commercial retrofit programs are organized according to equipment or end-use with little emphasis on overall building performance, system optimization, or interactions among building systems. A systems approach that goes beyond simple equipment upgrades to identify opportunities in system design, equipment interactions, and buildings operations and maintenance will generate greater energy savings, improve comfort, and bolster job growth through investment in training and certification for building operators, auditors, technicians, engineers, etc. (Amann & Mendelsohn 2005). Again, incentives for retrofits and other commercial building upgrades could be offered by utilities, or by the state through funding allocated by the federal stimulus bill. Currently South Carolina does not offer any financial incentives for efficiency improvements in the commercial sector, but businesses can claim a tax deduction of up to $1.80 per square foot for buildings that are constructed or reconstructed to save at least 50% of the heating, cooling, ventilation, water heating, and interior lighting energy cost of a building that meets ASHRAE 90.1-2001 (TIAP 2009). There are several excellent resources on how to model an effective advanced buildings program. The U.S. Department of Energy, for instance, has developed materials on how to achieve significant savings in new and existing buildings.18 Another useful source of information is the New Buildings Institute, which has a Web site on "Getting to Fifty" [percent savings].19 ENERGY STAR also publishes a breadth of information on energy efficiency in commercial buildings and industrial plants.20 Providing financial incentives to contractors or building owners will be crucial to guaranteeing that efficiency measures are implemented beyond what is already required by code. The Energy Policy Act of 2005 included a $1.80/square foot tax deduction for commercial building owners for each building constructed that uses 50% less than a new building designed to a national model reference code. Commercial contractors can also visit the Tax Incentives Assistance Project (TIAP) Web site for federal tax incentives for commercial energy efficiency investments: www.energytaxincentives.org. Combined heat and power (discussed below), in conjunction with other efficiency measures, also has potential to generate significant savings in new and existing commercial buildings. Federal legislation, titled the Economic Stabilization Act of 2008 (H.R. 1424), established a 10% investment tax credit based on the cost of installing CHP systems (for the first 15 MW) for systems up to 50 MW in size. Large commercial and institutional users, such as universities and hospitals that require considerable amounts of both electric and heating or cooling year-round, are frequently excellent candidates for CHP. Space heating is the second largest end-use of energy in commercial buildings in the South Atlantic next to lighting, comprising over 26% of total energy consumption in the region (EIA 2008b). This tax credit will provide an impetus for the expansion of CHP systems in commercial buildings that could help businesses reduce operating costs and increase jobs, as CHP systems will require qualified contractors and system operators to ensure efficacy. To estimate savings from existing commercial buildings in our medium case scenario, we assume 1% savings throughout the analysis period. The participation rate (market share) begins at 0.25% in the first year, increasing by 0.25% annually for the first four years. From 2012 through 2020, participation increases by 0.5% annually and then by 1% for the remainder of the analysis period so that participation reaches 10% by 2025. Savings from new construction assumes 50% savings beyond South Carolina's current code (IECC 2006), thereby decreasing when updated energy codes become effective in 2012 and 2015 (see building energy codes policy below). In 2010 we assume an initial participation rate of 10%, increasing by 1% annually throughout the analysis period, reaching 25% by 2025. Under these assumptions, we estimate cumulative savings of 445 GWh by 2025.
For existing buildings in our high case scenario, we assume that commercial buildings achieve 1% savings until 2020, where program maturity begins to generate 2% savings for the remainder of the analysis period. The program participation rate begins at 0.25% in the first year, increasing annually by 0.25% until 2012 and by 1% annually until 2021, then increasing by 2.5% for the final four years so that participation reaches 20% by 2025. Savings from new construction again assumes 50% savings beyond South Carolina's current code, decreasing when updated energy codes become effective in 2012 and 2015. In 2021, when the 2018 IECC becomes effective, delivering 50% savings beyond the 2006 IECC, we assume an additional 20% savings beyond the 2018 IECC are achievable. In 2010 we assume an initial participation rate of 10%, increasing by 1% annually until 2015, where participation begins to increase by 2% annually throughout the remainder of the analysis period, reaching 35% by 2025. Under these assumptions, we estimate cumulative savings of 738 GWh by 2025. Low-Income Weatherization Addressing the energy needs of low-income households is crucial when implementing efficiency programs as these households on average spend a greater percentage of their income on energy relative to their wealthier counterparts, in part because the homes low-income families occupy tend to be relatively more dilapidated and porous. Weatherizing a home is the first step in improving overall efficiency by minimizing a home's heating and cooling loads, thereby guaranteeing that any HVAC system upgrades installed afterwards are properly sized and will perform at their peak efficiency. Sealing air leaks; adding thicker insulation in walls, ceilings, and roofs; and installing more efficient doors and windows are the primary targets when tightening the home envelope. Tightening the home envelope generates both short- and long-term savings, keeping energy bills low while also improving safety and comfort. The Governor's Office of Economic Opportunity administers South Carolina's weatherization assistance programs, which are currently funded from two sources: $58 million from the American Recovery and Reinvestment Act, which will last until April 2012, and over $4 million from DOE's weatherization program, which will last through April 2011, although DOE funding to state WAPs is renewed annually. South Carolina plans to weatherize 6,500 homes over three years with its ARRA funding and an additional 500 homes over two years with its WAP funding. Our medium case scenario is modeled so that in 2011, in addition to the 6,500 homes weatherized with ARRA funds, South Carolina will weatherize an additional 300 homes (up from around 250 annually for the previous two years). We assume that the number of homes weatherized each year increases by 500 until 2015, when the number of participating homes increases annually by 1,000 so that by 2025, approximately 4% of the projected housing stock, or almost 90,000 homes (including those weatherized with ARRA funds), will have been weatherized through the South Carolina WAP. Given that weatherizing a home typically saves around 20% of a household's electricity consumption, we estimate cumulative savings of 1,662 GWh by 2025. Our high case scenario also assumes that 300 additional homes will be weatherized in 2011 in addition to the 6,500 homes weatherized through ARRA funds. We again assume that the number of homes weatherized each year increases by 500 until 2015. In this scenario, however, we assume a more accelerated ramp-up rate, where the number of homes weatherized annually increases by 1,500 starting in 2015 and through 2021. The number of homes weatherized then increases to 2,000 annually for the next two years and 2,500 for the final two years. At these rates, by 2025, approximately 6% of the projected housing stock, or over 120,000 homes (including those weatherized with ARRA funds), will have been weatherized through the South Carolina WAP. Given that weatherizing a home typically saves around 20% of a household's electricity consumption, we estimate cumulative savings of 2,062 GWh by 2025.
South Carolina's Energy Future, ACEEE
33
Manufactured Homes Initiative According to the United States Census' 2007 American Community Survey, there are approximately 370,000 manufactured homes in South Carolina, representing almost 19% of the total housing units in the state (Census 2007). About 70% of these manufactured homes were built before 1990 and many of those were built before 1979, only three years after the first federal code for manufactured housing became effective (Tiencken 2009). The vintage of these manufactured homes makes them an attractive target for weatherization, but in many cases the homes are dilapidated to the extent that weatherization is not always the most cost-effective option. Full replacement of the most inefficient manufactured homes can be more economical but the high cost of upgrading to an ENERGY STAR-qualified manufactured home tends to price some consumers out of the market, especially considering that many families living in manufactured homes fall below the federal poverty line. To make ENERGY STAR manufactured homes potentially more attractive, beginning July 1, 2009, South Carolina offers a 100% sales tax exemption as well as a $750 income tax credit for purchasers of these homes. Turning over a small percentage of the existing stock will generate some savings, but there will still be considerable need for weatherization services for the remaining stock. Funding from the American Recovery and Reinvestment Act has helped create a low-income manufactured housing retrofit and evaluation program, administered jointly by the SCEO and the OEO, in coordination with the SC Technical College System, the SC Department of Commerce Workforce Program, and the Central Electric Cooperative of South Carolina. Over three years, this program will assess the efficacy of efficiency retrofits for low-income residents of manufactured housing, with goals to weatherize 200 homes, provide efficient roof retrofits for 200 homes, retrofit 200 homes with efficient heat pumps, and install ENERGY STAR appliance upgrades for an additional 200 homes (SCEO 2009). Our medium case scenario assumes that 800 manufactured homes are upgraded through 2011 (the program target) with 350 homes upgraded in the final year, and that the program continues to be funded through 2025. We also assume that, after the initial three years, the number of manufactured homes treated increases by 500 until 2015, when the number of participating homes begins to increase annually by 1,000, peaking at 10,000 homes per year in 2023. These participation rates would culminate in the upgrading of almost 80,000 homes by 2025, approximately 3.5% of the total housing stock projected for that year. Assuming potential savings of 30%, which includes weatherization plus other efficiency upgrades, we estimate a cumulative savings of 1,976 GWh by 2025. Our high case scenario operates under the same initial assumptions through 2015, with 800 manufactured homes upgraded through 2011 and 350 homes upgraded in the final year. With continuing funding, the number of homes upgraded increases to 500 annually until 2015, where the rate ramps up to 1,000 homes annually until 2020. The number of participating homes then increases to 1,500 annually until the 2022, where we assume an annual rate of 5,000 homes. These participation rates would culminate in the upgrading of almost 110,000 homes by 2025, or 5% of the total housing stock projected for that year. Again assuming a savings rate of 30%, we estimate a cumulative energy savings of 2,254 GWh. Behavioral Initiative Traditionally, state governments and utilities have approached the advancement of energy efficiency predominantly through mandates, such as building energy codes, and financial incentives, like rebates on energy-saving appliances. But creating laws is a lot less complicated and costly than enforcing them, and financial incentives do not always reduce the incremental cost of efficiency upgrades enough to persuade households to invest in them. Modifying consumer behavior by legislative or economic means has therefore failed to have the impact policymakers had originally hoped. Guided by research into social psychology from the past several decades, utilities and the energy industry in general have grown to realize the power of disseminating localized, comparative information on household energy consumption to customers in order to influence their behavior. This
South Carolina's Energy Future, ACEEE
34
comparative information, in the form of periodic reports, is equivalent to having an in-home energy monitor that provides information such as seasonal variations of energy use, but goes a step further by comparing one household's consumption patterns to similar households. The effect being that, when households are given information on how their peers are performing relative to themselves, there is a profound inclination to follow suit. Robert Cialdini, a social psychologist, regards this as "social proof," or a primitive survival instinct akin to peer pressure (Tsui 2009). Positive Energy, now known as OPOWER, has taken advantage of this intrinsic social characteristic and turned it into a business model. They have shown that mailing utility customers periodic reports on their household electricity consumption and comparing that usage to other customers with similar demographics and housing characteristics not just in the same city, but in the same neighborhood, can reduce household consumption between 1.5% and 3.5%. The personalized reports the company generates consist of monthly electricity usage that compares one's usage patterns to similar neighbors as well as to those neighbors that are relatively more successful (or unsuccessful) in implementing energy efficiency in their home. Based on individual household consumption patterns, the reports also make efficiency recommendations—ranging from simple steps like turning down your thermostat to more time- or dollar-intensive steps like purchasing ENERGY STAR products21—that quantify the potential savings, both in kilowatt and dollar terms. Rebate coupons targeting a household's more energy-intensive end-uses are simultaneously issued with the reports, increasing the probability that consumers will respond to the efficiency recommendations. Our behavioral initiative is modeled off of OPOWER's program illustrated above, though we acknowledge that other private sector companies, such as Google, are developing similar online resources to encourage behavioral change. There are several caveats to this policy that must be understood by the reader. First, as this is policy is intended primarily to impact consumer behavior, we assume that the only costs incurred are for program and administrative purposes, such as marketing and the issuing of reports. Any investment costs, such as purchasing efficient equipment or incentives provided by utilities, are borne by utilities through their efficiency programs. Second, we also assume a one-year persistence rate, i.e., that savings realized in one year are not perpetually generated and therefore do not accumulate so that savings are essentially a function of participation in the program, which ramps up over time. Finally, because savings are generated by behavioral changes rather than investments in technology, we assume that savings peak early and at a relatively low amount. In our medium scenario, we assume a five-year pilot program, where participation is steady at 2.5% for those five years and savings begin at 0.5%, increasing by 0.5% for the first three years and by 1% for the final two, peaking at 3.5%. Savings then remains at 3.5% for the remainder of the analysis period, while participation in the program increases by 2.5% annually, culminating in 30% participation by 2025. Under these assumptions, we estimate savings of 769 GWh in 2025. Discussions with OPOWER revealed that a more advanced program would be facilitated by the perpetuation of smart metering, where consumption information could be ascertained at the end-use level, such as HVAC, lighting, water heating, etc., allowing for more detailed reports and efficiency recommendations. For our high case scenario we assume the same initial five-year pilot program with the same participation and savings rates. Participation increases by 2.5% annually from 2015 through the remainder of the analysis, for a final participation rate of 30%. Savings peaks at 5% by 2020, where it remains steady for the remainder of the analysis period. We again assume a one-year persistence rate. Under these assumptions, we estimate savings of 1,098 GWh in 2025.
21 Presently, OPOWER has 150 different conservation/efficiency recommendations that it can cycle through or present depending on household consumption patterns.
South Carolina's Energy Future, ACEEE
35
Combined Heat and Power (CHP) Combined heat and power improves efficiency by combining usable thermal energy (e.g., chilled water and steam) and power production (e.g., electricity). This co-generation process bypasses most of the thermal losses inherent in traditional thermal electricity generation, where half to two-thirds of fuel input is rejected as waste heat. By combining heat and power in a single process, CHP systems can produce fuel utilization efficiencies of 65% or greater (Elliott and Spurr 1999).
Figure 12. Schematic Comparing a Combined Heat and Power System to Separate Heat and Power Systems
For this report, Energy and Environmental Analysis (EEA), a division of ICF International, undertook an assessment of the cost-effective potential for CHP in South Carolina by assessing the electricity end-uses at existing industrial, commercial, and institutional sites across the state and also considering sites that will likely be built in the future. These facilities would replace a thermal system (usually a boiler) with a CHP system that also produces power and that is primarily intended to replace purchased power that would otherwise be required at the site. EEA identified 1,150 MW from 22 CHP plants currently in operation. Detailed information from this analysis is provided in Appendix E. An additional application of CHP considered by this analysis is in the production of power and cooling through the use of thermally activated technologies such as absorption refrigeration. This application has the benefit of producing electricity to satisfy onsite power requirements and displacing electrically generated cooling, which reduces demand for electricity from the grid, particularly during periods of peak demand (see Elliott and Spurr 1999). Three levels of potential for CHP were assessed:
Technical Potential: represents the total capacity potential from existing and new facilities that are likely to have the appropriate physical electric and thermal load characteristics that would support a CHP system with high levels of thermal utilization during business operating hours.
9 units(Losses)
Power Plantfuel
(121 units)
7(Grid
Losses)
UsefulElectricity
35units
50units
UsefulHeat
Boilerfuel (59units)
180 units
Grid
BOILER
CHP
15 units(Losses)
Separate Heatand Power
Combined Heat and Power
CHPsystem fuel(100 units)
100 units
UsefulElectricity
UsefulHeat
PowerPlant
79(Gen.
Losses)
South Carolina's Energy Future, ACEEE
36
Economic Potential: reflects the share of the technical potential capacity (and associated number of customers) that would consider the CHP investment economically acceptable according to a procedure that is described in more detail in Appendix E.
Cumulative Market Penetration: represents an estimate of CHP capacity that will actually
enter the market between 2008 and 2025. This value discounts the economic potential to reflect non-economic screening factors and the rate that CHP is likely to actually enter the market. This potential is described in the energy efficiency policy scenarios, which are shown in the next section of the report.
The analysis identified an economic potential of around 140 MW of CHP capacity beyond what is already installed, assuming estimated electricity and natural gas price forecasts. In our medium case scenario, where customers installing CHP systems are given a $500 incentive per MW installed, the economic potential increases to around 300 MW. In our high case scenario, where customers installing CHP systems are given a $1,000 incentive per MW installed, the economic potential increases to around 900 MW. Policies and incentives provide an important catalyst to increasing the presence of CHP systems. In the next section, we estimate the impact that such an incentive can have on the market penetration of CHP in South Carolina. CHP in South Carolina South Carolina does not have policies in place that actively encourage the deployment of CHP. Though the state has made a few steps towards creating a more CHP-friendly environment, the current policies in place leave room for improvement in terms of supporting potential CHP developers and users (Eldridge et al. 2009). For South Carolina to see greater CHP deployment in the future, it is imperative that these policies be improved. An important, primary effect of encouraging investment in CHP is that it bolsters the ability of large- and medium-scale manufacturers in the state to utilize this technology to lower their energy costs, thereby greatly increasing their competitiveness in the market. Decreased dependence on the market for electricity is also a boon to the reliability and stability of the grid, providing dependable access to electricity across the state. South Carolina put an interconnection standard in place in 2006 that applies to CHP,22 but limits the size of eligible systems to 100 kW and under, preventing all but the smallest CHP systems from interconnecting into the local grid. Since most CHP systems are far larger, this interconnection standard fails to provide a clear path to interconnecting to the grid for most, if not all, viable systems. ACEEE recommends that the state adopt an interconnection standard in line with recommended national guidelines established by the Environmental Protection Agency.23 Ideally, an interconnection standard would allow for systems of at least 20 MW in size, and include multiple tiers of interconnection so that smaller systems would benefit from a more expedited interconnection process. Additionally, the requirement that interconnected generation be limited to 2% of the local rated circuit capacity appears to be somewhat constricting to future distributed generation deployment. While South Carolina does not offer specific financial incentives for CHP, the ConserFund Loan Program (ACEEE 2009), administered by the South Carolina Energy Office, can be used towards CHP projects. The loan program can only be used by government entities, public colleges and universities, school districts, and nonprofit organizations. To further encourage CHP deployment, the state may wish to consider a financial incentive program that directly impacts CHP in the form of a production tax credit, an investment tax credit, or a rebate on particular types of CHP equipment. 22 Please visit ACEEE's State Energy Efficiency Policy Database on South Carolina for more information: http://www.aceee.org/energy/state/southcarolina/sc_index.htm 23 See the EPA’s CHP Partnership web pages for additional information on suggested interconnection standards: http://www.epa.gov/chp/state-policy/interconnection.html.
As noted earlier, South Carolina does not currently have an EERS. Should the state implement one, as is recommended in this report, it’s important that CHP be included as an eligible technology.24 When CHP is included as an eligible technology, and thus an eligible efficiency resource, there is an increased incentive for CHP developers to bring systems to South Carolina. Including CHP in any definition of an EERS is a positive signal for CHP developers as it can help improve the economics of CHP since utilities are incentivized to deploy technologies that count toward the EERS. South Carolina has not currently implemented output-based air emissions regulations (Eldridge et al. 2009). This regulatory approach is important for CHP deployment, because it calculates a CHP system’s regulated emissions based upon the increased efficiency of a CHP system, giving the CHP system credit for the increased efficiency through which it creates energy. The EPA recommends that states adopt these output-based emissions regulations, and has developed guidelines for those emissions.25 Finally, South Carolina’s standby rates that are applicable to CHP systems are currently not favorable toward CHP deployment (ACEEE 2009). Santee Cooper offers standby service to CHP customers that contract with them for a specific amount of standby capacity. A high-demand charge and a significant penalty for requiring more than the contracted amount yields a standby rate that is viewed as unfavorable toward CHP. Similarly, Duke Energy provides standby service to facilities employing CHP by using a very high demand-based charge, which is also viewed as unfavorable. EPA offers useful guidance to states in developing standby rates that are more conducive of CHP development.26 All of these policies could be changed or improved by legislative action or regulatory proceedings. Many states in the U.S. have recently changed and improved their CHP policies, providing good examples of steps that should be taken at a state level. In addition, the Southeast CHP Application Center is a resource that can assist with implementation details.27 Lead by Example State and local government facilities represent unique opportunities for South Carolina to implement energy-efficient practices. Governor Sanford has recognized this and on June 11, 2008, signed H. 4766, an act obligating state agencies to develop energy conservation plans that codify what energy reduction measures will be implemented and to report on the progress of these measures as part of meeting an energy consumption reduction of at least 1% annually and a total of 20% by 2020, using the year 2000 as a baseline. Government buildings in South Carolina represent about 26% of commercial building energy use and almost 27% of commercial building electricity use in the state, or almost 6,000 GWh annually (EIA 2008b). The American Recovery and Reinvestment Act, through the State Energy Program, allocated $50 million to South Carolina's State Energy Office and, according to the SCEOs SEP application to DOE, $40 million of that total will be directed towards "Public Institution Energy Improvements." Of the $40 million, half will be dedicated to energy efficiency projects in local schools, while the other half will be dedicated to public universities and colleges as well as state agencies. Our medium case scenario is modeled to reflect the requirements mandated by H. 4766, so that annual electricity savings are at least 1%, resulting in 20% savings by 2020 using the year 2000 as the baseline. We assume the program remains funded through 2025 and that the savings measures implemented have a ten-year life, so that in 2020 no new savings are generated, rather the savings
24 For guidance on how to include CHP in an EERS see Chittum et al. (2009). 25 See the EPA’s CHP Partnership Web pages for information on recommended output-based emissions regulations: http://www.epa.gov/chp/state-policy/output.html. 26 See the EPA's CHP Partnership Web page on standby rates for more information: http://www.epa.gov/chp/state-policy/utility_fs.html. 27 For more information, visit http://www.chpcenterse.org/.
rate begins again at the original rate. Under these assumptions, we estimate cumulative savings of 1,873 GWh by 2025. Our high case scenario is modeled to reflect the commitments mandated by H. 4766, except that the program is augmented by increased savings from incorporating energy service performance contracts (ESPC) through an energy service company (ESCO), which we elaborate upon below. We assume that, in addition to the savings modeled in our medium case scenario, contracting energy service companies could increase annual savings by 0.5%. Under these assumptions, we estimate cumulative savings of 2,181 GWH through by 2025. The Federal Government and a number of other states use ESPC's to implement energy efficiency projects at government facilities. Under the ESPC model, state agencies hire ESCO's to implement projects designed to improve the energy efficiency and lower maintenance costs of the facility. The ESCO guarantees the performance of its services, and the energy savings are used to repay this project cost, as shown in Figure 13 (KCC 2008; Birr 2008). This model has proven highly effective in many places both in terms of delivering energy savings and in terms of cost-effectiveness (Hopper, Goldman, and McWilliams 2005).
Figure 13. Graphical Representation of How an ESPC Project Is Financed
Source: KCC (2008)
The key to the success of these projects is to bring together a project structure that can facilitate all aspects of the program, as is the case in Pennsylvania. Under that program, there are approximately three full-time equivalent staff supported by an experienced contractor where the program:
1. Pre-qualifies ESCOs that can participate in the program; 2. Reviews and negotiates the terms of the ESPC agreements since the government facilities
do not have the expertise to evaluate either the technical or contractual aspects of these projects; and
3. Reviews the completed projects to ensure that the projects are performing as agreed to in the contract.
Pennsylvania has been able to manage almost 50 projects each year, with total program and administrative costs of less than 2% of project costs (PA-GSA 2008; Birr 2008). South Carolina's EPSC program might be strengthened when compared to leading states such as Pennsylvania, Kansas, and Colorado, since we assume that it reaches only a portion of state facilities. A more robust structure and additional technical support might also be engaged. State agencies participate in efficiency programs, so significant additional energy efficiency opportunities still exist that could increase savings in state facilities. To address these opportunities, we recommend that South Carolina complement the goals targeted by H. 4766 by modeling the restructured program around the Pennsylvania experience and drawing upon an expert consultant to
South Carolina's Energy Future, ACEEE
39
complement the state agency staff (PA-GSA 2008). We also recommend that South Carolina draw upon a national organization that has been formed with DOE support, the Energy Services Coalition,28 which supports state and other entities in implementing ESPC programs (ESC 2008). Manufacturer Initiative The industrial sector is the most diverse economic sector, encompassing agriculture, mining, construction and manufacturing. In 2007, the industrial sector accounted for about 37% of South Carolina's electrical consumption, or 30,632 MWh. The majority of this energy was used in the manufacturing sector, particularly the chemical industry, which accounted for 30% of all industrial electricity. Primary metal manufacturing comes in a distant second at 12%. Figure 14 shows the industrial electricity use breakdown for 2007.29
Figure 14. South Carolina Industrial Electricity Consumption by Industry in 2007
Chemical mfg 30%
Primary metal mfg 12%
Nonmetallic mineral
product mfg 6% Paper mfg
7%
Transportation equipment mfg
6%
Other mfg21%
Textile mills 5%
Construction7%
Mining5%
Agriculture1%
Based on discussions with a broad range of stakeholders involved with the manufacturing sector, we propose a government/utility/industrial collaborative we are calling the "South Carolina Efficient Manufacturing Initiative." The goal of the initiative would be to address the three key barriers to expanded industrial energy efficiency identified by the stakeholders: the need for high-level assessments that identify energy efficiency opportunities; access to industry-specific expertise; and the need for an expansion of energy efficiency-related training for the manufacturing workforce. Proposed legislation in Congress may offer some complementary federal funding for the development of this resource, though it has not yet been passed. The initiative would establish Manufacturing Centers of Excellence in the model of the U.S. Department of Energy's Industrial Assessment Center (IAC)30 program, where university engineering students are trained to conduct energy audits at industrial sites. Even though South Carolina does not currently have an IAC center, South Carolina manufacturers are often served by IACs in North Carolina and Georgia. Centers could be established at major engineering universities such as the
28 For more information on the Energy Services Coalition, see http://www.energyservicescoalition.org /about/index.html. 29 Just added to the state's portfolio and not yet represented in Figure 16 is a major new assembly line plant proposed by Boeing in North Charleston that will bring hundreds of new jobs. 30 For more information on the IAC program, visit: http://iac.rutgers.edu/.
University of South Carolina and Clemson University. Expanding beyond the IAC model, these centers would partner with local community colleges and trade schools to bring their students into the larger network centered around the local Center of Excellence. These nearby satellite centers would extend training and associated materials to trade school and community college partners, and offer the opportunity to join the audits they conduct. Working together with organizations such as the South Carolina Manufacturing Extension Partnership (MEP), the South Carolina Manufacturers Alliance, and manufacturing trade associations, the center could provide outreach to manufacturing companies that might not otherwise be aware of energy efficiency programs and incentives. Further collaboration with the South Carolina Energy Office's industrial energy efficiency programs would let the program rely on existing infrastructure and expertise on sustainability, energy, and job creation. This initiative would provide multiple benefits to the state:
Meet the needs of South Carolina’s manufacturers for a trained technical workforce; Provide valuable real-world work experience to students interested in working in energy
management at manufacturing facilities; Meet the need of manufacturing facilities for reliable, knowledgeable, and affordable
consultation with regard to their energy usage and opportunities for improved productivity; and
Build capacity at educational facilities and in the MEP outreach efforts that connect South Carolina’s manufacturers to the wealth of knowledge and proficiency that resides in the state and beyond.
IAC program and implementation results recorded over the last 20 years show that this program could identify 10–20% electricity savings per facility and achieve a 50% implementation rate. Program costs for the IAC program are about $1 for every $10 saved by industry. We factor in another $0.25 per $10 saved to account for additional education costs. Under these assumptions we estimate cumulative savings in the medium case scenario of 470 GWh in 2015 and 1,900 GWh in 2025, or 2% of total projected electricity consumption in 2025. Our high case scenario assumes greater achievable savings, reaching 950 GWh in 2015 and 3,700 GWh in 2025, or 4% of the projected electricity consumption in 2025. We encourage the state to support an expanded federal manufacturing initiative similar to what has been suggested in recent congressional discussions.31 We also recommend researching complementary policies that could leverage economic development programs to reduce South Carolina’s energy consumption by industrial operations. Large Consumer Self-Direct As an alternative to a public program, a number of states have included a provision in their electric energy efficiency program structure referred to as “self-direct” or “opt-out” provision that allows large electric consumers to opt-out of paying into utility energy efficiency program charges if they implement energy efficiency projects at their own facilities at their own expense. The motivation for this results from a perception by some large consumers that the programs offered to them by the utilities are not responsive to their needs (ELCON 2008). The history of this type of provision has been mixed, with some self-direct programs not requiring rigorous evaluation, measurement and verification of the customer-implemented measures. In these instances, it’s been very difficult to determine if the savings projected by industrial customers has been achieved (Chittum and Elliott 2009). To address this concern, the regulator could require that the customer who chooses to self-direct retain at their own expense an approved contactor to undertake an assessment of the savings to ensure that they are in compliance with their savings obligation.
If regulators and the utilities ensure that program offerings for large consumer are responsive to the needs of the manufacturing sector, they can eliminate the need for self-direct. In fact, a recent ACEEE report found that well-administered self-direct programs look very similar to mature industrial custom incentive programs (Chittum and Elliott 2009). These latter programs are consistent with our recommendation for the establishment of the South Carolina Efficient Manufacturing Initiative. We see this approach as preferred for both the state, since industrial energy efficiency savings tend to be lower cost than other sectors, and the customers, since they receive the benefits of a program tailored specifically to meet their needs. It also helps ensure that the lessons learned and institutional knowledge gained by administering efficiency programs to the largest industrial customers benefits future industrial customers. This approach has worked well with the Oregon Energy Trust and BC Hydro in Canada (Chittum and Elliott 2009). Rural and Agricultural Initiative The agricultural sector is one of the most energy-intensive industries, relying on direct sources of energy, such as fuels or electricity to power farm activities, and on indirect energy resources contained in fertilizers or other agricultural chemicals. When energy prices are unstable or increasing, farmers and rural communities are impacted as agriculture becomes less profitable. In 2005 alone, U.S. farmers spent $5.84 billion on diesel fuel and another $2.30 billion on gasoline (Svejkovsky 2007). Energy efficiency is a near-term resource available to respond to immediate energy challenges in rural communities. A conservative analysis of the energy cost saving potential in the agricultural industry in the U.S. shows these savings to be over 34 trillion Btus and one billion dollars per year (Brown and Elliott 2005). This does not include non-energy benefits, such as increased financial stability due to reduced energy cost exposure, and decreased use of other resources, such as water—a particular concern for many states, including South Carolina. The 2005 ACEEE study referenced above estimates savings of $436 million annually by increasing energy efficiency in irrigation alone. Additionally, there are noteworthy climate change benefits. Agriculture by traditional definition makes up a little less than 1% of South Carolina’s industrial sector electricity use, averaging 311 GWh per year. A recent study, however, shows that the agribusiness sector as a whole (encompassing all aspects of farming and forestry) is the largest industry in the state, with a $33.9 billion impact on the economy, and providing nearly 200,000 jobs (Miley, Gallow, & Associates 2008). The food manufacturing industry alone was found to employ over 17,000 people with product shipments valued at over $4.3 billion, and is thus a major player in the energy footprint of the state. South Carolina’s agricultural sector produces a number of energy-intensive commodities, predominantly poultry (broilers and turkeys) as well as greenhouse and other nursery crops.
South Carolina's Energy Future, ACEEE
42
Figure 15. Estimated Electricity Consumption of South Carolina Commodity Crops (2007)
Broilers30%
Turkeys18%
Cattle & Calves6%
Oilseed & Grains6%
Eggs (Chicken)6%
All Other Products
16%
Greenhouse/nursery
10%
Other Crop Farming
8% Source: USDA 2007
In 2007, Governor Mark Sanford signed Executive Order 2007-04, establishing a committee to create a Climate, Energy and Commerce Action Plan, which was published in mid-2008. The Governor’s Climate, Energy and Commerce Advisory Committee (CECAC) recommendations for mitigating climate change included promoting on-farm energy efficiency, waste energy recovery measures for swine, dairy, and poultry operations, and expanded use of local agricultural products. By implementing the agricultural recommendations, including the application of improved irrigation technologies and precision agriculture techniques, organic fertilizers, and anaerobic digesters, the study predicted the state would reduce emissions by 1.54 MMtCO2e (million metric tons of carbon dioxide equivalent) between 2008 and 2020 (CECAC 2008). Although South Carolina may not currently have programs that could put these recommendations to work, the initiatives and opportunities described below provide a framework for doing so. In recent years, organizations specifically dedicated to improving farm and rural small business energy efficiency have emerged. Existing programs are widening their focus to include agricultural energy efficiency issues and to provide more online and on-farm audits, as well as both technical and financial support. The Energy Title (IX) of the 2008 Farm Bill provides more funding than previous legislative efforts to the Rural Energy for America Program (REAP, formerly Section 9006), which provides technical assistance and audits, as well as grants and loan guarantees for energy efficiency and renewable energy projects.32 Although there is more money and awareness today, many states still lack the internal structure to aid their farmers, ranchers, and rural small businesses in leveraging these Farm Bill funds.33 The 2008 Farm Bill also authorized a new program that will provide financial assistance toward increasing the energy self-sufficiency of rural communities. The Rural Energy Self Sufficiency Initiative will fund energy assessments, help create blueprints for reducing energy use from conventional sources, and install community-based renewable energy systems.34
32 For specifics on REAP project eligibility and additional information on the REAP program, see http://farmenergy.org/incentives/9006faq.php#_Toc194481353. 33 Of 1,158 applications for REAP funds in 2008, 766 were awarded grants or loan guarantees. South Carolina had 12 of 22 projects awarded funds ($1,037,038). From the Environmental Law and Policy Center (ELPC) 34 See Title VI, Energy Efficiency and Renewable Energy Programs for related program information: http://www.ers.usda.gov/FarmBill/2008/Titles/titleVIRural.htm#rural1.
The initiatives described below are meant to build capacity within the state of South Carolina in order to better provide energy efficiency-related knowledge, assessments, technical assistance and funding for rural small businesses and agricultural operations. I. Develop an Educational Program to be administered through the Rural Electric Cooperatives, the South Carolina Farm Bureau and the Extension Service The South Carolina Department of Agriculture, in conjunction with the South Carolina Farm Bureau, the South Carolina State Extension Service, and the South Carolina Rural Electric Cooperatives should establish an educational program which would disseminate information on energy efficiency best practices for farmers, ranchers and rural small businesses. This could take the form of a partnership with national organizations, such as the Rural Electricity Resource Council (RERC)35 or the USDA-RD.36 Several examples of state-specific educational programs exist that South Carolina can use as models. Southern California Edison utility runs an agriculture program that “promotes energy-efficient solutions for small and large farms, ranches, and dairies.”37 Their Web site provides information on a number of topics, including a Dairy Farm Energy Efficiency Guidebook and the Agricultural Technology Application Center (AGTAC). The latter, an “educational resource energy center,” includes hands-on displays and exhibits which are open to public; demonstrations of energy-efficient technologies; educational seminars and free workshops; and provides information regarding scheduling consultations with energy experts. AGTAC “connects customers to energy-related technology solutions that are energy efficient, positive for the environment and cost competitive.”38 In the Midwest, the Iowa Energy Center funded a project looking at the “Development of an Energy Conservation Education Program for Iowa’s Livestock and Poultry Industry.”39 The work products of the study will include a curriculum, with day-long training sessions for farmers, fact-sheets and a reference manual covering energy efficiency techniques, and a training regimen for extension agricultural field specialists, to assist with the distribution of the educational materials. Because of the regional specific nature of the agriculture sub-sector (Brown and Elliott 2005), it will be important for South Carolina to tailor its programs to the unique needs of the state's agricultural industries and rural communities. II. Offer a rural audit program, building on the USDA-REAP program South Carolina utilities and extension services should make use of the reauthorized USDA REAP program, which has $255 million dollars in mandatory funding for 2009–2012, to expand energy efficiency and renewable energy efforts throughout the state. ACEEE recommends that these entities provide onsite audits to farmers and rural small businesses as a preliminary step in the REAP application process. Pinpointing areas where a farmer could save energy or implement an energy efficiency project is the first step toward identifying a successful REAP project. Wisconsin’s Focus on Energy program provides onsite audits with Focus energy advisors to farms and agricultural-related businesses (crop storage, grain processing, etc.). The program is marketed through multiple channels, is promoted by stakeholders including universities, extension agents, 35 RERC’s Web site, www.rerc.org, provides materials on energy efficiency and is a national center for information on rural electricity topics. 36 The South Carolina Dept of Development does have a Web page for the energy office and information on saving energy for industry and businesses; however, there is no agriculture or rural community-specific section. The development of that on-line resource could be one component of a future education initiative. See http://development.South Carolina.gov/cdd/oee/c___i_services.htm for the page in question. 37 http://www.sce.com/b-rs/agriculture/ 38 http://www.sce.com/b-sb/energy-centers/agtac/ 39 http://www.energy.iastate.edu/Efficiency/Agricultural/cs/harmon_conserv.htm
contractors, utilities and cooperatives. During the 2001–2007 period 1,500 dairy farmers participated in the program. Focus on Energy has promoted awareness of the Farm Bill REAP opportunities in conjunction with the Department of Agriculture and local USDA offices. Energy savings since the program began are 14.8MW, 74 kWh, and 1.4 million Therms annually (Brooks and Elliott 2007). Alliant Energy operates a rebate and audit program for livestock and grain operations in Iowa, Minnesota and Wisconsin. The program has been in effect for more than 20 years, with over four hundred participating farms in 2006 and annual savings of 8-10 million kWh. The program also assists customers in applying for USDA funding, offering assistance for both grant application and project implementation. Specifically, the on-farm audit identifies energy waste, potential energy-efficient technologies to reduce energy usage, recommends efficient equipment specific to the operation, and provides information on available agricultural rebate programs. Operators can also earn cash back for purchasing recommended equipment.40 Irrigation is perhaps the most energy intensive activity within the agricultural sector, and has become an important issue for states dealing with water scarcity as well as increased energy demand. The Nebraska Public Power District (NPPD) provides financial incentives for irrigation-related projects through the Energy Wise Program run through the local electric utilities. The program pays for the costs associated with pump efficiency tests up to $350 and provides an additional incentive of $0.20/kWh saved for farmers or ranchers improving the energy efficiency of their irrigation systems. III. Create a pool of matching funds for USDA grants To further promote the implementation of energy-efficient technologies and projects, South Carolina should establish a system benefits charge (SBC) on electric utility bills to provide funds for matching USDA-REAP grants. Availability of these funds could prove vital for successful REAP applications, as the USDA is considering availability of non-REAP funding as a criterion for the application ranking process. The New York State Energy Research and Development Authority (NYSERDA) runs the FlexTech program, providing cost-sharing of energy audits or feasibility studies of improvements and load management techniques that would save money on farmers’ energy bills. The NYSERDA program is open to all sectors, but could be adapted in South Carolina to focus exclusively on agricultural operations as a tie-in with the USDA-REAP program funding. Across all sectors, FlexTech realizes $5 in energy savings and $17 in implementation/construction costs for every dollar spent on feasibility studies (Brooks and Elliott 2007). One alternative to state-run programs of the type described above would be for the state to designate a non-governmental organization to implement energy efficiency programs. Examples include Vermont’s Efficiency Vermont organization, and the Northwest Energy Efficiency Alliance (NEEA) which operates in the Pacific Northwest. Additionally, there are for-profit entities such as Vermont-based EnSave which focus specifically on improving energy efficiency in the agricultural sector. EnSave works in a number of states, from Maryland to Minnesota and California, implementing programs that range from dairy efficiency and diesel emission reduction to programs that operate farm energy audits and provide rebates for implementation of on-farm energy efficiency measures. For more information and additional resources, please see Appendix F.
40 More information on the Alliant Energy-IPL Farm Energy Audit program can be found on their Web site: http://alliantenergy.com/docs/groups/public/documents/pub/p014750.hcsp.
Building Energy Codes South Carolina’s building energy codes are relatively stringent when compared to the rest of the southeastern United States, but there is still room for improvement. Building energy codes are a foundational policy to ensure that efficiency is integrated into all new buildings in South Carolina. If efficiency is not incorporated at the time of construction, the new building stock represents a “lost opportunity” for energy savings because efficiency is difficult and expensive to install after construction is completed. Mandatory building energy codes are one way to target energy efficiency by requiring a minimum level of energy efficiency for all new residential and commercial buildings. Although enforcing compliance with energy codes can be difficult and costly, compliance is facilitated by introducing codes that are not convoluted in the sense that they allow contractors to follow either performance-based or various prescriptive-based paths. Forcing contractors to familiarize themselves with the measures required by various compliance paths undermines the efficiency goals of energy codes. Establishing energy codes that are simple and transparent will increase the likelihood of compliance and, thus, help to maximize energy savings. The collapse of the housing market and the arduous resuscitation of the national and state economies have led homeowners and contractors associations across the United States to argue that increasing the stringency of building codes would create an unnecessary burden on builders and purchasers as a result of greater costs, thus undermining progress in updating state codes.41 While improved energy efficiency in buildings does predicate increased costs, this increase is marginal relative to the overall cost of a home or building yet improves the marketability substantially through superior comfort and reduced energy bills. On November 28, 2007, the South Carolina Building Codes Council (SCBCC) updated the mandatory and permissive building codes that are used in the state. Prior to the official adoption of the 2006 IECC, the state legislature first had to pass H. 3550, the Energy Standard Act, which amended state law in order to eliminate prescriptive efficiency measures that superseded any efforts by the BCC to update the state's building codes to require compliance with new versions of the IECC. H. 3550 was signed by Governor Sanford on June 2, 2009. Compliance with the 2006 International Energy Conservation Code (IECC) for all residential and commercial buildings became effective July 1, 2009.42 Another important piece of legislation guiding building energy efficiency, S. 232, was signed by Governor Sanford on May 19, 2009. S.232 requires state agencies to consider reductions of their energy, water, and wastewater use, as well as requiring the implementation of conservation measures that are deemed cost-effective by the agency. The legislation also requires audits to be performed by internal or external auditors, or by an energy services company,43 the results of which must be included in a report to the SC State Energy Office. S.232 became effective May 21, 2009, and state agencies must be in compliance by July 1, 2011. South Carolina is estimated to add an additional 21,000 homes in 2009, or another 2% to its existing housing stock of around 2 million (Economy.com 2009). This is on par with the average annual growth in the state between 2000 and 2007; however, new construction in the residential sector is expected to drop to a low of about 1% annual growth in 2011. Based on forecasted employment, after a significant drop in job growth between 2008 and 2010, commercial construction is expected to grow
41 The American Recovery and Reinvestment Act included stipulations for access to additional funding dedicated to State Energy Programs that require states to update their codes to meet the most recent versions of the IECC and ASHRAE 90.1. This has caused many states to adopt or begin the process of adopting these new versions. 42 The South Carolina Department of Labor, Licensing, and Regulation, recently issued a Notice of Intention, alerting pertinent entities in the state that the SCBCC intends to adopt the 2009 editions of many codes, including the International Building Code and International Residential Code. The 2009 edition of the IECC was not included on its list. For more information, visit the South Carolina Department of Labor, Licensing, and Regulation. http://www.llr.state.sc.us/POL/bcc/PDFfiles/ notice%20of%20intent%20to%20adopt%20inet.pdf 43 Please see the piece on ESCOs in the discussion of the Lead by Example policy suggestion.
at a slightly faster pace than the residential sector beginning in 2011, leveling off at around 2% growth in 2014 (Economy.com 2009). Despite a drop in projected growth in building construction for both sectors over the next several years, South Carolina must be diligent in updating its energy codes, implementing new versions of the IECC as they become available. Our analyses of energy savings from building energy codes reflect this ideal commitment and our policy scenarios were modeled accordingly, with the current 2006 IECC as the base case for both the residential and commercial sectors. In our medium case scenario, we assume that the 2009 IECC is adopted in 2010 and becomes effective in 2012, which would reduce energy consumption by 15% in new residential and commercial construction relative to the 2006 IECC. The 2012 IECC is then adopted in 2013 and effective 2015, reducing energy consumption by 30% in new residential and commercial construction relative to the 2006 IECC. Under these assumptions, we estimate cumulative savings of 1,442 GWh and 1,048 GWh in by 2025 for the residential and commercial sectors, respectively, or a total of 2,490 GWh. Our high case scenario builds upon the medium case to include the adoption of the 2018 IECC in 2019, effective 2021, which would reduce energy consumption by 50% relative to the 2006 IECC. Under these assumptions, we estimate cumulative savings of 1,816 GWh and 1,280 GWh in by 2025 for the residential and commercial sectors, respectively, or a total of 3,095 GWh. New building codes require a commitment by the state to enforce the higher standards and must be given time to ramp up. We assume enforcement of each code begins at 70% compliance in the first year, 80% in the second year and 90% in the third and subsequent years. Workforce Initiative Energy efficiency tends to be more labor intensive than are supply resources, so developing a well-trained, local workforce that can address efficiency issues across all market sectors is critical. We thus see workforce development as a necessary element of many of the initiatives proposed above. But advancing efficiency in all sectors and throughout the entire state will require a workforce with training beyond the identification/assessment of efficiency opportunities: trained installers, technicians, engineers, architects, evaluation professionals, building operators, etc., all must be empowered with general and esoteric knowledge. Such investment in human capital will maximize the efficacy of efficiency programs while also providing additional benefit to the state's economy by creating new "green collar" jobs. The advent of corporate and social environmental responsibility has already begun to influence the evolution of careers in building system design and operations, but identifying the needs of the market—in particular workforce needs—is and will continue to be an important facet of any initiative that aims to improve the energy efficiency of commercial and residential buildings, especially over the long term. Another key challenge will be coordinating the various programs. The establishment of an inter-agency stakeholder group to coordinate workforce development activities is therefore critical and should bring together entities such as South Carolina's universities, utilities, manufacturers, state labor and energy agencies, and trade associations. Since the majority of the initiatives we suggest within the context of the EERS policies include workforce training elements, the dynamics of the individual programs will be facilitated by a stakeholder group overseeing the process in general while providing the various parties a venue for exchanging and soliciting ideas. South Carolina has recently stepped up its support for workforce development, allocating almost $1 million from its State Energy Plan funding into an Energy Efficiency Training Center Collaborative, which, according to the SEP application, "will allow the SCEO to dramatically increase the amount of energy-related training provided to the labor force of the state [...] The Collaborative will provide a central location for energy efficiency information sharing and offer a full range of courses for assessors, technicians, renewable energy installers and home energy auditors to become certified in their respective areas of expertise. The Collaborative will lay the groundwork for the State's Technical
South Carolina's Energy Future, ACEEE
47
College System to develop new curricula and offer courses designed to equip South Carolinians to compete in the new 'green' economy." The Collaborative will bring together the SCEO, the Governor's Office of Economic Opportunity, the South Carolina Technical College System and the South Carolina Department of Commerce. This collaborative is an encouraging step forward, but its scope should be expanded into other academic and technical areas in order to maximize the number of students graduating with pertinent backgrounds. Any state dedicated to promoting and advancing energy efficiency must educate and train more than assessors and technicians; architects, businesspeople, policy analysts, etc, must also be given opportunities to explore their chosen academic focus within an energy efficiency framework. Involving South Carolina's universities, colleges, and other two-year programs will help train minds that are not only equipped with the skill sets required to satisfy demand for energy efficiency services in the short-term, but are also given the knowledge necessary to develop, cultivate, and expand programs into the future to guarantee that South Carolina continues to reap the benefits of energy efficiency. Communication across entities within, and even outside of, the collaborative is imperative to guarantee that individuals are obtaining the proper education to satisfy the needs of the individual market sectors as well as guaranteeing job placement once their training has been completed. Discussion of Proven Utility Programs We have illustrated that the innovative policies suggested above have the potential to generate 10% and 16% of the savings goals mandated by our EERS policy for the medium and high case scenarios, respectively, which will give utilities a substantial boost towards meeting the remainder of the EERS target. There are many examples of program designs that have proven successful over the past three decades. In the text box below, we present several of these program types along with specific examples of successful implementations that are drawn from ACEEE's report Compendium of Champions: Chronicling Exemplary Energy Efficiency Programs from across the U.S. (York, Kushler, and Witte 2008). Examples of Proven Energy Efficiency Programs
Commercial/Industrial Lighting Programs: Provide recommendations and incentives to businesses to increase lighting efficiency. Aiming to expedite the adoption of new technologies and decrease end-user’s energy costs, the programs focus on marketing the most advanced lighting products and encourage greater efficiency in system design and layout. Xcel Energy’s Lighting Efficiency program reached 4,346 participants, saving a total of 273 GWh during the years 2002–2006.
Commercial/Industrial Motor and HVAC Replacement Programs: Encourage the
marketing and adoption of higher efficiency motors and HVAC equipment by offering rebates to distributors and end-users of qualifying equipment. Through monetary incentives and energy efficiency education, program advocates are shifting market tendencies away from a focus on initial equipment cost and toward an environment where lifecycle cost is increasingly considered by consumers. During 2006, Pacific Gas & Electric’s Motor and HVAC Distributor Program saved a total of 16.55 GWh of electricity by offering $3.9 million in rebates.
Commercial/Industrial New Construction Programs: Focus on training, educating, and providing financial incentives for architects, engineers, and building consultants to implement energy saving measures and technologies. By offering both prescribed and customizable incentive packages, these programs are able to influence a wide range of projects, which have in turn had the effect of raising the standards for energy efficiency in normal building
South Carolina's Energy Future, ACEEE
48
practices. With its four distinct, yet combinable project “tracks,” Energy Trust of Oregon, Inc.’s Business Energy Solutions: New Buildings program offers qualifying projects incentives of up to $465,000 each, which saved approximately 46.8 GWh of electricity and 1.2 million therms of natural gas through the end of 2007.
Commercial/Industrial Retrofit Programs: With programs ranging from energy efficiency
audits to financial assistance to even providing detailed engineering installation plans, Commercial/Industrial Retrofit Programs are designed to help implement cost-effective energy efficiency measures during new construction, expansion, renovation, and retrofit projects in commercial buildings. Programs focus on long-term energy management, peak load reduction, load management, technical analysis, and implementation assistance in order to give building owners and operators a better understanding of the energy related costs of, and potential savings for, their commercial buildings. Rocky Mountain Power and Pacific Power created approximately 100 GWh of gross electricity savings in Washington and Utah with their Energy FinAnswer and FinAnswer Express programs.
Residential Lighting and Appliances: Headed by utility companies and energy nonprofits
alike, Residential Lighting and Appliances Programs advocate the adoption of ENERGY STAR light bulbs, light fixtures, and home appliances through the use of rebates, marketing campaigns, advertising, community outreach, and retailer education. Lighting programs have focused on establishing and maintaining a customer base for compact fluorescent bulbs, in addition to fostering relationships between manufacturers and retailers in order to lower costs to the consumer. Appliance programs have sought to educate consumers on the long-term benefits of replacing aging, inefficient refrigerators, freezers, air conditioning units, and other large appliances with ENERGY STAR models, while providing an incentive to upgrade older models through rebates offered both for recycling old units and purchasing new ones. By selling 1.3 million CFLs during 2006 through its ENERGY STAR Residential Lighting Program, Arizona Public Service anticipates saving a total of 360 GWh of electricity during the lifetime of the light bulbs. Additionally, the California Statewide Appliance Recycling Program recycled 46,829 aging appliance units in 2007, a measure that saved 33.3 GWh of electricity in 2006.
Residential Mechanical Systems Programs: Provide rebates and other financial incentives
to contractors trained to properly install and service high-efficiency air conditioning, heat pumps, and geothermal heat-pump technologies. In addition to encouraging the purchase of energy-efficient appliances, these programs help to verify that existing equipment is appropriately installed and tuned in accordance with manufacturers’ specifications, in order to optimize energy savings. Long Island Power Authority’s Cool Homes Program has helped to introduce approximately 40,000 high-efficiency central cooling systems into the market, creating 29 GWh of annual electricity savings in 2006.
Residential New Homes Programs: Provide incentives to builders who construct energy-
efficient homes that achieve long-term, cost-effective energy savings. By addressing efficiency during the construction of homes and apartments, builders are able to maximize the financial and environmental benefits of efficient insulation, windows, air ducts, and appliances. Furthermore, ENERGY STAR certification provides developers with additional marketing strategies to attract buyers and renters. Some Residential New Homes programs also offer assistance to builders in developing efficiency objectives, and to potential buyers in locating efficient homes. With 100 participating residential builders and over 2,300 homes built to date, Rocky Mountain Power’s ENERGY STAR New Homes Program saved 3.4 GWh of electricity during 2006.
Residential Retrofit Programs: With an emphasis on large scale systematic retrofits,
Residential Retrofit Programs are designed to reduce electric and natural gas consumption and peak-time demand of residential buildings. Financial incentives, low-interest financing, and training are offered to residents and customers interested in assessing and improving
South Carolina's Energy Future, ACEEE
49
their energy efficiency. From weatherization and duct sealing to installation of new technologies, proponents of Residential Retrofit Programs direct their efforts both to buildings with the highest energy usage and constituents with the greatest financial need. Since its inception in 1993, Vermont Gas Systems, Inc.’s HomeBase Retrofit Program has installed over 1,600 kWh in energy saving measures, contributing to over 77,000 Mcf of natural gas savings.
Low-Income Programs: Seek to educate and assist qualifying participants in acquiring
appropriate home weatherization, energy-efficient lighting and appliances, and other efficiency improvements. By helping limited income households increase their energy efficiency and reduce energy consumption, these programs in turn minimize long-term energy costs to customers. Through its Appliance Management Program and Low-Income Services, National Grid has reached over 40,000 customers, creating 42 GWh of annual energy savings.
Financing Options for Energy Efficiency The up-front costs of investing in energy efficiency can often deter property owners from incurring additional debt, especially during periods of economic uncertainty when consumer confidence is low. The primary goal then is minimizing the initial costs so that owners are encouraged to invest in efficiency retrofits. Below we discuss several options that will allow property owners to make these retrofits while ensuring that they maximize their savings. An important facet common to these financing mechanisms is that the loan is attached to the property, so that the debt transfers to the new owner when the property is sold. Therefore property owners are only responsible for repaying the debt as long as they are benefiting from the efficiency improvements. The debt is also spread out over the course of several years, if not decades, which decreases the annual costs thereby increasing the annual savings from the efficiency improvements substantially. Tax liens placed on a property also help to increase the overall property value, and improve the cash flow of property owners (from reduced liability relative to the upfront costs). All three of these financing options would help create jobs immediately; jobs necessary to meet the demand for energy retrofits spurred by lower up-front costs.
On-Bill Financing: This loan mechanism allows property owners to repay their debt through a fee on their electric bill. The loan can be financed either by the utility or a third-party financer, although the fee would be collected by the utility. The loan is attached to the property, so that the debt is transferred to the new owner when the property is sold.
Property Tax Financing: A similar model to on-bill financing, except that instead of a fee,
the local government issues a surcharge, or lien, on the annual property taxes instead of onto the electric bill. The financing entity in this case would be the local government, which again could work with a third-party financer. The advantage of repaying the loan via a surcharge on property taxes is that property taxes can be deducted from the owner's income tax liability, further increasing the property owner's annual savings.
Property Assessed Clean Energy (PACE) Bond Financing: A PACE bond or lien is a debt
instrument attached to a residential, commercial or industrial property that allows the owners to pay the expense of retrofitting their homes, buildings, or facilities through their property taxes. The bonds can be issued by municipal financing districts or other financing entities, of which the proceeds from the bonds are lent to property owners to finance energy retrofits (efficiency and renewables). The loans are then repaid over 15–20 years through annual assessments on property tax bills.
Fourteen states have already passed legislation, California being the pioneer in 2008. ACEEE strongly encourages South Carolina to introduce enabling legislation to create a market for these bonds. More information can be found at www.pacenow.org.
Energy Efficiency Policy Scenario Results This section describes results from our policy analysis, including estimated cumulative electricity savings and peak demand impacts from efficiency in 2015 and 2025 for both the medium and high case scenarios. More detailed results are shown in Appendix B. The demand response potential and impacts on peak demand are covered in the next section and in Appendix D. Scenario Two—Medium Case Energy Efficiency The estimated cumulative electricity savings for the medium case scenario are shown by policy/program in Table 9. Under this scenario, South Carolina sets an electricity savings target, or EERS, of 18% (of 2025 sales) by 2025, which is equivalent to savings of 16,994 GWh relative to the modified reference case. As mentioned in the EERS policy discussion earlier, savings from all policies, with the exception of building energy codes, are allowed to count towards the EERS target. Under these conditions, we estimate that South Carolina can reduce its forecasted electricity consumption in 2025 by 10%, or 9,503 GWh, and reduce peak demand by 24%. Estimated summer peak demand reductions are shown by sector in Table 10. Proven utility programs are required to satisfy the remainder of the EERS target, accumulating savings of 7.8% of forecasted consumption in 2025, or 7,491 GWh. Including savings from building energy codes increases savings in 2025 to 19,484 GWh, almost 21% of forecasted electricity consumption in that year.
Table 9. Summary of Electricity Savings by Policy or Program in the Medium Case
Cumulative Electricity Savings by Policy
(GWh) 2015 2025
Total Savings in 2025 (%)
1 Energy Efficiency Resource Standard
2 Advanced Buildings Initiative 266 957 1.0%
3 Behavioral Initiative 56 769 0.8%
5 CHP 38 300 0.3%
6 Lead by Example 227 1,873 2.0%
7 Low-Income Weatherization 177 1,662 1.7%
8 Manufactured Homes Initiative 78 1,976 2.1%
9 Manufacturer Initiative 469 1,914 2.0%
10 Rural & Agricultural Initiative 19 52 0.1%
11 Proven Utility Programs
Residential 698 4,311 4.5%
Commercial 505 3,180 3.3%
EERS Savings 2,729 16,994 17.9%
EERS Savings (% Reduction of Ref. Case) 3.0% 17.9%
4 Building Energy Codes 416 2,490 2.6%
Total Savings (EERS + Bldg Codes) 2,950 19,484 20.5%
Adjusted Electricity Forecast (GWh) 81,742 75,619
Notes
1 We assume 18% savings by 2025 relative to 2025 projected sales.
South Carolina's Energy Future, ACEEE
51
Cumulative Electricity Savings by Policy
(GWh) 2015 2025
Total Savings in 2025 (%)
2 Initiative broken down into programs for existing homes and new construction for both residential and commercial buildings. Residential analysis for existing homes assumes 0.5% savings throughout the analysis period and 0.5% participation rate in first year, with participation increasing by 0.5% annually until 2018, where participation then grows 1% annually, reaching 15% by 2025. Savings from new construction assumes 50% savings beyond current code (IECC 2006), thereby decreasing with the adoption of new energy codes except in 2020, where we assume program implementation and participation has matured to allow for savings beyond the 50% savings from IECC 2012. In 2011 we assume an initial participation rate of 5%, increasing by 1% annually throughout the analysis period, thereby reaching 20% participation in 2025. Commercial analysis for existing buildings assumes 1% savings throughout the analysis period. The program participation rate begins at 0.25% in the first year, increasing annually by 0.25% until 2012 and by 0.5% annually until 2020, then increasing by 1% for the final five years so that participation reaches 10% by 2025. We assume that 74% of total commercial electric floorspace is non-governmental buildings, to avoid double-counting savings attributable to state facilities program (EIA 2008b, table C17). Savings from new construction again assumes 50% savings beyond South Carolina's current code (IECC 2006), thereby decreasing when updated energy codes become effective in 2012 and 2015. In 2010 we assume an initial participation rate of 10%, increasing by 1% annually throughout the analysis period, reaching 25% by 2025.
3 We assume a five-year pilot program, where participation is steady at 2.5% for the first five years and savings begin at 0.5%, increasing by 0.5% for the first three years and by 1% for the final two, peaking at 3.5%. Participation in the program increases by 2.5% annually from 2015 through the remainder of the analysis period. We also assume a one-year persistence rate, i.e., that savings realized in one year are not perpetually generated and therefore do not accumulate.
4 We assume that the 2009 IECC is adopted in 2010 and becomes effective in 2012, which would reduce energy consumption by 15% in new residential and commercial construction relative to the 2006 IECC. The 2012 IECC is then adopted in 2013 and effective 2015, reducing energy consumption by 30% in new residential and commercial construction relative to the 2006 IECC. Savings apply only to end-uses covered under building codes, which are HVAC, lighting, and water heating end-uses, or 50% of electricity consumption in new residential construction and nearly 60% of electricity consumption in commercial buildings. We assume enforcement of each code starts at 70% compliance in the first year, 80% in second year, and 90% in the third and subsequent years.
5 We assume a $500 incentive per MW for CHP facilities. 6 HB 4766 requires state agencies to reduce energy consumption by 1% annually and 20% cumulatively by 2020,
using year 2000 sales as the baseline. 26% of commercial building electricity use in SC is in government buildings. We assume the program remains funded through 2025 and that the savings measures implemented have a ten-year life, so that in 2020 no new savings are generated, rather the savings rate begins again at the original rate.
7 Our medium case scenario is modeled so that in 2011, in addition to the 6,500 homes weatherized with ARRA funds, South Carolina will weatherize an additional 300 homes (up from around 250 annually for the previous two years). We assume that the number of homes weatherized each year increases by 500 until 2015, when the number of participating homes increases annually by 1,000. We assume weatherization generates an average of 20% electricity savings.
8 Our medium case scenario assumes that 800 manufactured homes are upgraded through 2011 (the program target) with 350 homes upgraded in the final year, and that the program continues to be funded through 2025. We also assume that, after the initial three years, the number of manufactured homes treated increase by 500 until 2015, when the number of participating homes begin to increase annually by 1,000, peaking at 10,000 homes per year in 2023.
9 Our medium case scenario assumes that the number of industrial assessments ramps up from 50 to 200 in first three years, that each assessment identifies 15% electricity savings, and that 50% of identified savings are implemented. Project costs assume the average investment cost per kWh from the industrial sector analysis ($0.28/kWh) and program cost is assumed to be 12.5% of projected cost savings to the end-user.
10 Based on similar programs and values from the State of Wisconsin Focus on Energy 2007 Semiannual Report, we assume the average cost of conserved energy at $0.025/kWh, that program & administrative costs are 24% of the cost of investment, and that customers cover half of the investment cost.
11 Savings for proven programs are the difference between EERS requirements and policy savings. All of the recommended policies except building energy codes are counted towards meeting the EERS requirements. Sector savings are then allocated based on the contribution to economic potential savings of the residential and commercial sectors.
South Carolina's Energy Future, ACEEE
52
Table 10. Summary of Summer Peak Demand Reductions by Sector in the Medium Case (MW)
% Reduction (relative to forecast) 3.6% 23.9% Scenario Three—High Case Energy Efficiency The estimated cumulative electricity savings for the high case scenario are shown by policy/program in Table 11. In the high case scenario, South Carolina sets an electricity savings target, or EERS, of 24% (of 2025 sales) by 2025, which is equivalent to savings of 23,119 GWh relative to the modified reference case. As mentioned in the EERS policy discussion earlier, savings from all policies, with the exception of building energy codes, are allowed to count towards the EERS target. Under these conditions, we estimate that South Carolina can reduce its forecasted electricity consumption in 2025 by 16%, or 15,329 GWh, and reduce peak demand by 32%. Estimated summer peak demand reductions are shown by sector in Table 12. Proven utility programs are required to satisfy the remainder of the EERS target, accumulating savings of 8.2% of forecasted consumption in 2025, or 7,790 GWh. Including savings from building energy codes increases savings in 2025 to 26,215 GWh, almost 28% of forecasted electricity consumption in that year.
Table 11. Summary of Electricity Savings by Policy or Program in the High Case
Cumulative Electricity Savings by Policy
(GWh) 2015 2025
Total Savings in 2025 (%)
1 Energy Efficiency Resource Standard
2 Advanced Buildings Initiative 277 1,541 1.6%
3 Behavioral Initiative 56 1,098 1.2%
5 CHP 604 1,714 2.6%
6 Lead by Example 433 2,181 2.3%
7 Low-Income Weatherization 177 2,062 2.2%
8 Manufactured Homes Initiative 78 2,254 2.4%
9 Manufacturer Initiative 948 3,656 3.8%
10 Rural & Agricultural Initiative 19 52 0.1%
11 Proven Utility Programs
Residential 858 4,483 4.7%
Commercial 621 3,307 3.5%
EERS Savings 4,071 23,119 24.3%
EERS Savings (% Reduction of Ref. Case) 4.8% 24.3%
4 Building Energy Codes 416 3,095 3.3%
Total Savings (EERS + Bldg Codes) 4,487 26,215 27.6%
Adjusted Electricity Forecast (GWh) 80,206 68,888
Notes 1 We assume 24% savings by 2025 relative to 2025 projected sales.
South Carolina's Energy Future, ACEEE
53
Cumulative Electricity Savings by Policy
(GWh) 2015 2025
Total Savings in 2025 (%)
2 Initiative broken down into programs for existing homes and new construction for both residential and commercial buildings. Residential analysis for existing homes assumes 0.5% savings until 2015 and 1% for the remainder of the analysis period. Participation in the program beings at 0.5%, increasing by 0.5% annually until 2018, where participation then grows 2.5% annually and 5% in the final year. Savings from new construction assumes 50% savings beyond current code (IECC 2006), thereby decreasing with the adoption of new energy codes, effective in 2012 and 2015. In 2021, when the 2018 IECC becomes effective, delivering 50% savings beyond the 2006 IECC, we assume an additional 20% savings beyond the 2008 IECC are achievable. We assume an initial participation rate of 5%, increasing by 1% annually through 2020, when participation increases by 2% annually for the remainder of the analysis period. Commercial analysis for existing buildings assumes 1% savings until 2020, when savings reaches 2% annually. The program participation rate begins at 0.25% in the first year, increasing annually by 0.25% until 2012 and by 1% annually until 2021, then increasing by 2.5% for the final four years so that participation reaches 20% by 2025. We assume that 74% of total commercial electric floorspace is non-governmental buildings, to avoid double-counting savings attributable to state facilities program (EIA 2008b, table C17). Savings from new construction again assumes 50% savings beyond South Carolina's current code (IECC 2006), thereby decreasing when updated energy codes become effective in 2012 and 2015. In 2021, when the 2018 IECC becomes effective, delivering 50% savings beyond the 2006 IECC, we assume an additional 20% savings beyond the 2018 IECC are achievable. In 2010 we assume an initial participation rate of 10%, increasing by 1% annually until 2015, when participation begins to increase by 2% annually for the remainder of the analysis period.
3 We assume a five-year pilot program, where participation is steady at 2.5% for the first five years and savings begin at 0.5%, increasing by 0.5% for the first three years and by 1% for the final two, peaking at 3.5%. Savings peaks at 5% by 2020 and remains at 5% for the remainder of the analysis period. Participation in the program reaches 5% by 2015 and increases by 2.5% annually for the remainder of the analysis, reaching 30% in 2025. We again assume a one-year persistence rate.
4 We assume that the 2009 IECC is adopted in 2010 and becomes effective in 2012, which would reduce energy consumption by 15% in new residential and commercial construction relative to the 2006 IECC. The 2012 IECC is then adopted in 2013 and effective 2015, reducing energy consumption by 30% in new residential and commercial construction relative to the 2006 IECC. The 2018 IECC is adopted in 2019, effective 2021, reducing electricity consumption 50% relative to 2006 IECC. Savings apply only to end-uses covered under building codes, which are HVAC, lighting, and water heating end-uses, or 50% of electricity consumption in new residential construction and nearly 60% of electricity consumption in commercial buildings. We assume enforcement of each code starts at 70% compliance in the first year, 80% in second year, and 90% in the third and subsequent years.
5 We assume a $1000 incentive per MW for CHP facilities and the removal of disincentives. 6 HB 4766 requires state agencies to reduce energy consumption by 1% annually and 20% cumulatively by 2020,
using year 2000 sales as the baseline. In this scenario, the program is augmented by increased savings from incorporating energy service performance contracts through an energy service company, increasing savings by an additional 0.5%.
7 Our high case scenario is modeled so that in 2011, in addition to the 6,500 homes weatherized with ARRA funds, South Carolina will weatherize an additional 300 homes (up from around 250 annually for the previous two years). We again assume that the number of homes weatherized each year increases by 500 until 2015, when the number of participating homes increases annually by 1,500 through 2021, 2,000 for the following two years and 2,500 homes for the final two years. We assume weatherization generates an average of 20% electricity savings.
8 Our high case scenario assumes that 800 manufactured homes are upgraded through 2011 (the program target) with 350 homes upgraded in the final year, and that the program continues to be funded through 2025. We again assume that, after the initial three years, the number of manufactured homes treated increase by 500 until 2015, when the number of participating homes begin to increase annually by 1,000 until 2020, 1,500 until 2022, and 5,000 annually through 2025. We again assume a savings rate of 30%.
9 Our high case scenario assumes that the number of industrial assessments ramps up from 50 to 150 in first three years, that each assessment identifies 13% electricity savings, and that 50% of identified savings are implemented. Project costs assume an average investment cost per kWh of $0.28/kWh and program cost is assumed to be 12.5% of projected cost savings to the end-user.
10 Identical to the medium case scenario, this policy is based on similar programs and values from the State of Wisconsin Focus on Energy 2007 Semiannual Report. We assume the average cost of conserved energy at $0.025/kWh, that program & administrative costs are 24% of the cost of investment, and that customers cover half of the investment cost.
11 Savings for proven programs are the difference between EERS requirements and policy savings. All of the recommended policies except building energy codes are counted towards meeting the EERS requirements. Sector savings are then allocated based on the contribution to economic potential savings of the residential and commercial sectors.
South Carolina's Energy Future, ACEEE
54
Table 12. Summary of Summer Peak Demand Reductions by Sector in the High Case (MW)
% Reduction (relative to forecast) 5.1% 32.0% Costs and Benefits in the Medium Case Energy Efficiency Policy Scenario In this section we estimate the costs and benefits of the medium case energy efficiency policy scenario to determine overall cost-effectiveness. There is no single answer to whether energy efficiency is cost-effective, but rather there are multiple perspectives analysts utilize to determine cost-effectiveness. Here, we examine our policy analysis using two cost-effectiveness tests: the Total Resource Cost (TRC) test and the Participant Cost test. We do not do an equivalent analysis for the demand response policy scenario, which is discussed in the next section, due to the difficulty in evaluating the dollar savings benefits to consumers from demand response measures. The costs needed to run the efficiency policies suggested in our policy analysis and to achieve the estimated electricity savings include both the investments in efficient technologies or measures and the administrative or marketing costs to run programs and administer policies. The technology investments might include any combination of incentives paid to customers or direct consumer costs. See Table 13 for a breakdown of the estimated costs of the policies from our analysis. See Appendix B for estimates of Total Resource Costs.
Table 13. Annual Energy Efficiency Costs from Medium Case Scenario (Millions of 2007$)
2015 2025 Customer Investments $ 196 $ 582
Incentives Paid to Customers $ 71 $ 411
Admin/Marketing Costs $ 28 $ 122
Total Costs $ 295 $ 1,115 Note: These costs are undiscounted and are shown in real 2007$
The chapter on macroeconomic impacts uses these cost assumptions to estimate impacts of the efficiency policies on the economy, including overall benefits to customers. Here, we report a net present value (NPV) analysis of costs and benefits to society and to participants. The next two tables (see Tables 14 and 15) show results from the TRC test and the Participant Cost test, respectively, with a breakdown of total costs and benefits (present value in 2007$) by policy type and by sector over the study time period (2009–2025). Readers should note that although the study time period ends in 2025, savings from the efficiency measures persist over the lifetime of each specific measure. Accounting for these additional savings beyond the study time period would yield additional benefits and therefore a higher benefit/cost ratio. The TRC test, as shown in Table 14, evaluates the net benefits of energy efficiency to the region as a whole. This test considers total costs, including investments in efficiency measures (whether incurred by customers or through incentives) and administrative or marketing costs. Benefits in the TRC test are the avoided costs of energy, or the marginal generation costs that utilities avoid by reducing electricity consumption through energy efficiency. The avoided energy resource costs were determined by the analysis by Synapse Energy Economics (see Appendix A). The TRC test, which shows an overall benefit-to-cost ratio of 1.4, suggests a net positive benefit to South Carolina as a whole from implementing these efficiency programs and policies. Accounting for additional savings beyond the study time period would yield a benefit/cost ratio of 2.3.
South Carolina's Energy Future, ACEEE
55
See Figure 16 for a representation of the results using three different discount rates.
Table 14. Total Resource Cost (TRC) Test (2009–2025) (Millions of 2007$)
By Sector NPV Costs NPV Benefits Net Benefit B/C Ratio
Residential $ 2,582 $ 2,980 $ 398 1.2
Commercial $ 1,367 $ 2,095 $ 728 1.5
Industrial $ 394 $ 850 $ 456 2.2
Total $ 4,342 $ 5,925 $ 1,583 1.4 * Building energy codes were not included as part of the EERS
The Participant Cost test, as shown in Table 15, takes the perspective of a customer installing an energy efficiency measure in order to determine whether the participant benefits. The costs are the costs to customers for purchasing or installing energy efficiency and the benefits are the savings on customers’ electricity bills due to reduced consumption plus any incentives paid to the customers. Again, this analysis only takes into account costs and benefits through 2025, even though customer savings on electric bills would continue well past 2025. Without accounting for the benefits that persist after measures installed in 2025, the Participant Cost test yields a positive benefit to participants, with a benefit/cost ratio of 1.8. Accounting for additional savings beyond the study time period would yield a benefit/cost ratio of 3.0.
South Carolina's Energy Future, ACEEE
56
Table 15. Participant Cost Test (2009–2025) (Millions of 2007$)
By Sector NPV Costs NPV Benefits Net Benefit B/C Ratio
Residential $ 2,290 $ 4,186 $ 1,896 1.8
Commercial $ 1,210 $ 2,315 $ 1,105 1.9
Industrial $ 381 $ 617 $ 236 1.6
Total $ 3,881 $ 7,118 $ 3,237 1.8 * Building energy codes were not included as part of the EERS
Figure 16. Results of TRC and Participant Cost Tests Using Three Discount Rates
-
0.20
0.40
0.60
0.80
1.00
1.20
1.40
1.60
1.80
2.00
TRC Test Particpant Test
Be
ne
fit/
Co
st
Ra
tio
3% Discount Rate
5% Discount Rate
7% Discount Rate
South Carolina's Energy Future, ACEEE
57
Water Efficiency Policy Analysis In this section we present the suite of five water efficiency policies that we suggest South Carolina implement in order to enhance water efficiency in the state. We have estimated the resulting water savings, costs, and consumer water bill savings ($) that can be realized from their implementation, though costs and benefits are quantified only for four of the water policies. The policies were analyzed within a three scenario framework: our base-case reflects business as usual; our medium case scenario reflects a significant commitment to efficiency and is the scenario on which we focus the publication of our results; our high case scenario represents a more aggressive approach where the state takes greater advantage of its available, cost-effective resource potential. Water Efficiency Policy Options for Public Water Supplies Just as state policies and utility investments can yield cost-effective electricity savings, similar approaches to technology and policy can yield cost-effective water savings for South Carolina’s public water systems, wastewater service providers, and their customers. Water-efficient plumbing products and household appliances offer substantial savings at relatively modest incremental cost. Attention to soil preparation, plant selection, and irrigation efficiency can reduce the water requirements of new ornamental landscapes. Acoustic monitoring can help pinpoint leaks in utilities’ water distribution systems and reduce the frequency and cost of water main breaks. And sending effective price signals to consumers by metering water deliveries and setting rational and understandable water rates enhances both the equity and the efficiency of water use. Five policies or programs to improve water use efficiency are presented below. Statewide Plumbing Efficiency Standards Nationwide standards for the water efficiency of plumbing products, including toilets, urinals, showerheads, and faucets, were enacted in 1992 and took full effect by 1997. These standards apply to all new plumbing product sales and imports throughout the United States, and as originally enacted, preempted any state or local efficiency standards applying to such products. However, under the terms of current law, federal preemption has lapsed, and states and localities are now free to set more stringent efficiency standards than the federal minimums. The US EPA’s voluntary WaterSense program has adopted higher performance specification for products earning the WaterSense label.44 Two states, California and Texas, have recently enacted more stringent efficiency standards for new toilets, with effective dates beginning in 2012. The measure evaluated here for both the medium- and high-case scenarios is the adoption of statewide standards for the efficiency of new residential plumbing products sold or installed in South Carolina beginning January 1, 2012, as follows:
o Tank-type toilet 1.28 gallons per flush (gpf) o Showerheads 2.0 gallons per minute (gpm) o lavatory faucets and faucet aerators 1.5 gallons per minute (gpm)
Statewide adoption of efficiency standards for new products provides the simplest approach to administration and enforcement, allowing suppliers and installers a single set of criteria that will not vary across county lines, and extending the benefits of water efficiency to consumers throughout the state. The standard proposed for tank-type toilets applies to all sales and installations after January 1, 2012, including installations during major renovation and simple replacement as well as new construction.
44 Specifications for tank-type toilets were adopted in January 2007; lavatory faucets and faucet aerators in October 2007; and showerheads (proposed) in September 2009 (EPA 2009).
South Carolina's Energy Future, ACEEE
58
Tank-type toilets are used in nearly all residential applications and in some commercial applications, although we have not attempted to quantify the costs and benefits of the standard for the commercial sector. This proposed standard does not extend to the valve-type toilets found in most other commercial applications, since test protocols and performance metrics for high efficiency valve-type toilets are still under development. The standards proposed for showerheads, lavatory faucets, and faucet aerators apply to installations in new construction beginning January 1, 2012, but do not apply to installations during renovation and replacement. High efficiency showerheads should be matched with pressure- or temperature-balancing shower control valves to reduce the risk of sudden temperature changes and the attendant risk of shower accidents. Such control valves were not required by code in new homes until the late 1980s, and the unrenovated showers in many older homes would require shower valve replacement that could be costly. Regarding lavatory faucets, the hot water distribution plumbing in many existing homes serves to limit the water-saving potential of high efficiency faucets, due to extended wait times for hot water to reach the sink in remote lavatories. As with tank-type toilets, showerheads and lavatory faucets have many commercial applications, but we have not attempted to quantify the costs and benefits of the standard for the commercial sector. Statewide water savings are estimated to reach 2.1 million gallons per day (mgd) in 2015 and 8.0 mgd in 2025. Water and sewer savings for residential customers will total $4.8 million per year in 2015 and $22.5 million in 2025. The direct statewide electricity savings attributable to the showerhead and faucet efficiency standards are estimated to reach 12.9 GWh per year in 2015 and 54.1 GWh in 2025. The indirect statewide electricity savings attributable to the energy embedded in water and wastewater service are estimated to reach 2.5 GWh per year in 2015 and 9.5 GWh in 2025. Replacement of Inefficient Plumbing in Existing Residences As noted above, national standards for the water efficiency of new plumbing products were enacted in the Energy Policy Act of 1992 (EPAct) and took effect for residential products in January 1994. These standards applied to products manufactured or imported as of that date; distributors and contractors were allowed to continue to sell and install non-conforming products remaining in stock until such supplies were exhausted. However, the plumbing supply chain generally does not carry extensive quantities of finished products in inventory. Thus, housing constructed from 1995 forward is likely to contain only EPAct-compliant fixtures, while housing constructed before that date still contains inefficient fixtures, reduced in number by the rate of remodeling and replacement. The measure evaluated here is the adoption of a countywide requirement to take effect in 2012 for the replacement of inefficient toilets (defined as those not meeting EPAct standards) with toilets meeting currently applicable standards upon the sale of any residence built before 1995. In this way, existing homeowners remain undisturbed in their property, but the water efficiency of the existing housing stock is enhanced at a moderate but steady rate as existing homes are sold to new owners. The mechanism for requiring and documenting the retrofit is up to the local jurisdiction. For example, documentation of toilet replacement may be required as a precondition of settlement, or as a condition for opening a new utility service account in the name of the new owner. In either case, flexibility may be provided by allowing the retrofit to be completed by the new owner within the first six months of ownership. Consistent with the recommendation above, inefficient tank-type toilets would be replaced with units that operate with a maximum of 1.28 gpf. The medium case scenario assumes that this policy will be applied by the ten largest counties in South Carolina. The high case scenario assumes that this policy is also adopted by each of the fifteen counties in the state’s Capacity Use Areas (three counties are in both groups). Under the medium case scenario, water savings for the ten largest counties are estimated to total 2.1 mgd in 2015 and 5.0 mgd in 2025. Water savings for the fifteen CUA counties are estimated to total
South Carolina's Energy Future, ACEEE
59
1.7 mgd in 2015 and 4.8 mgd in 2025. Accounting for the overlapping counties, the high case savings total 2.9 mgd in 2015 and 7.4 mgd in 2025. Under the medium case, the additional electricity savings attributable to the energy embedded in water and wastewater service are estimated to total 2.5 GWh in 2015 and 5.9 GWh in 2025. Under the high case, the additional electricity savings attributable to this embedded energy are estimated to total 3.4 GWh in 2015 and 8.7 GWh in 2025. Reduction of Water Losses from Utility Distribution Systems Leakage from utility distribution systems can be a major source of lost water, wasting both the resource itself and the costs of pumping and treating the water to potable standards. All pressurized water distribution systems leak, with the rate and location of leakage depending on community-specific factors such as pipe composition and age, water and soil chemistry, street traffic and vibration, the quality of original installation, and water system pressures, both average pressures and transient spikes in pressure. In addition, purposeful releases of water at unmetered points in the system, such as for firefighting, line flushing, or construction access, as well as unauthorized uses, including theft of water, can complicate the careful analysis of water losses that is necessary for an effective leak reduction program. In August 2003, the American Water Works Association (AWWA) Water Loss Control Committee published “Applying Worldwide Best Management Practices in Water Loss Control” in Journal AWWA, describing water loss best practices developed by the International Water Association (AWWA 2003). Earlier this year, the AWWA completed a thorough revision of its manual M-36 pertaining to water audits and loss control programs (AWWA 2009). Today, any water utility has access to free water audit software that provides a standardized approach to accounting for water deliveries and losses, and facilitates the assessment and improvement of the reliability of water delivery data.45 The measure evaluated here calls for consistent annual reporting of water losses by drinking water suppliers statewide through the use of the currently available AWWA software46, together with the carefully targeted investments by water utilities in the 10 largest counties to reduce water losses. Under the medium case scenario, economically recoverable water losses – losses that by definition are cost-effective for the utility to eliminate – are reduced by 50% by 2025 in South Carolina’s10 largest counties. Under the high case scenario, economically recoverable water losses are reduced by 90% by 2025 in these same 10 counties. Under the medium case scenario, water savings for the ten largest counties are estimated to total 0.8 mgd in 2015 and 8.8 mgd in 2025. Under the high case, water savings for these same counties are estimated to total 1.3 mgd in 2015 and 14.5 mgd in 2025. Under the medium case, the additional electricity savings attributable to the energy embedded in water service are estimated to total 0.6 GWh in 2015 and 6.6 GWh in 2025. Under the high case, the additional electricity savings attributable to this embedded energy are estimated to total 1.0 GWh in 2015 and 10.9 GWh in 2025. Water Efficient Landscape Irrigation Ordinances A large portion of the drinking water supplied by water utilities to customers in South Carolina is used for landscape irrigation. Water consumption for ornamental irrigation varies with such factors as plant
45 Version 4.0 of AWWA’s “Free Water Audit Software” is available for download at www.awwa.org/Resources/WaterLossControl.cfm?ItemNumber=48511&navItemNumber=48158. 46 See, for example, Title 2 Sec. 16.0121 of the Texas Water Code, which requires that retail public water utilities file a standardized water audit once every five years with the Texas Water Development Board (TWDB). TWDB also recommends that utilities compile a water audit annually on the same business year cycle as the financial audits that many utilities perform.
selection, soil preparation, slope, and the knowledge and skill of landscape and irrigation system designers, installers, maintenance workers, and homeowners. While no one strategy can improve performance in all these areas simultaneously, many opportunities to achieve significant savings through improved design and installation of new landscapes are available at the time of initial installation or major renovation. The measure evaluated here is the adoption of water-efficient landscape ordinances applicable to newly installed landscapes. Such ordinances may be prescriptive, such as barring placement of high water use plants in narrow strips or on steep slopes that are difficult to irrigate efficiently, or requiring rain shut-off valves on any newly installed in-ground irrigation system.47 Or the ordinance might be performance based, such as assigning an overall water budget to each new landscape, Or it could be a combination of the two approaches. The ordinances modeled here would be designed to reduce average outdoor water usage by 15 to 20% during the six months most directly influenced by irrigation water use. While applicable to both residential and commercial landscape installations, only the residential water savings are estimated here. Under the medium case scenario, this policy will be adopted by the ten largest counties in South Carolina. The high case scenario assumes that this policy is also adopted by each of the fifteen counties in the state’s Capacity Use Areas (three counties are in both groups). Under the medium case scenario, water savings for the ten largest counties are estimated to total 2.2 mgd in 2015 and 8.3 mgd in 2025. Water savings for the fifteen CUA counties are estimated to total 1.2 mgd in 2015 and 4.4 mgd in 2025. Accounting for the three overlapping counties, the high case savings total 2.6 mgd in 2015 and 9.8 mgd in 2025. Under the medium case, the additional electricity savings attributable to the energy embedded in water service are estimated to total 1.7 GWh in 2015 and 6.2 GWh in 2025. Under the high case, the additional electricity savings attributable to this embedded energy are estimated to total 2.0 GWh in 2015 and 7.4 GWh in 2025. Conservation Pricing of Water & Sewer Water management professionals have long recognized that the pricing of water is central to managing the demand for water (Chesnutt 1998). While the demand for water may be relatively inelastic in the short run, a utility’s pricing structure sends important signals to consumers that can influence discretionary uses of water and customers’ willingness to repair leaks and invest in water-efficient products and services. Several of South Carolina’s public water suppliers maintain declining block rate structures, where the unit price of water (or wastewater service) declines with increased levels of metered water consumption. (AWWA-Raftelis 2009) In an earlier era, such rates may have accurately reflected a trend that allowed rising demand to be served by abundant supplies at declining costs. Today, however, rising demand and increasing capital and operating costs associated with higher regulatory requirements have clearly placed the cost of both water and wastewater service on an upward trend. While the establishment of rate structures is necessarily a utility-specific exercise and beyond the scope of this report, we know that declining block rates work at cross purposes with efforts to encourage consumers to use water more efficiently. Conversely, uniform or increasing block rates can meet utility revenue requirements and maintain equity among consumers while complementing other water conservation programs. We encourage South Carolina’s utility managers to take a fresh look at traditional declining block rates and eliminate incentives for water consumption that are no longer economically justified.
47
For example, Florida Statutes, Sec 373.62, requires that new automatic sprinkler systems be installed and operated with “technology that inhibits or interrupts operation of the system during periods of sufficient moisture.” In addition to rain sensors, the statute allows for soil moisture sensors to fulfill this requirement, and directs the establishment of a uniform exemption process for systems so equipped from local day-of-the-week water use restrictions.
South Carolina's Energy Future, ACEEE
61
Electric Utility Clothes Washer Incentives Among the proven energy efficiency programs available to electric utilities in South Carolina, customer incentive programs for new and more efficient lighting and appliances are among the most widely deployed around the country. Indeed, under the American Recovery and Reinvestment Act, all states are encouraged to establish programs to incentivize the purchase of new Energy Star appliances. Looking beyond this short-term federal program, the utility programs for electricity savings presented in this report envision an ongoing program of customer incentives for energy-saving new products.
We assume that incentives for energy- and water-efficient clothes washers will be a significant part of the electric utility program offering, with 10% of customer incentives supporting new washer purchases. For purposes of evaluating the water saving policies open to the state, this is significant. Between 20 and 25% of indoor water use in most American households is attributable to washing clothes (Mayer 1999). New models of washers on the market today can cut water used for washing clothes in half. 7
Based on the levels of electric utility investments in efficiency programs, which are nearly the same in both the medium case and the high case, we estimate the water savings that will result from clothwes washer incentives to reach 0.9 mgd in 2015 and 2.2 mgd in 2025. The electricity savings from these incentives, which are substantial, are included in the projected electric utility program savings described elsewhere in this report.
Costs and Benefits for Water Efficiency Policies
Each of the water efficiency policies for which quantified savings estimates have been prepared has been found to be cost effective. Key assumptions regarding costs, savings, and other program metrics are listed in Appendix C. The policies described above can be seen to achieve the following savings over the period of analysis.
Table 16. Summary of Water and Electricity Savings by Water Efficiency Policy
Medium Case High Case
Annual Water Savings by Policy (mgd) 2015 2025 2015 2025
Statewide Plumbing Efficiency Standards
2.1
8.0 2.1 8.0
Inefficient Plumbing Replacement 2.1 5.0 2.9 7.4
Utility System Water Loss Reduction 0.8 8.8 1.3 14.5
Water Efficient Landscape Irrigation 2.2 8.3 2.6 9.8
1 Water Conserving Rate Structures -- -- -- --
2 Electric Utility Clothes Washer Incentives 0.9 2.2 0.9 2.2
Total Estimated Water Savings (mgd)
8.1
32.3 9.8 41.9
Annual Electricity Savings (GWh)
Statewide Plumbing Efficiency Standards
12.9
54.1 12.9 54.1
2 Electric Utility Clothes Washer Incentives -- -- -- --
Total Electricity Savings from Water (GWh) 21.2 84.9 22.8 93.2
Notes 1. Recommended, but potential water savings not quantified. 2. Clothes washer water savings shown here; clothes washer energy savings are included in Utility Program electricity savings. 3. Indoor water use reductions yield off-site electricity savings of 3239 KWh/mg; outdoor water use reductions yield off-site electricity savings of 2061 KWh/mg.
South Carolina's Energy Future, ACEEE
62
To put these savings in perspective, the water savings estimated under the High Case for 2025 (41.9 mgd) equates to 6.8% of the total water use reported by South Carolina’s public water suppliers in 2006.
Assessment of Demand Response Potential This section defines Demand Response (DR), assesses current DR activities in South Carolina, uses benchmark information to assess DR potential in South Carolina, and concludes with policy recommendations that could foster DR contributing appropriately to the resource mix in South Carolina that can be used to meet electricity needs. Potential load reductions from DR are estimated for set of DR programs that represent the technologies and customer types that span a range of DR efforts (see Section 3). Defining Demand Response DR focuses on shifting energy from peak periods to off-peak periods and clipping peak demands on days with the highest demands. Within the set of demand-side options, DR focuses on clipping peak demands that may allow for the deferral of new capacity additions and enhance operating reserves to mitigate system emergencies. Energy efficiency focuses on reducing overall energy consumption with attendant permanent reductions in peak demand growth. Taken together, these two demand-side options can provide opportunities to more efficiently manage growth, provide customers with increased options to manage energy costs and develop least cost resource plans. DR resources are usually grouped into two types: 1) load-curtailment activities where utilities can “call” for load reductions; and 2) price-based incentives which use time-differentiated and/or dispatchable rates to shift load away from peak demand periods and reduce overall peak-period consumption. Interest in both types of DR activities has increased across the country as fuel input prices have increased, environmental compliance costs have become more uncertain, and the substantial investment in overall electric infrastructure needed to support new generation resources. The summary of DR potential presented in Table 17 focuses on load-curtailment and backup generation and does not include savings resulting from price-based incentives. Residential load-curtailment typically involves direct load control (DLC) of air conditioners—although this can also cover appliances—as well as temperature offsets, which increase thermostat settings for a certain period of time. Commercial and industrial applications of DR focus on load control of space conditioning equipment, however this depends on customer size: self-activated load reductions are usually more prudent for larger customers. Backup generation for commercial and industrial applications involves generators with start-up equipment that allows them to come online with short notice from utilities, relieving the additional demand on the system during peak hours. Rationale for Investigating Demand Response DR alternatives can be implemented to help ensure that a utility continues to provide reliable electric service at the least cost to its customers. Specific drivers often cited for DR include the following:
Ensure reliability—DR provides load reductions on the customer side of the meter that can help alleviate system emergencies and help create a robust resource portfolio of both demand-side and supply-side resources that meet reliability objectives.
Reduce supply costs—DR may be less expensive per megawatt than other resource alternatives.
Manage operational and economic risk through portfolio diversification—DR capability is a resource that can diversify peaking capabilities. This creates an alternative means of meeting peak demand and reduces the risk that utilities will suffer financially due to transmission constraints, fuel supply disruptions, or increases in fuel costs.
South Carolina's Energy Future, ACEEE
63
Provide customers with greater control over electric bills –DR programs would allow customers to save on their electric bills by shifting their consumption away from higher cost hours and/or responding to DR events.
Address legislative/regulatory interest in DR—Recent legislation, South Carolina House Bill 2200, calls for peak load reduction, smart meter deployment, and the availability of time-based rates for all customers.
Demand Response in South Carolina—Background A sound strategy for development of DR resources requires an understanding of South Carolina’s demand and resource supply situation, including projected system demand, peak-day load shapes, and existing and planned generation resources and costs. South Carolina utilities service over 2.4 million customers, can provide a system peak capacity of over 25,000 MW, and will generate over 81.95 million megawatt hours of electricity in 2009. Electricity demand in South Carolina has fluctuated little in recent years, with total consumption growing only slightly over the past decade. Total retail sales in 2007 were only 7.7% greater than that in 2002; 81.95 billion kWh up from 76.1 billion kWh. This is an aggregate figure for all sectors, including industrial, commercial and residential. South Carolina has been, and likely will continue to be, a net exporter of energy. In 2007, in-state generation provided all of South Carolina’s total retail sales, plus a surplus of approximately 16%, or roughly 14.1 billion kWh (ACEEE South Carolina Reference Case). Role of Demand Response in South Carolina’s Resource Portfolio The DR capabilities deployed by South Carolina utilities can become part of a long-term resource strategy that also includes resources such as traditional generation resources, power purchase agreements, options for fuel and capacity, and energy efficiency and load management programs. Objectives include meeting future loads at lower cost, diversifying the portfolio to reduce operational and regulatory risk, and allow South Carolina customers to better manage their electricity costs. The 2005 Energy Policy Act provisions for Demand Response and Smart Metering has lead to a number of states and utilities piloting and implementing a Smart Grid, or sometimes referred to as Advanced Metering Infrastructure (AMI). Smart Grid is a transformed electricity transmission and distribution network or "grid" that uses robust two-way communications, advanced sensors, and distributed computers to improve the efficiency, reliability and safety of power delivery and use. For energy delivery, the Smart Grid has the ability to sense when a part of its system is overloaded and reroute power to reduce that overload and prevent a potential outage situation. Principal benefits of Smart Grid technologies for DR include increased participation rates and lower costs. The growth of renewable energy supply (and plans for increased growth) can also increase the importance of DR in the portfolio mix. For example, sudden renewable energy supply reductions (e.g., from an abrupt loss in wind) may be mitigated quickly with DR. Assessment of Demand Response Potential in South Carolina Table 17 shows the resulting load shed reductions possible for South Carolina, by sector, for years 2015, 2020, and 2025. Load impacts grow rapidly through 2018 as program implementation takes hold. After 2018, the program impacts increase at the same rate as the forecasted growth in peak demand. The high scenario DR load potential reduction is within a range of reasonable outcomes in that it has an eleven year rollout period (beginning of 2010 through the end of 2020), providing a relatively long
South Carolina's Energy Future, ACEEE
64
period of time to ramp up and integrate new technologies that support DR. A value nearer to the high scenario than the medium scenario would make a good MW target for a set of DR activities. The high scenario results show a reduction in peak demand of 1,058 MW is possible by 2015 (6.2% of peak demand); 2,212 MW is possible by 2020 (12.3% of peak demand); and 2,298 MW is possible by 2025 (12.1% of peak demand). The more conservative medium scenario results show a reduction in peak demand of 686 MW is possible by 2015 (4.0% of peak demand); 1,435 MW is possible by 2020 (8.0% of peak demand); and 1,493 MW is possible by 2025 (7.9% of peak demand).
Table 17. Summary of Potential DR in South Carolina, By Sector, for Years 2015, 2020, and 2025a
Figure 17 shows the resulting load shed reductions possible for South Carolina, by sector, from year 2010, when load reductions are expected to begin, through year 2025.
Figure 17. Potential DR Load Reductions in South Carolina by Sector (Medium Scenario)
These estimates reflect the level of effort put forth and utilities are recommended to set targets for the high scenarios. These estimates are based on assumptions regarding growth rates, participation rates, and program design. These factors are discussed in Chapter 3. In developing these DR potential estimates, the integration of DR with select energy efficiency activities was considered to help ensure that load impacts were not double counted. The estimated load reduction per program participant is conservatively estimated to account for increased energy efficiency in the future.
South Carolina's Energy Future, ACEEE
65
Recommendations This assessment indicates that the system peak demand can be reduced by approximately 8.0% or 1,435 MW in 2020 in the medium case. In the high case, the reduction can be as high as 12.3% or 2,212 MW. The high case is considered to be within a reasonable range if aggressive action begins by the end of 2009, providing for a twelve-year rollout of the DR efforts (at the beginning of 2010 through the end of 2020). Key recommendations include:
1. Structure appropriate financial incentives for the South Carolina’s utilities either for programs administered directly by the utilities or for outsourcing DR efforts to aggregators. The basic premise is that a utility’s least-cost plan should also be its most profitable plan.
2. Integrate DR programs with the delivery of EE programs. For example, Duke Energy’s
“Residential Power Manager Program” that allows utility control of air conditioning loads is also used as a gateway for Duke Energy to offer free, in-home energy audits to help inform home owners of additional energy saving opportunities. Many gains in delivery efficiency are possible by combining and cross-marketing EE and DR programs.
3. Implement programs focused on achieving firm capacity reductions as this provides the
highest value demand response. This is accomplished through establishing appropriate customer expectations and by conducting program tests for each DR program in each year. These tests should be used to establish expected DR program impacts when called and to work with customers each year to ensure that they can achieve the load reductions expected at each site.
4. Plan for at-scale programs through the rollout period. While pilot programs can be important
in determining the appropriate design of cost-effective DR programs, there are established DR programs and technologies. Key programs that be considered for roll-out and can be designed within a 12-month period include:
a. Residential and small business AC direct load control using switches or thermostats
(or giving customers their choice of technology). This potential for benefit is high with South Carolina having above average central AC saturation.
b. Auto-DR programs providing direct load curtailment for larger commercial and industrial customers.
c. Callable interruptible programs with manual response to an event notification for larger commercial and industrial customers where auto-DR approaches are not acceptable to the customer or technically not feasible.
d. Aggressive enrollment of back-up generators in DR programs.
5. Pricing should form the cornerstone of an efficient electric market. South Carolina has a history of time-differentiated rates. Increasing pricing programs (and participation) including Daily TOU pricing and day-ahead hourly pricing will increase overall market efficiency by causing shifts in energy use from on-peak to off-peak hours every day of the year. However, this does not diminish the need to have dispatchable DR programs that can address those few days that represent extreme events where the highest demands occur. These events are best addressed by dispatchable DR programs.
6. Include customer education in DR efforts. There is some perceived lack of customer
awareness of programs and incentives. In addition, new programs will need marketing efforts as well as technical assistance to help customers identify where load reductions can be obtained and the technologies/actions needed to achieve these load reductions. Also, high-level education on the volatility of electricity markets helps customers understand why utilities and other entities are promoting DR and the customers’ role in increasing demand response to help match up with supply-side resources to achieve lower cost resource solutions when markets become tight
South Carolina's Energy Future, ACEEE
66
7. Increase clarity and coordination between the Federal and State agencies and programs. While states have primary jurisdiction over retail demand response, the Federal Energy Regulatory Commission (FERC) has jurisdiction over demand response in wholesale markets. Greater clarity and coordination between the Federal and State programs is needed.
Macroeconomic Impacts: Impact of Policies and Programs on South Carolina's Economy, Employment, and Energy Prices Up to this point in the analysis we have examined the potential costs and benefits of implementing policies that might stimulate greater levels of energy efficiency in South Carolina. The evidence suggests that smart policies and programs can drive more productive investments in energy-efficient technologies, and they can do so in ways that reduce the state’s total energy bill. But the question remains, what does this mean for the state economy? Do the higher gains in energy productivity—that is, do the increased levels of efficiency investment with their concomitant reduction in the need for conventional energy resources—create a net economic boost for South Carolina? Or, does the diversion of revenues away from energy-related industries negatively impact the economy? In this chapter, we explore those issues and we present the analytical results of an economic model used to evaluate the impact of efficiency investments on jobs, income, and the overall size of the economy. A recent meta-review of some past 48 energy policy studies done within the United States suggests that if investments in more efficient technologies are cost-effective, the impacts on the economy should be small but net positive (Laitner and McKinney 2008). As shown elsewhere in the report, it turns out that from a total resource cost perspective, the benefits (i.e., the energy and water bill savings) outweigh both the policy costs and investments by a factor of two. In other words, the water and energy efficiency policy recommendations highlighted in the policy scenario result in a substantial savings for households and businesses compared to the costs of implementing the policies. As we also discuss below, this consumer energy bill savings can drive a significant increase in the number of net new jobs within South Carolina.48 In fact, continued investments in energy efficiency resources would maintain the energy resource benefits for many years into the future, well beyond the period of analysis examined in this report.49 The state therefore has the opportunity to transition its economy to a more sustainable pattern of energy production and consumption in ways that benefit consumers and businesses. The results in Table 18 below detail the benefits that will accrue to the state of South Carolina when policies encourage a more efficient use of energy resources. Further discussion in this section will provide an overview of the DEEPER model and more detailed background information for the state of South Carolina.
Table 18. Economic Impact of Energy and Water Efficiency Investments in South Carolina
Macroeconomic Impacts 2010 2015 2020 2025
Jobs (Actual) 13,597 18,891 19,625 21,887
Wages (Million $2007) $402 $533 $515 $408
GSP (Million $2007) $767 $985 $716 $99
48
As we use the term here, the word “consumer” refers to any one who buys and uses energy. Thus, we include both households and businesses as among the consumers who benefit from greater investments in energy efficiency. 49
As we note elsewhere, the policy analysis ends in the year 2025. Yet, many of the investments we describe have a technology of perhaps 15 years. This means that investments made in 2025 would continue to pay for themselves through perhaps the year 2040 and beyond; and none of those ongoing energy or water bill savings is reflected in the analysis described in this chapter.
South Carolina's Energy Future, ACEEE
67
Methodology The macroeconomic evaluation that we report in this chapter is undertaken in three separate steps. First, we calibrate ACEEE’s economic assessment model called DEEPER (or the Dynamic Energy Efficiency Policy Evaluation Routine) to reflect the economic profile of the South Carolina economy (IMPLAN 2009). This is done for the period 2007 (the base year of the model) through 2025 (the last year of this particular analysis). In this respect, we incorporate the anticipated investment and spending patterns that are suggested by the standard forecast modeling assumptions. These patterns range from typical spending by businesses and households in the analytical period to the anticipated construction of new electric power plants and other energy-related spending that might also be highlighted in the forecast. Second, we transform the set of key efficiency scenario results from the policy analysis into the direct inputs which are needed for the economic model. The resulting inputs include such parameters as:
The level of annual policy and/or program spending that drives the key policy scenario investments;
The capital and operating costs associated with more energy-efficient technologies; The energy bill savings that result from the various energy efficiency policies described in the
main body of the report; and Finally, a set of calibration or diagnostic model runs to check both the logic and the internal
consistency of the modeling results. So that we can more fully characterize the analysis that was completed for this report, we next provide a simplified working example of how the modeling is done. We first describe the financial assumptions that underpin the analysis. We then highlight the analytical technique by showing the kinds of calculations that are used and then summarize the overall results in terms of net job impacts. Following this example, we then review the net impacts of the various policies as evaluated in our DEEPER model. Illustrating the Methodology: South Carolina Jobs From Efficiency Gains To illustrate how a job impact analysis might be done, we will use the simplified example of installing one hundred million dollars of efficiency improvements within large office buildings throughout South Carolina. Office buildings—traditionally large users of energy due to heating and air-conditioning loads, significant use of lighting and electronic office equipment, and the large numbers of persons employed and served—provide substantial opportunities for energy-saving investments. The results of this example are summarized in Table 19.
South Carolina's Energy Future, ACEEE
68
Table 19. Illustrative Example: Job Impacts from Commercial Building Efficiency Improvements
Expenditure Category Amount
(Million $) Employment Coefficient
Job Impact
Installing Efficiency Improvements in Year One $100 12 1,200
Diverting Expenditures to Fund Efficiency Improvements -$100 10 -1,000
Energy Bill Savings in Years One through 15 $200 10 2,000
Lower Utility Revenues in Years One through 15 -$200 4 -800
Net 15-Year Change $0.0 1,400
Note: The employment multipliers are adapted from the appropriate sector multipliers within the South Carolina version of the DEEPER model. The benefit-cost ratio is assumed to be 2.0. The column marked “job impact” is the result of multiplying the row change in expenditure by the row multiplier. The sum of these products yields a working estimate of total net job-years over the 15-year time horizon. To find the average annual net jobs in this simplified analysis we would divide the total job-years by 15 years which, of course, gives us an estimated net gain of 93 jobs per year for each of the 15 years.
The assumption used in this example is that the investment has a positive benefit-cost ratio of 2.0. In other words, the assumption is that for every dollar of cost used to increase a building’s overall energy efficiency, the upgrades might be expected to return a total of two dollars in reduced electricity and natural gas costs over the useful life of the technologies. This ratio is similar to those cited elsewhere in this report. At the same time, if we anticipate that the efficiency changes will have an expected life of roughly 15 years, then we can establish a 15-year period of analysis. In this illustration, we further assume that the efficiency upgrades take place in the first year of the analysis, while the electricity bill savings occur in years one through 15. The analysis assumes that we are interested in the net effect of employment and other economic changes. This means we must first examine all changes in household and business expenditures—both positive and negative—that result from a movement toward greater levels of energy efficiency. Although more detailed and complicated within the DEEPER model, for this heuristic exercise we then multiply each change in expenditures by the appropriate sector employment coefficient as they are adapted from the IMPLAN (2009) data. The sum of these products will then yield the net result for which we are looking. In our example above, there are four separate changes in expenditures, each with their separate impact. As Table 19 indicates, the net impact of the scenario suggests a cumulative gain of 1,400 jobs in each of the 15-year period of analysis. This translates into an average net increase of 93 jobs each year for 15 years. In other words, the $100 million efficiency investment made in South Carolina’s office buildings is projected to sustain an average of 100 jobs each year over a 15-year period compared to a “business-as-usual” scenario. The economic assessment of the alternative energy scenarios was carried out in a very similar manner as the example described above. That is, the changes in energy expenditures brought about by investments in energy efficiency and renewable technologies were matched with their appropriate employment multipliers. There are several modifications to this technique, however. First, it was assumed that only 67% of both the water and energy bill savings are spent within South Carolina. We base this ratio on the consumer spending patterns reflected in the IMPLAN (2009) dataset as it describes local purchase patterns that typically now occur in the state. We also anticipate that 90% of the efficiency installations are likely (or could be) carried out by local contractors and dealers. If the set of policies encourages greater local spending so that the in-state
South Carolina's Energy Future, ACEEE
69
consumer share was increased to 90%, for example, the net jobs might grow another 25% compared to our standard scenario exercise. At the same time, the scenario also assumes South Carolina provides only 47% of the manufactured products consumed within the state. But again, a concerted effort to build manufacturing capacity for the set of clean energy technologies would increase the benefits from developing a broader in-state energy efficiency and renewable energy manufacturing capability. Second, an adjustment in the employment impacts was made to account for assumed future changes in labor productivity. As outlined in the Bureau of Labor Statistics Outlook 2008–2018, productivity rates are expected to vary widely among sectors (BLS 2009). For instance, drawing from the BLS data we would expect that electric utilities might increase labor productivity by 2.8% annually while the economy as a whole might increase productivity by 1.9% per year. This means, for example, that we might expect a one million dollar expenditure for utility services in the year 2025 would support only 61% of the jobs that the same expenditure would have supported in 2007 (the base year of the model), while other sectors of the economy would support only 71% of the jobs as in 2007. Third, for purposes of estimating energy bill savings, it was assumed that all energy prices within South Carolina would follow the same growth rate as those published by the Energy Information Administration in its Annual Energy Outlook (EIA 2009d). Fourth, it was assumed that the efficiency investments’ upgrades are financed by bank loans that carry an average 7% interest rate over a five-year period. To limit the scope of the analysis, however, no parameters were established to account for any changes in interest rates as less capital-intensive technologies (i.e., efficiency investments) are substituted for conventional supply strategies, or in labor participation rates—all of which might affect overall spending patterns. Fortunately, however, it is unlikely that these sensitivities would greatly impact the overall outcome of this analysis. While the higher cost premiums associated with the energy efficiency investments might be expected to drive up the level of borrowing (in the short term), and therefore interest rates, this upward pressure would be offset to some degree by the investment avoided in new power plant capacity, exploratory well drilling, and new pipelines. Similarly, while an increase in demand for labor would tend to increase the overall level of wages (and thus lessen economic activity), the job benefits are small compared to the current level of unemployment or underemployment in the state. Hence the effect would be negligible. Fifth, as described in the previous chapters for the buildings, industrial, and transportation end-use sectors it was assumed that a program and marketing expenditure would be required to promote market penetration of the efficiency improvements. Since these vary significantly by policy bundle we don’t summarize them here but payment for these policy and program expenditures were treated as if new taxes were levied on the state commensurate with the level of energy demands within the state. Hence, the positive program spending impacts are offset by reduced revenues elsewhere in the economy. Sixth, it should be noted that the full effects of the efficiency investments are not accounted for since the savings beyond 2025 are not incorporated in the analysis. Nor does the analysis include other benefits and costs that can stem from the efficiency investments. Non-energy benefits can include increased worker productivity, comfort and safety, and water savings, while non-energy costs can include aesthetic issues associated with compact fluorescent lamps and increased maintenance costs due to a lack of familiarity with new energy efficiency equipment (NAPEE 2007b, 3–8). Productivity benefits, for example, can be substantial, especially in the industrial sector. Industrial investments that increase energy efficiency often result in achieving other economic goals such as improved product quality, lower capital and operating costs, increased employee productivity, or capturing specialized product markets (see, for example, Worrell et al. 2003). To the extent these “co-benefits” exceed any non-energy costs, the economic impacts of an energy efficiency initiative in South Carolina would be more favorable than those reported here. Finally, although we show in Table 19 above just how the calculations would look from an employment
South Carolina's Energy Future, ACEEE
70
perspective, we don’t show the same kind of data or assumptions for either income or for impacts on the Gross State Product (GSP, or the sum of value-added contributions to the South Carolina state economy). Nonetheless, the approach is very similar to that described for net job impacts. Impacts of Recommended Energy Efficiency Policies For each year in the analytical period, the given change in a sector spending pattern (relative to the reference scenario) was matched to the appropriate sector impact coefficients. Two points are worth special note: first, it was important to match the right change in spending to the right sector of the South Carolina economy; and second, these coefficients change over time. For example, as previously suggested, labor productivity changes mean that there may be fewer jobs supported by a one million dollar expenditure today compared to that same level of spending in 2025. Both the negative and positive impacts were summed to generate the estimated net results shown in the series of tables that follow. Presented here are two basic sets of macroeconomic impacts for the benchmark years of 2010, 2015, 2020, and 2025. These include the financial flows that result from the policies described in the previous chapters. They also include the net jobs, income, and GSP impacts that result from the changed investment and spending patterns. Table 20 presents the changes in consumer expenditures that result from these policies. While the first row in the table presents the full cost of the energy efficiency policies, programs and investments, the utility customers will likely borrow all or at least a portion of the money to pay for these investments. Thus, “annual consumer outlays,” estimated at about $26 million in 2010, rise to nearly $790 million in 2025. These outlays include actual “out-of-pocket” spending for programs and investments, along with money borrowed to underwrite the larger technology investments. The annual energy and water bill savings reported here are a function of reduced energy purchases from the many South Carolina electric, natural gas, and water utilities within the state. As we further highlight in the table that follows, the annual energy bill savings begins with a modest first year benefit of $13 million. As more investments are directed toward the purchase of more energy- and water-efficient technologies, the annual consumer savings rise to about $2.1 billion by 2025.
Table 20. Financial Impacts from Energy Efficiency Policy Medium Scenario
(Millions of 2007 Dollars) 2010 2015 2020 2025
Annual Consumer Outlays $26 $196 $453 $788
Annual Energy-Water Bill Savings $13 $205 $809 $2,072
Annual Net Consumer Savings -$13 $9 $355 $1,284
Cumulative Net Energy-Water Bill Savings -$13 -$84 $834 $5,112
‘Annual’ refers to the total that is reported in the benchmark year while ‘Cumulative’ is the total from previous years beginning in 2010 through the benchmark year.
Annual consumer outlays include administrative costs to run programs, incentives provided to consumers, investments in efficiency devices and interest paid on loans needed to underwrite the needed efficiency investments.
Annual energy-water bill savings is the reduced expenditures for water and energy services that benefit both households and businesses within a given year. The net savings is the difference between savings and outlays.
Readers should note from Table 20 that in the early years and especially as the policies ramp up quickly to stimulate a greater level of efficiency improvements, the consumer outlays outweigh the energy bill savings. In 2010, the net cumulative savings are negative at -$13 million and remain
South Carolina's Energy Future, ACEEE
71
negative through 2015. By 2016, however (not shown here), the net cumulative savings turn positive and mount steadily through the year 2025 by when they reach an estimated $5.1 billion net cumulative savings for the state as a whole. At this point we then have the financial flows estimated as they are distributed across the end-use sectors described earlier in the report. The question then becomes what might be the impacts on the state economy as we’ve been able to evaluate them for a given year using the DEEPER model. The modeling then evaluates impact on jobs and wages sector-by-sector, and evaluates their contribution to South Carolina’s Gross State Product, which is a sum of the net gain in value-added contributions provided by the energy productivity gains throughout all sectors of the state economy. As with the previous table on financial impacts, for reader convenience, Table 21 repeats the net impacts shown earlier for the benchmark years 2010, 2015, 2020 and 2025.
Table 21. Economic Impact of Energy Efficiency Investments in South Carolina
Macroeconomic Impacts 2010 2015 2020 2025
Jobs (Actual) 13,597 18,891 19,625 21,887
Wages (Million $2007) $402 $533 $515 $408
GSP (Million $2007) $767 $985 $716 $99
Given both the financial flows and the modeling framework, the analysis suggests a net contribution to the state’s employment base as measured by full-time jobs equivalent. In the year 2010 we see an immediate net increase of 13,597 jobs which increases to a significantly larger total of 21,887 jobs by 2025. The early years of the policy scenarios show small net cost to the economy. Yet we continue to see a net increase in jobs. How is this possible? In South Carolina, the electric power and the natural gas service sectors directly and indirectly employ about 3.3 and 3.9 jobs, respectively, for every $1 million of spending. But, sectors vital to energy efficiency improvements like manufacturing and construction and utilize 7.3 and 11.9 jobs, respectively, per $1 million of revenue. Once job gains and losses are netted out in each year, the analysis suggests that, by diverting expenditures away from non-labor intensive energy sectors, the cost-effective energy policies can positively impact the larger South Carolina economy—even in the early years, but especially in the later years of the analysis as the energy savings continue to mount. To highlight the results of this analysis in a little more detail, Figure 18 provides year-by-year impacts on net jobs within South Carolina.
South Carolina's Energy Future, ACEEE
72
Figure 18. Net Employment Impacts for South Carolina (2010–2025)
0
5,000
10,000
15,000
20,000
25,000
2010
2012
2014
2016
2018
2020
2022
2024
Year
Net
Jo
b Im
pac
ts (
Act
ual
)
Figure 19 highlights the anticipated net gain to the state’s wage and salary compensation and Gross State Product, both measured in millions of 2007 dollars.
South Carolina's Energy Future, ACEEE
73
Figure 19. Wages and Gross State Product Impacts for South Carolina
0
200
400
600
800
1000
1200
2010
2015
2020
2025
Mill
ion
s o
f 2
00
7 D
olla
rs
Wages and Salaries Gross State Product
The end result of this policy analysis, then, suggests that an early program stimulus which drives a higher level of efficiency investments can actually increase the robustness of the South Carolina economy, creating an average of 16,000 net new jobs from the 2010 through 2015, and rising to an average of nearly 19,000 net new jobs over the last decade of the analysis. This is roughly equivalent to the employment that would be directly and indirectly supported by the construction and operation of 175 small manufacturing plants within South Carolina. As indicated by Figure 19, these investments also increase both wages and gross state product throughout South Carolina.50 In short, the more efficient use of energy and water resources provides a cost-effective redirection of spending away from less labor-intensive sectors into those sectors that provide a greater number of jobs within South Carolina. Similarly, cost-effective energy productivity gains also redirect spending away from sectors that provide a smaller rate of value-added into those sectors with slightly higher levels of value-added returns per dollar of revenue. The extent to which these benefits are realized will depend on the willingness of business and policy leaders to implement the recommendations that are at the heart of this report and found earlier in this assessment. Indeed, to the extent that business and policy leaders go beyond the recommendations described here, the evidence further suggests an even greater net positive impact on the South Carolina economy.51
50 Readers will observe in the jobs chart a modest valley although still a net positive employment impact in the years 2017 through 2024. The reason for this is that the reference case assumes a significant construction program for new power plants in roughly that same period of time. Avoiding that utility-related construction activity in the policy scenario temporarily diminishes the net employment gains in those years. And because electric utilities are so capital-intensive relative to other sectors of the economy, the avoided construction also has a pronounced impact on wages and Gross State Product. Note, however, that all three sets of economic impacts remain strongly net positive for South Carolina. 51 As a further thought experiment, we ran the DEEPER model to test the potential impact of both greater in-state spending that might result from the set of policies characterized in this analysis, and from the inclusion of non-energy benefits that are likely
South Carolina's Energy Future, ACEEE
74
Emissions Impacts from Policy Scenarios Meeting the demand for electricity through efficiency resources reduces electricity generation; thus, any environmental impacts that would result can be avoided. Efficiency represents a cost-effective strategy to reduce global warming emissions. One caveat of the avoided emissions from efficiency that readers should note is that South Carolina exports about 22% of its electricity and a recent power purchasing agreement struck between Duke Energy Carolinas and CEPCI means that South Carolina's cooperative utilities will be importing some of their power from North Carolina. Therefore, not all of the electricity avoided through efficiency is attributable to power plants in South Carolina. The policies we suggest would reduce carbon dioxide (CO2) emissions in the Southeastern Electric Reliability Council (SERC) by over 2 million tons in 2015 and almost 13 million tons in 2025, or 0.4% and 2.1% of total emissions in the region, respectively (see Figure 20). Through 2025, energy efficiency can reduce CO2 emissions cumulatively by almost 78 million tons. In 2007, South Carolina accounted for 46 million tons of CO2 emission, or 8% of regional emissions (EIA 2009a). Because electricity savings from efficiency policies in South Carolina will have an impact across the SERC, we therefore estimate these CO2 reductions from energy efficiency programs and policies relative to the entire region. See Appendix B.2 for our detailed methodology.
Figure 20. SERC CO2 Emissions in Reference and Medium Case Policy Scenarios
300.00
350.00
400.00
450.00
500.00
550.00
600.00
650.00
2008
2010
2012
2014
2016
2018
2020
2022
2024
Year
CO
2 E
mis
sio
ns
(M
illio
n T
on
s)
SERC Emissions in the Reference Case
SERC Emissions Under Medium Case Policy Scenario
to follow from this policy scenario. Following an analysis by Laitner and Lung (2009), we assumed a set of non-energy benefits that might be about 40% of the electricity bill savings throughout the economy. And we increased the in-state consumer spending from 67% to 80%. With those two assumptions added into the DEPER Model, the net employment impacts rose from 23,000 jobs in the year 2025 to more than 30,000 jobs in that same year.
South Carolina's Energy Future, ACEEE
75
Efficiency Impacts on Power Plant Water Use As noted earlier, thermoelectric power plants dominate the electricity generation mix in South Carolina. Cooling requirements for such plants are determined by heat input and hours of operation. The electricity savings identified in this report are of sufficient magnitude to support a first-order estimate of their impacts on both consumptive and non-consumptive water use for electric power generation. Operating hours will not be reduced at all power plants as a result of energy efficiency measures. The physical and economic characteristics of base load plants necessitate their operation around the clock to the maximum extent possible, subject to annual or seasonal maintenance requirements. All nuclear power plants and many large coal-fired power plants are operated as baseload plants. Opportunities for reduced hours of operation, and thus reduced water consumption, occur at “load-following” plants, those facilities where production is ramped up or down in concert with the daily ebb and flow of electricity demand. Most natural gas plants and some coal plants are operated as load-following plants. Some of these natural gas plants are powered by simple combustion turbines without requirements for cooling water. Others operate as combined cycle plants with the turbine exhaust being harnessed to a steam cycle to produce additional electricity. Thus, the primary effect on cooling water requirements will be seen at combined-cycle natural gas plants and coal-fired plants being operated in the load-following mode. Based on the patterns of operation shown by South Carolina’s electric generating fleet in 2005, the following plants can be considered the major load-following thermoelectric plants in the state.
South Carolina's Energy Future, ACEEE
76
Table 22. Principal Load-Following Thermal Plants in South Carolina (2005)
Plant name Plant
Operator Name
County No. of
Generators
Plant Primary
Fuel Category
Plant Capacity Factor
Plant Nameplate Capacity
(MW)
Plant Annual Net Generation
(MWh)
River Basin
Broad River Energy Center
Calpine Cherokee 5 GAS 0.0763 985.0 658,015.0 Broad
W S Lee Duke Carolinas LLC Anderson 8 COAL 0.3043 542.3 1,445,536.0 Saluda R.
Source: EPA (2007a)
South Carolina's Energy Future, ACEEE
77
The electricity savings from all policies presented in this report are summarized here in Table 23. Demand response programs are not listed, as their principal benefit is the reduction of peak demand. Some electricity savings are likely, but are not quantified here.
Table 23. Summary of Electricity Savings (GWh)
Medium Case High Case 2015 2025 2015 2025 Energy Efficiency Resource Standard 2,729 16,994 4,071 23,119 Building Energy Codes 416 2,490 416 3,095 Water policies and programs 21 85 23 93 Total (GWh) 3,166 19,569 4,510 26,307 Based on these electricity savings, we estimate that the energy efficiency policies under the medium case will reduce water withdrawals by 300 million gallons per day (mgd) in 2015 and over 1,800 mgd in 2025. Withdrawals are likely to be larger than these averages in summer months and lower than these averages in winter months. Given the distribution of the principal load-following thermoelectric plants in the state, we estimate that the bulk of these savings (80%) can be distributed as shown in Table 24, and again note that these figures are likely to be higher in summer months. We have not assigned dollar values to these savings, but suggest that improvements in stream flows and attendant reliability of supplies for drinking water, fish and wildlife, and power generation itself are likely to result.
Table 24. Estimated Reductions in Thermo-Electric Cooling Water Use Resulting from Medium Case Energy Efficiency, by Basin (mgd)
Summary of Findings Energy Efficiency Resource Economic Potential ACEEE's assessment of the economic potential for energy efficiency resources in South Carolina through our meta review estimates a range of efficiency resources, from 16% to 20% of the electricity needs of the state in 2025. Energy efficiency resources are identified across all sectors: residential, commercial, and industrial (see Figure 21), which highlights the important fact that everyone in South Carolina can make contributions to improve energy efficiency across the state. Combined heat and power and demand response contribute further to the potential for both lower electricity consumption and reduced peak demand. Impacts of Energy Efficiency and Demand Response In our policy discussion above, ACEEE suggested a suite of energy efficiency and demand response policies and programs that would enable South Carolina to tap into its energy efficiency resource potential. The impacts of these policies and programs on electricity consumption in South Carolina over the period of this analysis are shown in the following section on Consumer Savings.
South Carolina's Energy Future, ACEEE
78
Consumer Savings The energy savings from these efficiency policies and programs can cut annual electricity and water bills for customers by a net $205 million in 2015. Net annual savings grow ten-fold to $2.1 billion in 2025. While these savings will require some public and customer investment, by 2025 net cumulative savings on electricity and water bills will reach $5.1 billion. Additionally, net savings per household will reach $5 by 2015, but by 2025 savings increase enormously to $380 per household. These savings are the results of two effects. First, participants in energy efficiency programs will install efficiency measures, such as more efficiency appliances or heating equipment, therefore lowering their electricity consumption and, consequently, their electric bills. In addition, because of volatility in energy prices, efficiency strategies have the added benefit of improving the balance of demand and supply in energy markets, thereby stabilizing regional electricity prices for the future. The combined effects of efficiency and demand response on overall summer peak demand are shown in Figures 21 and 22.
Figure 21. Estimated Reductions in Electricity Use in South Carolina through Energy Efficiency — Medium Case
60,000
65,000
70,000
75,000
80,000
85,000
90,000
95,000
100,000
2009
2011
2013
2015
2017
2019
2021
2023
2025
Year
Ele
ctri
city
Co
nsu
mp
tio
n (
GW
h)
Adjusted Forecast Proven Utility Programs
Rural and Agricultural Initiative Manufacturer Initiative
Manufactured Homes Initiative Low-Income Weatherization
Table 25. Summary of Peak Demand Reduction in South Carolina
2015 2025 % Reduction
Energy Efficiency Peak Reductions 600 4,604 24%
Demand Response Peak Reductions 686 1,493 8%
Total Peak Reductions 1,286 6,097 32%
% Reduction (total relative to forecast) 8% 32%
South Carolina's Energy Future, ACEEE
79
Figure 22. Estimated Reductions in Peak Demand through Energy Efficiency and Demand Response
(2025 Peak Reduction = 6,097 MW or 32%)
-
4,000
8,000
12,000
16,000
20,000
24,000
2009
2011
2013
2015
2017
2019
2021
2023
2025
Pea
k D
eman
d (
MW
)
Adjusted Peak Load
Demand Response
Efficiency24%
8%
Macroeconomic Impacts Investments in efficiency policies and programs can also help create new, high-quality "green-collar" jobs in South Carolina while increasing both wages and Gross State Product. Our analysis shows that energy efficiency investments can create almost 22,000 new jobs in South Carolina by 2025 (see Table 26) including well-paying trade and professional jobs needed to design, install, and operate energy efficiency measures. These new jobs, including both direct and indirect employment effects, would be equivalent to 175 new manufacturing facilities relocating to South Carolina, but without the public costs for infrastructure or the environmental impacts of new plants.
Table 26. Economic Impact of Energy Efficiency Investments in South Carolina
Macroeconomic Impacts 2010 2015 2020 2025
Jobs (Actual) 13,597 18,891 19,625 21,887
Wages (Million $2007) $402 $533 $515 $408
GSP (Million $2007) $767 $985 $716 $99
Discussion and Recommendations ACEEE offers this report to the State of South Carolina and all its citizens to help inform its deliberations on energy and water efficiency decision-making. We have attempted to tailor our nationwide experiences to the specific needs and opportunities of the state, recognizing that what is
South Carolina's Energy Future, ACEEE
80
implemented with respect to programs and policies should be a decision of the citizens through their elected officials and internal political processes. In preparing this report, ACEEE has drawn upon three decades of work on energy efficiency policies and programs. Our policy recommendations are based upon our assessment of "best practices" through the years. We intend this report as a roadmap for further development of energy efficiency policies. We have attempted in many places to identify resources that are available for further development, and stand prepared to assist the state with additional technical and data support, information and referrals after the delivery of the report. Policymakers in the state need to decide what policies and program options they are committed to pursuing and determine appropriate mechanisms to engage them successfully. Potential Role of Key Policymakers In our recommendations, we have suggested who ACEEE sees as the best positioned to lead the implementation of our program and policy recommendations. In ACEEE’s prior research, we documented that many of these policies and programs can be successfully implemented by a number of different entities, and the choice is up to the state level policymakers.
The Governor—In a majority of the states ACEEE has worked with, the Governor has played a key role. This was true in both Florida and Virginia. In part, the Governor's most important role may be to use his or her position to raise awareness among the policy community and the public as to the role of energy efficiency in utility and economic policy opportunities.
Legislature—The legislature has already played a key role in setting South Carolina on its current energy efficiency-related path, and will continue to play a pivotal role because of its ability to both fund and direct energy policy for the state. The legislature should consider such steps as further strengthening energy building codes; adoption of state appliance and equipment efficiency standards; increasing the state's energy savings target (an EERS); and providing state funding for the well-established state and local government, manufacturing and low-income initiatives already in place.
State Agencies—Various agencies would play roles implementing certain provisions such as the expanded state and local facilities initiative and actual program implementation such as low income weatherization. The agencies can also play important supporting roles in the education and outreach effort that would be critical in engaging the state's consumers with the information needed for them to make informed energy investment decisions.
Local Governments—Local government entities are uniquely positioned to implement several important suggestions including implementation of building codes and programs for local government facilities (as is discussed in Elliott and Eldridge 2007).
State Educational System—With workforce identified as a key need, the state educational system would play a critical role in ensuring that a trained workforce is developed to fill the jobs that an expanded investment in energy efficiency would create.
Private Sector—The behavioral recommendation included here is currently being implemented by private sector entities across the country. Also, institutional energy efficiency for schools and public buildings in general are often the opportunity that ESCOs are interested in pursuing via energy efficiency performance contracting. Other private sectors players should be considered in order to better insure that private sector jobs are both created and sustained.
Not-for-Profit Sector—Many talented, not-for-profits exist in all states. Finding which ones are strongest in the energy efficiency marketplace would be a good way to better insure there is not duplication of resources where the resources are limited in the first place. In terms of the manufacturing sector’s needs, a not-for-profit like the South Carolina Manufacturing Extension Partnership is an excellent example of an able and experienced not-for-profit operating effectively in the state already.
South Carolina's Energy Future, ACEEE
81
Program and Policy Implementation For most of the policy and programs, ACEEE has made suggestions as to what entity should implement the policies and programs. In ACEEE's review of successful programs and policies, a number of different entities have successfully implemented the programs and polices in other states (York, Kushler and Witt 2008). Our suggestions for South Carolina are based on our assessment of what programs and policies are currently being implemented by existing entities, and the ability to leverage these ongoing efforts. For example, the South Carolina Manufacturing Extension Partnership Program (SCMEP), and universities are already delivering services for the manufacturing community, so building on those existing efforts allows expanded services to be delivered sooner. Similarly, the utilities have current relationships with their commercial and residential customers, so adding energy efficiency programs to the existing delivery channel appears the quickest way to ramp up efficiency programs to these markets. The state could implement an independent energy efficiency program administrator model, such as Vermont has done with Efficiency Vermont.52 However, the establishment of such an entity would require significant time to organize the entity and staff up to deliver the programs. Evaluation, Measurement, and Verification (EM&V) The implementation of energy efficiency policies and programs must include a mechanism that emphasizes transparency and ensures success. Funding of and participation in efficiency programs will only be guaranteed, however, if policymakers and consumers are cognizant of the benefits these programs are delivering, which, of course, also requires that these benefits be verified. An inherent element of any attempt to advance energy efficiency is an indigenous entity dedicated to the evaluation, measurement, and verification of efficiency programs. Whether such an entity is run by a regulatory body such as Public Service Commission or the Office of Regulatory Staff, or a non-governmental organization is ultimately up to the state. But the establishment of an independent organization to measure and verify the impacts of energy efficiency investments is crucial to the overall success of these policies and programs. Allocation of Benefits from Energy Efficiency Reducing total electricity consumption is an effect of energy efficiency that avails customers through lower electricity bills, but can be a bane for utilities as lower sales mean lower revenues. Naturally there is concern from IOU's and their shareholders that, over time, dwindling revenues could impede utilities' ability to provide energy services due to decreased earnings or financial margins. To counter this phenomenon, IOU's have expressed their interest in pursuing cost recovery in order to guarantee a return on their efficiency investments, which can be done through decoupling, performance-based incentives, or some other rate mechanism (EPA 2007b). ACEEE does not support one method over another, but it is vital that energy efficiency benefits be allocated fairly between ratepayers and shareholders alike. Nonetheless, it is also important that utilities earn profits equivalent to what they would under a supply-only scenario.
Conclusions South Carolina is at a turning point where it can either continue to depend on conventional energy and water resource technologies to meet its growing needs for power, or it can chose to slow—or even to reduce—future demand for electricity by investing in energy efficiency and demand response. As this assessment documents, there are plenty of cost-effective energy efficiency and demand response opportunities in the state. However, as this report also discusses, these opportunities will not be realized without changes to policies and programs. The state ranked 37th out of the 50 states in ACEEE’s 2009 state energy efficiency scorecard recently released and that score can be improved
52 For more information, visit www.efficiencyvermont.com/pages/.
significantly without harm to the economy—in fact with a positive outcome for jobs and economic growth. We suggest a wide array of energy efficiency and demand response policies and programs that have proven successful in other states, which can meet 123% of the increase in the South Carolina's electricity needs over the next 17 years and meet almost 200% of the increase in peak demand. These policies and programs can help meet rising demand at a lower cost than building new generation and transmission, while concomitantly creating close to 22,000 new, high-quality "green collar" jobs and saving South Carolinians a net cumulative $5.1 billion on their electricity and water bills by 2025. These policy and programs suggestions should not be viewed as prescriptive, but as the starting point for a dialog among stakeholders on how to realize the demand-side efficiency resources that are available in the state. ACEEE's suggestions are based on our review of existing opportunities and stakeholder discussions, and reflect proposals that we think are politically plausible. We do not, however, suggest that our efficiency policy suggestions will necessarily meet all of the state's future energy needs. Clearly there are other policies and programs that could be implemented to realize even more of the available energy efficiency resource. Most of the electric and water policies we suggest can also be augmented to realized even greater savings, which we analyzed in our more aggressive, high case policy scenario. Nonetheless, while energy efficiency is perhaps the only new energy resource available in the immediate future and can make a critical contribution in the longer term, the state will need additional resources to meet the remainder of the new load and replace older, less efficient power plants in the coming years. But energy efficiency can buy time for a robust discussion about what other resource choices—both conventional and alternative—the state will need in the future.
South Carolina's Energy Future, ACEEE
83
References [ACEEE] American Council for an Energy-Efficient Economy. 2008. "Energy Efficiency Resource Standard
(EERS) for Retail Electricity and Natural Gas Distributors." Washington, D.C.: American Council for an Energy-Efficient Economy.
____. 2009. ACEEE's State Energy Efficiency Policy Database—South Carolina.
www.aceee.org/energy/state/southcarolina/sc_index.htm. Washington, D.C.: American Council for an Energy-Efficient Economy.
Amann, J. and E. Mendelsohn. 2005. Comprehensive Commercial Retrofit Programs: A Review of Activity and
Opportunities. Washington, D.C.: American Council for an Energy-Efficient Economy. [AWWA] American Water Works Association. 2003. “Committee Report: Applying Worldwide Best Management
Practices in Water Loss Control.” Journal of the American Water Works Association. 95, 65-79, August. ____. 2009. Water Audits and Loss Control Programs, AWWA Manual M36. Denver, CO: American Water
Works Association. [AWWA-Raftelis] American Water Works Association and Rafetlis Financial Consultants, Inc. 2009. 2008 Water
and Wastewater Rate Survey. Denver, CO: American Water Works Association [BEA] Bureau of Economic Analysis. 2009. "Economic Slowdown Widespread Among States in 2008."
http://www.bea.gov/newsreleases/regional/gdp_state/gsp_newsrelease.htm. Washington, D.C.: United States Department of Commerce.
[BGE] Baltimore Gas & Electric. 2007. Letter from L.W. Harbaugh, BG&E Vice President, to T.J. Romine,
Executive Secretary Public Service Commission of Maryland. "Supplement 405 to P.S.C. Md E-6: Rider 15- Demand Response Service; Rider 24—Load Response Program. October 26.
Birr, David [Synchronous Energy Solutions]. 2008. Personal communications to Neal Elliott, September. Lake
Barrington, IL. [BLS] Bureau of Labor Statistics. 2009. "Unemployment Rates for States." http://www.bls.gov/web/laumstrk.htm.
Washington D.C.: United States Department of Labor. Brooks, S. and R.N. Elliott. 2007. Agricultural Energy Efficiency Infrastructure: Leveraging the 2002 Farm Bill and
Steps for the Future. www.aceee.org/pubs/ie072.htm. Washington, D.C.: American Council for an Energy-Efficient Economy.
Brown, E. and R.N. Elliott. 2005. Potential Energy Efficiency Savings in the Agriculture Sector. Report# IE053.
www.aceee.org/pubs/ie053.htm. Washington, D.C.: American Council for an Energy-Efficient Economy. [CEC] California Energy Commission. 2005. Impact Evaluation of the California Statewide Pricing Pilot—Final
Report. http://www.energy.ca.gov/demandresponse/documents/index.html#group3. [CECAC] South Carolina Climate, Energy and Commerce Advisory Committee. 2008. Final Report. Compiled for
the Governor of South Carolina. http://www.scclimatechange.us/plenarygroup.cfm. [Census] United States Census Bureau. 2007. American Community Survey 3-Year Estimates.
http://factfinder.census.gov/servlet/DatasetMainPageServlet?_program=ACS&_submenuId=&_lang=en&_ts=. Washington, D.C.: United States Census Bureau.
Chesnutt, Thomas W. and Janice A. Beecher. 1998. “Conservation Rates in the Real World.” Journal of the
American Water Works Association. 90, 60–70, February. Chittum, Anna and R. N. Elliott. 2009. “Implementing Industrial Self-Direct Options: Who Is Making It Work?” In
Proceedings of the 2009 ACEEE Summer Study on Energy Efficiency in Industry. Washington D.C.: American Council for an Energy-Efficient Economy.
Chittum, Anna, R. N. Elliott, Dan Trombley and Suzanne Watson. 2009. "Suggested Treatment of CHP within an EERS Context." In Proceedings of the ACEEE 2009 Summer Study on Energy Efficiency in Industry. Washington, D.C.: American Council for an Energy-Efficient Economy.
[ConEd] Consolidated Edison Company of New York, Inc. 2008. DLRP Program Evaluation Interim Report,
Nexant, Inc., February 26. [Consortium] Consortium for Electric Reliability Technology Solutions. 2004. New York ISO 2002 Demand
Response Programs: Evaluation Results, presentation to U.S. Department of Energy Peer Review. January 28.
Convergys, 2009. News release: “Duke Energy Selects Convergys to Support Smart Grid Initiative.”
http://www.it-director.com/technology/news_release.php?rel=13269. Accessed October 23, 2009. Creech, Dennis, J. Chandler, E. Metzger, S.P. Del Pino, A. Tapia, and B. Taube. 2009. Southeast Energy
Opportunities: Power of Efficiency. World Resources Institute Issue Briefs, April 2009. Washington, D.C.: World Resources Institute.
[CUWCC] California Urban Water Conservation Council. 2006. Water Utility Direct Avoided Costs from Water
Use Efficiency. www.cuwcc.org. Sacramento, CA.: California Urban Water Conservation Council. [DOE] U.S. Department of Energy. 2006. Energy Demands on Water Resources. Washington, D.C.: U.S.
Department of Energy. ____. 2009. Energy Efficiency Funds and Demand Response Program, South Carolina. Updated April 2007.
http://www1.eere.energy.gov/femp/financing/eip_sc.html. Accessed October 21, 2009. Washington, D.C.: U.S. Department of Energy.
[DSIRE] Database of State Incentives for Renewables and Efficiency. 2009.
http://www.dsireusa.org/incentives/index.cfm?re=1&ee=1&spv=0&st=0&srp=1&state=SC. Accessed August 2009. Raleigh, NC: Database of State Incentives for Renewables and Efficiency.
[Duke] Duke Energy Carolinas. 2007. Duke Energy Carolinas DSM Action Plan: South Carolina Draft Report.
Prepared by: Forefront Economics, Inc.; H. Gil Peach & Associates, LLC, and; PA Consulting Group. Charlotte, NC: Duke Energy Carolinas.
____. 2008. The Duke Energy Carolinas Integrated Resource Plan. Charlotte, NC: Duke Energy Carolinas. ____. 2009a. News release: “Duke Energy Seeks $214 Million in Federal Funds to Accelerate Electric 'Smart
Grid' in Five States.” http://www.duke-energy.com/news/releases/2009080601.asp. Accessed October 23, 2009.
____. 2009b. Energy Efficiency Plan. www.duke-energy.com/south-carolina-large-business/energy-
efficiency/sclb-energy-efficiency-plan.asp. Accessed October 23, 2009. Economy.com. 2009. Data Buffet. Historical and Forecasted Housing Stock and Employment; U.S. Population
Estimates. Downloaded June 2009. [EIA] Energy Information Administration. 2008a. Electric Power Monthly.
http://tonto.eia.doe.gov/ftproot/electricity/epm/02260803.pdf. Washington, D.C.: U.S. Department of Energy, Energy Information Administration.
____. 2008b. 2003 Commercial Building Energy Consumption Survey.
http://www.eia.doe.gov/emeu/cbecs/contents.html. Washington, D.C.: U.S. Department of Energy, Energy Information Administration.
____. 2009a. South Carolina Electricity Profile 2007 Edition.
http://www.eia.doe.gov/cneaf/electricity/st_profiles/south_carolina.html. Washington, D.C.: U.S. Department of Energy, Energy Information Administration.
____. 2009b. Electric Power Annual 2007—State Data Tables. http://www.eia.doe.gov/cneaf/electricity/epa/epa_sprdshts.html. Washington, D.C.: U.S. Department of Energy, Energy Information Administration.
____. 2009c. "South Carolina Energy Statistics: Economic Indicators for South Carolina and State Goals for
Energy Efficiency under the Energy Policy Act of 2005." http://apps1.eere.energy.gov/states/economic_indicators.cfm/state=SC. Washington, D.C.: U.S. Department of Energy, Energy Information Administration.
____. 2009d. Annual Energy Outlook 2009. http://www.eia.doe.gov/oiaf/aeo/index.html. Washington, D.C.: U.S
Department of Energy, Energy Information Administration. ____. 2009e. Renewable Portfolio Standards and State Mandates by State.
http://www.eia.doe.gov/cneaf/solar.renewables/page/rea_data/table1_28.html. Accessed October 21, 2009. Washington, D.C.: U.S. Department of Energy, Energy Information Administration.
____. 2009g. 2005 Residential Energy Consumption Survey (RECS). http://www.eia.doe.gov/emeu/recs/.
Washington, D.C.: U.S. Department of Energy, Energy Information Administration. ELCON (formerly known as The Electric Consumers Resource Council). 2008. Financing Energy Efficiency
Investments of Large Industrial Customers: What Is the Role of Electric Utilities? http://www.elcon.org/Documents/Publications/PolicyBrief12-16-08.pdf. Washington, D.C.: ELCON
Elliott, R.N. and M. Eldridge. 2007. Role of Energy Efficiency and Onsite Renewables in Meeting Energy and
Environmental Needs in the Dallas/Fort Worth and Houston/Galveston Metro Areas. Washington, D.C.: American Council for an Energy-Efficient Economy.
Elliott, R.N., M. Eldridge, A.M. Shipley, J. Laitner, S. Nadel, P. Fairey, R.Vieira, J. Sonne, A. Silverstein, B.
Hedman, and K. Darrow. 2007a. Potential for Energy Efficiency and Renewable Energy to Meet Florida's Growing Energy Demands. ACEEE Report E072. Washington, D.C.: American Council for an Energy-Efficient Economy.
. Elliott, R.N., M. Eldridge, A.M. Shipley, J.S. Laitner, S. Nadel, A. Silverstein, B. Hedman, and M. Sloan. 2007b.
Potential for Energy Efficiency, Demand Response and Onsite Renewable Energy to Meet Texas' Growing Electricity Demands. ACEEE Report E073. Washington, D.C.: American Council for an Energy-Efficient Economy.
Elliott, R.N. and M. Spurr. 1999. Combined Heat and Power: Capturing Wasted Energy. Washington, D.C.:
American Council for an Energy-Efficient Economy. Energy Nexus Group (later became part of EEA). 2002. Combined Heat and Power Potential for New York State,
Prepared for NYSERDA. [EPA] Environmental Protection Agency. 2007a. "eGRID2006 Version 2.1, Year 2004 Summary Tables."
Washington, D.C.: U.S. Environmental Protection Agency. ____. 2007b. Aligning Utility Incentives with Investment in Energy Efficiency.
http://www.epa.gov/solar/documents/incentives.pdf. Washington D.C.: U.S. Environmental Protection Agency.
____. 2009a. Drinking Water Infrastructure Needs Survey and Assessment, Fourth Report to Congress. http://www.epa.gov/safewater/needssurvey/pdfs/2007/report_needssurvey_2007.pdf. February.
____. 2009b. WaterSense Draft Specification for Showerheads: Supporting Statement.
http://www.epa.gov/watersense/docs/showerhead_suppstat508.pdf. Washington D.C.: U.S. Environmental Protection Agency. September 24.
[EPRI and EEI] Electric Power Research Institute and Edison Electric Institute. 2008. Potential for Energy
Efficiency and Demand Response in the U.S., 2008 to 2030. Palo Alto, CA.: Electric Power Research Institute.
[ESC] Energy Services Coalition. 2008. http://www.energyservicescoalition.org/about/index.html. Accessed
September. [FERC] Federal Energy Regulatory Committee. 2006. Assessment of Demand Response and Advance Metering.
Staff Report Docket No. AD06-2-000, August. ____. 2009. A National Assessment of Demand Response Potential. http://www.ferc.gov/legal/staff-reports/06-
09-demand-response.pdf#xml=http://search.atomz.com/search/pdfhelper.tk?sp_o=2,100000,0. Accessed October 20, 2009.
Friedrich, Katherine, M. Eldridge, D. York, P. Witte, and M. Kushler. 2009. Saving Energy Cost-Effectively: A
National Review of the Cost of Energy Saved through Utility-Sector Energy Efficiency Programs. ACEEE Report U092. Washington, D.C.: American Council for an Energy-Efficient Economy.
[GDS] GDS Associates, Inc. 2007. Electric Energy Efficiency Potential Study for Central Electric Power
Cooperative, Inc. Marietta, GA: GDS Associates, Inc. ____. 2008. Santee Cooper 2008 Load Forecast for Calendar Years 2008-2027. Marietta, GA: GDS Associates,
Inc. Hamilton, Blair (Vermont Energy Investment Corporation). 2008. Personal communication with Steve Nadel.
August. Hopper, Nicole, Charles Goldman, and Jennifer McWilliams. 2005. Public and Institutional Markets for ESCO
Services: Comparing Programs, Practices and Performance. Berkeley, Calif.: Lawrence Berkeley National Laboratory.
[IMPLAN] 2009. A 2007 dataset for South Carolina. Accessed October. Stillwater, Minn.: Minnesota IMPLAN
Group, Inc. Johnson, Keith. 2009. "Peak Coal: What Do Tighter Coal Supplies Mean for 'Clean Coal'?" The Wall Street
http://www.kcc.state.ks.us/energy/fcip/index.htm. Accessed September 2008. Laitner, John A. “Skip,” and Vanessa McKinney. 2008. Positive Returns: State Energy Efficiency Analyses Can
Inform U.S> Energy Policy Assessments. Washington, D.C.: American Council for an Energy-Efficient Economy.
[Lockhart] Lockhart Power Company. 2008. Lockhart Power Company's Integrated Resource Plan. Lockhart, SC:
Lockhart Power Company. Maher, Kris. 2008. "Coal Producers Struggle to Meet Demand." The Wall Street Journal. June 24. [Mayer, Peter et al. 1999. Residential End Uses of Water. Denver, CO: American Water Works Association
[McKinsey] McKinsey Global Energy and Materials. 2009. Unlocking Energy Efficiency in the U.S. Economy. Washington, D.C.: McKinsey & Company.
Miley, Gallow, & Associates. 2008. The Economic Impact of the Agribusiness Industry in South Carolina.
http://agriculture.sc.gov/UserFiles/file/PDFS/Econ%20Impact%20of%20Agribusiness%20Sept%20162.pdf. Prepared for the Palmetto Agribusiness Council. Columbia, S.C.
Mills, Evan, H. Friedman, T. Powell, N. Bourassa, D. Claridge, T. Haasl, and M.A. Piette. The Cost-Effectiveness
of Commercial-Buildings Commissioning: A Meta-Analysis of Energy and Non-Energy Impacts in Existing Buildings and New Construction in the United States. Berkeley, CA: Lawrence Berkeley National Laboratory.
Nadel, Steven. 2007. "Energy Efficiency Resource Standards Around the U.S. and the World."
www.aceee.org/energy/state/policies/6pgEERS.pdf. Washington, D.C.: American Council for an Energy-Efficient Economy.
Nadel, Steven, A. Shipley and R.N. Elliott. 2004. The Technical, Economic and Achievable Potential for Energy-
Efficiency in the U.S. – A Meta-Analysis of Recent Studies. From the proceedings of the 2004 ACEEE Summer Study on Energy Efficiency in Buildings. Washington, D.C.: American Council for an Energy-Efficient Economy.
Nadel, Steven, A. deLaski, M. Eldridge, and J. Kliesch. 2006. Leading the Way: Continued Opportunities for New
State Appliance and Equipment Efficiency Standards. Washington, D.C.: American Council for an Energy-Efficient Economy.
[NAPEE] National Action Plan for Energy Efficiency Leadership Group. 2007. National Action Plan for Energy
Efficiency Vision for 2025: Developing a Framework for Change, http://www.epa.gov/cleanenergy/energy-programs/napee/index.html. Washington, D.C.: U.S. Environmental Protection Agency.
Neubauer, Max and Andrew deLaski. 2009. Ka-Boom! The Power of Appliance Standards: Opportunities for New
Federal Appliance and Equipment Standards. Washington, D.C.: American Council for an Energy-Efficient Economy and Appliance Standards Awareness Project.
Nordham, Doug. 2007. Demand Response Measures for Commercial and Industrial Facilities. Presented at the
20th Annual E Source Forum, on behalf of EnerNOC. September 26. [ORS] Office of Regulatory Staff. 2008. An Analysis of South Carolina's Current Electric Usage Conditions with
Recommendations for a Responsible Future. Columbia, SC: South Carolina Office of Regulatory Staff. [PA-GSA] Pennsylvania Department of General Services. 2008. "Procurement Handbook."
http://www.portal.state.pa.us/portal/server.pt?open=512&objID=1277&&SortOrder=60&level=3&parentid=1271&css=L3&mode=2&in_hi_userid=2&cached=true. Accessed September 2008.
[Progress] Progress Energy Carolinas. 2008. Progress Energy Carolinas Integrated Resource Plan. Raleigh,
NC: Progress Energy Carolinas. [PSEGC] Public Service Electric and Gas Company. 2007. Evaluation of the MyPower Pricing Pilot Program.
Prepared by Summit Blue Consulting. [Quantec] Quantec, LLC, Summit Blue Consulting and Nextant, Inc. 2007. Assessment of Long-Term System-
Wide Potential for Demand-Side and Other Supplemental Resources. Prepared for PacifiCorp. June 19. Santee Cooper. 2009. https://www.santeecooper.com/portal/page/portal/SanteeCooper/
MyHome/LoansLow%20Interest. Moncks Corner, SC: Santee Cooper. [SCDHEC] South Carolina Department of Health and Environmental Control. 2004–2006. South Carolina Water
Use Report 20XX Annual Summary. Columbia, SC: South Carolina Department of Health and Environmental Control.
[SCE&G] South Carolina Electric & Gas Company. 2009. 2009 Integrated Resource Plan. Columbia, SC: South
[SCEO] South Carolina Energy Office. 2009. "State Energy Program Application Summary." Columbia, SC: South Carolina Energy Office.
Schlissel, David, L. Johnston, B. Biewald, D. White, E. Hausman, C. James and J. Fisher. 2008. Synapse 2008
CO2 Price Forecasts. Cambridge, MA: Synapse Energy Economics, Inc.
Schlissel, David, R. Wilson, L. Johnston and D. White. 2009. An Assessment of Santee Cooper's 2008 Resource Planning. Cambridge, MA: Synapse Energy Economics, Inc.
Smartgrid News. 2009. “From Pretender to Leader: Duke Lives Up to Its Own Publicity”.
http://www.smartgridnews.com/artman/publish/Key_Players_Utilities_News/From-Pretender-to-Leader-Duke-Lives-Up-to-Its-Own-Publicity-1212.html. Accessed October 23, 2009.
Smith, Rebecca. 2009. "U.S. Foresees a Thinner Cushion of Coal." The Wall Street Journal. June 8.
[SEEA] Southeast Energy Efficiency Alliance. 2009. Energy Efficiency in Appalachia: How Much More is Available, at What Cost, and by When? Atlanta, GA: Southeast Energy Efficiency Alliance.
Summit Blue. 2007a. Residential Demand Response (DR) Overview and Support for Residential Air Conditioning
Direct Load Control. Memorandum for Arizona Public Service Company. August 3.
____. 2007b. New Jersey Central Air Conditioner Cycling Program Assessment. Prepared for Atlantic City Electric, Jersey Central Power & Light, and Public Service Electric & Gas. May.
____. 2008a. Con Edison Callable Load Study. Submitted to Consolidated Edison Company of New York (Con Edison). May 15.
____. 2008b. Load Management and Demand Response Program Portfolio Development: Interim Report. Confidential Client. March.
Svejkovsky, C. 2007. Conserving Fuel on the Farm. ATTRA fact sheet series, www.attra.ncat.org/attra-pub/consfuelfarm.html.
[Synapse] Synapse Energy Economics. 2009a. “Deliverable 1A Draft Input Assumptions for Electricity Cost
Model.” September 18. Cambridge, MA: Synapse Energy Economics, Inc. ____. 2009b. “Avoided Energy Supply Costs in New England: 2009 Report.” Prepared for the Avoided-Energy-
Supply Component (AESC) Study Group. Cambridge, MA: Synapse Energy Economics, Inc. [TIAP] The Tax Incentives Assistance Project. 2009. Business and Consumer Incentives.
energytaxincentives.org/. Accessed August 2009. Washington, D.C.: The Tax Incentives Assistance Project.
[TIAX] TIAX LLC. 2006. Commercial and Residential Sector Miscellaneous Electricity Consumption: Y2005 and Projections to 2030. Final Report to the U.S. Department of Energy’s Energy Information Administration (EIA) and Decision Analysis Corporation (DAC). Cambridge, MA. September 18, 2006.
Tiencken, John. 2009. Personal communication with Suzanne Watson and Max Neubauer. April.
Tsui, Bonnie. 2009. “How Knowing Your Neighbor’s Electric Bill Can Help You to Cut Yours.” The Atlantic. July/August.
[USDA] United States Department of Agriculture. 2007. Census of Agriculture: State Data for South Carolina.
“Table 2: Market Value of Agricultural Products Sold.” National Agricultural Statistics Service. http://www.agcensus.usda.gov/Publications/2007/Full_Report/Volume_1,_Chapter_1_State_Level/South_Carolina/index.asp.
Violette, D. and R. Freeman. 2007. “Integrating Demand Side Resource Evaluations in Resource Planning.” In Proceedings of the International Energy Program Evaluation Conference (IEPEC), Chicago, August (also at www.IEPEC.com).
Violette, D., R. Freeman, and C. Neil. 2006. DR Valuation and Market Analysis—Volume II: Assessing the DR
Benefits and Costs. Prepared for the International Energy Agency, TASK XIII, Demand-Side Programme, Demand Response Resources, January 6.
Wilen, John. 2008. "Coal Price Hikes Boost Electric Rates, More Increases Coming." The Associated Press. April 28.
Worrell, E., S. Ramesohl, and G. Boyd. 2003. "Towards Increased Policy Relevance in Energy Modeling." In the
Proceedings of the ACEEE 2003 Summer Study on Energy Efficiency in Industry. Washington, D.C.: American Council for an Energy-Efficient Economy.
York, D., M. Kushler and P. Witte. 2008. Compendium of Champions: Chronicling Exemplary Energy Efficiency Programs from Across the U.S. Washington, D.C.: American Council for an Energy-Efficient Economy.
South Carolina's Energy Future, ACEEE
90
South Carolina's Energy Future, ACEEE
91
Appendix A—Reference Case A.1 Projection of Electricity Consumption and Peak Demand The development of the reference case for South Carolina is the foundation of the quantitative analysis of the report. The first task in developing an energy efficiency and demand response potential assessment is to determine a reference case forecast of energy consumption, peak demand, and electricity prices in the state in a “business as usual” scenario. As with all forecasts, they are subject to significant uncertainty, particularly in times such as we are in when the economic outlook is a major unknown. It is however important to understand that while the forecast may affect the final numbers resulting from the analysis, that the forecast has very minor impact of the effectiveness of the proposed policies, particularly in the long-run. A.1.1 Electricity Consumption Forecast The consumption forecast we developed is essentially an aggregate of sales projections by each individual utility. But forecasts often do not account for reduced consumption that arises from energy efficiency and demand response programs initiated by utilities, nor do they account for energy savings from consumers' purchase of more efficient appliances and equipment. These savings should not be ignored as their accumulation lessens the burden of achieving any state-mandated savings target, such as an energy efficiency resource standard. While South Carolina has not implemented its own appliance efficiency standards, the Department of Energy is actively developing and mandating standards and is scheduled two implement standards on over two dozen products by 2013.53 Below we elaborate on our "modified" reference case, which is our consumption forecast net any savings accumulated through utility efficiency programs and federal appliance standards. Our electricity consumption forecast is based on 2008 sales, the most recent year for which sales have been reported, and is projected through 2025. Historical sales were taken from the EIA's Electric Power Annual, which publishes sales data on a state-by-state basis, and includes sales data between 2000 and 2007. To estimate projected consumption, we calculated annual growth rates for each sector by utility, which we derived from the integrated resource plans (IRP) filed by South Carolina's four investor-owned utilities with the Public Service Commission and from a load forecast created by GDS Associates for Santee Cooper and South Carolina's 20 cooperative utilities. With the annual sector-specific growth rates calculated for each utility, we then estimated state-wide annual weighted-average growth rates for each sector, which we then applied to the sales data reported by the EIA for 2008. After calculating annual projected sales, we adjusted the sales to account for savings generated by energy efficiency and demand-side management programs being implemented by utilities—as reported in the aforementioned IRPs filed by IOUs and from the GDS study—as well as savings from new and updated federal appliance standards implemented between 2009 and 2013. This adjusted references case we refer to as our "modified" reference case. Using this methodology, we estimate that total electricity consumption in the state will grow at an average annual rate of 0.8% between 2009 and 2025, and 1.2%, 1.3%, 0.1% in the residential, commercial, and industrial sectors, respectively. A.1.2. Peak Demand Forecast To forecast peak demand we adjust our data from the electricity sales forecast using a system load factor, which we assumed to be 62.7%. Using this methodology, we estimate peak demand growing at an average annual rate of 1% over the 2009–2025 period. In 2009, peak demand is expected to reach 16,136 MW increasing to 16,900 MW by 2015 and 19,229 MW in 2025.
53 See Footnote 9.
South Carolina's Energy Future, ACEEE
92
Table A.1. Retail Electricity Sales and Peak Demand Forecast
2010 2015 2020 2025
Average Annual Growth
Rate
Electricity (GWh)
Residential 30,217 31,899 33,891 36,612 1.19%
Commercial 22,045 23,324 25,110 27,303 1.27%
Industrial 29,299 29,470 30,164 31,188 0.10%
Total 82,051 84,693 89,165 95,103 0.83%
Summer Peak Demand (MW)
Total 16,282 16,900 17,941 19,229 0.94% A.1.3. South Carolina Population Forecast Population estimates were needed for this analysis to determine per-capita sales data. We consulted Economy.com (2009) for data on population in the state of South Carolina. According to this source, population in South Carolina will grow at an average annual rate of about 1.3%.
Table A.2. South Carolina Population Forecast
2010 2015 2020 2025
Average Annual Growth
Rate
Population Estimate 4,532,380 4,860,770 5,202,270 5,566,320 1.3% A.2. Projection of Supply Prices and Avoided Costs Synapse Energy Economics developed projections of supply prices and avoided costs used in this analysis. These estimates were developed based on key input assumptions that were developed as part of the stakeholder engagement process. Synapse then developed a simplified Electricity Planning and Costing Model to develop the projections. As noted in the main report, two set of projections were developed for the reference and moderate policy cases. A.2.1. Caveats The projections of production costs and avoided costs presented in this memo are based upon a number of simplifying and conservative assumptions that the stakeholder group consider reasonable for the purpose of this high-level policy study. These simplifications include use of a single annual average avoided energy costs to evaluate the economics of energy efficiency measures rather than different avoided energy costs for energy efficiency measures with different load shapes. In addition, Synapse Energy Economics considers it unrealistic to rely upon projections that exclude the cost of compliance with anticipated CO2 emission regulations. A.2.2. Key Assumptions This section describes the key inputs to the electricity model that Synapse Energy Economics has developed for this project (Synapse electricity cost model), the rationale for the proposed values and the sources of those values. The final inputs are based upon a set of draft inputs developed by Synapse (2009a) that ACEEE reviewed with key stakeholders in South Carolina. The memo also provides a description of the Electricity Cost model that we use to estimate future production costs and avoided costs.
South Carolina's Energy Future, ACEEE
93
A.2.3. Input Assumptions The key inputs to the electricity model are presented under the following thirteen categories:
1. Basic Modeling assumptions 2. Base year Sales and revenues 3. Base year Load and resource Balance 4. In-State Base Year Generation Resource Performance and Cost Data 5. New Generation Resource Performance and Cost Data 6. Fuel Types 7. Annual Energy and Peak Load 8. Capacity retirements 9. Capacity additions 10. Fuel prices 11. Purchased Power Costs 12. Carbon Emission Costs 13. Wholesale Market Prices
Basic Modeling Assumptions
The base year is 2007. All monetary values are reported in constant 2007 year dollars unless noted otherwise.
The study period begins in 2008 and ends in 2030, an analysis period of 23 years.
The reporting period is 2009 through 2025, a total of 17 years.
The financial parameters for costing resource additions are as follows:
o Inflation Rate. 2.00%. Based on analysis done for the New England AESC study
(Synpase 2009b) reflecting recent conditions.
o Nominal Discount Rate. 10.0%. This represents the value for an independent power producer with a mix of equity and bond financing. Based on a 50/50 equity/debt mix with 12% for equity and 8% for debt. Used for levelization of capital expenditures. Actual rates for specific projects will vary depending on the nature of the project and the implementing entity.
o Real Discount Rate. 7.84%. Derived from the Nominal Discount Rate and the Inflation
Rate.
o Income Tax Rate. Federal rate of 35% and SC state corporate rate of 5.0%. Property tax rate at the nominal level of 0.5% per annum of the initial plant cost (local rates vary considerably). Used for capital cost levelization..
A.2.4. Base Year Sales and Revenues The historic sales and revenues data through 2007 are obtained from the EIA’s “State Electric Profile” Table 8 (http://www.eia.doe.gov/cneaf/electricity/st_profiles/e_profiles_sum.html). The historic data indicates that SC is net exporter and exports about 15% of its electricity generation.
A.2.5. Base Year Load and Resource Balance The historic sales and revenues data are obtained from the EIA’s “State Electric Profile” Tables 5, 8 and 10 (http://www.eia.doe.gov/cneaf/electricity/st_profiles/e_profiles_sum.html). A.2.6. In-State Base Year Generation Resource Performance and Cost Data From the above EIA data, we have the generation, CO2 emissions and fuel costs for each generating group. From that we can derive the average heat rate for each group and the fuel component of the generation costs. To that we add typical industry values for O&M. Also from that EIA data we have the historic capacity factors associated with resource group. Those historic patterns are used to set the basis for future performance. A.2.7. New Generation Resource Performance and Cost Data For new generation resources we have used the technology parameters from the AEO 2008 Assumptions document. For capital costs we have used our professional judgment based on a number of sources to reflect current cost expectations for new construction. A.2.8. Fuel Types We use the three basic fuel types as specified in the EIA documents (Coal, Petroleum and Natural Gas) with the addition of nuclear and biomass. A.2.9. Annual Energy and Peak Load For energy and peak loads we have used the ACEEE Reference Case Forecast as of 8/13/09. A system load factor of 62.7% based on 2007 load data is used to produce future peak loads based on forecasted energy use. A.2.10. Capacity Retirements There is little information about future plant retirements and a variety of unknown circumstances may either work in favor of or against individual plants. It is however likely that some older less efficient generation will be retired in the future. To reflect this we represent modest gradual retirement of existing resources in the model. But it is possible that some existing plants will be retrofitted and their lives extended. A.2.11. Capacity Additions In order to meet future load growth, new generation resources must be added to the existing generation mix. The electricity model is not a capacity expansion model that optimizes capacity additions by choosing among a set of resource alternatives to develop a least cost expansion plan. Instead, we will add new resources “manually” to meet reserve needs. Our analysis will consider three sets of additions:
Planned Additions—Near-term proposed new additions or updates to existing plants that are in development or advanced stages of permitting and have a high likelihood of reaching commercial operation;
RPS Additions—Renewable generators that are added to meet existing or anticipated renewable portfolio standards (RPS) in each state; and,
Generic Additions—New generic conventional resources that are added to meet the residual capacity need after adding planned and RPS additions.
Planned Additions Description: Our near-term entry forecast is based on projects in the utility plans. With a new coal plant about 2011, new NG CC resources in 2012 and new nuclear plants in 2019 and 2020. Future capacity deficits are filled in with a mix of coal and NG plants. Data Sources: Duke and SCE&G resource plans. AEPS Additions At the present time there is no renewable generation requirement in South Carolina. Generic Additions In order to reliably serve the forecasted load in the mid- to long-term portion of the forecast period, new generic additions will need to be added to the model. A range of generation technologies was initially considered for this purpose, including gas/oil-fired combined-cycle, gas/oil combustion turbines, conventional coal, and nuclear. Generic additions based on requirements after the RPS additions specified above are based on meeting a system-wide reserve goal. For these generic additions we use a mix of 30% conventional coal, 35% NGCC and 35% gas peakers. Because of the planned additions very few generic additions are needed until after 2021. A.2.12. Fuel Prices We start with fuel prices reported for the base year of 2007. For consistency and simplicity we used the base year historical prices and scaled them using the AEO 2009 Reference Case forecast54 year to year changes for the Southeastern Electric Reliability Council (SERC) region. A.2.13. Power Purchase and Sale Prices South Carolina is a regulated market and generates excess power. Most of that excess is used in North Carolina with same utility companies operating in both states. We assume that cost trends for exported power follow those for in-state power production. A.2.14. Carbon Emission Costs Carbon compliance costs are set at the Synapse 2008 mid-case level (see Schlissel et al. 2008). A.2.15. Wholesale Market Prices SC is a regulated state and wholesale sales and purchases are assumed to reflect production costs. A.3. Electricity Planning and Costing Model This model was developed by Synapse for ACEEE's clean energy state studies.
54 Annual Energy Outlook 2009 Reference Case, Energy Information Agency (EIA), March 2009. http://www.eia.doe.gov/oiaf/aeo/
A.3.1. Background ACEEE has initiated a series of state-specific “Clean Energy” potential studies through which it will work with key stakeholders in order to build a common understanding of, and consensus on, the role that clean energy resources, i.e., energy efficiency and demand response, can play in meeting the future electricity end-use requirements in each state, the economic benefits of treating those resources as the “first fuel” for meeting future requirements and the policies for maximizing reliance upon those resources. The time horizon for the studies is through 2025. In each of those studies ACEEE will evaluate the cost-effectiveness of reductions from energy efficiency and demand response, and will also demonstrate the benefits of those reductions to all consumers in the state by estimating retail prices in the long-term under a clean energy Policy Case. ACEEE retained Synapse to provide three deliverables to support these studies:
projections of long-term wholesale electricity supply prices under a reference, or business-as-usual case;
credible, consistent, “high-level” estimates of avoided electric energy ($/kwh) and capacity costs ($/kw-year); and
projections of long-term electricity supply prices under a clean energy policy case.
In light of time and budget constraints, and the policy nature of these studies, ACEEE requested that Synapse develop and apply an electricity planning and costing model that would produce accurate “high-level” estimates of each of these deliverables in a well-documented, transparent manner. In order to satisfy the ACEEE request, Synapse had to develop an electricity planning and costing model that would be:
applicable to planning and costing from a state perspective, although most electric utility operations cross state boundaries;
applicable from state to state, although some states are part of deregulated multi-state
markets while others operate under traditional utility regulation;
applicable using public data;
inexpensive to setup and run; and
relatively transparent. Synapse has developed an EXCEL based planning and costing model with these characteristics. A.3.2. Methodology The model begins with an analysis of actual physical and cost data for a base year, develops a plan for meeting projected physical requirements in each future year of the study period and then calculates the incremental wholesale electricity costs associated with that plan. (Incremental to electricity supply costs being recovered in current retail rates.) A.3.3. Base Year Data The actual data for the base year, and prior years, provides our starting point. That dataset contains historical data in the following categories:
South Carolina's Energy Future, ACEEE
97
1. Recent year summary statistics. 2. Listing of the ten largest plants in the state.
3. Top five providers of retail electricity.
4. Electric capability by primary energy source.
5. Generation by primary energy source.
6. Fuel prices and quality.
7. Emissions.
8. Retail sales and revenues by customer class.
9. Retail sales by various provider types.
10. Supply and distribution of electricity.
This data enables us to characterize the electric supply system and its costs for a given state. For example the capacity, generation and capacity factor, average heat rate and fuel costs for different classes of resources. We can also calculate the retail margin from this data, i.e. the margin between average retail rates and variable production costs. The retail margin reflects the transmission and distribution costs being recovered in retail rates plus the fixed generation costs being recovered in those rates. This data is a very broad brush since the resources are grouped by fuel type and their operation is not characterized in great detail. A.3.4. Future Years We begin with the forecast of annual demand and energy in each future year provided by the ACEEE stakeholder group. Next we develop a physical plan to meet the load in each of those future years. This is done in the model via the following steps:
1. Derive annual capacity and generation requirements from forecast of retail annual demand and energy, and reserve margins,
2. Determine the relative quantities of annual capacity and generation to be provided by in-state and out-state resources based on the current mix of in-state and out-of state resources,
3. Estimate resource retirements. It is quite difficult to predict the timing of actual plant
retirements, but it is reasonable to assume that some older facilities will be retired during the study period. We assume gradual retirement of existing resources over time based on typical operating lifetimes. This is explicitly specified in the input data section and can easily be modified if more specific data becomes available.
4. Estimate the capacity, timing and timing of new generation additions, in-state and out of
state. Our model is not a capacity expansion model and therefore does not make capacity additions “automatically”. Instead, after we include “planned” capacity additions, we add enough “generic” capacity additions to maintain the reserve margin. Our generic additions are a mix of peaking, intermediate and baseload units that maintains the historical mix of those categories in the state. This approach is transparent as the additions are explicitly specified in the input data section.
South Carolina's Energy Future, ACEEE
98
5. Calculate the quantity of annual generation from each category of capacity, existing and new, in-state and out of state. The estimated quantity of generation from each category of capacity is derived from the operating capacity factors. These are generally based upon economic dispatch, i.e. dispatch from each category in order of increasing variable production costs.
A.3.5. Calculate Production Costs The model calculates the average production costs, i.e., energy plus capacity, for the particular case in the Production Model worksheet. States with Regulated Wholesale Markets For states with regulated wholesale markets the Production Model worksheet calculations are made as follows:
Calculate total cost of generation from existing in-state resources, purchases from out-of-state resources, and new in-state resources.
The unit production costs of existing in-state generation includes variable operating costs plus fixed costs.55 The aggregate cost of generation from these resources decline over time as existing coal, oil and gas plants are retired, while the existing nuclear plants with low operating costs continue operation;
The unit production costs of new in-state generation consists of the levelized capital cost of
new capacity additions plus their variable operating costs. The capacity cost of new capacity additions are levelized using the capital recovery factors developed in the Capital Recovery Calculation (CRC) worksheet.
The cost of power imported or exported is indexed to the generation-weighted average cost
of generation from the in-state resources, i.e., existing and new. That is, the base-year import/export price changes in parallel with the in-state cost, e.g. an x% change of in-state production costs is reflected in an x% change of import/export prices. The rationale is that relative changes of in-state costs will be reflected outside the state as well.
States with Deregulated Wholesale Markets For states with de-regulated wholesale markets the Production Model worksheet calculations are made as follows:
1. The first step is to calculate the reference year market prices for the state being studied.
2. The next step is to calculate the relationship between those state prices and market location for which future prices are available.
3. The third step is to then apply that relationship to the futures prices to produce a forecast for
market prices in the study state.
55 For existing resources fixed costs are estimated on an aggregate basis based on the base year difference between fuel and other variable costs and the retail revenues less a retail markup component.
South Carolina's Energy Future, ACEEE
99
A.3.6 Calculate Avoided Costs States with Regulated Wholesale Markets For states with regulated wholesale markets the Production Model worksheet calculates the total avoided costs, avoided capacity costs and avoided energy costs via the following steps:
1. Total Avoided Costs. The worksheet calculates “all-in” avoided costs that include both energy and capacity costs.
2. Years 1 to 5. For the first five years the avoided costs are a mix of avoided dispatch of existing resources and avoided total cost of new resources that would otherwise come-on-line during that period. The percentage of new resources included in that mix is phased-in, starting at 0% in year 1 and rising to 100% in year 5.
3. Year 6 onward. After year 5 the avoided costs in each year equal the average total costs of
new resources in that year. This calculation assumes that the capital costs of new resources are avoidable either through avoiding their actual construction or through recovery from revenues from off-system sales.
4. Avoided capacity cost. To estimate the avoided cost of capacity only we use the proxy plant
approach which is used by several Independent System Operators (ISO). This avoided capacity cost is based upon cost of “capacity only” from a new gas combustion turbine “peaker” unit. Basing avoided capacity cost on the capital cost of a new peaker is a commonly accepted method.
5. Avoided Energy Cost. The avoided energy cost is the total avoided cost from step 8 minus
the avoided capacity cost from step 9. States with Deregulated Wholesale Markets For states with de-regulated wholesale markets the Production Model worksheet calculates the total avoided costs, avoided capacity costs and avoided energy costs differently for different time-periods.
1. Near-term years for which futures prices are available, e.g. first 4 to 5 years.
2. Avoided energy cost—This is calculated from the energy futures market prices with appropriate historic-based adjustments for the state service area.
3. Avoided capacity cost—This is based on the available appropriate capacity market results.
4. Total avoided cost—This is obtained by combining the avoided energy cost with the avoided
capacity cost using the base year system load factor to arrive at the combined total avoided cost on a per MWh basis.
5. Long-term years for which futures prices are not available. After the period for which futures
are available, the total avoided costs, avoided capacity cost and avoided energy cost are developed in the same manner as for regulated states, in steps 8, 9 and 10.
A.4. Reference Case Electricity Supply Prices and Avoided Costs This section presents Synapse's projections of Reference Case electricity supply prices and avoided costs for South Carolina. The projections are outputs from the electricity costing model that Synpase has developed for this project. The inputs to the model and the structure of the model are described above.
South Carolina's Energy Future, ACEEE
100
A.4.1 Reference Case Electricity Supply Prices The reference case load forecast, load forecast, and supply prices are presented in Table A.3. The supply forecast exceeds the load forecast by the level of estimated losses in transmission and distribution. The supply prices include the projected incremental generation costs each year, the retail margin each year and the resulting total average retail rate. A.4.2. Avoided Electricity Costs The avoided costs for the reference case are presented in Table A.4. The avoided capacity costs are presented in $/kW-year while the avoided electric energy costs are given in ¢/kWh.
South Carolina's Energy Future, ACEEE
101
Table A.3. Reference Case Load, Supply and Price Forecasts All costs in constant 2007 dollars.
Notes: Avoided Resource Costs represent avoided production costs (fuel, O&M, CO2) for all resources, plus levelized capital costs for new resources.Avoided Capacity Cost in $/kw-yr is converted into an energy cost equivalent (c/kWh) using the system load factor.Avoided Energy Cost represents Total Avoided Resource Cost less Avoided Capacity Cost expressed as energy cost equivalent.
SC Reference Case Draft - 9/16/09
A.5. Policy Case Electricity Supply Prices and Avoided Costs This section presents Synapse's projections of Policy Case electricity supply prices and avoided costs for South Carolina. The projections are outputs from the electricity costing model that Synapse has developed for this project as discussed above. ACEEE provided the Policy Case Load Forecast. A.5.1. Policy Case Electricity Supply Prices The Policy Case load forecast, supply forecast, and supply prices are presented in Table A.5. The supply forecast exceeds the load forecast by the level of estimated losses in transmission and distribution. The supply prices include the projected incremental generation costs each year, the retail margin each year and the resulting total average retail rate. A.5.2. Avoided Electricity Costs The avoided costs for the policy case are presented in Table A.6. The avoided capacity costs are presented in $/kW-year while avoided electric energy costs are given in ¢/kWh.
South Carolina's Energy Future, ACEEE
103
Table A.5. Policy Case Load, Supply and Price Forecasts All costs in constant 2007 dollars.
* Percent relative to unadjusted reference case forecast.
1 We assume 18% savings by 2025 relative to 2025 projected sales.
South Carolina's Energy Future, ACEEE
106
2
Initiative broken down into programs for existing homes and new construction for both residential and commercial buildings. Residential analysis for existing homes assumes 0.5% savings throughout the analysis period and 0.5% participation rate in first year, with participation increasing by 0.5% annually until 2018, where participation then grows 1% annually, reaching 15% by 2025. Savings from new construction assumes 50% savings beyond current code (IECC 2006), thereby decreasing with the adoption of new energy codes except in 2020, where we assume program implementation and participation has matured to allow for savings beyond the 50% savings from IECC 2012. In 2011 we assume an initial participation rate of 5%, increasing by 1% annually throughout the analysis period, thereby reaching 20% participation in 2025. Commercial analysis for existing buildings assumes 1% savings throughout the analysis period. The program participation rate begins at 0.25% in the first year, increasing annually by 0.25% until 2012 and by 0.5% annually until 2020, then increasing by 1% for the final five years so that participation reaches 10% by 2025. We assume that 74% of total commercial electric floorspace is non-governmental buildings, to avoid double-counting savings attributable to state facilities program (EIA 2008b, table C17). Savings from new construction again assumes 50% savings beyond South Carolina's current code (IECC 2006), thereby decreasing when updated energy codes become effective in 2012 and 2015. In 2010 we assume an initial participation rate of 10%, increasing by 1% annually throughout the analysis period, reaching 25% by 2025.
3
We assume a five-year pilot program, where participation is steady at 2.5% for the first five years and savings begin at 0.5%, increasing by 0.5% for the first three years and by 1% for the final two, peaking at 3.5%. Participation in the program increases by 2.5% annually from 2015 through the remainder of the analysis period. We also assume a one-year persistence rate, i.e., that savings realized in one year are not perpetually generated and therefore do not accumulate.
4
We assume that the 2009 IECC is adopted in 2010 and becomes effective in 2012, which would reduce energy consumption by 15% in new residential and commercial construction relative to the 2006 IECC. The 2012 IECC is then adopted in 2013 and effective 2015, reducing energy consumption by 30% in new residential and commercial construction relative to the 2006 IECC. Savings apply only to end-uses covered under building codes, which are HVAC, lighting, and water heating end-uses, or 50% of electricity consumption in new residential construction and nearly 60% of electricity consumption in commercial buildings. We assume enforcement of each code starts at 70% compliance in the first year, 80% in second year, and 90% in the third and subsequent years.
5 We assume a $500 incentive per MW for CHP facilities.
6
HB 4766 requires state agencies to reduce energy consumption by 1% annually and 20% cumulatively by 2020, using year 2000 sales as the baseline. 26% of commercial building electricity use in SC is in government buildings. We assume the program remains funded through 2025 and that the savings measures implemented have a ten-year life, so that in 2020 no new savings are generated, rather the savings rate begins again at the original rate.
7
Our medium case scenario is modeled so that in 2011, in addition to the 6,500 homes weatherized with ARRA funds, South Carolina will weatherize an additional 300 homes (up from around 250 annually for the previous two years). We assume that the number of homes weatherized each year increases by 500 until 2015, when the number of participating homes increases annually by 1,000. We assume weatherization generates an average of 20% electricity savings.
8
Our medium case scenario assumes that 800 manufactured homes are upgraded through 2011 (the program target) with 350 homes upgraded in the final year, and that the program continues to be funded through 2025. We also assume that, after the initial three years, the number of manufactured homes treated increase by 500 until 2015, when the number of participating homes begin to increase annually by 1,000, peaking at 10,000 homes per year in 2023.
9
Our medium case scenario assumes that the number of industrial assessments ramps up from 50 to 200 in first three years, that each assessment identifies 15% electricity savings, and that 50% of identified savings are implemented. Project costs assume the average investment cost per kWh from the industrial sector analysis ($0.28/kWh) and program cost is assumed to be 12.5% of projected cost savings to the end-user.
10 Based on similar programs and values from the State of Wisconsin Focus on Energy 2007 Semiannual Report, we assume the average cost of conserved energy at $0.025/kWh, that program & administrative costs are 24% of the cost of investment, and that customers cover half of the investment cost.
11
Savings for proven programs are the difference between EERS requirements and policy savings. All of the recommended policies except building energy codes are counted towards meeting the EERS requirements. Sector savings are then allocated based on the contribution to economic potential savings of the residential and commercial sectors.
South Carolina's Energy Future, ACEEE
107
Table B.2. Summer Peak Demand Reductions from the Medium Case Scenario (MW) Summer Peak Reductions (MW) 2010 2015 2020 2025 % Reduction
Residential 38 274 1,068 2,844 14.8%
Commercial 27 224 637 1,326 6.9%
Industrial 1 102 267 434 2.3%
Total Savings (MW) 66 600 1,972 4,604 23.9%
% Reduction (relative to forecast) 0.4% 3.6% 11.0% 23.9%
Table B.3. Total Resource Costs* from the Medium Case Scenario (Million 2007$) By Policy/Program 2010 2015 2020 2025 Energy Efficiency Resource Standard
Total $ 59 $ 326 $ 1,038 $ 2,436 *Note: Total Resource Costs include total investments in energy efficiency, whether made by customers or through incentives, plus program and administrative costs.
South Carolina's Energy Future, ACEEE
108
Table B.4. Electricity Savings from the High Case Scenario
Annual Electricity Savings (GWh) 2010 2015 2020 2025 Total
1 We assume 24% savings by 2025 relative to 2025 projected sales.
2
Initiative broken down into programs for existing homes and new construction for both residential and commercial buildings. Residential analysis for existing homes assumes 0.5% savings until 2015 and 1% for the remainder of the analysis period. Participation in the program beings at 0.5%, increasing by 0.5% annually until 2018, where participation then grows 2.5% annually and 5% in the final year. Savings from new construction assumes 50% savings beyond current code (IECC 2006), thereby decreasing with the adoption of new energy codes, effective in 2012 and 2015. In 2021, when the 2018 IECC becomes effective, delivering 50% savings beyond the 2006 IECC, we assume an additional 20% savings beyond the 2008 IECC are achievable. We assume an initial participation rate of 5%, increasing by 1% annually through 2020, when participation increases by 2% annually for the remainder of the analysis period. Commercial analysis for existing buildings assumes 1% savings until 2020, when savings reaches 2% annually. The program participation rate begins at 0.25% in the first year, increasing annually by 0.25% until 2012 and by 1% annually until 2021, then increasing by 2.5% for the final four years so that participation reaches 20% by 2025. We assume that 74% of total commercial electric floorspace is non-governmental buildings, to avoid double-counting savings attributable to state facilities program (EIA 2008b, table C17). Savings from new construction again assumes 50% savings beyond South Carolina's current code (IECC 2006), thereby decreasing when updated energy codes become effective in 2012 and 2015. In 2021, when the 2018 IECC becomes effective, delivering 50% savings beyond the 2006 IECC, we assume an additional 20% savings beyond the 2018 IECC are achievable. In 2010 we assume an initial participation rate of 10%, increasing by 1% annually until 2015, when participation begins to increase by 2% annually for the remainder of the analysis period.
South Carolina's Energy Future, ACEEE
109
3
We assume a five-year pilot program, where participation is steady at 2.5% for the first five years and savings begin at 0.5%, increasing by 0.5% for the first three years and by 1% for the final two, peaking at 3.5%. Savings peaks at 5% by 2020 and remains at 5% for the remainder of the analysis period. Participation in the program reaches 5% by 2015 and increases by 2.5% annually for the remainder of the analysis, reaching 30% in 2025. We again assume a one-year persistence rate.
4
We assume that the 2009 IECC is adopted in 2010 and becomes effective in 2012, which would reduce energy consumption by 15% in new residential and commercial construction relative to the 2006 IECC. The 2012 IECC is then adopted in 2013 and effective 2015, reducing energy consumption by 30% in new residential and commercial construction relative to the 2006 IECC. The 2018 IECC is adopted in 2019, effective 2021, reducing electricity consumption 50% relative to 2006 IECC. Savings apply only to end-uses covered under building codes, which are HVAC, lighting, and water heating end-uses, or 50% of electricity consumption in new residential construction and nearly 60% of electricity consumption in commercial buildings. We assume enforcement of each code starts at 70% compliance in the first year, 80% in second year, and 90% in the third and subsequent years.
5 We assume a $1000 incentive per MW for CHP facilities and the removal of disincentives.
6
HB 4766 requires state agencies to reduce energy consumption by 1% annually and 20% cumulatively by 2020, using year 2000 sales as the baseline. In this scenario, the program is augmented by increased savings from incorporating energy service performance contracts through an energy service company, increasing savings by an additional 0.5%.
7
Our high case scenario is modeled so that in 2011, in addition to the 6,500 homes weatherized with ARRA funds, South Carolina will weatherize an additional 300 homes (up from around 250 annually for the previous two years). We again assume that the number of homes weatherized each year increases by 500 until 2015, when the number of participating homes increases annually by 1,500 through 2021, 2,000 for the following two years and 2,500 homes for the final two years. We assume weatherization generates an average of 20% electricity savings.
8
Our high case scenario assumes that 800 manufactured homes are upgraded through 2011 (the program target) with 350 homes upgraded in the final year, and that the program continues to be funded through 2025. We again assume that, after the initial three years, the number of manufactured homes treated increase by 500 until 2015, when the number of participating homes begin to increase annually by 1,000 until 2020, 1,500 until 2022, and 5,000 annually through 2025. We again assume a savings rate of 30%.
9
Our high case scenario assumes that the number of industrial assessments ramps up from 50 to 150 in first three years, that each assessment identifies 13% electricity savings, and that 50% of identified savings are implemented. Project costs assume an average investment cost per kWh of $0.28/kWh and program cost is assumed to be 12.5% of projected cost savings to the end-user.
10
Identical to the medium case scenario, this policy is based on similar programs and values from the State of Wisconsin Focus on Energy 2007 Semiannual Report. We assume the average cost of conserved energy at $0.025/kWh, that program & administrative costs are 24% of the cost of investment, and that customers cover half of the investment cost.
11
Savings for proven programs are the difference between EERS requirements and policy savings. All of the recommended policies except building energy codes are counted towards meeting the EERS requirements. Sector savings are then allocated based on the contribution to economic potential savings of the residential and commercial sectors.
Table B.5. Summer Peak Demand Reductions from the High Case Scenario (MW)
% Reduction (relative to forecast) 0.6% 5.1% 15.1% 32.0%
South Carolina's Energy Future, ACEEE
110
B.2. Carbon Dioxide Emissions Reductions To estimate annual regional emissions reductions, we first took data on projected electricity generation and carbon dioxide emissions over the 2009–2025 period for the Southeastern Electric Reliability Council (SERC) region as reported by the Annual Energy Outlook (EIA 2009d). We then calculated an output emission rate, defined as the ratio of emissions (lbs) to electricity generation (MWh). Using data from the Emissions and Generation Resource Integrated Database (eGRID) on subregional emissions rates and converting to standard tons (EPA 2007a), we calculated a net marginal emissions factor (ton/MWh), which is our output emissions rate multiplied by the ratio of marginal to average emissions rate. We then took out emissions factor and multiplied South Carolina's estimated electricity savings (GWh) from the Policy Analysis in order to determine the regional carbon dioxide emissions savings for the 17-year period.
Table B.6. Emissions Savings in SERC Region and South Carolina in Medium Scenario (million tons) 2010 2015 2020 2025
Projected Carbon Dioxide Emissions in SERC Region 547.99 549.33 577.98 604.38
Projected Carbon Dioxide Emissions in South Carolina 43.41 43.52 45.79 47.88
Electricity Savings from Medium Scenario (GWh) 73 1,747 5,721 11,993
CO2 Emissions Reductions from Policy Scenario 0.08 1.84 6.01 12.48
SERC Emissions in Medium Scenario 547.91 547.50 571.97 591.90
% Savings in SERC 0.014% 0.334% 1.040% 2.065%
SC Net Emissions after Savings 43.34 41.69 39.78 35.40
% Savings in SC 0% 4% 13% 26%
South Carolina's Energy Future, ACEEE
111
Appendix C—Key Assumptions Regarding Water Savings Calculations While peer reviewed analyses of the costs and benefits of utility water conservation programs in the Southeast are scarce, enough is known about the cost and performance of key technologies and practices to make a first-order estimate of potential savings. Key assumptions listed below. Those without attribution were made specifically for this report. Statewide Plumbing Efficiency Standards
Average South Carolina household size is 2.6 persons per household (Economy.com 2009).56
Average household size for a new home is 3.0 persons per household. There are 1.73 bathrooms per housing unit in the Southeast (2005 RECS) (EIA 2009g) Newly constructed housing contains 2.5 bathrooms per housing unit. Toilet product life is 25 years, yielding an annual replacement rate of 4% Residential toilet usage is 5 flushes per person per day. Toilets meeting the specification will save 0.32 gallons per flush. Showerhead product life is 15 years Showerheads meeting the specification will save 0.25 gpm. Residential shower usage is 8.2 minutes per shower and 0.67 showers per day (EPA 2009b) Lavatory faucets and faucet aerators meeting the specification will save 0.2 gpcd57 (EPA
2007d) Lavatory faucet life is 25 years 70% of residential faucet water use is hot water (EPA 2007d) 73% of residential shower water use is hot water (EPA 2009b) 47% of households in the Southeast use electricity to heat domestic hot water (EIA 2009g) Hot water at 120˚ uses 0.18 KWh per gallon (EPA 2009b) Market share of conforming products in 2011: tank-type toilets: 32%; lavatory faucets and
faucet aerators: 50%; showerheads: 20%. Incremental cost of conforming products in 2012: tank-type toilets: $0; Lavatory faucets and
faucet aerators: $0; showerheads: $10, declining by $1 per year thereafter. Replacement of Inefficient Plumbing in Existing Residences
Pre-1995 toilets average 4.0 gallons per flush. Replacement toilets average 1.28 gpf, for savings of 2.72 gpf. Pre-1995 toilets in pre-1995 housing are already being replaced at the rate of 4% per year. Sales of existing homes average 5.33% per year (based on NAR South Carolina statewide
figures for 2006, 2007, and 2008) Multifamily buildings with rental units are sold at 1/4 the rate of other homes (1.33%). 10% of residences sold in a year would have bathrooms remodeled within 6 months before or
after a sale regardless of this policy. Net replacement of pre-1995 toilets attributable to this policy is 4.8% per year for sf homes
and condos and 1.2% per year for multifamily buildings with rental units. Cost of replacement is $345 per dwelling unit (≈ $120/toilet x 1.73 toilets per unit + 2hr labor
@ $60 + $10 per toilet for disposal).
56 Note: The latest U.S. Census Bureau estimate (American Community Survey) for South Carolina is 2.52 persons per household. 57 This is one-third the rate of savings claimed in the reference, which also included savings attributable to improvements in kitchen faucet efficiency, which is not proposed for change here.
South Carolina's Energy Future, ACEEE
112
80% of customers pay cost of replacement. Utilities pay replacement cost for 20% of customers based on income criteria.
Reduction of Water Losses from Utility Distribution Systems
A portion of water lost to distribution system leakage is assumed to be economically recoverable. This portion is estimated to equal 4% of current (2006) withdrawals by public water suppliers.
Water suppliers will begin standardized annual water loss accounting in 2011 and take four years to improve the quality of water delivery data to a level to support decisions to invest in water loss reduction measures.
In Scenario Two (Medium Case), to save 50% of economically recoverable losses, public water suppliers will invest in cost-effective water loss reduction measures to save 0.2% per year, beginning in 2015 and continue through 2025 to reach 2% savings.
In Scenario Three (High Case), to save 90% of economically recoverable losses, public water suppliers will invest in cost-effective water loss reduction measures to save 0.33% per year, beginning in 2015 and continue through 2025 to reach 3.6% savings.
In Scenario Two, benefits are assumed to exceed costs by 2 to 1. In Scenario Three, benefits are assumed to exceed costs by 1.5 to 1.
Water Efficient Landscape Irrigation Ordinances
Ordinance will reduce outdoor water use of new single-family residential customers by 10,000 gallons per year (90% during 6 warmest months at 1500 gallons per month).
Costs will average $250 per house covering materials and labor. Electric Utility Clothes Washer Incentives
In both the medium case and the high case, 10% of the total amount of customer incentives offered to residential and commercial customers by the Electric Utility Programs are devoted to high efficiency clothes washers.
Incentive level is $150 for the purchase of a qualified new clothes washer. The efficiency levels of new clothes washers qualifying for the incentive are MEF 2.0/WF 6.0
from 2009 through 2014, and MEF 2.2/WF 4.5 from 2015 through 2025. The water efficiency levels of base models are WF 12.5 in 2009–2010, WF 9.5 in 2011–2014;
and WF 6.0 in 2015–2025. The proportion of washer sales in the state that will already meet the qualifying efficiency
levels without the program’s customer incentives are 35% in 2009 growing 1% per year to 40% in 2014; and 10% in 2015 growing 1% per year to 20% in 2025.
The number of washers installed is determined by the available utility program dollars (@ $150 per machine), but goes no higher than 40,000 washers per year in 2019 and beyond.
South Carolina's Energy Future, ACEEE
113
Appendix D—Demand Response Analysis D.1. Introduction This report defines Demand Response (DR), assesses current DR activities in South Carolina, identifies policies in the state that impact DR, uses benchmark information to assess DR potential in South Carolina, and identifies barriers in the state that might keep DR contributing appropriately to the resource mix that can be used to meet electricity needs. The analysis concludes with identification of policy recommendations regarding DR. D.1.1. Objectives of this Assessment This assessment develops estimates of DR potential for South Carolina. Potential load reductions from DR are estimated for the residential, commercial, and industrial sectors. The assessment also includes discussions of reductions possible from other DR programs, such as DR rate designs. D.1.2. Role of Demand Response in South Carolina’s Resource Portfolio The DR capabilities developed by South Carolina utilities will become part of a long-term resource strategy that includes resources such as traditional generation resources, renewable energy, power purchase agreements, options for fuel and capacity, energy efficiency and load management programs. Objectives include meeting future loads at lower cost, diversifying the portfolio to reduce operational and regulatory risk, and allow South Carolina customers to better manage their electricity costs. The growth of renewable energy supply (and plans for increased growth) can increase the importance of DR in the portfolio mix. For example, sudden renewable energy supply reductions (e.g., from an abrupt loss in wind) may be mitigated quickly with DR. D.1.3 Summary of DR Potential Estimates in South Carolina Table D.1. shows the resulting load shed reductions possible for South Carolina, by sector, for years 2015, 2020, and 2025. Load impacts grow rapidly through 2018 as program implementation takes hold. After 2018, the program impacts increase at the same rate as the forecasted growth in peak demand. The high scenario DR load potential reduction is within a range of reasonable outcomes in that it has an eleven year rollout period (beginning of 2010 through the end of 2020), providing a relatively long period of time to ramp up and integrate new technologies that support DR. A value nearer to the high scenario than the medium scenario would make a good MW target for a set of DR activities.
South Carolina's Energy Future, ACEEE
114
The high scenario results show a reduction in peak demand of 1,058 MW is possible by 2015 (6.2% of peak demand); 2,212 MW is possible by 2020 (12.3% of peak demand); and 2,298 MW is possible by 2025 (12.1% of peak demand). The more conservative medium scenario results show a reduction in peak demand of 686 MW is possible by 2015 (4.0% of peak demand); 1,435 MW is possible by 2020 (8.0% of peak demand); and 1,493MW is possible by 2025 (7.9% of peak demand).
Table D.1. Summary of Potential DR in South Carolina, By Sector, for Years 2015, 2020, and 2025a
Total DR Potential (MW) 385 807 840 686 1,435 1,493 1,058 2,212 2,298 DR Potential as % of Total Peak Demand
2.3% 4.5% 4.4% 4.0% 8.0% 7.9% 6.2% 12.3% 12.1%
Figure D.1 shows the resulting load shed reductions possible for South Carolina, by sector, from year 2010, when load reductions are expected to begin, through year 2025.
Figure D.1. Potential DR Load Reductions in South Carolina by Sector (Medium Scenario)
These estimates reflect the level of effort put forth and utilities are recommended to set targets for the high scenarios. These estimates are based on assumptions regarding growth rates, participation rates, and program design. In developing these DR potential estimates, the integration of DR with select energy efficiency activities was considered to help ensure that load impacts were not double counted. The estimated load reduction per program participant is conservatively estimated to account for increased energy efficiency in the future. D.2. Defining Demand Response DR focuses on shifting energy from peak periods to off-peak periods and clipping peak demands on days with the highest demands. Within the set of demand-side options, DR focuses on clipping peak demands that may allow for the deferral of new capacity additions, and it can enhance operating reserves available to mitigate system emergencies. Energy efficiency focuses on reducing overall energy consumption with attendant permanent reductions in peak demand growth. Taken together, these two demand-side options can provide opportunities to more efficiently manage growth, provide customers with increased options to manage energy costs, and develop least cost resource plans.
South Carolina's Energy Future, ACEEE
115
DR is an increasingly important tool for resource planning as power plant siting has grown more difficult and the costs of peak power have increased. Through development of DR capability, utilities can complement existing energy efficiency programs with a set of offerings that provide, at a minimum, 1) enhanced reliability, 2) cost savings, 3) reduced operating risk through resource diversification, and 4) increased opportunities for customers to manage their electric bills. DR resources are usually grouped into two types: 1) load-curtailment activities where utilities can “call” for load reductions; and 2) price-based incentives which use time-differentiated and/or dispatchable rates to shift load away from peak demand periods and reduce overall peak-period consumption. Interest in both types of DR activities has increased across the country as fuel input prices have increased, environmental compliance costs have become more uncertain, and investment in overall electric infrastructure is needed to support new generation resources. The mechanisms that utilities may use to achieve load reductions can range from voluntary curtailments to mandatory interruptions. These mechanisms include, but are not limited to:
Direct load control by the utility using radio frequency or other communications platforms to trigger load devices connected to air conditioners, electric water heaters, and pool pumps;
Manual load curtailments at commercial and industrial (C&I) facilities, including shutting off production lines and dimming overhead lighting;
Automated DR (“Auto-DR”) technologies utilizing controls or energy management systems to
reduce major C&I loads in a pre-determined manner (e.g., raising temperature set points and reducing lighting loads); and
Behavior modifications such as raising thermostat set points, deferring electric clothes drying
in homes, and reducing lighting loads in commercial facilities. D.3. Rationale for Demand Response DR alternatives can be implemented to help ensure that a utility continues to provide reliable electric service at the least cost to its customers. Specific drivers often cited for DR include the following:
Ensure reliability—DR provides load reductions on the customer side of the meter that can help alleviate system emergencies and help create a robust resource portfolio of both demand-side and supply-side resources that meet reliability objectives.
Reduce supply costs—DR may be a less expensive option per megawatt than other resource alternatives. DR resources compete directly with supply-side resources in many regions of the country. Portfolios that help lower the increase in customers' expenditures on electricity over time represent an increasingly important attribute from the perspective of many energy customers.
Manage operational and economic risk through portfolio diversification—DR capability
is a resource that can diversify peaking capabilities. This creates an alternative means of meeting peak demand and reduces the risk that utilities will suffer financially due to transmission constraints, fuel supply disruptions, or increases in fuel costs.
Provide customers with greater control over electric bills –DR programs would allow
customers to save on their electric bills by shifting their consumption away from higher cost hours and/or responding to DR events. The ability to manage increases in energy costs has increased in importance for both residential and commercial customers. Standard residential and commercial tariffs provide customers with relatively few opportunities to manage their bills.
South Carolina's Energy Future, ACEEE
116
Address legislative/regulatory interest in DR—While South Carolina has does not yet have any regulatory or legislative mandates on DR, Renewable Portfolio Standards (RPS) or Smart Meter/Smart Grid, it has completed Regulatory Consideration of EPACT 1252.
DR is gaining greater acceptance among both utilities and regulators in the United States. A 2006 FERC survey found that 234 “entities” were offering direct load control programs and the FERC’s assessment noted that “there has been a recent upsurge in interest and activity in DR nationally and, in particular, regional markets” (FERC 2006).58 The recent proliferation of DR offerings has been promoted in part by utilities hoping to reduce system peaks while offering customers more control over electric bills and in part by regulators. Although federal legislation has not been the driver behind the trend, it is one of many indications, at all levels of government and industry, of the growing support for DR.59 Many states experience significant reductions in peak demand from Demand-Side Management (DSM) programs (which include DR programs). Regulatory filings show that California experienced 495 MW in peak demand reductions in 2005 (1% of total peak demand); New York experienced 288 MW reductions in 2005 (1% of total peak demand); and Texas experienced 181 MW in reductions in 2005 (1% of total peak demand) from DSM programs. These results are annual values that do not consider the cumulative (i.e., year-to-year) impacts that accrue over the lifetimes of the conservation measures. Therefore, cumulative percentage reductions in peak demand are much higher than the annual figures stated. D.4. Assessment Methods As has been shown in numerous other jurisdictions across America, well-designed DSM programs incorporating DR strategies represent an effective and affordable option for reducing peak demand and meeting growing demand for electricity. This effort estimated conservative peak demand reduction for South Carolina using local energy use characteristics, demographics, and forecast peak demand, assuming relatively basic DR strategies comprising responsive reductions in demand. The following research approach was used to conduct the analysis:
Review of existing information regarding South Carolina’s customer base including:
o Customer counts and average annual energy consumption by market segment; o Forecasts of future energy consumption and customer counts by market segment; o Previous DSM planning and potential studies.
Review of additional publicly-available secondary sources including previous studies relevant
to the current effort completed by Summit Blue in other regions as well as entities in other jurisdictions.
Development of baseline profiles for residential and commercial customers. These profiles
include current and forecast numbers of customers by market segment and electricity use profiles by segment.
58 The FERC report uses the term “entities” to refer to all types of electric utilities, as well as organizations such as power marketers and curtailment service providers. 59 The federal Energy Policy Act of 2005 (EPAct) directs the Secretary of Energy to “identify and address barriers to the adoption of demand response programs,” and the Act declares a U.S. policy in support of “State energy policies to provide reliable and affordable demand response services.” EPAct directed FERC to conduct its survey of DR programs and also directed the U.S. Department of Energy to report on the benefits of DR and how to achieve them (DOE 2006). Separately, a National Action Plan for Energy Efficiency, which advocates DR and other efficiency efforts, was developed by more than 50 U.S. companies, government bodies, and other organizations, including co-chairs Diane Munns, President of NARUC and Jim Rogers, President and CEO of Duke Energy (EPA 2006). Other utility industry members of the Leadership Group included Southern Company, AEP, PG&E, TVA, PJM Interconnection, ISO New England, and the California Energy Commission.
South Carolina's Energy Future, ACEEE
117
Incorporation of ACEEE baseline data and reference case into analysis.
Obtaining state-level data when possible and estimation of information for the State of South Carolina, when state-level data was not available.
Development of a spreadsheet approach for estimating peak demand reduction potential
associated with the DR programs/technologies deemed to be most applicable to South Carolina. Estimates are developed for three scenarios—low, medium and high case scenarios.
Conference calls with ACEEE staff and industry professionals to discuss assessment
processes and legislative, regulatory, and other factors specific to the State of South Carolina.
Incorporation of all sources of information and references into report, noting on each figure
the source of the information.
Revision of draft report based on comments from ACEEE, industry specialists and utility commenters.
D.4.1. State of South Carolina - Background A sound strategy for development of DR resources requires an understanding of South Carolina’s demand and resource supply situation, including projected system demand, peak-day load shapes, and existing and planned generation resources and costs. South Carolina utilities service over 2.4 million customers, can provide a system peak capacity of over 25,000 MW, and will generate over 81.95 million megawatt hours of electricity in 2009. The average age of generating facilities in SC, weighted by capacity, is June 1982 (EIA 2009a). Table D.2. gives a breakdown of generating capacity in SC by age and fuel type.
Table D.2. 2007 Generating Capacity In South Carolina, by Primary Fuel Type
Source: Summit Blue Consulting, LLC (EIA 2009a) Although South Carolina’s generating capacity is strongly dominated by facilities using fossil fuels, the majority of the energy produced on an annual basis is provided by nuclear based facilities (see Figure D.2
South Carolina's Energy Future, ACEEE
118
Figure ).
South Carolina's Energy Future, ACEEE
119
Figure D.2. Electric Power Generation by Primary Energy Source, 2007 (MWh)
Nuclear, 51%
Coal, 40%
Natural Gas, 6%
Other Gases, <1%
Hydroelectric, 1% Other Renewables, 2%
Electricity demand in South Carolina has fluctuated little in recent years, with total consumption growing only slightly over the past decade. Total retail sales in 2007 were only 7.7% greater than that in 2002; 81.95 billion kWh up from 76.1 billion kWh. This is an aggregate figure for all sectors, including industrial, commercial and residential. South Carolina has been, and likely will continue to be, a net exporter of energy. In 2007, in-state generation provided all of South Carolina’s total retail sales, plus a surplus of approximately 16%, or roughly 14.1 billion kWh (ACEEE South Carolina Reference Case). Table D.3 gives a breakdown of energy use per customer (UPC) in SC, segregated by sector. For comparison, the same data is also given for the entire US.
Table D.3. 2007 Average Use per Customer in South Carolina
Year Region
Residential Use per
Customer (MWh/yr)
Commercial Use per
Customer (MWh/yr)
Industrial Use per
Customer (MWh/yr)
Transportation Use per
Customer (MWh/yr)
Total Use per
Customer (MWh/yr)
2007 SC 14.53 64.4 6,577.7 NA 34.5 2007 US Total 11.23 76.9 1,294.9 10,896.8 26.5
2007 SC Percent above national average
29% -16% 408% NA 30%
Source: EIA (2009a) The comparison of UPC shown in Table D.3Table D., above, underscores the fact that South Carolina may present an above average potential for savings from demand side management programs. In particular, the industrial sector, with an average UPC of 400% above the national rate, may prove particularly viable for DR. Also of note, the average UPC for the residential sector in SC is 29% above the national average. This is especially striking given South Carolina’s particularly mild climate, relative to the rest of the nation. Figure D.2 displays the distribution of electricity sales in South Carolina. The four largest electricity retailers in South Carolina are the following entities, with percent contribution in parentheses:
South Carolina's Energy Future, ACEEE
120
South Carolina Elec. & Gas (27.0%) Duke Energy Corp., South Carolina (26.8%) SC Public Service Authority (Santee Cooper)—direct sales only (14.1%) Progress Energy (previously Carolina Power & Light Co) (8.3%) (EIA 2009).
Beyond these four providers, local cooperatives, municipally owned utilities and a single IOU make up the rest of South Carolina’s energy retailers. None of these additional providers contribute more than 2% of the total sales in the state. Of the state’s electrical cooperatives, many source their power from the South Carolina Public Service Authority.
Figure D.2. Distribution of Electricity Sales in South Carolina
IOU Sales, 62%
Coop Sales, 18%
Municipal Sales, 5%
Santee Cooper, 14%
Duke, 27%
Lockhart, <1%
Progress, 8%
SCE&G, 27%
Source: ACEEE South Carolina Reference Case
D.4.2. Assessment of Utility DR Activities This section outlines DR programs, by utility. Progress Energy (Carolina Power & Light) (PEC) PEC provides a real-time pricing tarriff available for large customers (1,000 kW). Participants are notified, a day in advance, of the hourly energy prices for the following day, and are charged or credited at these rates for any usage above or below a "customer baseline load" (CBL) that is based on their historical use (DOE 2009). PEC has a relatively new Residential DLC program, “EnergyWise.” It is a residential load-control program that enables Progress Energy Carolinas to remotely adjust the air-conditioning units of voluntary customer participants during periods of peak electricity demand, particularly on the hottest summer afternoons, when demand is at its highest of the year. Customers participating in EnergyWise will receive an annual $25 bill credit as an incentive. Progress Energy has approved a new Commercial, Industrial, Government (CIG) DR program. The program is designed to provide education and incentives to CIG customers to encourage participation in voluntary load management. As part of the program, Progress Energy will install communication technologies that will enable PEC to remotely control and monitor a variety of electrical equipment during periods of peak demand.
South Carolina's Energy Future, ACEEE
121
Progress Energy announced on August 12, 2009 that it has applied for $200 million in federal infrastructure funds in support of the company's investment in an electric Smart Grid in the Carolinas and Florida. Duke Energy For residential customers, Duke Energy offers a voluntary “Residential Power Manager Program” that allows utility control of air conditioning loads and is backed by a $32/year incentive ($8/mo for 4 months). This program is also used as a gateway for Duke Energy to offer free, in-home energy audits to help inform home owners of additional energy saving opportunities. PowerShare, Duke’s customized DR program for large commercial and industrial customers, offers incentives based on a time-of-use planning and curtailment of energy usage. Duke Energy offers its large commercial customers the On-Site Generation Service Program, which targets customers that do not currently own back-up generation but would like to. Duke will install, own, and operate new generators (300 kW or larger) for participants willing to let the company use them in times of grid stress or high wholesale prices. There is a monthly service fee for this rate based on the levelized cost to own and operate the equipment (DOE 2009). Real time pricing is available to Duke Energy's large customers through its SC Hourly Pricing for Incremental Load rate schedule. Customers are notified of the hourly energy prices for the following day. Participants are alternatively credited or charged, based on the hourly price, for usage below or above a pre-determined customer baseline load profile (DOE 2009). In the last year, Duke has also started the process of selecting long-term partners—most notably Cisco Systems, Convergys, and Ambient—to help pull together its first full size Smart Grid deployment. However, South Carolina is not at the top of Duke’s Smart Grid site options. First will be Indiana and Ohio, totaling roughly 1.5 million smart meters, followed later by North Carolina, South Carolina, and Kentucky (SmartGrid News 2009). With a total planned investment of $1 billion, Duke Energy is pursuing a 5-year path to develop smart grid infrastructure across their service territory (Convergys 2009). In an effort to accelerate that timeline, Duke has also made at least 2 requests for aid from Federal stimulus funds. In August 2009, Duke requested $200 million for its smart meter programs in Indiana and Ohio, and another $14 million specifically for SG demonstration projects in North and South Carolina (Duke 2009a). Although largely driven by basic energy efficiency programs, within four years Duke Energy hopes that the combined savings from EE and DR programs will displace the need for 1,700 MW of capacity, or about 745,000 MWh of production. As the results from these programs are realized, Duke specified that it plans to retire older coal plants, significantly reducing their net, system-wide air emissions (Duke 2009b). South Carolina Electric & Gas Co. SCE&G’s DR programs focus on Time-of-Use (TOU) rates to customers. They offer TOU rates to residential (Rate 5), commercial (Rate 21 for small commercial and Rate 24 for large commercial) and industrial customers. The voluntary residential TOU rate requires contracts not less than one year, and is said to not be a particularly popular program. Industrial customers are charged a higher rate for use over a certain amount. (Rusty Smith, Customer Service Representative, Personal Communication, October 26, 2009.) SCE&G announced a comprehensive DSM program in June 2009 and is expected to be fully operational by the spring of 2010. This effort will include a portfolio of nine DSM programs, including one DR program - a residential in-home “Energy Information Display.”
D.4.3. Assessment of Current State Policies Affecting DR Many states have put in place renewable portfolio standards (RPS) to ensure that a minimum amount of renewable energy is included in the portfolio of the electricity resources serving a state. Many RPS include demand side options among the means by which the standards can be met. However, as of 2009, South Carolina has not proposed adopting a RPS (EIA 2009e). Section 1252 of the Federal Energy Policy Act of 2005 (EPACT) includes demand side management provisions (in the form of a new PURPA Standard on Demand Response and Advanced Metering) and directed States and other bodies with authority over utilities to determine whether utilities under their jurisdiction to implement such. In August 2007, the South Carolina Public Service Commission decided not to adopt PURPA Standard 14 (“Time-Based Metering and Communications”) as enacted in EPACT. In its August 2007 Order, the Commission stated that all regulated utilities within the state already offer time-based rates. In the same Order, however, the Commission found that there is a “conspicuous lack of focus” on residential and commercial smart metering, which may be due to a lack of awareness of the “availability and capability” of smart meters. As a result, it directed utilities to continue to make smart meters available to all customers and to propose within 180 days a campaign to educate consumers about smart metering. In February 2008, South Carolina Electric & Gas Company, Duke Energy Carolinas, and Progress Energy Carolina complied with the August 2007 Order and filed their “communication plans.” Beyond federal legislation, there appears to be no additional DR activity at the State level. D.4.4. Energy and Peak Demands Use of energy in South Carolina is distributed to end use categories as follows: 36% residential, 27% commercial, and 37% industrial sectors (see Figure D.3).
Figure D.3. 2007 Energy Sales in South Carolina, by Sector
Source: ACEEE South Carolina Reference Case
In 2007, the total summer peak load was 11,901 MW and is projected to grow an average of 1.01% per year through 2025. Figure D.4 displays peak demand by sector. In 2007, residential peak demand was estimated to be 7,214 MW (43%); commercial was 4,435 MW (27%); and industrial was 4,950 MW (30%).
South Carolina's Energy Future, ACEEE
123
Figure D.4. Peak Demand by Sector in South Carolina (MW)
Source: ACEEE Reference Case for South Carolina
D.4.5. Smart Grids and Advanced Metering Infrastructure (AMI) The EPACT provisions for DR and Smart Metering have lead to a number of states and utilities piloting and implementing a Smart Grid, or sometimes referred to as Advanced Metering Infrastructure (AMI). Smart Grid is a transformed electricity transmission and distribution network or "grid" that uses robust two-way communications, advanced sensors, and distributed computers to improve the efficiency, reliability and safety of power delivery and use. For energy delivery, the Smart Grid has the ability to sense when a part of its system is overloaded and reroute power to reduce that overload and prevent a potential outage situation. The end user is equipped with real-time communication between the consumer and utility allowing optimization of a consumer’s energy usage based on environmental and/or price preferences (for example, critical peak pricing and time of use rates). AMI provides:
Two-way communication between the utility and the customer through the customer’s smart meter.
More efficient management of customer outages (location, re-routing). More accurate meter reading (minute, 15 minute intervals). More timely collection efforts (real time). Improved efficiency in handling service orders. More detailed, timely information about energy use to help customers make informed energy
decisions (real time). Ability to reduce peak demand. More innovative rate options and tools for customers to manage their bills.
Smart Energy Pricing provides:
Incentives to customers to shift energy away from critical peak periods The ability to for customers to save on their electricity bills. Lower wholesale prices for capacity and transmission—in the longer term. Improved electric system reliability, as demand is moderated. Potential to defer new transmission and generation.
The Smart Grid is comprised of multiple communication systems and equipment, which interoperability is crucial. Not all communication protocols are applicable to every utility’s geography; therefore, pilots are essential in testing the equipment and communication software for various geographies. Furthermore, the identification of those geographic regions with the best return on investment during a pilot will aid the staged implementation plan. Standards are continuing to be researched through organizations including: 1) IntelliGrid—Created by the Electric Power Research
South Carolina's Energy Future, ACEEE
124
Institute (EPRI); 2) Modern Grid Initiative (MGI) is a collaborative effort between the U.S. Department of Energy (DOE), the National Energy Technology Laboratory (NETL), utilities, consumers, researchers, and other grid stakeholders; 3) Grid 2030—Grid 2030 is a joint vision statement for the U.S. electrical system developed by the electric utility industry, equipment manufacturers, information technology providers, federal and state government agencies, interest groups, universities, and national laboratories; 4) GridWise—a DOE Office of Electricity Delivery and Energy Reliability (OE) program; 5) GridWise Architecture Council (GWAC) was formed by the U.S. Department of Energy; and 6) GridWorks—A DOE OE program. Principal benefits of Smart Grid technologies for DR include increased participation rates and lower costs. In 2009, Dominion plans to deploy 200,000 smart meters as part of a large demonstration program of smart grid technology in urban and rural areas of Dominion's service territory. Dominion expects to improve customer service and business operations through advanced system control, real-time outage notification, and power quality monitoring. As part of this program, Dominion is deploying a number of smart thermostats for a residential critical peak pricing pilot during the summer of 2008. Dominion will measure customer responsiveness to changing energy prices and the impact on energy demand during peak usage periods (Utility Products 2008). These developments in technology allowing real time signaling and automated response will improve DR capabilities. However, existing technology exists for successful DR implementation and it is important to point out that there are no technology obstacles to effective DR. D.5. Assessment of DR Potential in South Carolina This section examines and quantifies DR potential in South Carolina. The first section outlines the general DR program categories, while the following sections outline the DR potential in the residential, commercial /industrial, and backup generation sectors. Then, issues surrounding rate pricing are discussed, even though benefits from this form of DR are not quantified in this analysis. A summary of DR potential in South Carolina follows, and then the section concludes with a discussion of the DR potential results obtained in other studies. D.5.1. Demand Response Program Categories For the purposes of assessing DR alternatives, the following programs could be employed in South Carolina to achieve the DR potential we outlined in this report: Resource Category Characteristics Direct Load Control (DLC)
Direct load control (DLC) programs have typically been mass-market programs directed at residential and small commercial (<100 kW peak demand) air conditioning and other appliances. However, an emerging trend is to target commercial buildings with what has become known as Automated Demand Response or Auto-DR. Increased use and functionality of energy management systems at commercial sites and an increased interest by commercial customers in participating in these programs is driving growth in automated commercial curtailment in response to a utility signal. The common factor in these programs is that they are actuated directly by the utility and require the installation of control and communications infrastructure to facilitate the control process.
Callable Customer Load Response
With this type of program, utilities offer customers incentives to reduce their electric demand for specified periods of time when notified by the utility. These programs include curtailable and interruptible rate programs and demand bidding/buyback programs. Curtailable and interruptible rate programs can be used as “emergency demand response” if the advanced notice requirements are short enough. All customer load response programs require communications protocols to notify customers and appropriate metering to assess customer response.
Scheduled Load Control
This is a class of programs where customers schedule load reductions at pre-determined times and in pre-determined amounts. A variant on this theme is thermal energy storage which employs fixed asset technology to reduce air conditioning loads consistently during peak afternoon load periods.
South Carolina's Energy Future, ACEEE
125
Time-Differentiated Rates
Pricing programs can employ rates that vary over time to encourage customers to reduce their demand for electricity in response to economic signals—in some cases these load reductions can be automated when a price trigger is exceeded. An example is a critical peak price which is “called” by the utility or system operator. In response to this critical price, residential customers can have AC cycling or temperature setbacks automatically deployed. Similar automated responses can be deployed by commercial customers. These rate programs are not analyzed for this assessment, but are further discussed in a section later in this Report, “Pricing and Rates.”
D.5.2. DR for Residential Customers Air conditioner and other appliance direct load control (DLC) is the most common form of non-price-based DR program in terms of the number of utilities using it and the number of customers enrolled. According to FERC’s 2006 assessment of DR and advanced metering, there are 234 utilities (including municipalities, cooperatives, and related entities) with DLC programs across the United States. Approximately 4.8 million customers are participating in DLC programs across the country (FERC 2006). The prominent and growing role of air conditioning in creating system peaks makes it a high-profile candidate for DR efforts. The advances in DR technology that make AC load management economically viable make AC load control a high-priority program—one that has been proven reliable and effective at many utilities. Pool pumps are also a relatively easy and non-disruptive load that can be controlled for DR purposes. Residential Control Strategies There are two basic types of control strategies: AC cycling and temperature offset. AC cycling limits ACs being on to a certain number of minutes than they otherwise would have been on. Some techniques limit ACs to being on for 50% of the minutes they would otherwise have been on. A temperature offset increases the thermostat setting for a certain period of time, for a certain number of degrees higher than it would have otherwise been set. This essentially causes the AC compressor to cycle as the temperature set-back reduces the AC demand. Sequential thermostat setbacks, i.e., one degree in a hour one, two degrees in hour two, three degrees in hour three, and four degrees in hour four can mimic an AC cycling strategy. Cycling strategies have evolved where an optimal impact on peak kW demand may be obtained by varying the cycling time across the hours of an event. For example, there may be one hour of pre-cooling followed by 33% cycling in the first hour, 50% cycling in the second hour, 66% cycling in the third hour and dropping back to 33% in the fourth hour. Strategies like this have been deployed in pilot programs at Progress Energy Carolinas (PEC) and in PSE&G’s MyPower pilot program. This type of strategy requires that forecasters accurately predict the hour(s) in which the peak system demand will occur. Assessment of DR Potential in Residential Homes in South Carolina For South Carolina, estimates for possible load reductions for residential housing units were obtained by applying the methodology displayed in Figure D.5.
South Carolina's Energy Future, ACEEE
126
Figure D.5. Residential Peak Load Reduction
The figure shows how load reductions and participations rates are applied to housing data. Items listed in rectangular shapes are factual inputs; items in circular shapes are assumptions; and items in parallelogram shapes are results. D.5.3. Load Reductions Recent surveys show that DLC programs are being implemented by a number of utilities. Load impacts are dependent on many variables. The control strategy used, the outdoor temperature, the time of day, the customer segment, ease of and ability to override control, reliability of communication signals, age and working condition of installed equipment, and local AC use patterns all have significant effects on the load impact. Even within a single program, there is variability in impacts across event days that cannot yet be fully explained. Measuring impacts typically requires expensive monitoring equipment and as a result is often done on small sample sizes. Even with this variability, a review of reported impacts does show some general consistencies. As expected, impacts increase as the duty cycle goes up. Table D.4 shows the average reported kW impact based on 20 load control impact studies for programs based on the duty cycle used. These results support the oft-quoted rule-of-thumb that the load impact for 50% duty cycling is 1 kW per customer, which is the impact used in this analysis. However, many homes will experience an impact greater than I kW, especially newer homes.
South Carolina's Energy Future, ACEEE
127
Table D.4 Average Load Impacts by Cycling Strategy for AC DLC Programs Cycling Strategy
Average Load Impact
KW/Customer 33% 0.74 45% 0.81 50% 1.04 66% 1.36
Source: Summit Blue (2007b) Customer type also makes a difference. In a few cases where single-family and multi-family impacts were measured separately, multi-family impacts were 60% of single-family, and thus a 0.6kW load reduction is applied in this analysis for multi-family units (Summit Blue 2007b). Eligible Residential Customers All residential customers with central air-conditioning that live in areas that can receive control signals are considered eligible for the direct load control program. This includes single family and multi-family housing units. Residential accounts without central AC are assumed to have no participation. EIA data estimate that 81% of residences in the Southeast region have central AC. Multi-family housing units often have building tenants which are not the account holders, therefore accounts are often aggregated into buildings. Some accounts have a master meter for the entire building, including tenants. Some accounts are for the “common” building loads (i.e., those loads that are part of a building account such as elevators, A/C (if applicable), lobby lighting, etc.), but individual tenants in these buildings have their own accounts. Therefore, multi-family units often have fewer units with central AC than single family. However, in this analysis, due to data constraints, 81% was applied to both single and multi-family customers, and leads to a more conservative estimate of impacts. Residential Participation Rates Participation rates experienced in AC DLC programs vary across utilities typically from 7% of eligible customers to 40%, depending upon the effort made in maintaining and marketing the program (Summit Blue 2007a). The utilities with the low levels of participation had essentially stopped marketing the program in recent years. Utilities with programs with sustained attention to customer retention or recruitment show higher participation rates than utilities with one-time or intermittent promotion. In Maryland, BG&E’s Demand Response Service program anticipates a residential participation rate of 50%, or approximately 450,000 controlled units (BGE 2007). The pilot phase of this program was conducted from June 1 through September 30, 2007, and 58% received a “smart” load control switch, and 42% had a “smart” thermostat installed (BGE 2007). One study examined 15 AC DLC programs nationwide and found an average of 24% participation for eligible customers (Summit Blue 2008a).60 For this analysis, 3 typical yet conservative scenarios were used: a low scenario of 15% for eligible customers; a medium scenario of 25%; and a high scenario of 35%. D.5.4. Results Table D.5 displays the input data and results. In summary, the results for residential programs reveal that a medium scenario reduction of 183 MW is possible by 2015 (with 110 MW possible by the low
60 Programs where participants are included in a program unless they chose to “opt-out” experience much higher participation rates. One utility is proposing a “hybrid” program for new construction, where existing customers must opt-in and new construction customers must opt-out. This program assumes that 70% of new construction customers will enroll in the initial years, and 80% in later years (Summit Blue 2008b).
South Carolina's Energy Future, ACEEE
128
scenario, and 256 MW by the high). By 2020, 395 MW is achievable through the medium scenario (with 237 MW possible by the low scenario, and 553 MW by the high).
Table D.5. Potential Load Reduction from AC-DLC in South Carolina Residential Homes, in years 2015 and 2020
INPUTS 2015 2020 Residential Peak Demand (MW) 7,384 7,881 Residential Households (in thousands) a: Total 1,924 2,082 Single Family 1,630 1,765 Multi-Family 293 316 Eligible Residential Customers: Single and Multi-Familyb 81% Load Reduction per AC-DLC per Single-Family Unit (kW) 1.0 Load Reduction per AC-DLC per Multi-Family Unit (kW) 0.6 DR Participation Rates of eligible customers: Low Scenario 15% Medium Scenario 25% High Scenario c 35% RESULTS 2015 2020 Residential Potential DR Load Reduction (MW): Low Scenario 110 237 Medium Scenario 183 395 High Scenario 256 553 Notes: a. Residential customers reflect number of housing units, as reported from Economy.com. b. Analysis assumes residences with central AC are eligible. Residential accounts without central AC are assumed to have no participation. Central AC percents obtained from EIA estimate for the Southeast Region. c. Higher participation than applied in the High Scenario is possible through design of program features, such as “opt-out” participation where participants are included in a program unless they chose to “opt-out”.
Figure D.6 shows the resulting residential load shed reductions possible for South Carolina, from year 2010, when load reductions are expected to begin, through year 2025.
Figure D.6. Potential Residential Load Shed in South Carolina (Medium Scenario)
D.5.5. Room Air Conditioners Other DR residential programs could involve tapping into the potential for callable load reductions from room air conditioners. At least one prominent DR provider is exploring the possibility of having manufacturers of room AC units embedding a home-area-network communication device into new units. This would enable cycling of room air conditioners without the need to install radio frequency
South Carolina's Energy Future, ACEEE
129
load switches commonly used for residential direct load control applications. Callable load reductions from room air conditioners would provide a significant boost to load control capability and these reductions would be dispatchable in less than ten minutes. Some utilities are projecting to add a large number of new room air conditioners in the next five to ten years. The additional participation of a fraction of these room AC units could provide a substantial increase to the AC DLC program. D.5.6. Other Appliances Based on the experiences of other utilities, expanding the equipment controlled to other equipment beyond AC units can produce additional kW reductions. This could include electric hot water heaters and pool pumps. However, the saturation of electric hot water heaters is lower than for air conditioning, and control of hot water heaters generally produces only about one-third the load impact of air conditioners, especially in the summer when South Carolina utilities would most likely be calling DR events. D.6. Commercial and Industrial DR Potential in South Carolina Appropriate commercial sector DR programs will vary according to customer size and the type of facility. Direct load control of space conditioner equipment is a primary DR strategy intended for small commercial customers (e.g., under 100 kW peak load), although TOU rates combined with promising new thermal energy storage technologies could prove an effective combination. Mid-to-large commercial customers and smaller industrial customers could best be targeted for a curtailable load program requiring several hours of advanced notification or, where practical, for an Auto-DR program that can deliver load reductions with no more than ten minutes of advance notice. Thermal energy storage and other scheduled load control programs may also be applicable for some larger buildings or water pumping customers. In this assessment of DR potential, the focus is on the use of direct load control and curtailable load response programs. Studies have shown that pricing programs, specifically dispatchable pricing programs such as critical peak pricing (CPP) programs can provide similar impacts. These pricing programs are discussed in Section 3.2. However, for the purposes of this assessment, a focus on these load response programs is believed to be able to fully represent the DR potential, even though pricing programs could be used instead of these curtailable load programs with equal, or in some cases, greater efficiency. The following DR program descriptions apply to both commercial and industrial customers:
Small business direct load control (air conditioning)—Small commercial customers (under 100 kW peak load) account for a majority of customer accounts but typically only about one-quarter of total commercial load. Due to the nature of small businesses, particularly their small staffs for which energy management is a relatively low priority, it is not practical to rely on active customer response to load control events. Thus, small businesses may best be viewed in the same way as residential customers for purposes of DR.
Curtailable load program—This program would be applicable to commercial and industrial
customers willing to commit to self-activated load reductions of a minimum of perhaps 50 kW in response to a notice and request from a utility. The minimum curtailment threshold is designed to improve program cost-effectiveness by ensuring that recruitment and technical assistance costs are used for customers who can deliver significant load reductions. Advanced notice requirements would likely be two hours— long enough to allow customers an opportunity to prepare but short enough to maintain the DR resource as a viable resource that can be dispatched by operations staff. Enabling technologies would vary greatly, but utilities would educate customers about alternatives and could work with equipment vendors to facilitate equipment acquisition and installation. Incentives would be paid as capacity payment (in $/kW-month) or a discount on the customers’ demand charges. Utilities could also offer a voluntary version of the program to attract greater participation. Customers would not commit to load reductions, but incentives would be lower and would be paid only on the reductions achieved during curtailment events.
South Carolina's Energy Future, ACEEE
130
Automated demand response (Auto-DR)—This program would be marketed to facilities such as high-rise office buildings and large retail businesses that have energy management and control systems (EMCS) that monitor and control HVAC systems, lighting, and other building functions. The benefits of Auto-DR over curtailable load programs include customer loads curtailments with as little as ten minutes notice and greater assurance that customers will reduce loads by at least their contracted amount. Incentives would be paid as either capacity payments or demand charge discounts, but would be greater than for curtailable load program participants due to the additional technology investment that may be required and the allowance of curtailments on relatively short notice. UTILITIES would offer extensive technical assistance in setting up Auto-DR capability and would potentially provide financial assistance as well for customers making long-term commitments.
Scheduled load control programs (including thermal energy storage)—Scheduled load control
can help reduce utility peak demand, especially through shifting of space cooling loads enabled by thermal energy storage technologies. Large-customer TES systems could be promoted along with customer commitments to reduce operation of chillers or rooftop air conditioners during specified peak hours. Customers’ return on investment can be increased by encouraging migration to a TOU rate, which would offer a rate discount for many of the hours that TES systems are recharging cooling capacity. Water pumping systems are typically good candidates for scheduled load control programs and utilities can investigate opportunities in the municipal water supply and irrigation sectors. Other, less traditional, opportunities may also be available, such as the leisure/resort industry’s limiting recharging of electric golf carts to off-peak hours.
automatically shut off electrical circuits in response to the circuits exceeding pre-set voltage thresholds specified by the utility. Use of UFRs is a valuable addition to a DR portfolio because the load response is both automatic and virtually instantaneous. UFRs can best be integrated into another DR program where participants are already engaging in load curtailment activities. It is expected that some customers who might consider participating in a DR program will not be willing to allow loads to be controlled via UFR since they would not receive any advanced notice. Incentives would also need to be greater to attract participants and provide acceptable compensation. However, the benefits of UFRs warrant their consideration as part of a utility’s proposed DR portfolio.
D.6.1. Commercial DR Potential in South Carolina To estimate potential load reductions for commercial units, a straight-forward approach of applying load shed participation rates and curtailment rates directly to commercial peak demand. First, assumptions were made on the percentage of commercial customers who are willing to participate in DR programs. One study applied commercial participation rates ranging from 11% to 48% for commercial customers (Summit Blue 2008a). Table D.6 displays participation rates for various types of commercial customers, disaggregated into two different peak demand categories (<300 kW and >300 kW).
Source: Summit Blue (2008a) Because facility-specific data was not available for South Carolina, three conservative scenarios for participation rates were applied. A medium scenario load participation rate of 20% was applied as it appears to be an average participation rate found by utilities with DR programs in place. A low scenario of 10% and a high scenario of 30% are applied. Then, assumptions were made for curtailment rates, based on existing estimates of the fraction of load that has been shed by commercial customers enrolled in event-based DR programs callable by the utility. Table D.7 displays curtailment rates for various types of commercial customers, which range from 13% to 43%. For the purposes of this analysis, 3 conservative scenarios were applied: a low curtailment rate of 15%, a medium curtailment rate of 20%, and a high rate of 25%.
Table D.7. Examples of Commercial Curtailment Rates Customer Segment Average Curtailment Rate Office Buildings 21% Hospitals 18% Hotels 15% Educational Facilities 22% Retail 18% Supermarkets 13% Restaurants 17% Other Government Facilities 38% Entertainment 43%
Source: Summit Blue (2008a) Table D.8 displays the input data and results. In summary, the commercial sector results reveal that a medium scenario reduction of 97MW is possible by 2015 (with 36 MW possible by the low scenario, and 182 MW by the high). By 2020, 210 MW is achievable through the medium scenario (with 79 MW possible by the low scenario, and 395 MW by the high).
South Carolina's Energy Future, ACEEE
132
Table D.8. Potential Commercial Load Shed in South Carolina, in Years 2015 and 2020 INPUTS 2015 2020 Commercial Peak Demand (MW) 4,849 5,260 Load Shed Participation Rates: Low 10% Medium 20% High 30% Curtailment Rates: Low 15% Medium 20% High 25% RESULTS `-–2015 2020 Commercial DR load reductions (MW): Low 36 79 Medium 97 210 High 182 395
Figure D.7 shows the resulting commercial load shed reductions possible for South Carolina, from year 2010, when load reductions are expected to begin, through year 2025.
Figure D.7. Potential Commercial Load Shed in South Carolina (Medium Scenario)
DR programs that move towards the auto-DR concept can typically provide some load sheds that only require ten-minute notification or less. While some customer surveys have shown that most customers would prefer longer notification periods, many of these customers have not put in place the technologies to automate DR both load shed within a facility and the startup of emergency generation (ConEd 2008). The value of DR and the design of DR programs should take into account system operations. Ten-minute notice DR can be valuable in helping defer some investment in T&D. While not all customers may choose to provide ten-minute notice response, there should be an increasing number of customers that will provide this type of response in the future and programs should be designed to acquire this resource. This type of DR is often a more valuable form of DR with higher savings for the utility, and utilities are often ready to pay up to twice as much to customers for this short-notice responsiveness.
South Carolina's Energy Future, ACEEE
133
D.6.2. Industrial DR Potential in South Carolina A similar analysis was conducted for the industrial sector: load shed participation rates and curtailment rates were applied to industrial peak demand. A previous study found industrial participation rates to vary from 25% for facilities <300 kW, to 50% for >300 kW (Summit Blue 2008a). For this study, the following rates were applied to participation: Low (20%); Medium (30%); and High (40%). Previous studies have found industrial curtailment rates to vary from 17% (Quantec 2007), to 30% (Consortium 2004), to 75% (Nordham 2007), resulting in a mean of 41%. The following conservative rates were applied to curtailment for this study: Low (20%); Medium (30%); and High (40%). With these participation rates and potential load curtailments, the high load reduction potential for the overall industrial sector loads is 16% (i.e., 40% participation and 40% of that load participating). Table D.9 displays the input data and results. In summary, the industrial sector results reveal that a medium scenario reduction of 214MW is possible by 2015 (with 95 MW possible by the low scenario, and 380 MW by the high). By 2020, 430 MW is achievable through the medium scenario (with 191MW possible by the low scenario, and 764 MW by the high).
Table D.9. Potential Industrial Load Shed in South Carolina, INPUTS 2015 2020 Industrial Peak Demand (MW) 4,751 4,775 Load Participation Rates: Low 20% Medium 30% High 40% Curtailment Rates: Low 20% Medium 30% High 40% RESULTS 2015 2020 Industrial DR load reductions (MW): Low 95 191 Medium 214 430 High 380 764
Figure D.8 shows the resulting industrial load shed reductions possible for South Carolina, from year 2010, when load reductions are expected to begin, through year 2025.
Figure D.8. Potential Industrial Load Shed in South Carolina (Medium Scenario)
South Carolina's Energy Future, ACEEE
134
The largest load reductions, and often the most cost-effective, may be found in South Carolina’s largest commercial and industrial customers. Data concerning these largest facilities were not available in South Carolina so estimates are not quantified separately from the industrial analysis given in the previous section. D.6.3. Commercial and Industrial Backup Generation Potential in SC Emergency backup generation is a prominent component of a callable load program strategy. Some of the emergency generators not currently participating in DR programs may not be permitted for use as a DR resource and regulations may further limit the availability of emergency generation for DR. In some cases, backup generators may not be equipped with the start-up equipment to allow the generator to participate in short-term notification programs. Utilities could consider a program to assist customers with equipment specification and set-up to promote DR program participation by backup generators. In some instances, there may be environmental restrictions on emergency generation. Emissions of emergency generation may be regulated, and the future of such regulations may add some uncertainty. However, some areas have been able to have such restrictions lifted during system emergencies. Two approaches can increase the amount of emergency generation in DR programs: 1) facilitating customer-owned generation, and 2) utility ownership of the generation, which is used to provide additional reliability for customers willing to locate the equipment at their facilities. Customer-Owned Emergency Generation To increase customer-owned emergency generation, utilities may assist customers with ownership of grid-synchronized emergency generation. Utilities may offer to pay for all equipment necessary for parallel interconnection with the utility grid, as well as all maintenance and fuel expenses. Once operational, the standby generators can be monitored and dispatched from a utility’s control center, and they can also provide backup power during an outage. An additional benefit to the customer relative to typical backup generation is the seamless transition to and from the generator without the usual momentary power interruption. Utility-owned Emergency Generation A second approach to increasing the availability of emergency generation for DR is by locating generation at customer sites that can be owned by a utility. Through this type of program, the customer receives emergency generation capability during system outages in exchange for paying a monthly fee consisting of both levelized capital costs and operation and maintenance costs. Participants would likely receive capacity payments ($/kW-month) and/or energy payments ($/kWh) in exchange for granting a utility to dispatch the units for a limited number of events and total hours per year. Backup Generation in South Carolina Total South Carolina back-up generation capacity for 2015 is estimated at approximately 961MW.61 Additional analysis revealed that the commercial and industrial back-up capacity, each, is approximately half of the total capacity, 480 MW.62 Assuming a medium scenario that 40% of the total
61 Back-up generation capacity in South Carolina was estimated from form EIA-861 filings submitted by utilities nationwide (EIA 2006). However, only utilities providing approximately one-quarter of total kWh report these numbers. It was assumed that the prevalence and usage of distributed generation in the remaining 75% of utilities is similar. 62 The analysis first determined the back-up generator population nation-wide, and then scaled the data down to the South Atlantic region (CBECS resolution), accounting for proportional differences in building stock nation-wide and region-wide. The
South Carolina's Energy Future, ACEEE
135
backup in South Carolina is available for load shed, then 192 MW of backup generation is available by 2015 and 400 MW is available by 2020 (see Table D.10). The low scenario estimates a 144 MW reduction by 2015 and a 300 MW reduction by 2020. The high scenario estimates a 240 MW reduction by 2015 and a 500 MW reduction by 2020.
Table D.10. Potential Reductions from C&I Backup Generation in South Carolina, in Years 2015
and 2020a INPUTS 2015 2020 Total Backup Generation Capacity (MW) 961 1,001 Backup Generation Potential (%): Low 30% Medium 40% High 50% RESULTS 2015 2020 Potential Reduction from C&I Backup Generation (MW): Low 144 300 Medium 192 400 High 240 500
Figure D.9 shows the resulting commercial and industrial backup generation reductions possible for South Carolina, from year 2010, when load reductions are expected to begin, through year 2025.
Figure D.9. Potential Reductions from C&I Backup Generation
D.6.4. Pricing and Rates In this assessment of DR potential, the focus is on the use of direct load control and curtailable load response programs callable by the utility. Studies have shown that pricing programs, specifically dispatchable pricing programs such as critical peak pricing (CPP) programs can provide similar impacts; however, for the purposes of this assessment, a focus on the these load response programs is believed to be able to fully represent the DR potential, even though pricing programs could be used instead of these curtailable load programs with equal, or in some cases, greater efficiency. New rates may be introduced as part of a DR program, and may include real-time prices, or other time-differentiated rates, for commercial and industrial customers, and a modification of any existing residential time-of-use (TOU) rates. Any new rate structures would be designed to reduce system
region-wide results were then scaled down to South Carolina specifically using the ratio of South Carolina population to regional population.
South Carolina's Energy Future, ACEEE
136
demand during peak periods and provide an opportunity for customers to reduce electric bills through load shifting. Critical peak pricing (CPP) is a viable option for inclusion in a DR portfolio. In FERC’s 2006 survey of utilities offering DR programs (citation below), roughly 25 entities reported offering at least one CPP tariff. However, many of the tariffs were pilot programs only, and almost all of the 11,000 participants were residential customers. The apparent lack of commercial CPP programs is supported by a 2006 survey of pricing and DR programs commissioned by the U.S. EPA (below), which found only four large-customer CPP programs, all of them in California. The pilot programs in California linked the CPP rate with “automated demand response” technologies that provide most of the impact. The CPP rate itself, and the price incentive that it creates, is not the driver behind the load reductions. As stated, rate pricing options were not analyzed in this analysis. Event-based pricing programs achieve impacts very similar to the callable load programs presented above. Pilot studies and tariff evaluations of TOU-CPP programs63 show the load reductions for called events are similar in magnitude to air conditioning DLC programs. This is not surprising in that most TOU-CPP participants use a programmable-automated thermostat to respond to CPP events in a manner similar to a DLC strategy. One difference is that the customer response is less under the control of the program or system operator that could change cycling strategies or thermostat set points across different events or different hours within an event. Similarly, demand-bid programs are simply calls for target load sheds, i.e., those bid into the program. In general, the direct load shed programs seem to provide greater MW of participation and more reliable reductions. However, the use of either TOU-CPP or a demand-bid program represents a point of view or policy position that price should be a centerpiece of the DR effort and should help customers see prices in the electricity markets. From a point of view of simplicity and attaining firm capacity reductions, the direct load shed programs may offer some advantages. Ultimately, the choice between these direct load shed programs and pricing programs may come down to customer preferences and decisions by policymakers on the emphasis of DR efforts. A time-differentiated rate is another option to consider that may not be “callable.” Such rates include day-ahead real-time pricing (RTP), two-part RTP tariffs, and standard TOU rates. Although they are not “callable” in that the rate is generally in effect every day, there may be synergies between time-differentiated rates and callable load programs. In general, an RTP option will result in customers learning how to reduce energy consumption on essentially a daily basis when prices tend to be high (e.g., summer season afternoons and early evenings). Customers do not tend to track exact hourly prices, but they know when prices are likely to be higher (e.g., summer season afternoons with higher prices on hot days).64 The benefits to the customer come from reducing consumption across many summer days when prices are high, rather than a focus on reduction during system event days. In general, the reductions on system peak days are roughly the same as on any summer day when prices are reasonably high. As a result, an RTP option can provide substantial benefits by increasing overall market and system efficiency through shifting loads from high priced periods to periods with lower prices. However, these tariffs may not provide the needed load relief on system-constrained event days.65, 66
63 See PSEGC (2007) and CEC (2005). 64 See evaluations of the hourly pricing experiment offered by ComEd and the Chicago Energy Cooperative performed by Summit Blue Consulting (2003 through 2006). 65 One way to make an RTP tariff more like an event-based DR program is to overlay a critical peak pricing (CPP) component on the RTP tariff where unusually high prices would be posted to customers with some notification period. Otherwise, it is unlikely that the high levels of reduction needed for system-event days would be attained. 66 The complementary of event-based load shed programs with RTP tariffs is assessed in Violette, Freeman & Neil (2006). Updated results are presented in: Violette and Freeman (2007).
South Carolina's Energy Future, ACEEE
137
D.7. Summary of DR Potential Estimates in South Carolina Table D.11 shows the resulting load shed reductions possible for South Carolina, by sector, for years 2015, 2020, and 2025. Load impacts grow rapidly through 2018 as program implementation takes hold. After 2018, the program impacts increase at the same rate as the forecasted growth in peak demand. The high scenario DR load potential reduction is within a range of reasonable outcomes in that it has an eleven year rollout period (beginning of 2010 through the end of 2020), providing a relatively long period of time to ramp up and integrate new technologies that support DR. A value nearer to the high scenario than the medium scenario would make a good MW target for a set of DR activities. The high scenario results show a reduction in peak demand of 1,058 MW is possible by 2015 (6.2% of peak demand); 2,212 MW is possible by 2020 (12.3% of peak demand); and 2,298 MW is possible by 2025 (12.1% of peak demand). The more conservative medium scenario results show a reduction in peak demand of 686MW is possible by 2015 (4.0% of peak demand); 1,435 MW is possible by 2020 (8.0% of peak demand); and 1,493 MW is possible by 2025 (7.9% of peak demand).
Table D.11. Summary of Potential DR in South Carolina, By Sector, for Years 2015, 2020, and
Total DR Potential (MW) 385 807 840 686 1,435 1,493 1,058 2,212 2,298 DR Potential as % of Total Peak Demand
2.3% 4.5% 4.4% 4.0% 8.0% 7.9% 6.2% 12.3% 12.1%
Figure D.10 shows the resulting load shed reductions possible for South Carolina, by sector, from year 2010, when load reductions are expected to begin, through year 2025. Figure D.10. Summary of Potential DR in South Carolina, By Sector, for Years 2015, 2020, and
2025a
These estimates reflect the level of effort put forth and utilities are recommended to set targets for the high scenarios. These estimates include assumptions based on utility experience regarding growth
South Carolina's Energy Future, ACEEE
138
rates, participation rates, and program design, among others, and will adjust accordingly if differing assumptions are made. The assumptions made are believed to be conservative, and reflect minimum achievable DR potential. For example, participation rates for all of the sectors are based on experience in other states, and are based primarily on customer awareness, the ability to have automated response, and the adequacy of reward. If the statewide education program now required in South Carolina promotes DR programs and adequate incentives are offered, then participation rates higher than the medium scenario are entirely realistic. D.8. Comparison of Estimated DR Potential with Results from Other Studies The estimated potential for reductions in peak demand for South Carolina is within a range to be expected for a state with the population and aggregate demand the size of South Carolina’s. Estimates of DR potential in other states show that the values presented here for South Carolina are reasonable: 15% reductions in peak demand in Florida are possible by 2023 (Elliot et al. 2007a), and 13% are possible in Texas, also by year 2023 (Elliot et al. 2007b). DR potential for a utility in New York was estimated to be 9.3% of peak demand in 2017 (Summit Blue 2008a). This finding is similar to that of a recent analysis estimating that peak load reductions from DR in the Southeast will be 8.2% of system peak load in 2020 and more than 11% by 2030 (EPRI and EEI 2008). Estimation methods differ among the studies, but nonetheless show that the 7.5% and 11.6% reductions in South Carolina are realistic for the medium and high scenarios by 2020. A FERC Staff Report released in the Summer of 2009 on DR potential concludes that from 9% to 17% reductions are feasible in South Carolina, from the “Expanded Business as Usual” and “Achievable Potential” scenarios (FERC 2009b). The FERC Staff Report results include significant contributions from innovative pricing and rates, and are based on higher participation rates and a quicker rollout, and consequently are higher than those estimated in this report and ramp up more quickly. As stated in the “Pricing and Rates” section of this report, the DR potential estimates focus on the use of direct load control and curtailable load response programs callable by the utility. This focus is believed to be able to fully represent the DR potential, even though pricing programs could be used instead of these curtailable load programs with equal, or in some cases, greater efficiency. Whereas the FERC estimates gain most benefits from pricing programs, this report did not examine aggressive pricing scenarios or complete restructuring of rates (covering all customers) where prices would be responsive to market effects and have considerable impact on peak demand. This report examined cases involving 10–40% of customer load participating in DR programs. Newer visions for pricing options enabled by a smart grid infrastructure have larger numbers of customers facing real-time market pricing, resulting in greater decrease in peak demand. The FERC report’s “Achievable Potential” is realized if all customers have dynamic pricing tariffs as their default tariff and 60%-75% of customers adopt this default tariff. Therefore, the estimates derived in the FERC study give further support that the results from this report are reasonable and achievable through traditional DR programs. D.9. Recommendations This assessment indicates that the system peak demand can be reduced by approximately 8.0% or 1,435 MW in 2020 in the medium case. In the high case, the reduction can be as high as 12.3% or 2,212 MW. The high case is considered to be within a reasonable range if aggressive action begins by the end of 2009, providing for a twelve-year rollout of the DR efforts (at the beginning of 2010 through the end of 2020). Key recommendations include:
1. Structure appropriate financial incentives for the South Carolina’s utilities either for programs administered directly by the utilities or for outsourcing DR efforts to aggregators. The basic premise is that a utility’s least-cost plan should also be its most profitable plan.
South Carolina's Energy Future, ACEEE
139
2. Integrate DR programs with the delivery of EE programs. For example, Duke Energy’s “Residential Power Manager Program” that allows utility control of air conditioning loads is also used as a gateway for Duke Energy to offer free, in-home energy audits to help inform home owners of additional energy saving opportunities. Many gains in delivery efficiency are possible by combining and cross-marketing EE and DR programs. These can include new building codes and standards that include not only energy efficiency construction and equipment, but also the installation of addressable and dispatchable equipment. This can include addressable thermostats in new residences and the installation of addressable energy management systems in commercial and industrial buildings that can reduce loads in select end-uses across the building/facility. In addition, energy audits of residential or commercial facilities can also include an assessment of whether that facility is a good candidate for participation in a DR program through the identification of dispatchable loads. Furthermore, building commissioning and retro-commissioning EE programs that are becoming popular in many commercial and industrial sector programs have the energy management system as a core component of program delivery. At this time, the application of auto-DR can be assessed and marketed to the customer along with the EE savings from these site-commissioning programs.
3. Implement programs focused on achieving firm capacity reductions as this provides the
highest value demand response. This is accomplished through establishing appropriate customer expectations and by conducting program tests for each DR program in each year. These tests should be used to establish expected DR program impacts when called and to work with customers each year to ensure that they can achieve the load reductions expected at each site.
4. Plan for at-scale programs through the rollout period. While pilot programs can be important
in determining the appropriate design of cost-effective DR programs, there are established DR programs and technologies. Even with the unique circumstances in South Carolina, these programs can be designed for deployment at scale. However, this approach recognizes that the first year of program deployment and possibly the second year should be designed to test key design components as part of a program shakeout. The third year of a program should represent an efficient design and an at-scale program. DSM programs are designed to be flexible and undergo year-to-year changes due to market, customer and technology factors. This will always be the case and the benefits of discrete pilot program can limit overall program participation for a number of years resulting in “lost DR MWs.” The politics of DSM and diverse positions of parties can result in a compromise in the implementation of programs leading to a two to three-year pilot program. This can delay the delivery of DR at scale resulting in higher overall costs. The over-use of pilots that do not acknowledge the ability of a program roll-out to have at-scale deliver as its goal in year three, but to also have tests of design components and decision nodes built into the first two year of program rollout can result in “death by piloting” for attainable DR MWs. Also, a decision to run a pilot program must be based on the assumption that the program will not have enough flexibility in design and on-going decision nodes during the first two years to allow for the ramp up into full scale efficient deployment in year three.
Load reduction programs typically have less need for pilot programs as the reductions are defined by the equipment and processes outlined by the program for each participant. Time differentiated pricing is a cornerstone of efficient electric markets and the design of these programs may need more pilot testing as the customer response to pricing is voluntary and not set (as often) by program design. Key programs that be considered for roll-out and can be designed within a 12-month period include:
South Carolina's Energy Future, ACEEE
140
i. Residential and small business AC direct load control using switches or thermostats (or giving customers their choice of technology). This potential for benefit is high with South Carolina having above average central AC saturation.
ii. Auto-DR programs providing direct load curtailment for larger commercial and industrial customers.
iii. Callable interruptible programs with manual response to an event notification for
larger commercial and industrial customers where auto-DR approaches are not acceptable to the customer or technically not feasible.
iv. Aggressive enrollment of back-up generators in DR programs.
5. Pricing should form the cornerstone of an efficient electric market. South Carolina has a
history of time-differentiated rates. Increasing pricing programs (and participation) including Daily TOU pricing and day-ahead hourly pricing will increase overall market efficiency by causing shifts in energy use from on-peak to off-peak hours every day of the year. However, this does not diminish the need to have dispatchable DR programs that can address those few days that represent extreme events where the highest demands occur. These events are best addressed by dispatchable DR programs.
6. Customer education should be included in DR efforts. There is some perceived lack of
customer awareness of programs and incentives. In addition, new programs will need marketing efforts as well as technical assistance to help customers identify where load reductions can be obtained and the technologies/actions needed to achieve these load reductions. Also, high-level education on the volatility of electricity markets helps customers understand why utilities and other entities are promoting DR and the customers’ role in increasing demand response to help match up with supply-side resources to achieve lower cost resource solutions when markets become tight.
7. Increase clarity and coordination between the Federal and State agencies and programs.
While states have primary jurisdiction over retail demand response, the FERC has jurisdiction over demand response in wholesale markets. Greater clarity and coordination between the Federal and State programs is needed.
South Carolina's Energy Future, ACEEE
141
South Carolina's Energy Future, ACEEE
142
Appendix E—Combined Heat and Power E.1. Technical Potential for CHP This section provides an estimate of the technical market potential for combined heat and power (CHP) in the industrial, commercial/institutional, and multi-family residential market sectors. The analysis focused on the potential market for natural gas fueled CHP in South Carolina. Natural gas is by far the predominant fuel used for CHP in the U.S, representing 72% of the 84,300 MW of installed CHP capacity in the country. Natural gas is the fuel of choice for most CHP applications because of its competitive price, ease of use, reliability of supply, relatively low criteria pollutant emissions, and increasingly, its low carbon content in comparison to coal and oil. If properly designed and operated, natural gas CHP can provide significant benefits in terms of energy efficiency and reduced CO2 emissions. It should be noted, however, that existing CHP projects in South Carolina are characterized by the use of opportunity fuels such as black liquor, wood waste, municipal solid waste, and biogas from waste-water treatment. These types of fuels and CHP systems were not considered in this analysis, and may represent potential market opportunities for CHP beyond the natural gas-based estimates provided in this study. Two different types of CHP markets were included in the evaluation of technical potential, markets that employ the CHP thermal energy for boiler loads only and markets that employ the thermal energy for both boiler loads and air conditioning. Both of these markets were evaluated for high load factor (80% and above) and low load factor (51%) applications resulting in four distinct market segments that are analyzed. E.1.1. Traditional CHP Traditional CHP electrical output is produced to meet all or a portion of the base load for a facility and the thermal energy is used to provide steam or hot water. Depending on the type of facility, the appropriate sizing could be either electric or thermal limited. Industrial facilities often have “excess” thermal load compared to their onsite electric load. Commercial facilities almost always have excess electric load compared to their thermal load. Two sub-categories were considered: High load factor applications: This market provides for continuous or nearly continuous operation. It includes all industrial applications and round-the-clock commercial/institutional operations such colleges, hospitals, hotels, and prisons. Low load factor applications: Some commercial and institutional markets provide an opportunity for coincident electric/thermal loads for a period of 3,500 to 5,000 hours per year. This sector includes applications such as car washes and health clubs. E.1.2. Combined Cooling Heating and Power (CCHP) All or a portion of the thermal output of a CHP system can be converted to air conditioning or refrigeration with the addition of a thermally activated cooling system. This type of system can potentially open up the benefits of CHP to facilities that do not have the year-round thermal load to support a traditional CHP system. A typical system would provide the annual hot water load, a portion of the space heating load in the winter months and a portion of the cooling load in during the summer months. Two sub-categories were considered: Low load factor applications: These represent markets that otherwise could not support CHP due to a lack of thermal load. This market includes applications such as office buildings, retail, education, and governmentl buildings High load factor applications: These markets represent round-the-clock commercial/institutional facilities with cooling and heating loads. This market includes hotels, hospitals, nursing homes, and data centers.
South Carolina's Energy Future, ACEEE
143
The estimation of technical market potential consists of the following elements:
Identification of applications where CHP provides a reasonable fit to the electric and thermal needs of the user. Target applications were identified based on reviewing the electric and thermal energy consumption data for various building types and industrial facilities.
Quantification of the number and size distribution of target applications. Several data sources were used to identify the number of applications by sector that meet the thermal and electric load requirements for CHP.
Estimation of CHP potential in terms of megawatt (MW) capacity. Total CHP potential is then derived for each target application based on the number of target facilities in each size category and sizing criteria appropriate for each sector.
Subtraction of existing CHP from the identified sites to determine the remaining technical market potential.
The technical market potential defines the sites that have the physical electric and thermal loads that could support CHP with the defined loads in the four market segments. Technical potential does not consider screening for economic rate of return, or other factors such as ability to retrofit, owner interest in applying CHP, capital availability, natural gas availability, and variation of energy consumption within customer application/size class. The technical potential as outlined is useful in understanding the potential size and size distribution of the target CHP markets in the state. Identifying technical market potential is a preliminary step in the assessment of market penetration. The basic approach to developing the technical potential is described below:
Identify existing CHP in the state. The analysis of CHP potential starts with the identification of existing CHP. In South Carolina, there are 22 operating CHP plants totaling 1,150 MW of capacity. Of this existing CHP capacity, 59% of the sites and 90% of the capacity are in the industrial sector. The portion of this existing CHP capacity that is used to meet onsite loads is deducted from any identified technical potential. A summary of the existing CHP capacity by industry is shown in Table E.1. The existing projects in South Carolina are characterized by the use of opportunity fuels such as black liquor, wood waste, municipal solid waste, and biogas from waste-water treatment. There are also a number of coal-fired systems and a couple of large natural gas fired systems that are essentially large wholesale generators, exporting most of their power to the grid.
Identify applications where CHP provides a reasonable fit to the electric and thermal needs of the
user. Target applications were identified based on reviewing the electric and thermal energy (heating and cooling) consumption data for various building types and industrial facilities. Data sources include the DOE EIA Commercial Buildings Energy Consumption Survey (CBECS), the DOE Manufacturing Energy Consumption Survey (MECS) and various market summaries developed by DOE, Gas Technology Institute (GRI), and the American Gas Association. Existing CHP installations in the commercial/institutional and industrial sectors were also reviewed to understand the required profile for CHP applications and to identify target applications.
Quantify the number and size distribution of target applications. Once applications that could
technically support CHP were identified, the Dun & Bradstreet Selectory Database and the Major Industrial Plant Database (MIPD) from IHS were utilized to identify potential CHP sites by SIC code or application, and location. The Selectory Database is based on the Dun and Bradstreet financial listings and includes information on economic activity (8 digit SIC), location (metropolitan area, county, electric utility service area, state) and size (number of employees) for commercial, institutional and industrial facilities. The data on number of employees is used to calculate the electric and thermal loads of the facility based on detailed estimates of energy use per employee. The MIPD has detailed energy and process data for 16,000 of the largest energy consuming industrial plants in the United States. The Selectory Database and MIPD were used to identify the
South Carolina's Energy Future, ACEEE
144
number of facilities in target CHP applications and to group them into size categories based on average electric demand in kilowatt-hours.
Estimate CHP potential in terms of MW capacity. Total CHP potential was then derived for each
target application based on the number of target facilities in each size category. It was assumed that the CHP system would be sized to meet the average site electric demand for the target applications unless thermal loads (heating and cooling) limited electric capacity. Tables E.2 through E.4 present the specific target market sectors, the number of potential sites and the potential MW contribution from CHP. There are two distinct applications and two levels of annual load making for four market segments in all. In traditional CHP, the thermal energy is recovered and used for heating, process steam, or hot water. In cooling CHP, the system provides both heating and cooling needs for the facility. High load factor applications operate at 80% load factor and above; low load factor applications operate at an assumed average of 4500 hours per year (51%) load factor.
Estimate the growth of new facilities in the target market sectors. The technical potential included
economic projections for growth through 2025 by target market sectors in South Carolina. The growth factors used in the analysis for growth between the present and 2025 by individual sector are shown in Table E.5. These growth projections provided by ACEEE were used in this analysis as an estimate of the growth in new facilities. In cases where an economic sector is declining, it was assumed that no new facilities would be added to the technical potential for CHP. Based on these growth rates the total technical market potential is summarized in Table E.6.
Table E.6. CHP Market Segments, South Carolina Existing Facilities and Expected Growth 2008–2030
Market 50-500 kW MW
500-1 MW (MW)
1-5 MW (MW)
5-20 MW (MW)
>20 MW (MW)
Total MW
Traditional High Load Factor Market
Existing Facilities 189 130 413 496 516 1,743
New Facilities 65 46 139 196 173 618
Total 254 175 551 692 689 2,361
Traditional Low Load Factor Market
Existing Facilities 24 0 0 0 0 24
New Facilities 21 0 0 0 0 21
Total 45 0 0 0 0 45
Cooling CHP High Load Factor Market
Existing Facilities 90 30 52 34 0 206
New Facilities 78 25 40 25 0 168
Total 169 55 93 59 0 375
Cooling CHP Low Load Factor Market
Existing Facilities 470 252 175 10 0 907
New Facilities 479 162 111 4 0 755
Total 948 414 285 14 0 1,662
Total Market including Incremental Cooling Load
Existing Facilities 773 411 640 540 516 2,880
New Facilities 643 232 289 225 173 1,562
Total 1,416 644 929 765 689 4,443 E.2. Energy Price Projections The expected future relationship between purchased natural gas and electricity prices, called the spark spread in this context, is one major determinant of the ability of a facility with electric and thermal energy requirements to cost-effectively utilize CHP. For this screening analysis, a fairly simple methodology was used: E.2.1. Electric Price Estimation The retail electric price forecasts are based on the EIA 2009 Annual Energy Outlook electric generation price forecast for the Southeast Electric Reliability Council (SERC.) Retail markups are estimated based on historical data. Figure E.1 shows the annual forecast track for major customer groups. The avoidable portion of the retail rate due to baseload CHP operation is assumed to be 90% of the industrial rate. This assumption accounts for unavoidable charges like customer charges, standby rates, and demand charges. Low load factor CHP is assumed to be 17% higher than the baseload rate; avoided electric air conditioning is assumed to be 60% higher. The smallest size category in the analysis, 50-500 kW, is assumed to be 20% higher across the board. These prices are shown in Table E.7.
South Carolina's Energy Future, ACEEE
150
Figure E.1. Retail Electric Price Forecast
0.00
0.02
0.04
0.06
0.08
0.10
0.12
2005 2010 2015 2020 2025
20
07
$/k
Wh
Residential
Commercial
Industrial
All Sectors
Table E.7. Avoided CHP Electric Rates by Size and Load Factor (2007$)
Greater than 500 kW Avoided AC $0.098 $0.117 $0.128 $0.138
E.2.2. Natural Gas Price Estimation Future natural gas prices were estimated from the EIA 2009 AEO SERC region gas price for electric power generation as shown in Figure E.2. This price is assumed to reflect the city-gate price for natural gas. The delivery mark-up for CHP was based on an analysis of Piedmont Natural Gas Company’s Large General Transportation Service Rate (213). The incremental transportation cost for a process boiler customer adding a 5 MW CHP system is $1.20/MMBtu. It was assumed that this current price will increase with inflation—that is, will be constant in real dollars. This mark-up was used for all CHP systems and sizes.
South Carolina's Energy Future, ACEEE
151
Figure E.2. Natural Gas Price Forecast, SERC Electric Power Generation Price
0.001.002.003.004.005.006.007.008.009.00
10.00
2005 2010 2015 2020 2025 2030
20
07
$/M
MB
tu
SERC
Source: EIA (2009e)
E.3. CHP Technology Cost and Performance The CHP system itself is the engine that drives the economic savings. The cost and performance characteristics of CHP systems determine the economics of meeting the site’s electric and thermal loads. A representative sample of commercially and emerging CHP systems was selected to profile performance and cost characteristics in CHP applications. The selected systems range in capacity from approximately 100—40,000 kW. The technologies include gas-fired reciprocating engines, gas turbines, microturbines and fuel cells. The appropriate technologies were allowed to compete for market share in the penetration model. In the smaller market sizes, reciprocating engines competed with microturbines and fuel cells. In intermediate sizes (1 to 20 MW), reciprocating engines competed with gas turbines. Cost and performance estimates for the CHP systems were based on work undertaken for the EPA (2007c). The foundation for these updates is based on work previously conducted for NYSERDA (Energy Nexus Group 2002), on peer-reviewed technology characterizations that Energy and Environmental Analysis (EEA) developed for the National Renewable Energy Laboratory (NREL 2003) and on follow-on work conducted by DE Solutions for Oak Ridge National Laboratory (ORNL 2004). Additional emissions characteristics and cost and performance estimates for emissions control technologies were based on ongoing work EEA is conducting for EPRI (EPRI 2005). Data is presented for a range of sizes that include basic electrical performance characteristics, CHP performance characteristics (power to heat ratio), equipment cost estimates, maintenance cost estimates, emission profiles with and without after-treatment control, and emissions control cost estimates. The technology characteristics are presented for three years: 2009, 2014, 2019. The 2009–2013 market penetration estimates are based on current 2009 commercially available and emerging technologies. The cost and performance estimates for 2014 and 2019 reflect current technology development paths and currently planned government and industry funding. These projections were based on estimates included in the three references mentioned above. NOx emissions estimates in lb/MWh are presented for each technology both with and without aftertreatment control (AT). For this analysis, aftertreatment costs were included. The installed costs are base on national averages. The cost and performance data are show in Tables E.8 through E.11.
South Carolina's Energy Future, ACEEE
152
Table E.8. Reciprocating Engine Cost and Performance Characteristics
CHP System Characteristic/Year Available 2009 2014 2019
Table E.10. Fuel Cell Cost and Performance Characteristics
CHP System Characteristic/Year Available 2009 2014 2019 Installed Costs, $/kW 6,310 4,782 3,587
Heat Rate, Btu/kWh 9,475 9,475 9,000
Electric Efficiency, % 36 36 37.9
Thermal Output, Btu/kWh 2923 2923 2800
Overall Efficiency, % 66.9 66.9 69
Power to Heat 1.17 1.17 1.22
O&M Costs, $/kWh 0.038 0.017 0.015
NOx Emissions, lbs/MWh (w/o AT) 0.04 0.035 0.035
200/400 kW PAFC (assumes all high grade and 50% low grade thermal utilized)
After-treatment Cost, $/kW n.a. n.a. n.a.
Installed Costs, $/kW 5,580 4,699 3,671
Heat Rate, Btu/kWh 8,022 7,700 7,300
Electric Efficiency, % 42.5 44.3 46.7
Thermal Output, Btu/kWh 1600 1500 1300
Overall Efficiency, % 62.5 63.8 64.5
Power to Heat 2.13 2.27 2.62
O&M Costs, $/kWh 0.035 0.02 0.015
NOx Emissions, lbs/MWh (w/o AT) 0.01 0.01 0.01
300 kW MCFC
After-treatment Cost, $/kW n.a. n.a. n.a.
Installed Costs, $/kW 5,250 4,523 3,554
Heat Rate, Btu/kWh 8,022 7,500 6,820
Electric Efficiency, % 42.5 45.5 50
Thermal Output, Btu/kWh 1583 1400 1100
Overall Efficiency, % 62.3 64.2 66.2
Power to Heat 2.15 2.44 3.1
O&M Costs, $/kWh 0.032 0.019 0.015
NOx Emissions, lbs/MWh (w/o AT) 0.01 0.01 0.01
1500 kW MCFC
After-treatment Cost, $/kW n.a. n.a. n.a.
South Carolina's Energy Future, ACEEE
155
Table E.11. Gas Turbine Cost and Performance Characteristics
CHP System Characteristic/Year Available 2009 2014 2019 Installed Costs, $/kW 1,690 1,560 1,300
Heat Rate, Btu/kWh 13,100 12,650 11,500
Electric Efficiency, % 26 27 29.7
Thermal Output, Btu/kWh 5018 4750 4062
Overall Efficiency, % 64.4 64.5 65
Power to Heat 0.68 0.72 0.84
O&M Costs, $/kWh 0.0074 0.0065 0.006
NOx Emissions, ppm (w/o AT) 15 9 5
NOx Emissions, lbs/MWh (w/o AT) 0.68 0.38 0.2
NOx Emission, lb/MWh (w/AT) 0.07 0.07 0.07
3000 KW GT
After-treatment Cost, $/kW 210 175 150
Installed Costs, $/kW 1,298 1,278 1,200
Heat Rate, Btu/kWh 11,765 10,800 9,950
Electric Efficiency, % 29 31.6 34.3
Thermal Output, Btu/kWh 4674 4062 3630
Overall Efficiency, % 68.7 69.2 70.8
Power to Heat 0.73 0.84 0.94
O&M Costs, $/kWh 0.007 0.006 0.005
NOx Emissions, ppm (w/o AT) 15 9 5
NOx Emissions, lbs/MWh (w/o AT) 0.68 0.38 0.2
NOx Emission, lb/MWh (w/AT) 0.07 0.07 0.07
10 MW GT
After-treatment Cost, $/kW 140 125 100
Installed Costs, $/kW 972 944 916
Heat Rate, Btu/kWh 9,220 8,865 8,595
Electric Efficiency, % 37 38.5 39.7
Thermal Output, Btu/kWh 3189 3019 2892
Overall Efficiency, % 71.6 72.5 73.3
Power to Heat 1.07 1.13 1.18
O&M Costs, $/kWh 0.004 0.004 0.004
NOx Emissions, ppm (w/o AT) 15 5 3
NOx Emissions, lbs/MWh (w/o AT) 0.55 0.2 0.1
NOx Emission, lb/MWh (w/AT) 0.06 0.06 0.06
40 MW GT
After-treatment Cost, $/kW 90 75 40 In the cooling markets, an additional cost was added to reflect the costs of adding chiller capacity to the CHP system. These costs depend on the sizing of the absorption chiller which in turn depends on the amount of usable waste heat that the CHP system produces. Figure E.3 shows this cost approximation.
South Carolina's Energy Future, ACEEE
156
Figure E.3. Absorption Chiller Capital Costs
$0$200$400$600$800
$1,000$1,200$1,400$1,600$1,800$2,000
0 1,000 2,000 3,000
Tons of Cooling
Ch
ille
r C
ap
ita
l C
os
t ($
/to
n)
E.4. Market Penetration Analysis ICF International has developed a CHP market penetration model that estimates cumulative CHP market penetration in 5-yrar increments. This model evaluates CHP market penetration for natural gas fired systems in commercial, institutional, and industrial applications. For this analysis, only applications that could use the CHP generated electricity onsite were considered. Therefore, the forecast results reflect the opportunity for electrically sized systems fired by natural gas. The potential markets for CHP using opportunity fuels or for large export projects is not included. For this analysis, the forecast periods are 2013, 2018, 2023, and 2028. These results are interpolated to the output years 2010, 2015, 2020, and 2025. The target market is comprised of the facilities that make up the technical market potential as defined in previously in this section. Thee economic competition module in the market penetration model compares CHP technologies to purchased fuel and power in 5 different sizes and 4 different CHP application types. The calculated payback determines the potential pool of customers that would consider accepting the CHP investment as economic. Additional, non economic screening factors are applied that limit the pool of customers that can accept CHP in any given market/size. Based on this calculated economic potential, a market diffusion model is used to determine the cumulative market penetration for each 5-year time period. The cumulative market penetration, economic potential and technical potential are defined as follows: Technical potential: represents the total capacity potential from existing and new facilities that are
likely to have the appropriate physical electric and thermal load characteristics that would support a CHP system with high levels of thermal utilization during business operating hours.
Economic potential: as shown in the table, reflects the share of the technical potential capacity
(and associated number of customers) that would consider the CHP investment economically acceptable according to a procedure that is described in more detail below.
Cumulative market penetration: represents an estimate of CHP capacity that will actually enter
the market between 2009 and 2025. This value discounts the economic potential to reflect non-economic screening factors and the rate that CHP is likely to actually enter the market.
In addition to segmenting the market by size, as shown in the table, the analysis is conducted in four separate CHP market applications (high load and low load factor traditional CHP and high and low load factor CHP with cooling.) These markets are considered individually because both the annual load factor and the installation and operation of thermally activated cooling has an impact on the system economics.
South Carolina's Energy Future, ACEEE
157
Economic potential is determined by an evaluation of the competitiveness of CHP versus purchased fuel and electricity. The projected future fuel and electricity prices and the cost and performance of CHP technologies determine the economic competitiveness of CHP in each market. CHP technology and performance assumptions appropriate to each size category and region were selected to represent the competition in that size range (Table E.12). Additional assumptions were made for the competitive analysis. Technologies below 1 MW in electrical capacity are assumed to have an economic life of 10 years. Larger systems are assumed to have an economic life of 15 years. Capital related amortization costs were based on a 10% discount rate. Based on their operating characteristics (each category and each size bin within the category have specific assumptions about the annual hours of CHP operation (80-90% for the high load factor cases with appropriate adjustments for low load factor facilities), the share of recoverable thermal energy that gets utilized (80%-90%), and the share of useful thermal energy that is used for cooling compared to traditional heating. The economic figure-of-merit chosen to reflect this competition in the market penetration model is simple payback.67 While not the most sophisticated measure of a project’s performance, it is nevertheless widely understood by all classes of customers.
Table E.12. Technology Competition Assumed within Each Size Category
CHP Market Size
Equivalent Full Load Hours of
Use Thermal UtilizationCompeting CHP Technologies
50-500 kW HiLF = 7,008 H only Markets 80% H / 0% C 100 kW ICELoLF = 4,500 H/C Markets 40% H / 40% C 65 kW MT
200 kW PAFC500-1,000 kW HiLF = 7,008 H only Markets 80% H / 0% C 800 kW ICE
LoLF = 4,500 H/C Markets 40% H / 40% C 250 kW MT x 3300 kW MCFC x 2
1-5 MW HiLF = 7,008 H only Markets 80% H / 0% C 3000 kW ICELoLF = 4,500 H/C Markets 40% H / 40% C 3000 kW GT
1500 kW MCFC5-20 MW HiLF = 7,446 H only Markets 90% H / 0% C 5 MW ICE
LoLF = 4,500 H/C Markets 45% H / 45% C 10 MW GT>20 MW HiLF = 8059 H only Markets 100% H / 0% C 40 MW GT
HiLF = High load factor, LoLF = Low load factorH = heating (boiler replacement)C = cooling (electric AC replacement)
Rather than use a single payback value, such as 3-years or 5-years as the determinant of economic potential, we have based the market acceptance rate on a survey of commercial and industrial facility operators concerning the payback required for them to consider installing CHP. Figure E.4 shows the percentage of survey respondents that would accept CHP investments at different payback levels (CEC 2005b). As can be seen from the figure, more than 30% of customers would reject a project that promised to return their initial investment in just one year. A little more than half would reject a project with a payback of 2 years. This type of payback translates into a project with an ROI of between 49-100%. Potential explanations for rejecting a project with such high returns is that the 67 Simple payback is the number of years that it takes for the annual operating savings to repay the initial capital investment.
South Carolina's Energy Future, ACEEE
158
average customer does not believe that the results are real and is protecting himself from this perceived risk by requiring very high projected returns before a project would be accepted, or that the facility is very capital limited and is rationing its capital raising capability for higher priority projects (market expansion, product improvement, etc.).
Source: Primen’s 2003 Distributed Energy Market Survey For each market segment, the economic potential represents the technical potential multiplied by the share of customers that would accept the payback calculated in the economic competition module. The rate of market penetration is based on Bass diffusion curves with allowance for growth in the maximum market. This function determines cumulative market penetration for each 5-year period. Smaller size systems are assumed to take a longer time to reach maximum market penetration than larger systems. Cumulative market penetration using a Bass diffusion curve takes a typical S-shaped curve. In the generalized form used in this analysis, growth in the number of ultimate adopters is allowed. The curves shape is determined by an initial market penetration estimate, growth rate of the technical market potential, and two factors described as internal market influence and external market influence. The cumulative market penetration factors reflect the economic potential multiplied by the non-economic screening factor (maximum market potential) and by the Bass model market cumulative market penetration estimate. Once the market penetration is determined, the competing technology shares within a size/utility bin are based on a logit function calculated on the comparison of the system paybacks. The greatest market share goes to the lowest cost technology, but more expensive technologies receive some market share depending on how close they are to the technology with the lowest payback. (This technology allocation feature is part of the ICF CHP model that is not specifically used for this analysis.) Three cases were run for this analysis:
1. Base Case—no program incentives (Table E.13) 2. $500/kW Incentive—$500/kW capital cost reduction for CHP projects less than 20 MW (Table
E.14)
South Carolina's Energy Future, ACEEE
159
3. $1,000/kW incentive—$1,000/kW capital cost reduction for CHP projects less than 20 MW (Table E.15)
Table E.13. Market Penetration Results for Base Case
Total 2 26 82 127 In the Base Case, only 37 MW of additional natural gas fired CHP capacity is projected by 2025. Only large industrial projects are economic in this case. Adding a $500/kW capital cost reduction incentive can nearly double this market penetration to 78 MW with an incentive cost of $21 million. Doubling of the incentive to $1,000/kW increases the 2025 market penetration to 393 MW with an incentive cost of $353 million.
South Carolina's Energy Future, ACEEE
162
Appendix F—Additional Resources South Carolina Farm Bureau Federation: www.scfb.org The South Carolina farm bureau serves the entire agricultural community through education and a unified voice in government. Their mission is to promote agricultural interests in the State of South Carolina and to optimize the lives of those involved in agriculture while being respectful to the needs and concerns of all citizens. The Southern Alliance for Clean Energy (SACE): www.cleanenergy.org The Southern Alliance for Clean Energy, partners with the Southern Environmental Law Center, Environmental Defense Fund, Natural Resources Defense Council, and the Coastal Conservation League of South Carolina, participating in public service/utilities commission hearings on proposed utility energy efficiency programs. South Carolina Cooperative Extension: The South Carolina Cooperative Extension service is operated out of Clemson University (www.clemson.edu/extension) and the South Carolina State University www.scsu.edu/1890/extension.aspx. South Carolina Department of Agriculture: http://agriculture.sc.gov/
Appendix G—The DEEPER Model and Macro Model The Dynamic Energy Efficiency Policy Evaluation Routine—or the DEEPER Model—is a 15-sector quasi-dynamic input-output impact model of the U.S. economy.68 Although an updated model with a new name, the model has a 15-year history of use and development. See, for example, Laitner, Bernow, and DeCicco (1998) and Laitner (2007) for a review of past modeling efforts. The model is generally used to evaluate the macroeconomic impacts of a variety of energy efficiency (including renewable energy) and climate policies at both the state and national level. The national model now evaluates policies for the period 2008 through 2050. Although, the DEEPER Model for the South Carolina specific analysis will cover the period between 2009 through 2025. As it is now designed, the model solves for the set of energy prices that achieves a desired and exogenously determined level of greenhouse gas emissions (below some previously defined reference case). Although the model does include non-CO2 emissions and other emissions reduction opportunities, it currently focuses on energy-related CO2 emissions and on the prices, policies, and programs necessary to achieve the desired emissions reductions. DEEPER is an Excel-based analytical tool that consists generally of six sets of key modules or groups of worksheets. These six sets of modules now include: Global data: The information in this module consists of the economic time series data and key model coefficients and parameters necessary to generate the final model results. The time series data includes the projected reference case energy quantities such as trillion Btus and kilowatt-hours, as well as the key energy prices associated with their use. It also includes the projected gross domestic product, wages and salary earnings, and levels of employment as well as information on key technology cost and performance characteristics. The sources of economic information include data from the Energy Information Administration, the Bureau of Economic Analysis, the Bureau of Labor Statistics, and Economy.com. The cost and performance characterization of key technologies is derived from available studies completed by ACEEE and others, as well as data from the Energy Information Administration’s (EIA) National Energy Modeling System (NEMS). One of the more critical assumptions in this study is that alternative patterns of electricity consumption will change and/or defer the mix of investments in conventional power plants. Although we can independently generate these impacts within DEEPER, we can also substitute assumptions from the ICF Integrated Planning Model (IPM) and similar models as they may have different characterizations of avoided costs or alternative patterns of power plant investment and spending. Macroeconomic model: This set of modules contains the “production recipe” for the region’s economy for a given “base year”—in this case, 2006, which is the latest year for which a complete set of economic accounts are available for the regional economy. The I-O data, currently purchased from the Minnesota IMPLAN Group (IMPLAN 2007), is essentially a set of input-output accounts that specify how different sectors of the economy buy (purchase inputs) from and sell (deliver outputs) to each other. In this case, the model is now designed to evaluate impacts for 15 different sectors, including: Agriculture, Oil and Gas Extraction, Coal Mining, Other Mining, Electric Utilities, Natural Gas Distribution, Construction, Manufacturing, Wholesale Trade, Transportation and Other Public Utilities (including water and sewage), Retail Trade, Services, Finance, Government, and Households. Investment, Expenditures and Energy Savings: Based on the scenarios mapped into the model, this worksheet translates the energy policies into a dynamic array of physical energy impacts, investment flows, and energy expenditures over the desired period of analysis. It estimates the needed investment path for an alternative mix of energy efficiency and other technologies (including efficiency gains on both the end-use and the supply side). It also provides an estimate of the avoided investments needed by the electric generation sector. These quantities and expenditures feed directly
68 There is nothing particularly special about this number of sectors. The problem is to provide sufficient detail to show key negative and positive impacts while maintaining a manageable sized model. If we choose to reflect a different mix of sectors and stay within the 15 x 15 matrix, that can be done easily. If we wish to expand the number of sectors, that would take some minor programming changes or adjustments to reflect the larger matrix.
South Carolina's Energy Future, ACEEE
165
into the final demand module of the model which then provides the accounting that is needed to generate the set of annual changes in final demand (see the related module description below). Price dynamics: There are two critical drivers that impact energy prices within DEEPER. The first is a set of carbon charges that are added to retail prices of energy depending on the level of desired level of emission reductions and also depending on the available set of alternatives to achieve those reductions. The second is the price of energy as it might be affected by changed consumption patterns. In this case DEEPER employs an independent algorithm to generate energy price impacts as they reflect changed demand. Hence, the reduced demand for natural gas in the end-use sectors, for example, might offset increased demand by utility generators. If the net change is a decrease in total natural gas consumption, the wellhead prices might be lowered. Depending on the magnitude of the carbon charge, the change in retail prices might either be higher or lower than the set of reference case prices. This, in turn, will impact the demand for energy as it is reflected in the appropriate modules. In effect, then, DEEPER scenarios rely on both a change in prices and quantities to reflect changes in overall investments and expenditures. Final demand: Once the changes in spending and investments have been established and adjusted to reflect changes in prices within the other modules of DEEPER, the net spending changes in each year of the model are converted into sector-specific changes in final demand. This, in turn, drives the input-output model according to the following predictive model: X = (I-A)-1 * Y where: X = total industry output by sector
I = an identity matrix consisting of a series of 0’s and 1’s in a row and column format for each sector (with the 1’s organized along the diagonal of the matrix) A = the production or accounting matrix also consisting of a set of production coefficients for each row and column within the matrix
Y = final demand, which is a column of net changes in final demand by sector This set of relationships can also be interpreted as ∆X = (I-A)-1 * ∆Y which reads: a change in total sector output equals (I-A)-1 times a change in final demand for each sector. Employment quantities are adjusted annually according to exogenous assumptions about labor productivity in each of the sectors (based on Bureau of Labor Statistics forecasts). Results: For each year of the analytical time horizon (again out to 2025 for the Ohio specific analysis), the model copies each set of results into this module in a way that can also be exported to a separate report. Further results from Ohio’s DEEPER analysis is provided to show macroeconomic trends between 5-year time periods. Although similar 2015 & 2025 results were presented in the body of this report, differences between 5-year time periods offer more reference points for the reader to understand Ohio’s macroeconomic trends under the efficiency scenario. This section highlights the net changes Ohio’s economy will experience as the result of our efficiency scenario.