24
SMALL SCALE FARMING IN THE SOUTH COWICHAN VALLEY (2000) Ministry of Agriculture, Food and Fisheries

SMALL SCALE FARMING
IN THE
SOUTH COWICHAN VALLEY
(2000)
Ministry of Agriculture,
Food and Fisheries
2
AcknowledgementsThe Ministry of Agriculture, Food and Fisheries would like to thank the Island FarmersAlliance, Cowichan Agriculture Society, Cowichan Valley Small Holdes and theCowichan Valley Community Futures Corporation for their input to and support of theproject. A special thanks to the Island Farmers Alliance for receiving and forwardingthe responses to the Ministry.
The project would not have been possible without the dedication of Samir Siksik,who’s co-op work term revolved around this project.
For more information contact:
Mark RobbinsRegional AgrologistBC Ministry of Agriculture, Food and Fisheries
(604) 556-3086

3
Executive SummaryWhen you look at a small scale farm1, what do you see? When you drive by the streetfront shops in Chemainus or go to your local Wal Mart – what do you see? This reporttries to paint a picture of small scale agriculture as a home based business that pro-vides a second family income and supports the rural community – not unlike the smallurban based shops in Chemainus.
Large scale farming provides the bulk of our food needs at low prices and must competein global markets – similar to Wal Mart. Small scale farms provide specialized, differenti-ated products to meet local demand – similar to the small shops in Cemainus.
The South Cowichan Valley was studied to help paint a better picture of small scalefarming in the community. The major findings of the study include:
1. Farming is a Growing Business
· There is a steady stream of new entrants to farming (3% / year)and they tend tostay in the industry for a long time.
· Farms (large and small) tend to increase their output over time.
· Twice as many existing farms are expanding in size than are reducing in size.
· Small farms are best considered as small to medium sized home based busi-nesses – no different in purpose than any other form of small business.
2. Markets for Farm Products are Diverse
· Only one in five farms sell to formal marketing agencies and these sales repre-sent only 70% of farm production.
· Four out of every five farms (including many large scale farms) sell some productat the farm gate. 40% of farms rely totally on farm gate sales.
· Two out of every three farms are mixed farm operations.
· For every $1 of sales at farmers markets there is $3 more in other farm directmarket sales.
3. While large farms are intensive in capital equipment, small farms areintensive in human capital
· Small farms are 3 times more labour intensive per $ of sales than large farms.The addition of $100 in sales supports 1 person day of work on small farms while$325 in sales is required to support 1 person day of work on a large farm.
· Close to half (44%) of the total farm work reported in the community is on smallfarms.
· The value of work2 on farms exceeds cash wages by 50%.
· The value of work on farms selling $10,000 - $50,000 annually averages $16,000/year – an attractive second family income.
1 The Ministry of Agriculture, Food and Fisheries’ work has defined small scale as annual sales <$50,000
and small lot as lots < 10 acres
2 Explained in more detail on page 14
4
4. On-Farm Value Added
· Only 1 in 4 farmers selling in the direct market consider that they add value totheir primary product and the most common commodities for value-added arebeef and poultry. More value added products may be a potential growth oppor-tunity in the Cowichan Valley.
5. Limitations on Further Growth
· Excessive government regulations, lack of auction and processing facilities forsmall scale livestock production and lack of personal time are viewed as the keylimits on future growth.
· Lot size (or land capability) was not considered a significant constraint.
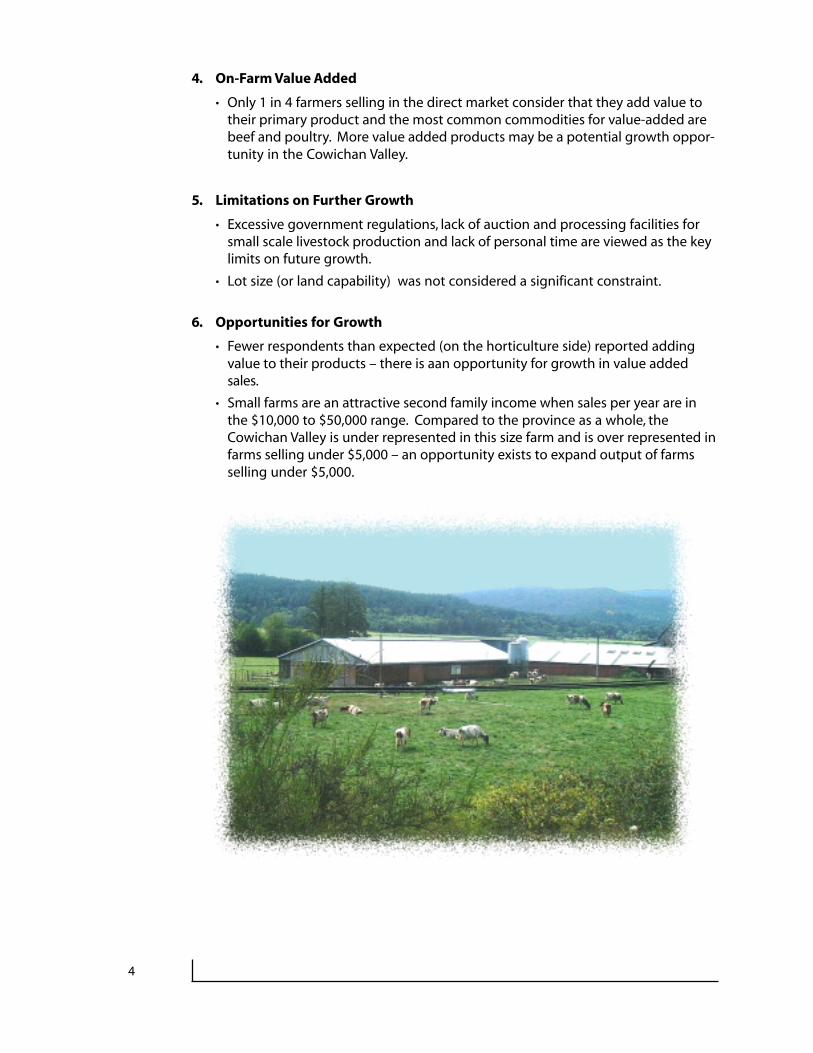
6. Opportunities for Growth
· Fewer respondents than expected (on the horticulture side) reported addingvalue to their products – there is aan opportunity for growth in value addedsales.
· Small farms are an attractive second family income when sales per year are inthe $10,000 to $50,000 range. Compared to the province as a whole, theCowichan Valley is under represented in this size farm and is over represented infarms selling under $5,000 – an opportunity exists to expand output of farmsselling under $5,000.

5
I. IntroductionThe primary purpose of the survey in the South Cowichan Valley was to obtain infor-mation on farm labour and marketing methods on small scale direct market farms –information not previously available. A secondary purpose was to gain a better insightinto the role of smaller scale3 agriculture in the rural community and identify opportu-nities for further growth in the sector.
From the 1940’s to the 1980’s agriculture in BC was predominantly commodity basedand marketed through formal marketing agencies or auctions. During the last 2decades there has been strong growth, some would say an explosion, in small scalemixed farm operations that sell directly to both consumers and retailers. The productsales, farm work and contribution to the community of these operations are difficult tomeasure so their value is often discounted. At two recent workshops on small lot/scale agriculture producers expressed a strong interest in having better informationon the role of small scale direct marketed production in their community.
To respond to this need the Small Farm Project of the Ministry of Agriculture, Food andFisheries worked with the Cowichan Valley Smallholders Society, Cowichan Agricul-ture Society and the Island Farmers Alliance as well as the Community FuturesCorporation to design and conduct a study to begin to better understand the value offarming – predominantly small scale direct market farming - to the community.
The key contributions of the report are a better understanding of:
1. the relationshipbetween the volumeof product marketedthrough formal mar-keting agenciescompared to thevolume marketeddirect to consumers,
2. the nature of farmlabour on small scaleoperations, and
3. the challenges andopportunities in smallscale agricultureproduction
3 The Ministry of Agriculture, Food and Fisheries’ work has defined small scale as annual sales
<$50,000 and small lot as lots < 10 acres
6
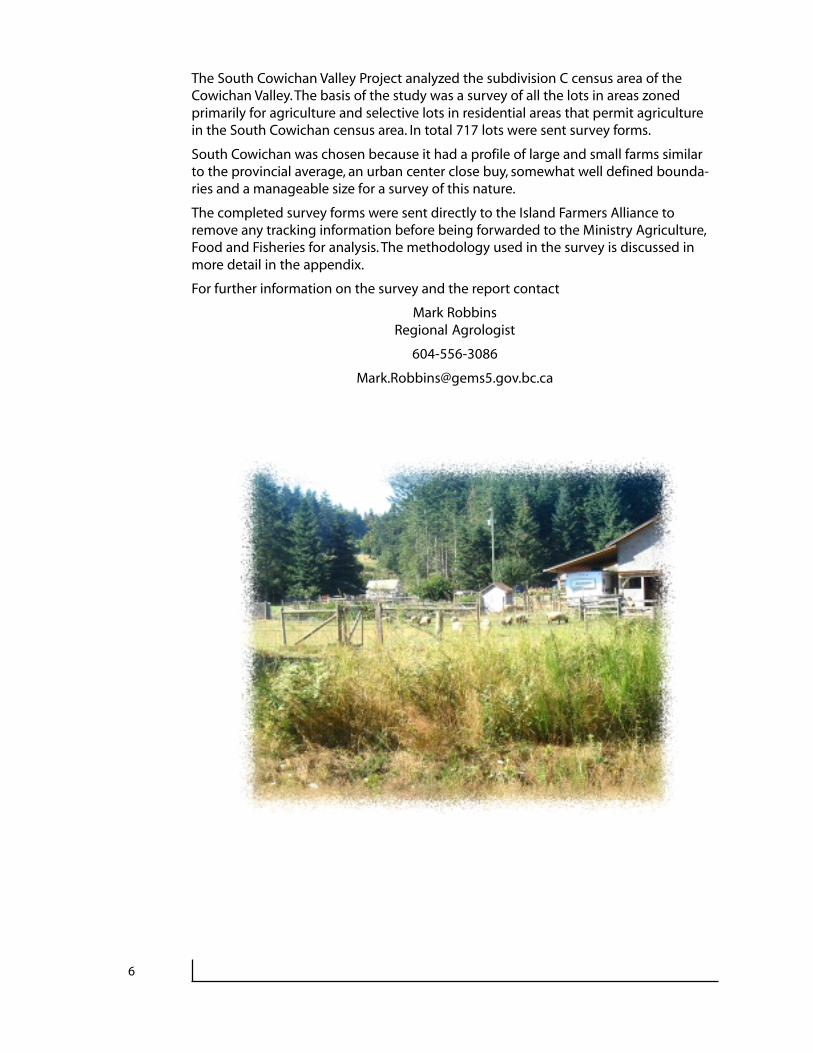
The South Cowichan Valley Project analyzed the subdivision C census area of theCowichan Valley. The basis of the study was a survey of all the lots in areas zonedprimarily for agriculture and selective lots in residential areas that permit agriculturein the South Cowichan census area. In total 717 lots were sent survey forms.
South Cowichan was chosen because it had a profile of large and small farms similarto the provincial average, an urban center close buy, somewhat well defined bounda-ries and a manageable size for a survey of this nature.
The completed survey forms were sent directly to the Island Farmers Alliance toremove any tracking information before being forwarded to the Ministry Agriculture,Food and Fisheries for analysis. The methodology used in the survey is discussed inmore detail in the appendix.
For further information on the survey and the report contact
Mark RobbinsRegional Agrologist
604-556-3086

7
II. Outline
Executive Summary 3
I. Introduction 5II. Outline 7
III. List of Figures 8
IV. Detailed Survey Results 9
1) The Farming Community 9
2) Farm Sales and Markets 13
3) Work on the Farm 14
4) Value Added 17
5) Other Comments 18
V. Challenges and Opportunities 19
VI. Appendix 20
1) Census of Agriculture Profile of South Cowichan – Area C 21
2) Methodology 22
3) Survey Form 24

8
III. List of Figures1. Types of Production – Farms Reporting 9
2. Value of Production From Farms Responding 10
3. Rural Land Use in South Cowichan 11
4. Recent Output Trends in Farming – South Cowichan 11
5. Length of Time Farming 12
6. Length of Time in Business – Other Small Businesses 12
7. Average Annual Sales by Years Farming 12
8. Distribution of Farms by Annual Sales 13
9. Marketing Approach by Farms Responding 13
10. Volume of Sales by Marketing Approach 14
11. Average Value of Work and Cash Wages per Farm 15
12. Distribution of Work Between Large and Small Farms 15
13. Average Annual Value of Work by Farm Size 16
14. Sales per Person Day of Work at Different Scales of Operation 16
15. Value Added on Small Scale Farms 17
16. Commodities Produced on Farms Adding Value 17
17. Barriers to Farm Success 19
18. Types of Farm Production Reported in the 1996 Census 21
19. Proportion of Farms in Different Annual Sales Categories – SouthCowichan Compared to BC (1996) 21
20. Comparison of Census Farms and Survey Responses by Size of Farm 22
21. Farms Reporting Production – Census Farms and Survey Responses 23

9
IV. Detailed Survey ResultsResponses were received from 72 producing farms. The 1996 census identified 211farms in the survey area. If the same growth in farm numbers from ’91 to ’96 continuedthrough to 20004 the 72 responses would represent approximately 30% of the operat-ing farms in the survey area. From a farm size perspective the profile of responses fitsthe census of agriculture profile indicating the responses are a good representation ofthe farms in the survey area5 .
The results are discussed in 4 areas, the farming community, sales and marketing, workon the farm and value added; with a fifth section for other comments. The approachto discussing work on the farm is different than previous methods, however, it pro-vides some interesting insights into small scale farming operations.
1) The Farming CommunityFigure 1 shows the types of production reported by the respondents. Almost 2/3rds ofthe respondents produced products from 2 categories and 1/3rd produced productsfrom 3 categories.
Figure 1. Types of Production – Farms Reporting
4 See the methodology section in the appendix for more detail . Page 225 This point is discussed further in the methodology section. Page 227 Farms were separated according to the response to the marketing question on the survey.
23.6%
22.2%
20.8%
19.4%
15.3%
15.3%
13.9%
11.1%
9.7%
8.3%
6.9%
5.6%
5.6%
4.2%
2.8%
0% 5% 10% 15% 20% 25%
Beef
Forage
Fruit
Other Livestock
Hogs
Nursery
Dairy
Poultry - Commodity
Farms Reporting Production
Seven of the top nine commodities mentioned are livestock based indicating a stronginterest in small scale livestock production. Non-quota poultry and egg production,sold direct market, were separated from production sold through the regulatedmarketing channel.6

10
Figure 2 shows the estimated value of production. While small scale livestock domi-nates by number of farms, large scale chicken, dairy and greenhouse productiondominates by quantity of output.
Figure 2. Value of Production From Farms Responding(approximately 30% of the industry)
1,038
840
407
141
129
101
95
82
77
69
42
35
33
23
9
0 200 400 600 800 1,000 1,200
Poultry - Com
Dairy
Greenhouses
Other livestock
Fruit
Beef
Processing
Poultry - DM
Forage
Eggs - DM
Sheep
Nursery
Hogs
Field Veg
Other
Value of Production ($,000) - from responses
Given that the sample is only 30% of the total industry a very rough estimate of theannual sales of non-quota production of eggs and meat birds in the survey area is$225,000 and $275,000 respectively. The sales volume of farms responding was $3.1million indicating the total agriculture production for the survey area is approximately$10 million annually7.
Figure 3 and 4 together demonstrate two different perspectives with which peopleview farming. When farming is viewed strictly from a sales volume perspective, policyis focused on a small number of high output farms and tends to focus on globalmarkets. When farming is viewed from a number of farms or land base perspectivepolicy becomes more focused on the large number of lower output farms and tends tofocus more on community needs.
In farming areas land can be used for residential or other non-farming activities.Figure 3 is a rough estimate of the ratio of land use in the survey area8.
7 Similar treatment with the Census of Agriculture numbers estimates total sales at $11 - $12 million 8 Based on responses to the survey and BCAA information on the number of lots with farmland classification.

11
The number of responses from farms producing agriculture products strictly for familyand friends was to high to ignore. This segment of the farming community has notbeen well recognized in the past. Farm income is not recorded and farmland classifi-cation is not requested yet active farming is taking place on what could best bedescribed as a micro-cooperative basis.
With only 1/3rd of the lots actually in production, future growth is not constrained bya lack of land. While 2/3rd of the lots are not farmed – it is not clear what portion isactually available for potential farmers or existing farmers wishing to expand. Thisquestion was outside the scope of the survey but should be considered in any futurework.
Is the industry growing? Responses indicated that more existing farms were expand-ing than reducing output and that there was a steady stream of new entrants.
Figure 4 indicates the response to the question has your farm operation expanded,contracted or stayed the same over the last 5 years?
Figure 4. Recent Output Trends in Farming – South Cowichan
Figure 3. Rural Land use in South Cowichan
30%
3%67%
Production Sold Production for Family/friends No Production
18%
9%
73%
Expanded Contracted Stayed the Same
The number of respondents that had expanded their farms was over double thosethat had contracted their farms and the increase or new sales was also double the lossin sales.
There are perceptions that the long term future of farming is bleak because farmers ingeneral are older and will retire in the short term, leaving nobody to replace them.The survey responses indicated that this is not the case in the Cowichan Valley wherethere has been a steady stream of new farmers over the last 15 years.
12
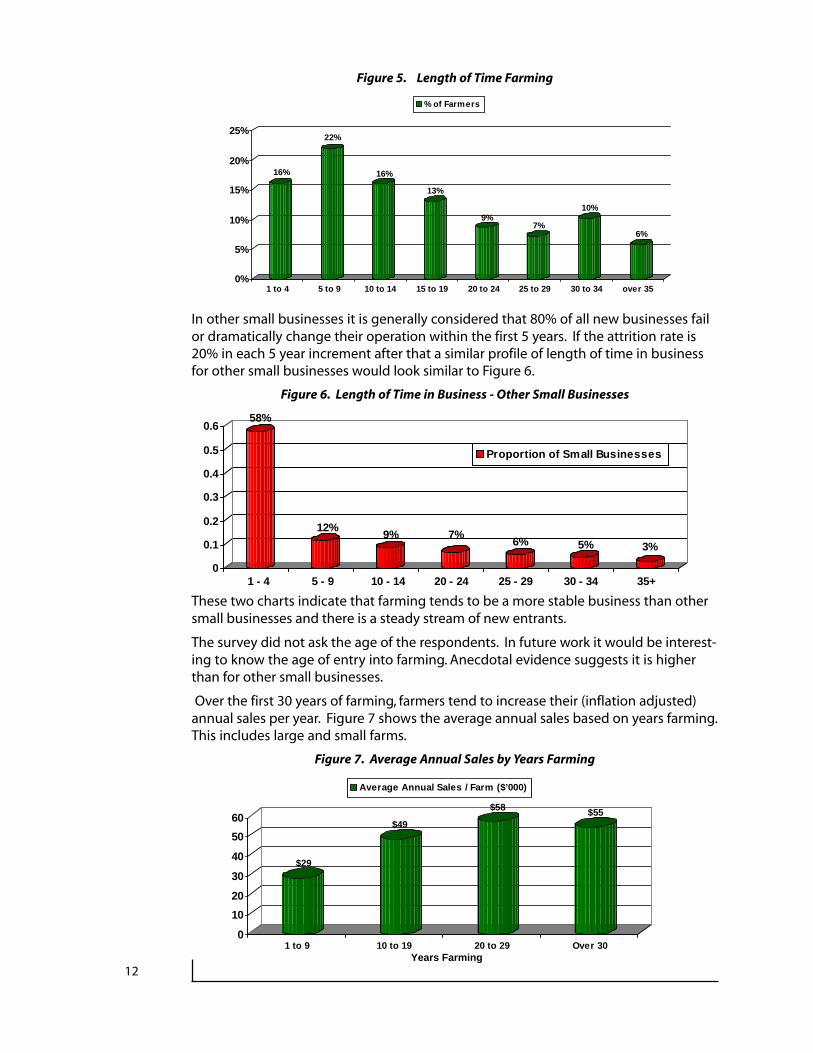
Figure 5. Length of Time Farming
In other small businesses it is generally considered that 80% of all new businesses failor dramatically change their operation within the first 5 years. If the attrition rate is20% in each 5 year increment after that a similar profile of length of time in businessfor other small businesses would look similar to Figure 6.
Figure 6. Length of Time in Business - Other Small Businesses
These two charts indicate that farming tends to be a more stable business than othersmall businesses and there is a steady stream of new entrants.
The survey did not ask the age of the respondents. In future work it would be interest-ing to know the age of entry into farming. Anecdotal evidence suggests it is higherthan for other small businesses.
Over the first 30 years of farming, farmers tend to increase their (inflation adjusted)annual sales per year. Figure 7 shows the average annual sales based on years farming.This includes large and small farms.
Figure 7. Average Annual Sales by Years Farming
16%
22%
16%
13%
9%7%
10%
6%
0%
5%
10%
15%
20%
25%
1 to 4 5 to 9 10 to 14 15 to 19 20 to 24 25 to 29 30 to 34 over 35
% of Farmers
$29
$49
$58 $55
0
10
20
30
40
50
60
1 to 9 10 to 19 20 to 29 Over 30
Average Annual Sales / Farm ($’000)
Years Farming
58%
12%9% 7%
6% 5% 3%
0
0.1
0.2
0.3
0.4
0.5
0.6
1 - 4 5 - 9 10 - 14 20 - 24 25 - 29 30 - 34 35+
Proportion of Small Businesses

13
The distribution of farms responding by annual sales is shown in Figure 8.
Figure 8. Distribution of Farms by Annual Sales
While the distribution of farms by annual sales is not substantially different than thecensus of agriculture for the survey area it does differ from the provincial average inthat it has fewer farms selling $5,000 - $25,000 per year.
These farms typically have started small with a differentiated product and expandedtheir operations. On Vancouver Island, where differentiated products are key tosuccess in many areas of agriculture it is surprising that more small farms haven’texpanded to sales over $5,000 annually.
This may be a potential area of growth for those farmers without personal time constraints.
2) Farm Sales and MarketsFigure 9. Marketing Approach by Farms Responding
Figure 9 provides new information on methods of farm marketing. While close to 1 in 5farms sells some or all of their product through formalized marketing agencies, 3 out ofevery 4 farms sells some of their production at the farm gate or directly to the consumer.Over 40% of the farms responding relied totally on farm gate sales. Respondentsindicated 15% of the farm community took advantage of farmers markets.
18%14%
76%
15%11%
0%
10%
20%
30%
40%
50%
60%
70%
80%
Agencies Local Retail Farm Gate Farmers Market Others
% of Farms Reporting Some Sales By:
6%
19%
31%
8% 8%10%
6%
12%
0%
5%
10%
15%
20%
25%
30%
35%
F & F < 2.5 2.5 - 5 5. - 10 10 - 25. 25 - 50 50 - 100 <100
Annual Farm Gate Sales ($,000)
% of Farms Reporting
14
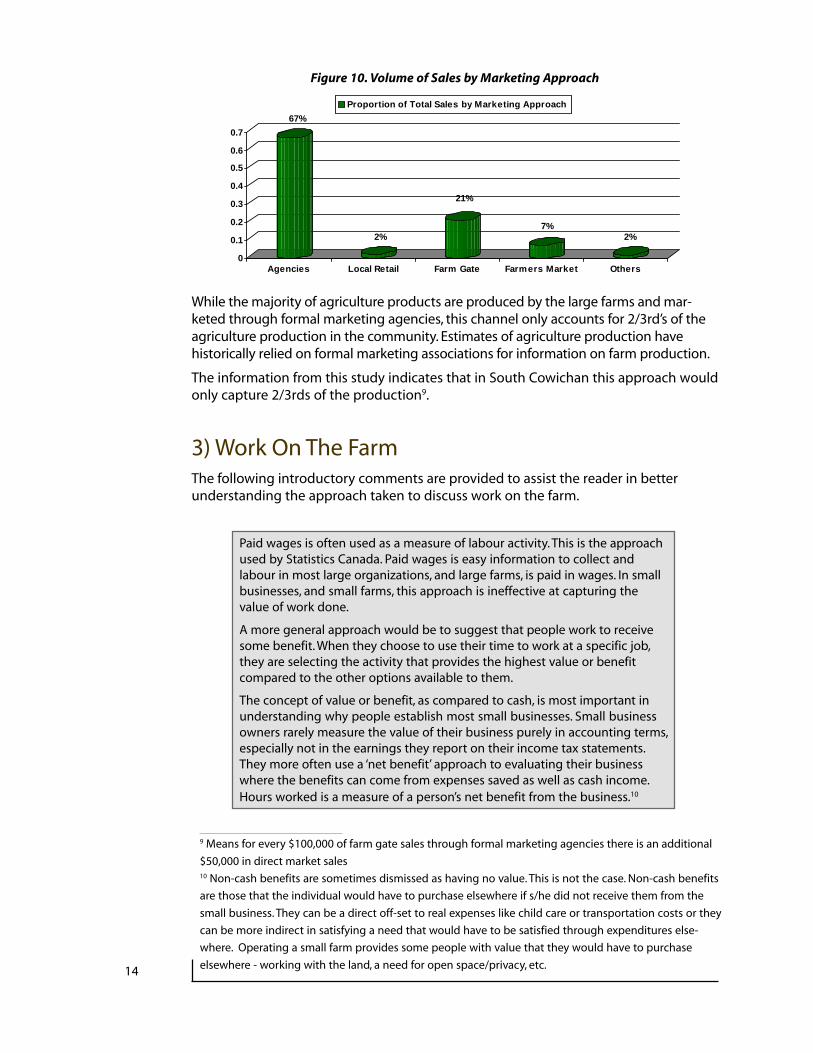
Figure 10. Volume of Sales by Marketing Approach
While the majority of agriculture products are produced by the large farms and mar-keted through formal marketing agencies, this channel only accounts for 2/3rd’s of theagriculture production in the community. Estimates of agriculture production havehistorically relied on formal marketing associations for information on farm production.
The information from this study indicates that in South Cowichan this approach wouldonly capture 2/3rds of the production9.
3) Work On The FarmThe following introductory comments are provided to assist the reader in betterunderstanding the approach taken to discuss work on the farm.
Paid wages is often used as a measure of labour activity. This is the approachused by Statistics Canada. Paid wages is easy information to collect andlabour in most large organizations, and large farms, is paid in wages. In smallbusinesses, and small farms, this approach is ineffective at capturing thevalue of work done.
A more general approach would be to suggest that people work to receivesome benefit. When they choose to use their time to work at a specific job,they are selecting the activity that provides the highest value or benefitcompared to the other options available to them.
The concept of value or benefit, as compared to cash, is most important inunderstanding why people establish most small businesses. Small businessowners rarely measure the value of their business purely in accounting terms,especially not in the earnings they report on their income tax statements.They more often use a ‘net benefit’ approach to evaluating their businesswhere the benefits can come from expenses saved as well as cash income.Hours worked is a measure of a person’s net benefit from the business.10
67%
2%
21%
7%2%
0
0.1
0.2
0.3
0.4
0.5
0.6
0.7
Agencies Local Retail Farm Gate Farmers Market Others
Proportion of Total Sales by Marketing Approach
9 Means for every $100,000 of farm gate sales through formal marketing agencies there is an additional
$50,000 in direct market sales10 Non-cash benefits are sometimes dismissed as having no value. This is not the case. Non-cash benefits
are those that the individual would have to purchase elsewhere if s/he did not receive them from the
small business. They can be a direct off-set to real expenses like child care or transportation costs or they
can be more indirect in satisfying a need that would have to be satisfied through expenditures else-
where. Operating a small farm provides some people with value that they would have to purchase
elsewhere - working with the land, a need for open space/privacy, etc.

15
This study uses hours worked as compared to cash wages in evaluating work on thefarm. The hours worked are valued at $9/hr to estimate a net benefit from the farm11.
The 1996 census indicated 27% of farms paid cash wages to non family members and21% of farms paid cash wages to family members. Intuitively all farms in this studyreported family hours of work and 40% reported hiring off farm work. Figure 10 showsthat the value of work reported in the Cowichan Study was 50% higher than the cashwages reported in the 1996 census.
Figure 11. Average Value of Work and Cash Wages per Farm
*From the 1996 census plus 15% growth to 2000
While one might expect the larger farms to involve more work, they do not dominatethe rural workforce. Small farms support close to half ( 44%) of the farm work.
Figure 12. Distribution of Work Between Large and Small Farms
The average value of work per farm selling under $50,000 per year is $12,000. Agreater proportion of the work done on larger farms is done by non-family labour(50%) than the farms selling direct market (20%).
The concept of farm work can also be viewed as the value of work generated by aspecific increment in sales - leading to some estimate of the jobs created for an incre-ment in sales. Figure 13 shows the average value of work per farm at different saleslevels and Figure 14 the value of sales required to support one person day of work.
44%
56%
Small Farms
Large Farms
$5,187
$12,040
$17,227
$11,378
0
4000
8000
12000
16000
20000
Value of Non-family Work
Value of FamilyWork
Total Value ofWork
Cash WagesPaid*
11 A 1997 survey of farm labour rates in BC found semi-skilled wage rates were between
$9 and $15/ hour.

16
Figure 13. Average Annual Value of Work by Farm Size
Figure 13 indicates that even the smallest farms on average require almost $10,000 ayear in work. It is interesting to note that the farms between $11,000 and $50,000annual sales on average provide a benefit of over $16,000. At this level farming is avery attractive home based second family income.
Figure 14. Sales per Person Day of Work at Different Scales of Operation
Figure 14 demonstrates three interesting points relative to farm labour. Generally:
a) as scale of operation increases farms become less labour intensive,b) for farms with annual sales $10 - $50,000, characterized by specialized direct
market farms, on average every $130 in additional sales creates another personday of work, and
c) on average, small farms are 3 times more labour intensive than large farms
The sales per person day of work does give some insight into, or perhaps reinforce,some of the perceptions of smaller farms. For farms selling under $10,000 annually alarger portion of their benefit comes as non-cash benefits – expenses saved. The breakpoint where the benefits are mostly cash varies with the type of products beingproduced. On average cash costs of production are usually in the 30% to 50% rangefor direct market operations so as sales per work/day moves above $100 the cashbenefits move closer to $75/day of work (or $9/hr). Small scale farm operations thatcan achieve the level of sales where the benefits are mostly in cash are attractivehome based second incomes.
$36
$133
$326
0
100
200
300
400
500
0 - $10 $11 - $50 >$50
Sales / Person Day of Work
Annual Farm Gate Sales ($,000)
$9,976
$16,158
$55,182
$0
$20,000
$40,000
$60,000
0 - $10 $11 - $50 >$50
Average Annual Value of Work / Farm
Annual Farm Gate Sales $’000
17
4) Value AddedThe question on value added was difficult to word and probably difficult to answer formany respondents. It is hard to define where primary production ends and valueadded begins for many products. The results from the value added question should betaken in that light.
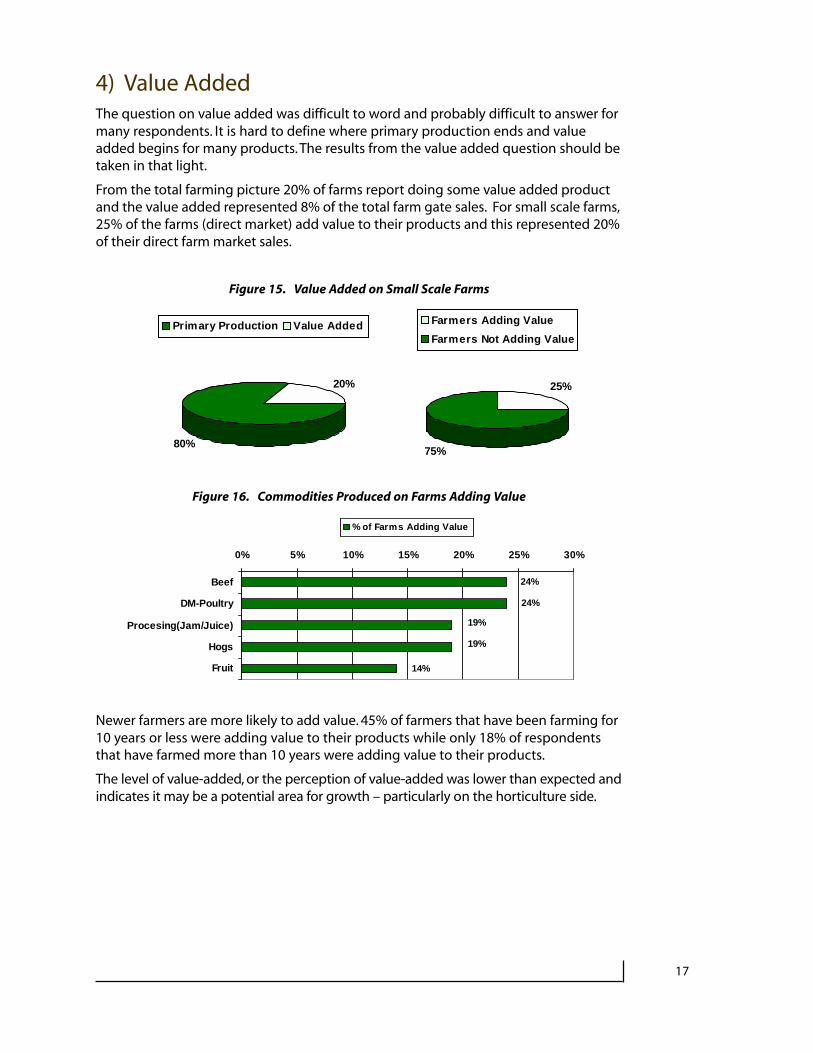
From the total farming picture 20% of farms report doing some value added productand the value added represented 8% of the total farm gate sales. For small scale farms,25% of the farms (direct market) add value to their products and this represented 20%of their direct farm market sales.
Figure 15. Value Added on Small Scale Farms
Figure 16. Commodities Produced on Farms Adding Value
Newer farmers are more likely to add value. 45% of farmers that have been farming for10 years or less were adding value to their products while only 18% of respondentsthat have farmed more than 10 years were adding value to their products.
The level of value-added, or the perception of value-added was lower than expected andindicates it may be a potential area for growth – particularly on the horticulture side.
14%
19%
24%
24%
19%
0% 5% 10% 15% 20% 25% 30%
Beef
DM-Poultry
Procesing(Jam/Juice)
Hogs
Fruit
% of Farms Adding Value
20%
80%
Primary Production Value Added
25%
75%
Farmers Adding Value
Farmers Not Adding Value

18
5) Other CommentsFour other points of interest deserve some further discussion.
a) Production for family and friends
The level of production for family and friends was interesting for several reasons.Firstly it indicates that farming activity in the rural areas is broader than is accountedfor in our normal statistics and secondly it makes a statement as to the value of farm-land classification. Some have characterized small farms as farming the tax systemrather than farming the land. The fact that a significant number of people don’t evenbother going through the process of claiming farmland classification indicates thatthis is not the case. It also begs the question – how much is the net benefit of farm-land classification?
The regulatory issues surrounding direct market livestock are often sited as a reasonsmall direct market livestock producers do not wish to be identified. This would makethe fact that a number of these producers chose to respond even more significant.
b) Farmers market and farm gate sales
Respondents indicated that product sold at farmers markets represented a little over1/4 of the product sold direct from farms. This is the first quantitative estimate of therelationship between farmers markets and farm direct sales so it is not clear if this is anormal or optimal ratio.
c) Level of value added
Direct market sales usually require some level of product differentiation from thecommodity or people would simply buy from the large retailers. Adding value is onemethod of product differentiation. The low level of on-farm value added or the poorunderstanding of what value added is may be a barrier to further growth of small scalefarms.
d) Beginning Farmers and Expanding Farmers
Figure 5 and 8 provide some interesting insight into some potential areas for growth.Figure 5 indicates that as many as 2 out of every 5 farmers has been farming less than10 years and that in the Cowichan Valley small farms have not expanded into the$10,000 to $50,000 sales range as much as in other areas of the province. This sug-gests that some of the beginning farmers are not successful in taking their farms to ahigher level of output and there may be some opportunity for growth in this area.
19
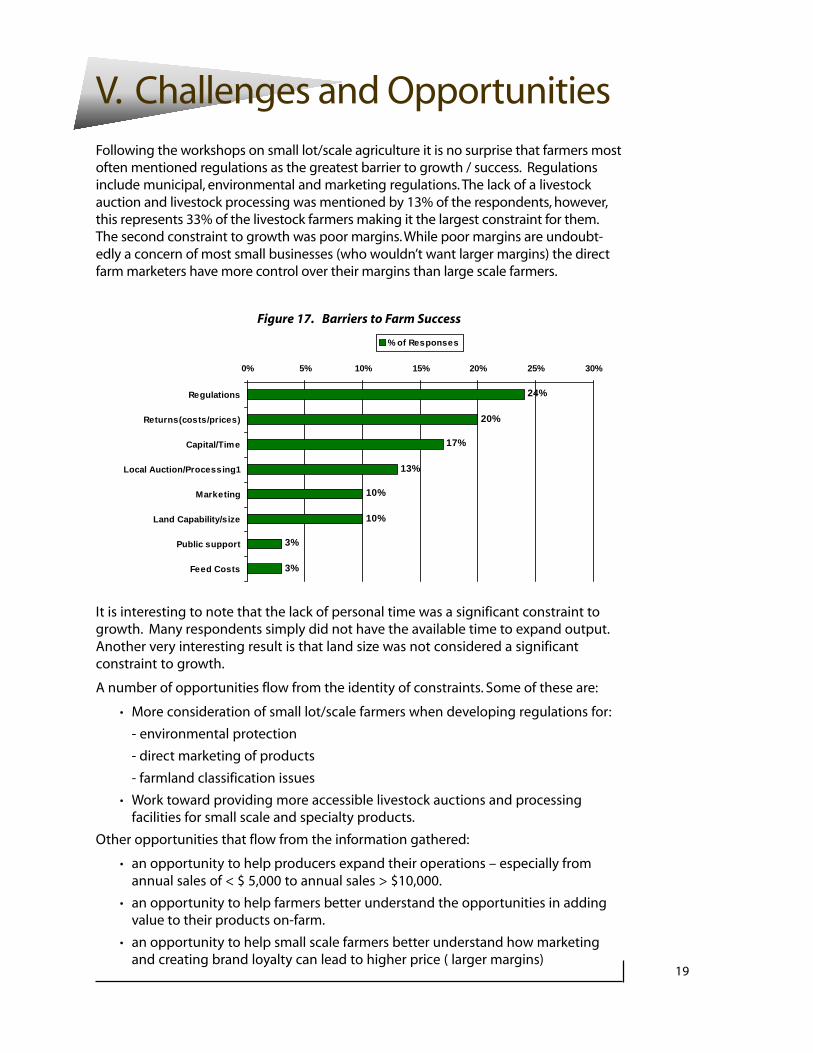
V. Challenges and OpportunitiesFollowing the workshops on small lot/scale agriculture it is no surprise that farmers mostoften mentioned regulations as the greatest barrier to growth / success. Regulationsinclude municipal, environmental and marketing regulations. The lack of a livestockauction and livestock processing was mentioned by 13% of the respondents, however,this represents 33% of the livestock farmers making it the largest constraint for them.The second constraint to growth was poor margins. While poor margins are undoubt-edly a concern of most small businesses (who wouldn’t want larger margins) the directfarm marketers have more control over their margins than large scale farmers.
Figure 17. Barriers to Farm Success
It is interesting to note that the lack of personal time was a significant constraint togrowth. Many respondents simply did not have the available time to expand output.Another very interesting result is that land size was not considered a significantconstraint to growth.
A number of opportunities flow from the identity of constraints. Some of these are:
· More consideration of small lot/scale farmers when developing regulations for:
- environmental protection
- direct marketing of products
- farmland classification issues
· Work toward providing more accessible livestock auctions and processingfacilities for small scale and specialty products.
Other opportunities that flow from the information gathered:
· an opportunity to help producers expand their operations – especially fromannual sales of < $ 5,000 to annual sales > $10,000.
· an opportunity to help farmers better understand the opportunities in addingvalue to their products on-farm.
· an opportunity to help small scale farmers better understand how marketingand creating brand loyalty can lead to higher price ( larger margins)
24%
20%
17%
13%
10%
10%
3%
3%
0% 5% 10% 15% 20% 25% 30%
Regulations
Returns(costs/prices)
Capital/Time
Local Auction/Processing1
Marketing
Land Capability/size
Public support
Feed Costs
% of Responses

20
VI. Appendix
1) Census of Agriculture Profile of South CowichanValley – Area C
2) Methodology
3) Survey Form

21
1) Census of Agriculture Profile of South Cowichan Valley – Area CThe 211 farms identified in the 1996 census of the South Cowichan census area,reported producing a wide variety of products that included almost all forms oflivestock - beef, dairy, hogs, sheep, goats, chickens, turkeys and others - fruits, vegeta-bles, forage and both field and greenhouse production of flowers and vegetables. If itis grown in BC there is a good chance it is grown in South Cowichan.
Figure 18. Types of Farm Production Reported in the 1996 Census
One could characterize agriculture in South Cowichan as being composed of a smallnumber of large commodity focused farms dispersed among many small mixed farms.This also characterizes farming in the province as a whole as seen in Figure 19.
Figure 19. Proportion of Farms in Different Annual Sales Categories –South Cowichan Compared to BC(1996 census)
0%
5%
10%
15%
20%
25%
30%
<2.5 2.5 - 5 5. - 10 10. - 25 25 - 50 50 - 100 100 - 250 250 - 500 >500
South Cowichan B.C.
105
91
68
59
45
39
33
28
22
17
16
13
10
0 20 40 60 80 100 120
Natural Forage
Cattle
Layers
Horses
Sheep
Fruit
Broilers
Hogs
Greenhouse
Berries
Goats
Field Vegetables
Christmas Trees
Farms Reporting Production of
Annual Farm Gate Sales Categories in $’000

22
The sum of the ‘farms reporting’ production of specific products (the numbers in italicsfrom figure 19) in the census totals 613 which means the 211 farms on average pro-duce 2 to 3 different commodities.
South Cowichan has a slightly higher proportion of very small farms and a slightlylower proportion of medium sized farms but generally follows the provincial profile offarm sizes.
While the 26 farms with annual revenues over $100,000 may derive their primaryincome from farming, the other 185 farms use farming as a home based secondincome to support their families and the rural community. In 1996 all the farms in theSouth Cowichan Valley collectively had $102 m invested in farm capital, contributed$25 m to the local/regional economy, supported over 400 full time equivalent jobs inthe region.
2) MethodologyThe South Cowichan Study was a survey of all the lots zoned for agriculture and all therural residential lots where farming was permitted and were drive by observationsindicated farming was taking place. Owners of multiple lots were only sent one surveyform. A total of 717 surveys were sent out. 90 were returned and 72 of those wereactive farms.
The survey distribution was designed to cast as wide a net as possible. To estimate theresponses as a proportion of total farms it is more appropriate to us the estimate oftotal farms by the Census of Agriculture (census). The 1996 census identified 211farms in the South Cowichan area (C). This represented a growth rate of 18% from1991 to 1996
(3.6 %/year). If this growth rate continued to 2000 the number of farms in the surveyarea would have grown to 240. The 72 responses would then represent 30% of thefarms in the survey area.
Figure 20 shows the proportion of different sized farms in the census and in the surveyresponses.
Figure 20. Comparison of Census Farms and Survey Responses by Size of Farm
0%
5%
10%
15%
20%
25%
30%
35%
<2.5 2.5 - 5.0 5.0 - 10.0 10.0 - 25 25 - 50 50 - 100 >100
Survey Census
Annual Sales ($’000)

23
The responses had a similar proportion of very small farms ( <$5,000/yr) and a similarportion of large farms (>$100,000)/yr. In the middle area the survey responses underrepresented the $5 - $25,000 per year farms and over represented the $25 - $100,000per year farms.
In general the survey responses are a good match to the census. Under representationof the $5,000 to $25,000 farms may create a bias in two areas. Firstly in understatingthe small farm side of any comparison between large and small farms and secondly inunder estimating the level of value added.
The responses reflected a broad number of commodities similar to the census profile.The large farm group was represented by dairy, poultry and greenhouses but not byhogs. Unfortunately the large hog producer in the area did not respond. This will notaffect the general estimates of sales but will underestimate the volume of hog produc-tion in the area (figure 2).
Figure 21 compares the distribution of farms by commodities in the responses and thecensus.
Figure 21. Farms Reporting Production – Census Farms and Survey Responses
0% 10% 20% 30% 40% 50% 60%
Beef
Eggs - Dir Market
Forage
Poultry - Dir Market
Fruit
Sheep
Other Livestock
Field Veg
Hogs
Other
Nursery
Processing
Dairy
Greenhouse
Poultry - Commodity
Survey Census
The difference in approach between the census and the survey results in a number ofthe observed differences. The survey asked for the top 3 commodities sold while thecensus asked for the existence of a farm animal, building or activity. Consequentlyhorses, forage and some beef, sheep and layers would not show up as frequently inthe survey as in the census. It is likely many of the nursery responses in the surveywere noted as greenhouses in the census. The census was conducted 4 years beforethe survey which may explain the difference in the high growth areas of direct marketpoultry and field vegetables With the differences in time and the method of askingthe question taken into consideration the profiles are fairly similar.
Survey responses were sent to the Island Farmers Alliance to remove any trackinginformation before being sent forward to the Ministry of Agriculture Food and Fisher-ies for analysis. This effort to ensure confidentiality of the responses may haveencouraged the responses in the ‘production for family and friends’ category.

24
3) Survey Form
South Cowichan Valley Agriculture Inventory Project
How long have you operated your farm? _____Years
In the last 5 years has your farm operation stayed the same size____________expanded______contracted______? And if so by how much______%
Work on your Farm
a) Family work. How much time do your family members spend working on the farm?_____Hours/day – livestock_____Person days/year – crops
b) Non-family work. How many person days of non-family labour do you employ/year? ______
Marketing Your Farm Products
What portion of your products did you sell through:
Commodity Marketing Agencies/.Associations _____ %Local Retail Food Markets/Restaurants _____ %Farmers Markets _____ %Road Side Stand /Farm Gate _____ %Others (i.e.mail order)__________ _____ %
100 %
Adding Value to Products On Your Farm (value above what the raw ingredients would sell for)What portion of your total sales (of all products) represents value added to raw ingredients _____%
Examples: the value of converting berries into jam, the value of dried package herbs compared to fresh herbsand the value of sausage compared to the basic cuts - do not include the cost of cutting and wrapping directmarket livestock.
How Big is Your Farm – by total salesIn what range were the total sales from your farm business in 1999?
<$2,500 _____ $10 – 24,999 _____ $50-99,999$2,500 – 4,999 _____ $25 – 49,999 _____ > $100,000$5,000 – 9,999
What Products Do You Produce? To develop a profile of the products produced in your area please indicateyour main farm products and the proportion of your revenues that they account for:
Product Portion of revenues
1)____________ ______%
2)____________ ______%
3) ___________ ______%
What is the greatest barrier to the success of your farm operation?


