32
South Sudan Ministry of Health Republic of South Sudan Printed: 07:42 Wednesday, 15 November 2017 UTC Integrated Disease Surveillance and Response (IDSR) Annexes W45 2017 (Nov 06-Nov 12)

South Sudan
Ministry of Health
Republic of South SudanPrinted: 07:42 Wednesday, 15 November 2017 UTC
Integrated Disease Surveillance and
Response (IDSR)
Annexes W45 2017 (Nov 06-Nov 12)

Access and Utilisation
Slide 2 Map 1 Map of consultations by county (2017)
Indicator-based surveillance
Slide 3 Figure 1 Proportional mortality
Slide 4 Figure 2 Proportional morbidity
Slide 5 Figure 3 Trend in consultations and key diseases
Disease trends and maps
Malaria
Slide 6 Trend in malaria cases over time
Slide 7 Malaria maps and alert management
Acute Watery Diarrhoea (AWD)
Slide 8 Trend in AWD cases over time
Slide 9 AWD maps and alert management
Bloody diarrhoea
Slide 10 Trend in bloody diarrhoea cases over time
Slide 11 Bloody diarrhoea maps and alert management
Measles
Slide 12 Trend in measles cases over time
Slide 13 Measles maps and alert management
Sources of data
1. Weekly IDSR Reporting Form
2. Weekly EWARS Reporting Form
Contents
1 W45 2017 (Nov 06-Nov 12)

Map 1 | Map of total consultations by county (W45 2017)
Number of consultations
0 1 1,000 2,500 5,000
Hub W45 2017
South Sudan 98,183 6,159,766
Access and Utilisation | Map of consultations by county
2 W45 2017 (Nov 06-Nov 12)
Manyo
Rumbek North
Tambura
Rumbek CentreTwic East
Aweil West
Wulu
Ulang
Magwi
BudiYei
Aweil NorthGuit
Mayom
Abiemnhom
Tonj North
ToritLainya
Tonj East
Bor
Mundri East
Cueibet
Rumbek EastYirol East
Juba
Ibba
Awerial
Pochalla
Koch
Pariang
Yambio
Baliet
DukAkobo
Jur River
Tonj South
Terekeka
Kajo Keji
Maridi
Kapoeta North
Renk
Ikotos
Kapoeta East
Kapoeta South
Lopa Lafon
Panyikang
Morobo
Twic
Raja
Canal Pigi
Wau
Mvolo
Nagero
Maiwut
Pibor
Gogrial East
Nzara
Abyei
Ezo
Aweil East
Gogrial WestAweil South
Aweil Centre
FangakLongechuk
Yirol West
Maban
Melut
Luakpiny Nasir
Fashoda
Panyijiar
Mayendit
Malakal
Rubkona
Ayod
Mundri West
Leer
Uror
Nyirol
Aweil 8,936 723,274
Bentiu 12,253 919,324
Bor 8,169 384,991
Juba 11,288 472,623
Kwajok 10,196 816,003
Malakal 6,005 724,187
Rumbek 16,511 728,112
Torit 3,648 342,294
Wau 9,524 581,891
Yambio 11,653 467,067
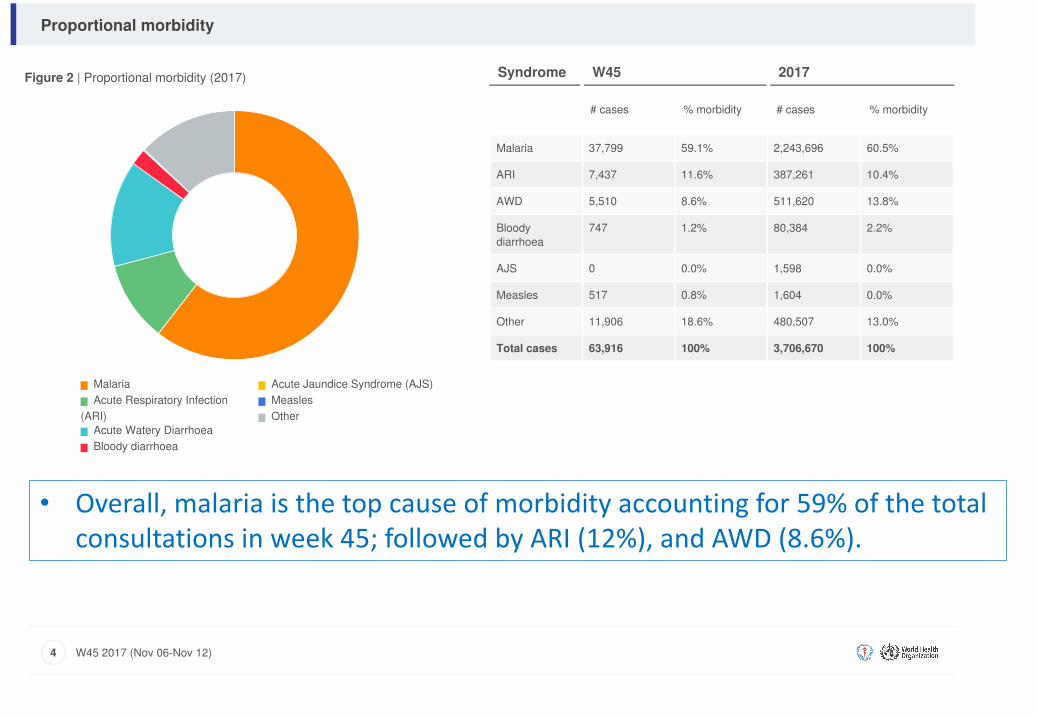
Figure 2 | Proportional morbidity (2017)
Malaria
Acute Respiratory Infection
(ARI)
Acute Watery Diarrhoea
Bloody diarrhoea
Acute Jaundice Syndrome (AJS)
Measles
Other
Syndrome W45 2017
# cases % morbidity # cases % morbidity
Malaria 37,799 59.1% 2,243,696 60.5%
ARI 7,437 11.6% 387,261 10.4%
AWD 5,510 8.6% 511,620 13.8%
Bloody
diarrhoea
747 1.2% 80,384 2.2%
AJS 0 0.0% 1,598 0.0%
Measles 517 0.8% 1,604 0.0%
Other 11,906 18.6% 480,507 13.0%
Total cases 63,916 100% 3,706,670 100%
Proportional morbidity
4 W45 2017 (Nov 06-Nov 12)
• Overall,malariaisthetopcauseofmorbidityaccountingfor59%ofthetotalconsultationsinweek45;followedbyARI(12%),andAWD(8.6%).

Figure 3 | Trend in total consultations and key diseases (W39)
Total consultations
Malaria
Acute Respiratory Infection (ARI)
Acute Watery Diarrhoea
Acute Jaundice Syndrome (AJS)
Measles
Trend in consultations and key diseases
5 W39 2017 (Sep 25-Oct 01)
Num
ber
W39 2
016
W44 2
016
W48 2
016
W52 2
016
W05 2
017
W09 2
017
W13 2
017
W18 2
017
W22 2
017
W26 2
017
W31 2
017
W35 2
017
W39 2
017
0
25000
50000
75000
100000
125000
150000
175000
200000
225000
250000
275000
IDSRtrendsinabsolutecountsFigure 3 | Trend in total consultations and key diseases (W45)
Total consultations
Malaria
Acute Respiratory Infection (ARI)
Acute Watery Diarrhoea
Acute Jaundice Syndrome (AJS)
Measles
Trend in consultations and key diseases
5 W45 2017 (Nov 06-Nov 12)
Num
ber
W48 2
016
W52 2
016
W05 2
017
W09 2
017
W13 2
017
W18 2
017
W22 2
017
W26 2
017
W31 2
017
W35 2
017
W39 2
017
W44 2
017
0
25000
50000
75000
100000
125000
150000
175000
200000

Figure 3 | Trend in total consultations and key diseases (W39)
Total consultations
Malaria
Acute Respiratory Infection (ARI)
Acute Watery Diarrhoea
Acute Jaundice Syndrome (AJS)
Measles
Trend in consultations and key diseases
5 W39 2017 (Sep 25-Oct 01)
Num
ber
W39 2
016
W44 2
016
W48 2
016
W52 2
016
W05 2
017
W09 2
017
W13 2
017
W18 2
017
W22 2
017
W26 2
017
W31 2
017
W35 2
017
W39 2
017
0
25000
50000
75000
100000
125000
150000
175000
200000
225000
250000
275000
IDSRProportionatemorbiditytrends
Intherelativelystablestates,malariaisthetopcauseofmorbidityaccountingfor48%oftheconsultationsinweek45withacumulative41%in2017.Themalariaproportionatemorbidityincreasedfromanaverageof30%priortothemalariatransmissionseasontonearly48%currently.
0
20
40
60
80
100
120
140
160
0%
10%
20%
30%
40%
50%
60%
70%
1 2 3 4 5 6 7 8 9 101112131415161718192021222324252627282930313233343536373839404142434445
Num
bero
fcon
sulta
tions
Thou
sand
s
Morbidity%
Epidemiologicalweekofreportingin2017
Fig.1|IDSRProportionatemorbiditytrends,week1to45,2017
Consultations Malaria ARI AWD ABD Measles

Figure 3 | Trend in total consultations and key diseases (W39)
Total consultations
Malaria
Acute Respiratory Infection (ARI)
Acute Watery Diarrhoea
Acute Jaundice Syndrome (AJS)
Measles
Trend in consultations and key diseases
5 W39 2017 (Sep 25-Oct 01)
Num
ber
W39 2
016
W44 2
016
W48 2
016
W52 2
016
W05 2
017
W09 2
017
W13 2
017
W18 2
017
W22 2
017
W26 2
017
W31 2
017
W35 2
017
W39 2
017
0
25000
50000
75000
100000
125000
150000
175000
200000
225000
250000
275000
IDPProportionatemorbiditytrends
IntheIDPs,ARIsurpassedmalariaasthetopcauseofmorbidityinweek45.HenceARIandmalariaaccountedfor24%and21%ofconsultationsinweek45.
0
5,000
10,000
15,000
20,000
25,000
30,000
35,000
40,000
45,000
50,000
0%
5%
10%
15%
20%
25%
30%
35%
40%
45%
1 2 3 4 5 6 7 8 9 10 11 12 13 14 15 16 17 18 19 20 21 22 23 24 25 26 27 28 29 30 31 32 33 34 35 36 37 38 39 40 41 42 43 44 45
Consultatio
ns
%ofM
obidity
Epiweek2017
Fig.2|IDPProportionatemorbiditytrends,week01-45,2017
Consultations Malaria ARI AWD ABD Measles

Figure 1 | Proportional mortality (2017)
Malaria
Acute Respiratory Infection
(ARI)
Acute Watery Diarrhoea
Bloody diarrhoea
Acute Jaundice Syndrome (AJS)
Measles
Other
Syndrome W45 2017
# deaths % mortality # deaths % mortality
Malaria 948 99.9% 2,067 80.7%
ARI 1 0.1% 40 1.6%
AWD 0 0.0% 90 3.5%
Bloody
diarrhoea
0 0.0% 32 1.3%
AJS 0 0.0% 1 0.0%
Measles 0 0.0% 11 0.4%
Other 0 0.0% 319 12.5%
Total deaths 949 100% 2,560 100%
Proportional mortality
3 W45 2017 (Nov 06-Nov 12)

Acute Watery Diarrhoea | Trends over time
8 W45 2017 (Nov 06-Nov 12)
Figure 5a | Trend in AWD cases over time (South Sudan)
0
5000
2500
7500
10000
12500
15000
17500
20000
Graph legend
2017
− · − · − · − − 2016
− − − − − − − 2015
· · · · · · · · · · 2014
511,620Cases
90Deaths
67Alerts
Key AWD indicators (2017) Figure 5b | % morbidity Figure 5c | Age breakdown
Jan Mar May Jul Sep Nov

Map 4 | Map of AWD cases by county (2017)
a. 2014 b. 2015
c. 2016 d. 2017
Acute Watery Diarrhoea | Maps and Alert Management
9 W45 2017 (Nov 06-Nov 12)
Map 5 | Map of AWD alerts by county (2017)
Map legend
Number of AWD cases
0 1 5,000 10,000 20,000
Number of AWD alerts
0 1 10
Alert threshold
Twice the average number of cases over
the past 3 weeks. Source: IDSR
67Alerts
21Verified
0Low Risk
0Moderate Risk
0High Risk
0Very High Risk
Risk Assessment

Acute Bloody Diarrhoea | Trends over time
10 W45 2017 (Nov 06-Nov 12)
Figure 6a | Trend in bloody diarrhoea cases over time (South Sudan)
0
500
1000
1500
2000
2500
3000
3500
Graph legend
2017
− · − · − · − − 2016
− − − − − − − 2015
· · · · · · · · · · 2014
80,384Cases
32Deaths
121Alerts
Key bloody diarrhoea indicators (2017) Figure 6b | % morbidity Figure 6c | Age breakdown
Jan Mar May Jul Sep Nov
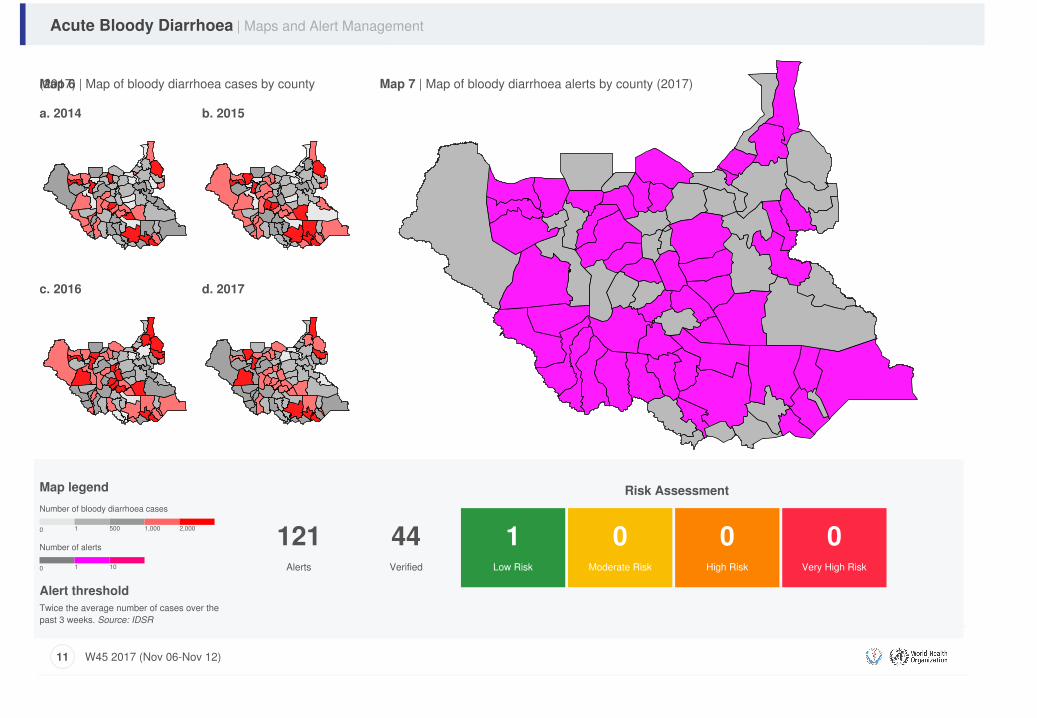
Map 6 | Map of bloody diarrhoea cases by county(2017)
a. 2014 b. 2015
c. 2016 d. 2017
Acute Bloody Diarrhoea | Maps and Alert Management
11 W45 2017 (Nov 06-Nov 12)
Map 7 | Map of bloody diarrhoea alerts by county (2017)
Map legend
Number of bloody diarrhoea cases
0 1 500 1,000 2,000
Number of alerts
0 1 10
Alert threshold
Twice the average number of cases over the
past 3 weeks. Source: IDSR
121Alerts
44Verified
1Low Risk
0Moderate Risk
0High Risk
0Very High Risk
Risk Assessment

Sincethebeginningof2017,atleast1,124suspectmeaslescasesincludingatleast11deaths(CFR0.97%)havebeenreported.Ofthese,616suspectcaseshaveundergonemeaslescase-basedlaboratory-backedinvestigation.Atleast323sampleshavebeencollected,withatotalof84measlescasesbeinglaboratoryconfirmed,while321casesand26caseswereepidemiologicallyandclinicallyconfirmedrespectively.Consequently,measlesoutbreakswereconfirmedinninecounties– Panyijiar,AweilSouth,GogrialEast,GogrialWest,Wau,Juba,Torit,Yambio,andJurRiver.MeaslesfollowupcampaignimplementedfromMay2017ineightstatehubswhere1,639,947childrensixto49months(87%)werereachedwithmeaslesvaccine.
Measles | Trends over time
12 W45 2017 (Nov 06-Nov 12)
Figure 7a | Trend in number of cases over time (South Sudan)
0
50
100
150
200
250
300
Graph legend
2017
− · − · − · − − 2016
− − − − − − − 2015
· · · · · · · · · · 2014
1,124Cases
11Deaths
55Alerts
Key measles indicators (2017) Figure 7b | % morbidity Figure 7c | Age breakdown
Jan Mar May Jul Sep Nov

Map 7 | Map of measles cases by county (2017)
a. 2014 b. 2015
c. 2016 d. 2017
Measles | Maps and Alert Management
13 W45 2017 (Nov 06-Nov 12)
Map 8 | Map of measles alerts by county (2017)
Map legend
Number of measles cases
0 1 50 100 250
Number of measles alerts
0 1 10
Alert threshold
1 case.
Source: IDSR
55Alerts
20Verified
0Low Risk
0Moderate Risk
1High Risk
1Very High Risk
Risk Assessment

Malaria | Trends over time
6 W45 2017 (Nov 06-Nov 12)
Figure 4a | Trend in number of cases over time (South Sudan)
0
20000
40000
60000
80000
100000
120000
Graph legend
2017
− · − · − · − − 2016
− − − − − − − 2015
· · · · · · · · · · 2014
2,243,696Cases
2,067Deaths
71Alerts
Key malaria indicators (2017) Figure 4b | % morbidity Figure 4c | Age breakdown
Jan Mar May Jul Sep Nov

Map 2 | Map of malaria cases by county (2017)
a. 2014 b. 2015
c. 2016 d. 2017
Malaria | Maps and Alert Management
7 W45 2017 (Nov 06-Nov 12)
Map 3 | Map of malaria alerts by county (2017)
Map legend
Number of malaria cases
0 1 10,000 20,000 50,000
Number of malaria alerts
0 1 10
Alert threshold
Twice the average number of cases
over the past 3 weeks. Source: IDSR
71Alerts
21Verified
1Low Risk
0Moderate Risk
0High Risk
0Very High Risk
Risk Assessment

RainfallexperienceforOctober2017
• MapsshowrainfallforOctober2017percentageofaverage(lessthan25%bellowisbellownormal,75-125%isnormal,greaterthan125%isabovenormal) andstandardizedprecipitationindex(SPI)
• InOctober2017;allcountiesreceivedeithernormalorbelownormalrainsapartfromKapoetaSouth;KapoetaNorth;KapoetaEast;andBudithatwereextremelywet(SPI- map).
• ProjectionsforNovember2017showthattheSouthernStatesarelikelytoreceive>300mmofrainfall;areasofcentralSouthSudanwilllikelyreceive10mm-100mmofrainfall;whilenorthernSouthSudanwillreceivetheleast(<10mm)ofrainfall.

• MostmalariacasesareoccurringincountiesinIPCcrisisphase
• TwocountieswithhighmalariacasesareinIPCemergencyphase-
• ManyofthecountiesinJongleiareinIPCcrisisphasebutmalariasurveillancedataisnotavailableforthoselocations

Malariatrendsbycounty
o At least 23 countries - Awerial, Cueibet,Rumbek East, Rumbek North, Wulu, YirolEast, Yirol West, Aweil East, Aweil North,Aweil South, Jur River, Gogrial East, TonjNorth, Tonj South, Rubkona, Twic East, Duk,Kapoeta North, Ikotos, Kapoeta East, &Terekeka have reported increasing trends ator above the third quartile [see next fourslides].
Countieswithmalariacasesexceedingthethirdquartileinweek45of2017
-
200
400
600
800
1,000
1,200
1,400
1,600
1,800
Weeks
MalariatrendsforTerekekacountyin2017
3rdQuartile C-sum 2017
-
100
200
300
400
500
600
Weeks
MalariatrendsforKapoetaEastcountyin2017
3rdQuartile C-sum 2017
-
200
400
600
800
1,000
1,200
Weeks
MalariatrendsforIkotoscountyin2017
3rdQuartile C-sum 2017
-
100
200
300
400
500
600
700
Weeks
MalariatrendsforKapoetaNorthcountyin2017
3rdQuartile C-sum 2017

Malariatrendsbycountyandrainfallpatterns
In October 2017; 4 countiesreceived rainfall that exceed thethird quartile of the rainfall forperiod 2013-2016. Thesecounties should be monitored forpotential increase in malariacases (see table)
County
Budi
Kapoeta East
Kapoeta South
KapoetaNorth
Countieswithmalariacasesexceedingthethirdquartileinweek45of2017
-
50
100
150
200
250
300
350
400
450
500
Weeks
MalariatrendsforDukcountyin2017
3rdQuartile C-sum 2017
-
100
200
300
400
500
600
Weeks
MalariatrendsforTwicEastcountyin2017
3rdQuartile C-sum 2017
-
500
1,000
1,500
2,000
2,500
Weeks
MalariatrendsforAwerialcountyin2017
3rdQuartile C-sum 2017
-
500
1,000
1,500
2,000
2,500
Weeks
MalariatrendsforCueibetcountyin2017
3rdQuartile C-sum 2017

Malariatrendsbycountyandrainfallpatterns
• During 2017, the mean rainfallin millimeters increased from2.7 and 13 in January andFebruary to a peak of 158-185in July, August, andSeptember).
• The mean precipitationreduced from 158 millimetersin September 2017 to 85.5millimeters in October 2017
Countieswithmalariacasesexceedingthethirdquartileinweek45of2017
-
500
1,000
1,500
2,000
2,500
3,000
3,500
4,000
Weeks
MalariatrendsforRumbekCentercountyin2017
3rdQuartile C-sum 2017
-
1,000
2,000
3,000
4,000
5,000
6,000
7,000
8,000
9,000
Weeks
MalariatrendsforRumbekEastcountyin2017
3rdQuartile C-sum 2017
-
200
400
600
800
1,000
1,200
Weeks
MalariatrendsforRumbekNorthCountyin2017
3rdQuartile C-sum 2017
-
200
400
600
800
1,000
1,200
Weeks
MalariatrendsforWuluCountyin2017
3rdQuartile C-sum 2017

MalariatrendsbycountyandrainfallpredictionsforOctobertoDecember2017
The rainfall outlook for Oct-Dec2017 as shared by the IGADclimate prediction & applicationcenter (ICPAC) shows that:
• Southwestern parts the countrywill likely receive normal toabove normal rainfall (near tobelow normal rains in rest ofcountry)
• Above normal temperaturescountrywide
• The above normal rains in thesouthwest will likely lead toflooding, a protracted malariatransmission season, increasedrisk of waterborne diseases
• In the rest of country, low rainswill likely reduce quality of waterthus a possibly exaggerated riskof waterborne diseases
Countieswithmalariacasesexceedingthethirdquartileinweek45of2017
-
500
1,000
1,500
2,000
2,500
Weeks
MalariatrendsforYirolEastCountyin2017
3rdQuartile C-sum 2017
-
1,000
2,000
3,000
4,000
5,000
6,000
7,000
Weeks
MalariatrendsforYirolEastCountyin2017
3rdQuartile C-sum 2017
-
500
1,000
1,500
2,000
2,500
Weeks
MalariatrendsforAweilCenterCountyin2017
3rdQuartile C-sum 2017
-
2,000
4,000
6,000
8,000
10,000
12,000
14,000
16,000
Weeks
MalariatrendsforAweilEastCountyin2017
3rdQuartile C-sum 2017

Malariatrendsbycountyandproposedmitigationmeasures
Proposed mitigation measures forareas expected to receive normalor above normal rain:• Contingency planning, riskcommunication
• Preposition kits for malaria,waterborne diseases
• Enhance surveillance for malaria,AWDs
• Preventive vaccination whereapplicable
As for areas expected to have lessthan normal rains, therecommended measures entail:
• Enhance WASH, water qualitytesting, water trucking, & watertreatment
• Nutrition surveillance &prepositioning of SAM kits
Countieswithmalariacasesexceedingthethirdquartileinweek45of2017
-
500
1,000
1,500
2,000
2,500
3,000
3,500
Weeks
MalariatrendsforAweilNorthCountyin2017
3rdQuartile C-sum 2017
-
200
400
600
800
1,000
1,200
1,400
Weeks
MalariatrendsforRubkonaCountyin2017
3rdQuartile C-sum 2017
-
500
1,000
1,500
2,000
2,500
3,000
Weeks
MalariatrendsforJurRiverCountyin2017
3rdQuartile C-sum 2017
-
500
1,000
1,500
2,000
2,500
3,000
3,500
4,000
4,500
5,000
Weeks
MalariatrendsforGogrialEastCountyin2017
3rdQuartile C-sum 2017

MalariatrendsbycountyandproposedmitigationmeasuresCountieswithmalariacasesexceedingthethirdquartileinweek45of2017
-
500
1,000
1,500
2,000
2,500
3,000
Weeks
MalariatrendsforTonjEastCountyin2017
3rdQuartile C-sum 2017
-
500
1,000
1,500
2,000
2,500
3,000
3,500
4,000
4,500
Weeks
MalariatrendsforTonjNorthCountyin2017
3rdQuartile C-sum 2017
-
500
1,000
1,500
2,000
2,500
3,000
Weeks
MalariatrendsforTonjSouthCountyin2017
3rdQuartile C-sum 2017

Malaria trends in select IDP sites
Malaria trends in four of the large IDP sites - Bentiu Poc; UN House Poc; Malakal PoC; and Renk are either at or belowthe third quartile
-
10
20
30
40
50
60
70
1 3 5 7 9 11 13 15 17 19 21 23 25 27 29 31 33 35 37 39 41 43 45 47 49 51
Proportionatemorbidity%
EpiWeek
Figure10a|MalariatrendforIDPsinBentiuPoC2017
Thirdquartile Propmob 2017
- 5
10
15
20
25
30
35
40
45
50
1 3 5 7 9 11 13 15 17 19 21 23 25 27 29 31 33 35 37 39 41 43 45 47 49 51
Proportionatemrobidity%
Epiweek
Figure10c|EWARNtrendsforMalariainUNHouse,2017
Thirdquartile Propmob 2017
- 10
20
30
40
50
60
70
80
1 3 5 7 9 11 13 15 17 19 21 23 25 27 29 31 33 35 37 39 41 43 45 47 49 51 53
Proportio
natemorbidity%
Weekofreporting
Figure10b|MalariatrendforIDPsinMalakalPoC,2017
Thirdquartile Propmob 2017
- 5
10
15
20
25
30
35
40
45
50
1 3 5 7 9 11 13 15 17 19 21 23 25 27 29 31 33 35 37 39 41 43 45 47 49 51
Proportio
natem
orbidity%
Figure10d|EWARNtrendsforMalariainRenk,2017
Thirdquartile Propmob 2017

Visceral Leishmaniasis | Kala-azar
Kala-azar is endemic in Upper Nile, Unity,Jonglei, & Kapoeta. Responseinterventions have been complicated byinsecurity, population displacement, poorliving conditions, increasing food insecurity,closure of treatment facilities; and lowtreatment completion rates.
Since the beginning of 2017, a total of2,722 cases including 56 deaths (CFR2.1%); 23 (0.8%) defaulters; 2,339(85.9%) new cases; 119(4.4%) PKDL; and264(9.7%) relapses - all reported from lessthan half of the 23 treatment centers.
In the corresponding period of 2016, a totalof 3,513 cases including 85 deaths (CFR2.6%) and 65(2.0%) defaulters werereported from 21 treatment centers.The majority of cases in 2017 have been reported from Lankien (1,181), Old Fangak (733), Kurwai (201), Chuil (103), Walgak (122), Pagil (62), Malakal IDP (96), Kapoeta (42), and Bunj (45).
The most affected groups include, males [1,322 cases (48.6%)], those aged 5 - 14years [1,112(40.9%) and ≥15years and above[922 cases (33.9%)]. A total of 519 cases (19.1%)] occurred in children <5years.
We are currently in the peak transmission season [September to December]. Hence current efforts by the taskforce entail trainingof health workers, and stocking ample supplies of diagnostics and medicines at all designated treatment centers.
In recent years, we have seen more than expected transmission from September to December in areas affected by conflict,displacement, severe food insecurity, and poor living conditions.
3
patients. Currently one team is in Kapoeta South and Kapoeta East the next teams will travel to Malakal and Fangak
x IMA/KalaCore in collaboration with WHO/MOH have responded to two suspected cases
(both are children) of KA at Alshaba Hospital in Juba. One of the cases is positive, currently on treatment and the other negative.
x Strengthening coordination amongst partners, there will be KA coordination meeting on the 3rd of Nov 2017.
x Conduct training on the use of IEC materials and conduct KA awareness using the IEC materials in KA endemic areas.
Graph:1Cummulative number of VL new cases by 43 (23rd Oct 2017 – 29th Oct 2017).
Graph: 2 Cumulative numbers of VL new cases and total cases by facilities – Week 1- to 43

Hepatitis E Virus (HEV)
Hepatitis E virus transmissioncontinues to be reported indisplaced populations.Genotype 1 has been isolatedfrom these outbreaks since2012. This therefore suggestssub-optimal access to safewater and sanitation astransmission drivers.
Cumulatively, a total of 452HEV cases have been reportedfrom Bentiu PoC in 2017 [onecase reported in the week]. (Fig.19). Current response entailsbehavior changecommunication to improvehygiene, access to safe water,and sanitation.Since the beginning of the crisis, 3,692 HEV cases including 25 deaths (CFR 0.68%) reported in Bentiu; 174 casesincluding seven deaths (CFR 4.4%) in Mingkaman; 38 cases including one death (CFR 2.6%) in Lankien; 3 confirmed HEVcases in Melut; 3 HEV confirmed cases in Guit;1 HEV confirmed case in Leer; and Mayom/Abyei [75 cases including 13deaths with 7 HEV PCR positive cases.
0
50
100
150
200
250
300
350
02468
10121416
3 9 152127333945515 11172329354147536 121824303642482 8 1420263238
2014 2015 2016 2017
No.ca
sesinBentiu
No,casesinothersites
Epidemiological weekAwerial Lankien Bentiu

Acute Flaccid Paralysis | Suspected Polio
In week 44, 13 new AFP cases were reported with date of onset in 2017 from Eastern Equatoria (2), Jonglei (2), Lakes (2), Northern Bahr el Ghazal (1), Unity (2), Upper Nile (2), and Warrap (3).
During 2017, a cumulative of 321 AFP cases have been reported countrywide. The annualized non-Polio AFP (NPAFP) rate (cases per 100,000 population children 0-14 years) is 4.61 per 100,000 population of children 0-14 years (target ≥2 per 100,000 children 0-14 years).
Stool adequacy was 88% in 2017, a rate that is higher than the target of ≥80%.
Environmental surveillance ongoing sinceMay 2017; with 16 samples testing positivefor non-polio enterovirus.
Source: South Sudan Weekly AFP Bulletin
By County 2016
2017
*As of epidemiological week 44/2017 # of Counties / stool adequacy rates in 2017*
State Hubs =0 >0<79 80-89% >90 Total
CENTRAL EQUATORIA HUB 3 0 1 2 6 EASTERN EQUATORIA HUB 1 0 0 7 8 JONGLEI HUB 4 1 0 6 11 LAKES HUB 0 0 1 7 8
NORTHERN BAHR EL GHAZAL HUB 0 1 2 2 5
UNITY HUB 3 3 0 3 9 UPPER NILE HUB 5 5 1 1 12 WARRAP HUB 0 0 1 6 7
WESTERN BAHR EL GHAZAL HUB 0 2 0 1 3
WESTERN EQUATORIA HUB 0 1 0 9 10
Total number 16 13 6 44 79
Percent 20% 16% 8% 56% 100% *As of epidemiological week 44/2017

Mortality in the IDPs
Prospective mortality surveillance is ongoing in the large internally displaced population camps that areprincipally located in the UN Protection of Civilian sites in Bentiu, Malakal, Wau, and Juba.
Among the IDPs from these locations, mortality data was received from Akobo and UN House PoC in week45. (Table 6). Four deaths were reported during the reporting week. UN House PoC reported 4 (100%)deaths in the week. During the week, 4 (100%) deaths were recorded among children <5 years in (Table 6).
The causes of death in the IDP sites during the current week are shown in Table 6. The top causes of mortality in the week were pneumonia and malaria each accounting for 50% of the respective deaths in the week.
Table 6 | Proportional mortality by cause of death in IDPs W45 2017
CauseofDeathbyIDPsite
Juba3Totaldeaths
Proportionatemortality[%]<5yrs
Malaria 2 2 50
Pneumonia 2 2 50
GrandTotal 4 4 100

Crude and under five mortality rates in IDPs
The U5MR in all the IDP sites that submitted mortality data in week 45 of 2017 is below the emergency threshold of 2 deaths per 10,000 per day (Fig. 20).
The Crude Mortality Rates [CMR] in all the IDP sites that submitted mortality data in week 45 of 2017were below the emergency threshold of 1 death per 10,000 per day (Fig. 21).
0.0
0.5
1.0
1.5
2.0
2.5
1 4 7 10 13 16 19 22 25 28 31 34 37 40 43 46 49 52 3 6 9 12 15 18 21 24 27 30 33 36 39 42 45
2016 2017
deathsper10,000perd
ay
Epidemiological week
Figure20|EWARNU5MRbySite- W12016toW45of2017
Bentiu Juba3 Malakal Threshold WauPoC
0.0
0.2
0.4
0.6
0.8
1.0
1.2
1.4
1.6
1 4 7 10 13 16 19 22 25 28 31 34 37 40 43 46 49 52 3 6 9 12 15 18 21 24 27 30 33 36 39 42
2016 2017
deathsper10,000perd
ay
Epidemiological week
Figure21|EWARNCrudeMortalityRateforW12016toW45of2017
Bentiu Juba3 Malakal MelutAkobo WauShiluk Threshold WauPoC

Overall mortality in the IDPs in 2017
• A total of 808 deaths have been reported from the IDP sites in 2017 Table 7.
• The top causes of mortality in the IDPs in 2017 include malaria, medical complications ofmalnutrition, pneumonia, perinatal complications, and TB are shown in Table 7.
Table 7 | Mortality by IDP site and cause of death as of W45, 2017WEEK45
IDPsite Acutewatery
diarrhoe
a
GSW
HeartFailure
Kala-Azar
Malaria
Materna
ldeath
Men
ingitis
Perina
taldeath
Pneu
mon
ia
Rab
ies
SAM
Stroke
TB/H
IV/A
IDS
Cancer
TB Cholera
HIV/A
IDS
Hypertention
Susp.TB
TB
Others
Grand
Total
Bentiu 20 10 14 2 39 4 3 31 18 1 55 3 7 10 2 2 8 24 20 223 496Juba3 3 5 19 11 20 1 1 2 15 1 2 14 32 126Kodok 1 2 3Malakal 2 2 7 5 2 5 6 1 1 6 64 101Akobo 3 2 2 16 8 1 1 1 14 48BorPOC 1 14 15WauPoC 9 1 1 1 1 6 19GrandTotal 35 12 21 4 76 6 3 50 51 2 57 9 8 19 2 2 25 2 29 40 355 808Proportionate
mortality[%] 4.3 1.5 2.6 0.5 9.4 0.7 0.4 6.2 6.3 0.2 7.1 1.1 1.0 2.4 0.2 0.2 3.1 0.2 3.6 5.0 43.9 100.0

For more help and support,
please contact:
Dr. Pinyi Nyimol Mawien
Director General Preventive Health Services
Ministry of Health
Republic of South Sudan
Telephone: +211 955 604 020
Dr. Mathew Tut Moses
Director Emergency Preparedness and Response (EPR)
Ministry of Health
Republic of South Sudan
Telephone: +211 956 420 189Notes
WHO and the Ministry of Health gratefully acknowledge health cluster and health pooled fund (HPF)
partners who have reported the data used in this bulletin. We would also like to thank ECHO and
USAID for providing financial support.
The data has been collected with support from the EWARS project. This is an initiative to strengthen
early warning, alert and response in emergencies. It includes an online, desktop and mobile
application that can be rapidly configured and deployed in the field. It is designed with frontline users
in mind, and built to work in difficult and remote operating environments. This bulletin has been
automatically published from the EWARS application.
More information can be found at http://ewars-project.org
Ministry of Health
Republic of South
Sudan


![South Sudan IDSR Annex - W36 2018 [Repaired]](https://static.documents.pub/doc/80x56/6195f68d9594313a950318d7/south-sudan-idsr-annex-w36-2018-repaired.jpg)


