34
1 Southeast Research Station Field Day Summaries 2005 LSU AgCenter Southeast Research Station Franklinton, LA lsuagcenter.com Research Summary 05-63-01 68

1
Southeast Research Station Field Day Summaries
2005
LSU AgCenter Southeast Research Station
Franklinton, LA
lsuagcenter.com
Research Summary 05-63-01 68

2
Table of Contents Title Pages Summer-grown Baleage Crops for Dairy Cattle 3-4 Variation in the Male to Female Ratio in Calves Born 5-6 on Selected Farms in Louisiana, Mississippi and New York
Phosphorus Supplementation for Lactating Dairy Cows 7-8
The Effects of Dietary Anion-cation Difference 9-10 on Component-fed Dairy Cattle During the Summer Sprinkler Cooling of Lactating and Non-lactating Holstein Cows. 11-12 The Effects of Feeding Yeast Culture During the Transition 13-17 Period of Holstein Cows during the Summer Heifer Mastitis Project Protocol 18 Alfalfa Baleage Production: Yield, Persistence, Quality, 19-20 and Economics (2 Yr. Summary) Performance of Warm Season Annual Forage Crops at the 21-24 Southeast Research Station, 2004 Performance of Cool Season Annual Forage Crops at the 25-29 Southeast Research Station, 2003-2004 Southeast Research Station Forage Quality Laboratory 29-33 Producer Sample Results, 2004

3
Contributors
Allison, Wink, Professor, LSU AgCenter Northeast Research Station Anders, Ruben, Forage Plot Supervisor, LSU AgCenter, Southeast Research Station Canal, Anita, Graduate Student, LSU AgCenter, Dairy Science Department Cooper, R. K., LSU Veterinary Science Department Cox, Catherine, Res. Associate, LSU AgCenter, Southeast Research Station Doughty, Tara, Res. Associate, LSU AgCenter, Southeast Research Station Hay, Gary, Dairy Specialist, LSU AgCenter, Dairy Science Department McCormick, Mike, Professor and Resident Coordinator, LSU AgCenter, Southeast R. S. Moreira, Vinicius, Assistant Professor, LSU AgCenter, Southeast Research Station Owens, Bill, Professor, LSU AgCenter, Hill Farm Research Station Rycroft, H., Genex Cooperative, Inc, Shawano, WI Simmons, Jerry, Res. Associate, LSU AgCenter, Southeast Research Station Taylor, Tara, Gradua te Student, LSU AgCenter, Dairy Science Department Walz, Randy, Res. Associate, LSU AgCenter, Southeast Research Station Ward, Jerry, Assoc. Professor (former), LSU AgCenter, Southeast Research Station Willard, S. T., Assoc. Professor, MSU Animal and Dairy Science Department Venuto, Brad, Assoc. Professor (former), LSU AgCenter, Southeast Research Station Zeringue, Laura, Res. Assoc., LSU AgCenter, Southeast Research Station

4
Summer-grown Baleage Crops for Dairy Cattle
Mike McCormick and Catherine Coxe
Introduction. Annual ryegrass is the most widely used baleage crop in Louisiana, but many dairymen are unable to produce sufficient quantities of ryegrass baleage to meet their stored forage needs. The objective of the present experiment was to evaluate three warm-season crops stored as baleage. Ryegrass baleage was also produced and served as a positive control. The primary factors evaluated in this study were forage quality, storage losses, and lactation performance. Procedures. The three summer-grown forages evaluated were common signalgrass (Brachiaria decumbens), ‘Sumrall 007’ bermudagrass, and ‘NK-300’ forage sorghum. All forages were managed for optimum yield and quality. Signalgrass and bermudagrass were harvested at early heading and sorghum was harvested in the vegetative stage (4 ft height). Forages were wilted in the windrows for 24-48 hours, baled (4 x 4.5 ft bales), and individually wrapped with six layers of white stretch film. Bales were sampled and weighed at the beginning and end of the six-month storage period. At opening, bales were scored for moldiness and ground. Ground (2-6 in length) baleage was individually fed to 40 mid- lactation Holstein cows (10 per forage). Cows were fed grain twice a day immediately before to milking. Cows were weighed and condition scored at two-week intervals during the eight-week feeding study. Milk weights were determined daily, and milk composition was evaluated weekly. Rumen pH and fatty acids were determined from fluid obtained via rumenocentisis on the final day of the study. Results. The forage quality data for the baleage crops are presented in Table 1. The ryegrass and sorghum dry matter concentrations were considerably lower than optimum (40%-60%). Poor drying conditions were encountered after cutting the ryegrass, which necessitated baling before an ideal moisture level was achieved. In the case of the sorghum, drying conditions were excellent, but the inherent high moisture content of forage sorghum and the thick stem prevented adequate drying. Nevertheless, all crops stored well, with storage losses (shrink) equaling less than 2% for all crops. Protein and energy concentrations tended to be higher in the ryegrass and signalgrass than the bermudagrass and sorghum. The baleage pH level was lowest for sorghum, probably related to its high sugar content and low buffering capacity, and highest for ryegrass baleage. Little surface mold was detected on ryegrass and signalgrass bales. Bermudagrass was the moldiest of all crops evaluated, likely a consequence of its low sugar content (Table 2). Lactation performance related to the baleage crops is reported in Table 3. Cows consumed more bermudagrass baleage than signalgrass, but sorghum consumption was the lowest of all crops evaluated. The sorghum did tend to heat more than the other crops in the trough, which may have limited intake and performance. Milk fat percentage was highest for the bermudagrass and lowest for the sorghum. Lower fat percentage from sorghum-fed cows may have been related a higher grain to forage ratio. Fat-corrected milk yield was highest for the cows consuming ryegrass and signalgrass. Milk production was similar for bermudagrass and sorghum. No differences in rumen pH or fatty acid concentrations were observed. Data from this study suggests that signalgrass, when harvested at the proper maturity, will generate animal

5
performance similar to annual ryegrass. Bermudagrass and sorghum may be expected to elicit slightly lower performance. Table 1. Forage quality analyses of warm-season baleage crops. Summer Crop Evaluated Item Signalgrass Bermudagrass Sorghum Ryegrass1 Dry matter, % 43.1 44.9 25.1 29.4 Protein, % 19.9 13.0 13.1 19.5 ADF, %2 29.6 31.3 40.9 33.9 NDF, % 61.3 73.2 68.5 61.4 TDN, % 63.3 60.6 59.4 65.7 1Ryegrass served as a positive control. 2ADF = acid detergent fiber, NDF = neutral detergent fiber, and TDN = total digestible nutrients. Table 2. Yield, storage losses, and mold scores for summer-grown baleage crops.1 Summer Crop Evaluated Item Signalgrass Bermudagrass Sorghum Ryegrass Dry matter, % 43.1 44.9 25.1 29.4 Bale wt, lb. 1603 1352 1800 2020 Yield /acre, tons DM1 1.6 2.7 2.1 2.1 Storage losses, % 1.0 1.7 0.2 1.7 pH 4.69 4.89 4.32 5.04 Mold score2 1.0 1.83 1.58 1.00 1Yields based on single cutting, DM = dry matter. 2 Mold score of 1 = no visible surface mold to 5 = surface completely moldy. Table 3. Lactation performance of Holstein cows fed warm-season baleage crops. Summer Crop Evaluated Item Signalgrass Bermudagrass Sorghum Ryegrass Forage intake, lb DM 23.5b 27.1c 18.3a 21.1b Grain intake, lb DM 24.6 24.6 24.6 24.4 Total DM intake, lb 48.2b 51.7c 42.9a 45.5ab Milk yield, lb 61.6 60.5 61.6 65.8 Milk fat, % 3.52 3.58 3.31 3.37 3.5% FCM yield, lb 63.1b 60.1a 59.2a 64.2b abc Values in a row with different superscript letters differ statistically.
6
Variation in the Male to Female Ratio in Calves Born on Selected Farms in Louisiana, Mississippi, and New York
Taylor1, Tara M., J.E. Chandler1, A.L. Canal1, M.E. McCormick2, R.K. Cooper3, H.
Rycroft4, S.T. Willard5. 1Dairy Improvement Center, 2Southeast Research Station and 3Veterinary Science, LSU Agricultural Experimental Station, LSU AgCenter, Baton
Rouge, LA; 4Genex Cooperative, Inc, Shawano, WI; 5Animal and Dairy Sciences, Mississippi State University, Mississippi State, MS.
Sperm cells determine the sex of the offspring in mammals. Sperm cells carry either an X chromosome, which produces a female, or a Y chromosome, which produces a male. Variation has been shown to exist in the number of X-chromosome carrying sperm cells versus Y-chromosome carrying sperm cells per ejaculate (lot). The difference is not by bull, but instead, by lot. When commercial collection facilities package and ship straws of semen, usually one cane holds 10 straws, with a high probability of the ir being from the same lot of semen. This could explain why some producers using artificial insemination seem to have so many of the same sex calves from purchased semen. It is important to further prove this finding by breeding several cows with the same ejaculate and determining the ratio of male to female calves for each ejaculate.
Thirty-nine ejaculates from eight different bulls (between 3 and 6 lots per bull) were used to breed many dairy cows. About 500 total cows were bred with different lots of semen. The cows bred live in Louisiana, Mississippi, and New York. When they calved, the sex of the newborn was recorded and reported to the researchers for analysis. As expected, a definite variation existed between lots. The percent male calves varied from 100 percent to 20 percent with the data collected at this time (Figure 1). More data is expected before a final conclusion will be made. Further analysis of the lots will be done with conventional polymerase chain reaction (PCR) and Real-Time PCR before this work is published. PCR is a biochemical technique that allows the researchers to actually determine the percent X and Y chromosomes in the total ejaculate. The calf sex data, Real-Time PCR, and conventional PCR data will all be compared to confirm the final result. If this data is correct, two conclusions could occur. First, different lots of semen from bulls should be mixed to produce a 50% chance of males and females. Second, PCR could be used to analyze a lot of semen for its sex percentage and the straws could be marketed as such.

7
Lot within Bull (1-1 = lot 1, bull 1; number in bar = number of calves per bar)
1-1
2-1
3-1
4-1
5-1
1-2
2-2
3-2
1-3
2-3
3-3
1-4
2-4
3-4
1-5
2-5
3-5
4-5
5-5
1-6
2-6
3-6
4-6
5-6
6-6
1-7
2-7
3-7
4-7
5-7
6-7
1-8
2-8
3-8
4-8
5-8
% M
ale
Cal
ves
0.0
10.0
20.0
30.0
40.0
50.0
60.0
70.0
80.0
90.0
100.0
overall mean
36
36
32
6
4
24
28
21
3619
34
42 13
17
7
7
4
4
2 2
6
5
7
6
8
9
8 8 8
10
3
1
3 3
Figure 1

8
Phosphorus Supplementation for Lactating Dairy Cows
Vinicius R. Moreira Introduction. An adequate nutrient management plans should include a complete and accurate record of nutrient inputs and outputs from the various sections of the farm, such as a yard, a field, and the entire operation. Most phosphorus (P) is brought into dairy farms in feeds and fertilizer and leaves the property as cash crops, milk and animals sold. For instance, soils should be analyzed before spreading manure onto the fields to recycle nutrients. Only imbalances should be corrected with commercial fertilizers to supply the required nutrients for growing a specific crop. Likewise, dairy diets need to be prepared with extra caution to avoid overfeeding. Current P feeding recommendations for high-producing dairy cows range from 0.32%-
0.42% of the diet dry matter (NRC, 2001). However, most dairy farmers seem to feed well above this range, with Total Mixed Ration (TMR) P contents averaging 0.49% of the dry matter (Figure 1, adapted from Moreira and Walz, 2004). Many trials evaluating overfeeding lactating cows suggest that excess P does not translate into extra benefits in production
or reproduction (Lopez et al., 2004ab, Wu et al., 2001). On the other hand, one of the major concerns of dairy nutritionists is that the P availability varies with different types of feedstuffs and therefore overfeeding could be justified to avoid the risk of deficiency. The ongoing research project is aimed at improving P feeding efficiency by manipulating dairy diets to take advantage of cows’ natural ability to mobilize calcium (Ca) and consequently P from their bones during early lactation. Current experiment. Serum Ca levels are tightly controlled by hormones that influence bone mobilization and/or intestinal absorption. That is because Ca participates in very important body functions such as muscle contraction and milk protein secretion (casein). For this reason, Ca metabolism is particularly important in the first few weeks of lactation. During that period, Ca is mobilized from the bones along with P, mainly as hydroxyapatite. The question is that, in a practical situation, do we need to feed low Ca
0.12
0.22
0.32
0.42
0.52
0.62
0.72
1 90 179 268 357 446
Samples
% P
(TM
R d
ry m
atte
r)
It’s safe to go!
Figure 1. Phosphorus concentration of 446 Total Mixed Ration (TMR) samples submitted between 1999 and 2004 to the Forage Quality Laboratory, at the LSU AgCenter Southeast Research Station (Franklinton, LA). Dashed arrows indicate the number of samples (horizontal) and TMR P concentration levels (vertical) in excess of NRC (2001) recommendation.
Range recommended by the NRC (2001)

9
diets to promote P bone mobilization in early- lactation dairy cows or can bone mobilization be stimulated by low dietary P content alone? Materials and Methods. The approach chosen to evaluate that hypothesis was to draw blood samples from 48 third- lactation cows during the transition period (days -10, 1, 15 and 30 relative to calving date) and analyze serum for markers that indicate bone mobilization. Cows are brought to the Calan gates barn in groups of eight and remain confined from at least 20 days before calving until the last cow reaches 30 days in milk. Each cow is assigned to one of four diets containing either 10% below or 15% above Ca and P recommended supply, according to the NRC (2001). Treatments are fed twice daily as TMRs. Feces are collected for three consecutive days when a group of cows averages 20 days in milk, to confirm that rations are supplying Ca and P according to the designed levels. Additionally, dry matter intake, milk production and composition, body condition scores and body weights are recorded as complementary information. Results. Currently two groups of cows have completed the protocol. We expect to complete a third group at the end of the spring. Table 1. Current averages across treatments.
Intake fresh
wt. (lb/d) Milk (lb/d)
Butterfat (%)
Protein (%)
SCC (,000)
BCS Loss
BW loss (lb/d)
Averages 76.4 93.7 3.40 3.00 245.4 0.5 5.23 Conclusions. At this moment we know that feeding excess P is an unnecessary cost to farmers, not only directly related to P supplementation, but also indirect economic, social and environmental costs. We estimated that 2,165 lb of P, costing approximately $2,244, is over-supplemented yearly in an average dairy farm and 362 tons of P inputs could be avoided in Louisiana if current feeding practices are adjusted. Additionally, reducing dietary P could limit indirect expenses, such as increased hauling costs for manure spreading over larger areas and manure removal from the farm boundaries. It may also reduce the need for fertilizer purchase, provided that N conservation measures are taken to maintain N to P ratio closer to crop requirements (~7:1). Finally, along with management practices to reduce soil erosion, lowering manure P content will reduce P load into public waters from agriculture. LSU AgCenter. 2004. Louisiana Summary – Agriculture and Natural Resources.
http://www.lsuagcenter.com/agsummary/ Lopez, H., F.D. Kanitz, V.R. Moreira, L.D. Satter, and M.C. Wiltbank. 2004.
Reproductive performance of dairy cows fed two concentrations of phosphorus. J. Dairy Sci. 87:146-157.
Lopez, H., F.D. Kanitz, V.R. Moreira, M.C. Wiltbank, and L.D. Satter. 2004. Effect of Dietary Phosphorus on Performance of Lactating Dairy Cows: Milk Production and Cow Health. J. Dairy Sci. 87:139-145.
Moreira, V.R., and R. Walz. What is so important about phosphorus in dairy diets? 2004. 2004 Louisiana Dairy Report, p. 13-18.
Wu, Z., L.D. Satter, A.J. Blohowiak, R.H. Stauffacher, and J.H. Wilson. 2001. Milk production, estimated phosphorus excretion, and bone characteristics of dairy cows fed different amounts of phosphorus for two or three years. Dairy Sci. 84:1738-1748.

10
The Effects of Dietary Anion-cation Difference on Component-fed Dairy Cattle during the Summer
Jerry Ward and Laura Zeringue
Four trials (1997, 1998, 1999, and 2001) were conducted to determine the effect of increasing dietary cation-anion difference (DCAD) on animal performance of cattle during hot weather. DCAD was increased by adding sodium bicarbonate and potassium carbonate. These two ingredients were added so that half of the increase in DCAD came from each source. The sodium bicarbonate and potassium carbonate were added to the grain mix, which was fed separately from forage. Grain was fed twice a day, before each milking, and forage was offered for ad libitum consumption. Milk production and DMI were measured daily. Milk component analyses were conducted on composite samples collected from two consecutive milkings at 14-d intervals. All trials were conducted during the summer. Amount of grain fed was determined by milk production. In 1997 mid- to late- lactation cows were used. The forage consisted of corn silage and grain was fed at the rate of 0.4 lbs of grain/lb of milk produced. The study was initiated August 27 and was terminated September 24. In 1998 the corn silage was used as the forage and the study was conducted May 29 through September 3. Grain was fed at the rate of .28 lb/lb of milk produced. Mid-to late-lactation cows were used. In 1999 mid- to late- lactation cows were used and ryegrass haylage was used as the forage source. Grain was fed at the rate of .33 lb/lb of milk produced. In 2001 cows were placed on dietary treatment the day of calving and left on respective treatment for 56 d. Forage in this study consisted of (DM basis) 52.4% corn silage, 11.2% ryegrass haylage, 15.1% alfalfa hay, 15.5% whole cottonseed, and 5.3% soybean meal. Eighteen pounds of grain/d was fed. DCAD of the grain treatments in the four trials were 20 meq/kg, 44 meq/kg, and 68 meq/kg. When corn silage was fed as the forage that made the final total DCAD of the three treatments approximately 25, 34, and 42 meq/kg. When ryegrass was used as the sole forage, final DCADs were 48, 58, and 68 meq/kg. This was done to see if there was a threshold DCAD that had to be met before increasing DCAD would be beneficial. In the final experiment with the mixed forage, the final DCAD of the control diet was approximately 28 meq/kg and the diets containing increased DCAD were about 45 meq/kg. Calculations showed that as sodium bicarbonate and potassium carbonate were added to the grain mix, net energy decreased in the ration. This could have potentially masked any positive effects of increasing DCAD in the first three experiments. In the fourth experiment fat was added such that the diet containing both increased DCAD and fat had similar net energy to the control diet. The results of these four experiments show that when grain is fed separately from forage, increasing DCAD had no beneficial effect. One benefit typically seen in TMR fed herds with increasing DCAD is increased butter fat because of the buffering ability of sodium bicarbonate and potassium carbonate. The results of urine pH analysis during 1998

11
showed that the increased DCAD was altering systemic acid-base balance and the metabolically increased DCAD was active; however, none of the studies showed economic responses or improved production because of increased DCAD.
Table 1. Effects of DCAD on animal performance during 1997.
Treatment 1 2 3 Std Err Significance Butter fat,% 4.33 4.40 4.01 0.11 NS Milk protein, % 3.52 3.44 3.48 0.03 NS Milk production 62.8 57.0 62.3 0.5 NS FCM, lbs 71.8 65.3 67.5 1.1 NS DM intake, lbs 45.3 42.2 44.7 0.2 NS Table 2. Effects of DCAD on animal performance during 1998. Treatment 1 2 3 Std Err Significance Butter fat, % 3.60 3.67 3.64 0.08 NS Milk protein, % 3.14 3.20 3.18 0.05 NS Milk production 64.5 65.5 64.3 1.5 NS FCM, lbs 64.6 66.3 64.2 1.2 NS DM intake, lbs 42.6 43.7 43.8 0.8 NS Urine pH 7.93 8.19 8.24 0.08 Linear Table 3. Effects of DCAD on animal performance during 1999. Treatment 1 2 3 Std Err Significance Butter fat, % 3.29 3.33 3.37 0.07 NS Milk protein, % 3.05 3.02 2.98 0.05 NS Milk production 61.6 62.3 61.9 1.6 NS DM intake, lbs 44.0 43.7 44.0 0.9 NS Table 4. Effects of DCAD and fat on animal performance during 2001. Treatment1 D- F- D- F+ D+ F- D- F+ Std Err Significance Butter fat, % 3.21 3.34 3.22 3.39 0.18 NS Milk protein, % 2.73 2.82 2.74 2.88 0.07 Fat P<0.10 Milk, lbs 79.1 78.3 77.6 71.7 4.2 NS DM intake, lbs 42.6 43.9 45.0 44.0 1.6 NS 1 D = DCAD, F = Fat, + = increased, - = not increased.

12
Sprinkler Cooling of Lactating and Non-lactating Holstein Cows.
Jerry Ward and Laura Zeringue In an effort to minimize water usage while maintaining cooling efficiency, a study was conducted to determine the effects of using a humidistat to control the sprinklers rather than strictly time of day. Cows were separated into two groups based on parity, DIM, and milk production. All cows were housed in the same free-stall barn, and the only difference in management between the two groups was sprinkler control. Cows were fed a corn silage-based PMR that contained whole cottonseed, soybean meal, and alfalfa hay. All cows were fed a 20% CP (as is basis) concentrate twice daily based on milk production. When the sprinklers were operating, they were on for 2 minutes and off for 13 minutes in a 15-minute period. One group had its sprinklers turned on at 7 a.m. and turned off at 8 p.m. The other group’s sprinklers were turned on anytime the humidity fell below 80%. This was controlled with a humidistat. Groups were assigned to treatment and allowed a two-week adaptation period with data collected during the third week. Groups were then switched to the treatment for a two-week adaptation period with data collected during the third week. The results are shown in the following two tables. Table 1. Effects of humidistat control of sprinklers Aug. 7-13. Parameter Standard control Humidistat control Prob AM body temperature 101.5 101.4 NS PM body temperature 101.7 102.0 P<0.04 Milk production 59.6 57.7 P<0.01 Sprinkler operation., hrs 13 8.1 No heat stress, hrs 8.4 Mild heat stress, hrs 11.6 Moderate heat stress, hrs 4 Table 2. Effects of humidistat control of sprinklers Sept. 4-10. Parameter Standard control Humidistat control Prob AM body temperature 101.9 101.4 P<0.06 PM body temperature 102.4 102.6 NS Milk production 51.5 55.4 P<0.001 Sprinkler operation, hrs 13 11.6 No heat stress, hrs 4.2 Mild heat stress, hrs 15.6 Moderate heat stress, hrs 4 During the first data collection period, the sprinklers remained on less time than the timed sprinklers. This caused an increase in body temperatures during the evening and decreased milk production in the group that had sprinklers controlled by the humidistat;

13
however, during the second data collection period the amount of time the sprinklers remained on was more similar and the cows in the humidistat group had lower a.m. body temperatures and higher milk production. The results of this experiment indicate that relying on humidistat control can decrease water use for cooling by limiting the amount of time the sprinklers remain operating. This can lead to decreased animal performance, however. The data from the first period indicates that even during times of high (more than 80%) humidity, sprinklers that completely wet the cow can cool the cows. This is probably through heat transfer from the animals to the water that is running off the cows. Eight p.m. was chosen as a cut-off time for the sprinklers in the control group because we felt that as humidity increased at night, sprinkler efficiency would decline. The data from this experiment shows that this assumption needs to be investigated further and that leaving the sprinklers on later in the evening could increase cow cooling and production. This would increase costs associated with sprinkling and waste water disposal but may provide economic benefits of cooling. More research is needed.
A third experiment was conducted to determine the effects of cooling during the 28 d prior to expected calving. Cows were divided into two groups based on parity and expected calving date. Half were provided shade and half were provided shade with fans and sprinklers. Before calving, all cows were fed bahiagrass hay free choice and 10 lbs of a 20% (as is basis) concentrate. After calving, all cows received a PMR containing corn silage, alfalfa hay, and whole cottonseed free choice. In addition, primiparous cows were offered 9 lbs of the above concentrate before each milking, and multiparous cows were offered 12 lbs of the concentrate before each milking. After calving, all cows were provided with shade, sprinklers, and fans. Before calving, rectal body temperature was recorded a.m. and p.m. every Monday, Wednesday, and Friday. Colostrum samples were collected at calving to determine quality. Milk production and dry matter intake were recorded daily. Milk quality was measured at two-week intervals. The results are shown in Table 3. No sprinklers Sprinklers and Fans Prob AM body temperature 101.5 101.6 NS PM body temperature 102.4 101.9 P<0.01 Pre calving intake 19.8 19.1 NS Post calving intake 38.8 39.5 NS Milk production 79.1 78.0 NS Butter fat 3.0 3.2 P<0.08 Colostrum quality 56.1 86.2 P<0.08 Sprinkling before calving was effective in cooling cows during the afternoon. It had no effect on a.m. body temperatures but they were well with in the normal range for both groups. The lower body temperatures did not translate into increased dry matter intake in cooled cows. Also there were no post calving effects of pre-calving cooling on dry matter intake or milk production. Pre-calving cooling did lead to better colostrum quality and higher butter fat after calving. In the no-sprinklers group colostrums was below 60 mg/dl, the threshold for high quality colostrum. Cows in the sprinkled group were well above this threshold and produced very high quality colostrums. These data indicate that pre-partum cooling may be beneficial in Louisiana.

14
The Effects of Feeding Yeast Culture During the Transition Period of Holstein Cows During the Summer
Jerry Ward and Laura Zeringue
Introduction. During the hot, humid Louisiana summers, DM intake and milk production decrease. Many producers time their breeding to avoid freshening cows during July, August, and early September. This helps alleviate individual cow performance losses but can lead to uneven production across months and can increase days open. From 1997 through 2002, September, October, and November had the highest average pay prices for milk. To be at peak production at these times of high milk prices, cows need to freshen in July, August, and September. In an analysis of milk production by cows freshening in different months, Adkinson and Hay found that cows calving during July, August, and September produced less total milk than cows calving later in the year. Therefore, nutritional and management strategies need to be developed that will allow producers to take advantage of seasonally high milk prices without giving up production. Feeding yeast culture during the transition period appears to be one such strategy. Therefore, we conducted three experiments to determine the effect of feeding yeast culture during the transition period on production of Holstein cows calving during hot, humid weather. Materials and Methods A series of experiments was conducted to determine the effects of feeding yeast culture during the transition period when the weather was hot and humid. In the first experiment, cows were fed 57 g of yeast culture per d beginning 21 d before expected calving date and 114 g of yeast culture through 21 d post parturition. Calving occurred between Sept. 10 and Oct. 21. Cows were fed a 20% CP (as is basis) concentrate consisting of ground corn, soybean meal, and minerals and a partially mixed ration (PMR). The PMR consisted of (DM basis) 14% whole cottonseed, 41.3% corn silage, 22.4% sorghum silage, 14% alfalfa hay, and 8.4% of 48% protein soybean meal. Daily milk production was measured for 100 d. Body condition scores were recorded on d 0, 30, and 60. Monthly DHIA records were used to determine milk composition. Cows used on this experiment were housed with cows in a production herd and were given ad libitum access to the above PMR until Nov. 21 and then were given access to annual ryegrass pastures for 6 h day and ad libitum access to a PMR consisting (DM basis) of 18.2% whole cottonseed, 38.0% corn silage, 19% sorghum silage, 15.9% alfalfa hay, and 8.9% of 48% protein soybean meal during the nighttime. When PMR was being offered, cows had access to free stalls and grass paddocks. In the second experiment, cows were fed 57 g of yeast culture per d beginning 21 d before expected calving date and 114 g of yeast culture through 21 d post parturition. Cows were fed a commercially available 20% (as is basis) CP pellet and a PMR consisting of (DM basis) 32.7% alfalfa hay, 20.9% whole cottonseed, 28.5% corn silage,

15
and 17.9% ryegrass haylage. Daily milk production and DMI were measured for 60 d. Milk composition and BHBA were measured at 10-d intervals throughout the experiment. Body condition scores were measured on d 0 and 60. Cows were housed in a free-stall barn equipped with fans and electronic Calan doors. In the third experiment, two different yeast supplementation regimens were used. Both began receiving 57 g of yeast culture per d 21 d before expected calving date. One group received 114 g of yeast culture per d through 21 d after parturition and the other received 114 g of yeast culture per d through 56 d after parturition. The PMR in this experiment consisted of (DM basis) 13% alfalfa hay, 15.9% whole cottonseed, 63.5% corn silage, 6.6% of 48% soybean meal, and .9% calcium carbonate. Daily milk production and DMI were recorded throughout the 56-d study. Milk composition was measured at 14-d intervals throughout the study. BHBA was measured on d 7, 14, 21, 28, and 56 after parturition. Body condition scores were measured on d 0 and 56. Cows were housed in a free-stall barn equipped with fans and electronic Calan doors. For all three experiments, before parturition, cows were fed 4.5 kg of a 20% CP (as is basis) concentrate (this same concentrate was fed during lactation), ad libitum access to bermudagrass hay and pasture and 4 kg of DM from corn silage every other day. Daily management of milking cows was the same for all three experiments. They were component fed with one-half of their daily concentrate offered before each milking. Then the cows were placed in a wash pen for 4 min to clean the udders. Cows were allowed to air dry and then were milked. Cows were then returned to housing where they had ad libitum access to the PMR, which was weighed and offered twice daily. Incidences of disease and metabolic disorders were recorded daily. Milk production, intake, repeated BHBA, and milk component data were analyzed using the mixed models of SAS. Changes in body condition score and the analysis of BHBA data from d 56 in experiment three were analyzed using the general linear models of SAS. Differences among treatments were determined using single degree of freedom contrasts. In experiments 1 and 2, the contrast was yeast vs no yeast. In experiment 3, the contrasts were yeast vs no yeast and short supplementation regimen vs long supplementation regimen. To measure BHBA, blood was collected via coccygeal venipuncture into vacutainer tubes containing sodium heparin. Blood was centrifuged at 2200 x g for 30 min at 5° C for 30 min. Plasma was stored at -18° C until determination of BHBA by Sigma Kit number 310-A. Milk samples were composite samples of two consecutive milkings and were analyzed by the Louisiana DHIA laboratory. Samples of concentrate and PMR were collected weekly and analyzed by the SERS Forage Quality Laboratory, a NFTA-certified laboratory. Values reported are means of all samples. Results and discussion

16
In experiment 1, feeding yeast culture increased milk production and slowed BCS loss between d 0 and d 100 and tended to slow BCS loss from d 0 to d 50; however, milk composition was not affected; neither was BCS change from d 50 through d 100. Peak milk and days to peak milk were not altered by yeast culture. In experiment 2 dry matter intake and milk production were increased by feeding yeast culture; however peak milk, days to peak milk, peak dm intake, and days to peak intake were not altered by yeast culture. Also BHBA and efficiency of DM use were not changed by yeast culture. In experiment 3, feeding yeast culture tended to decrease DM intake but increased efficiency of feed use, so milk production was not affected. Feeding yeast culture for 56 d post parturition increased efficiency of DM use more than just feeding yeast culture for 21 d post parturition, causing cows receiving yeast for 56 d after calving to produce more milk than cows fed only yeast culture for 21 d after calving. During the first 28 d post parturition, BHBA was not affected by dietary treatment but, by d 56, cows on the long yeast culture supplementation regimen had lower BHBA than cows that stopped receiving yeast culture 21 d after calving. Feeding yeast culture also decreased the days to peak milk although peak milk, peak intake, and days to peak intake were not altered by yeast culture supplementation. It appears that DM intake was limiting in experiment 2 and that improvements due to yeast culture increased DM intake and therefore milk production. This modulation could have been through increased DM digestibility or rate of passage or both. It appears that DM intake was not limiting milk production in experiment 3, however. Improvements caused by yeast culture in experiment 3 increased efficiency of DM use, but not milk production. The differences in results between the two experiments could be related to levels of heat stress. During experiment 2, the summer was hotter than during the summer of experiment 3. Hourly observations in the thermo-neutral zone were higher during experiment 3 and hours in the moderate and severe zones were also lower during experiment 3. In addition, average daily low temperature and THI and average daily high for temperature and THI were lower in experiment 3. The differences in heat stress were also supported by differences in health problems between the two experiments. During experiment 3, the cooler year, there was one case of metritis, one case of foot rot, and an average of 0.37 mastitis treatments per cow. In contrast, during experiment 2, there were 19 cases of metritis, 28 other disease instances, and an average of 1.0 mastitis treatments per cow. The results of these three experiments combined indicate that feeding yeast during the transition period of dairy cattle during hot weather is beneficial, but the level of heat stress can modulate the effects as well as the magnitude of effects.
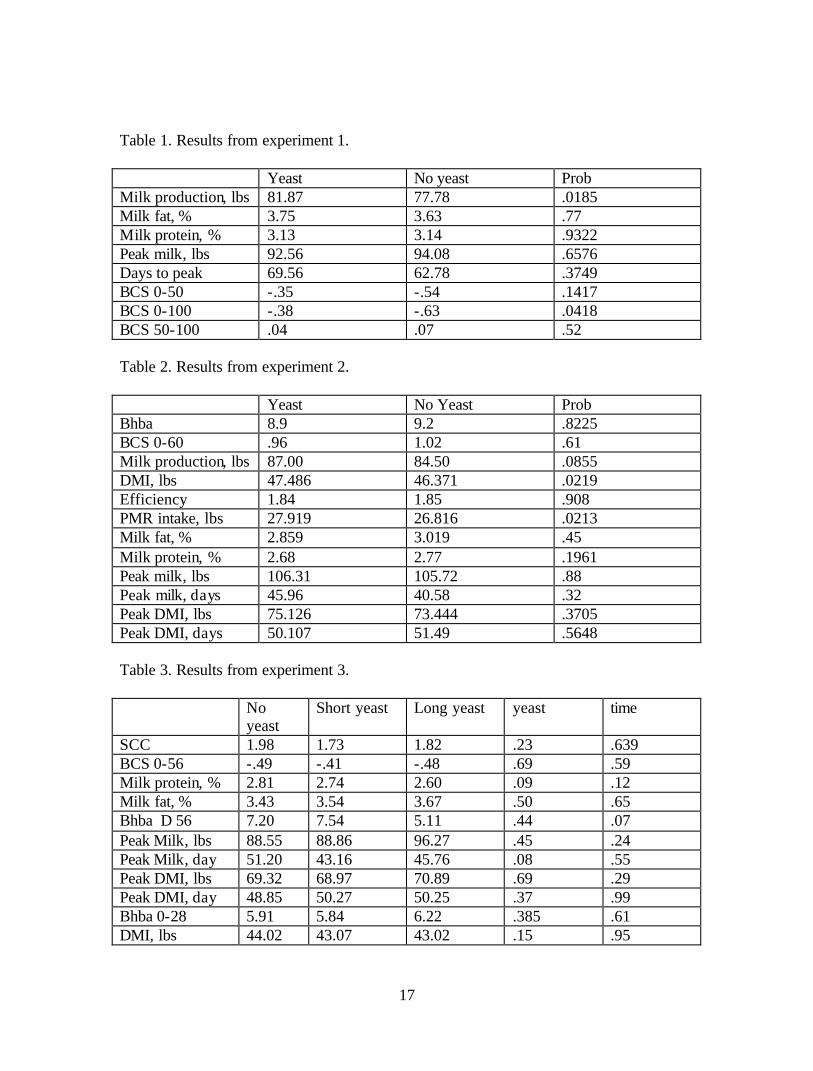
17
Table 1. Results from experiment 1. Yeast No yeast Prob Milk production, lbs 81.87 77.78 .0185 Milk fat, % 3.75 3.63 .77 Milk protein, % 3.13 3.14 .9322 Peak milk, lbs 92.56 94.08 .6576 Days to peak 69.56 62.78 .3749 BCS 0-50 -.35 -.54 .1417 BCS 0-100 -.38 -.63 .0418 BCS 50-100 .04 .07 .52 Table 2. Results from experiment 2. Yeast No Yeast Prob Bhba 8.9 9.2 .8225 BCS 0-60 .96 1.02 .61 Milk production, lbs 87.00 84.50 .0855 DMI, lbs 47.486 46.371 .0219 Efficiency 1.84 1.85 .908 PMR intake, lbs 27.919 26.816 .0213 Milk fat, % 2.859 3.019 .45 Milk protein, % 2.68 2.77 .1961 Peak milk, lbs 106.31 105.72 .88 Peak milk, days 45.96 40.58 .32 Peak DMI, lbs 75.126 73.444 .3705 Peak DMI, days 50.107 51.49 .5648 Table 3. Results from experiment 3. No
yeast Short yeast Long yeast yeast time
SCC 1.98 1.73 1.82 .23 .639 BCS 0-56 -.49 -.41 -.48 .69 .59 Milk protein, % 2.81 2.74 2.60 .09 .12 Milk fat, % 3.43 3.54 3.67 .50 .65 Bhba D 56 7.20 7.54 5.11 .44 .07 Peak Milk, lbs 88.55 88.86 96.27 .45 .24 Peak Milk, day 51.20 43.16 45.76 .08 .55 Peak DMI, lbs 69.32 68.97 70.89 .69 .29 Peak DMI, day 48.85 50.27 50.25 .37 .99 Bhba 0-28 5.91 5.84 6.22 .385 .61 DMI, lbs 44.02 43.07 43.02 .15 .95

18
PMR Intake 27.64 26.73 26.95 .21 .76 Grain intake, lbs 16.37 16.34 16.07 .19 .06 Milk production 74.40 74.18 79.90 .19 .0174 Efficiency 1.69 1.71 1.85 .004 .0002 Table 4. Average values of heat stress measurements during experiment 2 and 3. Experiment 2 Experiment 3 Hours in HSZ1 5.1 6.4 Hours in HSZ2 9.4 11.0 Hours in HSZ3 9.1 6.6 Hours in HSZ4 .4 0 Maximum THI 83.6 82.3 Minimum THI 69.8 68.6 Maximum Temperature 89.7 85.3 Minimum Temperature 69.8 68.6 HSZ1 = Thermo-neutral zone or THI less than 72. HSZ2 = Mild heat stress or THI between 72 and 80. HSZ3 = Moderate heat stress or THI between 80 and 90. HSZ4 = Severe heat stress or THI greater than 90.

19
Heifer Mastitis Project Protocol (2004- 2005 Calving Season)
Project Leader: Gary Hay, LSU Dairy Science Dept. (225-578-4411)
Cooperators: Mike McCormick, Southeast Research Station (985-839-2322) Bill Owens, Hill Farm Research Station (318-927-2578)
Numerous research trials on intramammary infusions of commercial dry cow antibiotics have shown positive results in prepartum dairy heifers for early lactation mammary infections, somatic cell counts and milk production. Several studies have shown dry treating heifers reduced the number clinical and subclinical mastitis cases and reduced somatic cell counts in early lactation. Results for increasing lactation milk production have been mixed with some studies showing substantial gains in early and total lactation milk production and some studies showing no change in milk production from untreated controls. A study was initiated in the summer of 2004 to further examine the effects of prepartum dry treatment of heifers in Louisiana. The cooperative study included heifers from the Hill Farm Research Station in Homer, La; the Southeast Research Station in Franklinton, La; and the LSU Campus Dairy in Baton Rouge, La. The objective of the study was to determine the effects of treating prepartum heifers with a commercially available dry cow treatment 30 and 60 days prior to calving on milk yield, postpartum intramammary infection rate and somatic cell count during first lactation. Approximately 100 heifers were included in the study. The dry cow medication used was Quartermaster®. Individual mammary quarter samples were taken on all heifers on the study at 30 and 60 days prepartum and immediately prior to the 12th milking postpartum. Microbiological cultures and somatic cell counts were taken on all samples. Changes in microbiological profiles pre and post calving were examined along with early lactation somatic cell counts in all heifers. Peak and summit milk from DHIA tests were also collected on all heifers. Differences between treatment groups were tested to determine differences in microbiological infections, somatic cell counts, early lactation milk production and total lactation milk production. Antibiotic screening (Delvo P®) tests were also run on all heifers beginning prior to the 6th milking and continuing at each milking until two consecutive tests had negative results. Antibiotic screening was performed to insure dry treating heifers at 30 days prepartum did not increase the amount of time milk had to be dumped postpartum. Complete results and analysis of the study data should be complete by early summer 2005.

20
Alfalfa Baleage Production: Yield, Persistence, Quality, and Economics (2-yr. Summary)
Mike McCormick, Tara Doughty, Catherine Coxe, Randy Walz, and Brad Venuto
Introduction. Alfalfa is a key dairy forage in much of the United States; however, insects, low soil pH, and disease limit productivity in Louisiana. In addition, high rainfall conditions often limit successful alfalfa hay production. Following is a two-year summary of an alfalfa verification project designed to determine the productivity and longevity of a relatively new alfalfa variety, ‘Amerigraze 702.’ We were also interested in the feasibility of storing alfalfa as baleage. Procedures. A 12-acre field was sprayed with a quart of Round-up and disked in the late fall of 2002. Approximately two tons per acre of dolomite lime were applied two months before planting to raise soil pH to 7.0. On November 30, the field was planted with 25 pounds of live seed. At planting, sulfur, boron, phosphorus and potash were applied according to soil recommendations. Fertilizer was applied twice during each of the 2003 and 2004 growing season to compensate for P and K removed as baleage. Herbicides and insecticides were applied as needed. Boron and sulfur were applied in the spring of each year. Forage was allowed to accumulate for a minimum of six weeks between harvests because research conducted by Brad Venuto indicated alfalfa stands in Louisiana persisted longer when harvested at late maturity. All harvests were at full bloom stage of maturity except for those taken in early spring and late fall (early bloom). Alfalfa forage was cut with a mower conditioner, allowed to wilt in windrows for 24 hours, baled (4’x 4.5’), and individually wrapped with six layers of white stretch film. High quality baleage was fed to the milking herd and low to moderate quality alfalfa baleage was fed to growing Holstein heifers. Results. Stand density declined from approximately seven alfalfa plants/ft2 in the spring of 2003 to four plants/ft2 in late fall of 2004. Weed contamination averaged 1.7 plants/ft2 in 2003, but increased to 4.3 plants/ft2 in 2004. In 2003, five cuttings of alfalfa yielded 4.9 tons of hay equivalents per acre (11.5 bales per acre). In 2004 four cuttings yielded 5.2 tons of hay equivalents per acre (12.4 bales per acre). Harvest intervals ranged from 45-60 days. Alfalfa baleage dry matter concentrations varied from 42% to 72%. All bales appeared to store well as baleage, though mold was more prevalent in the drier bales. Baleage protein concentration ranged from a high of 23.6% to a low of 14.0% with relative feed value (RFV) ranging from 88 to 164. In 2003 protein and RFV averaged 17.2% and 130, respectively, and in 2004 protein averaged 17.5% and RFV averaged 111. Lower RFV in 2004 was likely related to high weed contamination. An economic analysis revealed total establishment costs of $319.70 per acre (direct and fixed costs) and annual fertilizer, pesticide, and harvest costs of $365.21 per acre. The two-year total hay value was $1269.00/acre; total production costs, including establishment, were $1050.11/acre for a total net return of $218.89/acre or $109.45/acre annually. These data indicate that alfalfa grown in Louisiana will produce yields comparable to other parts off the country, but stand persistence and quality may limit profitability.

21
Alfalfa Yield, Quality, Stand Persistence and Market Value , 2003.
Cutting Bales Per Tons Hay Protein TDN,% Alfalfa Per Weeds Per
Market Value
Date Acre* Equiv./Acre Square Foot
Square Foot Per Acre
4/16/2003 2.25 1.06 18.64 63.94 6.80 0.76 $169.60 5/30/2003 2.42 1.10 19.19 60.63 6.06 2.02 $110.00 7/22/2003 3.67 1.37 16.58 59.39 4.84 0.86 $123.30 9/9/2003 2.25 0.94 13.67 66.00 4.93 3.21 $122.20
10/15/2003 0.87 0.43 17.83 67.64 4.41 1.90 $51.60 Average 2.29 0.96 17.18 63.52 5.41 1.75 $115.34 Season Total 11.46 4.90 $576.70 Alfalfa Yield, Quality, Stand Persistence and Market Value , 2004
Cutting Bales Per Tons Hay Protein ̂ TDN,% ̂ Alfalfa Per Weeds Per
Market Value
Date Acre* Equiv./Acre ̂ Square Foot ̂
Square Foot ̂ Per Acre ̂
3/23/2004 3.00 1.18 23.63 66.34 7.17 1.91 $182.90 5/25/2004 4.50 1.96 18.09 58.09 6.17 2.50 $264.60 7/6/2004 3.17 1.55 13.95 54.11 5.29 8.08 $186.00
8/24/2004 1.17 0.49 14.33 59.98 4.23 4.72 $58.80 10/26/2004 0.58 N/A N/A N/A N/A N/A N/A
Average 2.48 1.29 17.50 59.63 5.71 4.30 $173.07 Season Total 12.42 5.18 $692.30 * Based on 4' x 4 1/2' bales of hay containing an average of 53.6% dry matter. ^ Based on 4 cuttings
Costs and Returns for Alfalfa Bale Silage Production.
Year Value of Alfalfa Hay
Equiv. Costs of
Production Net Return
Per Acre Per Acre Per Acre 2002 $0.00 $320.84 ($320.84) 2003 $576.70 $318.99 $257.71 2004 $692.30 $416.14 $276.16 Total $1,269.00 $1,055.97 $213.03 * Establishment costs. Quality classification determined using Agricultural Marketing Service @USDA, Web site: www.ams.usda Market prices calculated at nearest dated Oklahoma quotes from "Hay and Forage Grower" plus $50.00/ton shipping.

22
Performance of Warm-season Annual Forage Crops at the Southeast Research Station, 2004
Tara Doughty, Jerry Simmons, Ruben Anders, Mike McCormick
Pearl millet, sorghum x sudangrass and forage sorghum are annual warm-season varieties recommended by the LSU AgCenter for summer grazing and greenchop and for the production of hay and silage/baleage. Each year varieties of each species are evaluated for agronomic performance. Researchers at Southeast Research Station conducted the 2004 trials. The summer annual performance trials are open to all public and private breeding programs. Both commercially available and advanced experimental lines may be entered for consideration. Multiple varieties of each species from several sources are entered into each year’s trials at the Southeast Research Station. The trials are conducted each year using production practices recommended by the LSU AgCenter for each species. The application rates of phosphorus (P), potassium (K), lime and trace elements are determined by regular soil testing. Applications of pesticides are on an as-needed basis to control insects, weeds and diseases. The trials are conducted in randomized complete block designs with three replications of each plot. Researchers harvest the plots periodically throughout the growing season and collect data from each trial. The plots are cut approximately 45 days after planting, and subsequent harvests made at approximately 30-day intervals. Data gathered from the harvests is then analyzed and the total forage yield per variety per season, as well as per cutting, is determined. Cumulative forage yield data are combined for one to three years and analyzed by analysis of variance procedures to evaluate variety yields. The least significant difference (LSD) value represents the minimum amount by which variety yields must differ to be considered statistically different from one another. If differences are not detected among varieties, the LSD value is not indicated.
Pearl Millet Pearl millet is a summer annual grass suitable for use on well-drained upland soil. It tolerates drought stress more easily than sorghum x sudangrass hybrids, and it is capable of tolerating more acidic soils. It has a tendency to tiller out from the base of the plant, improving the ability to recover from harvesting. Unlike sorghum x sudangrass, pearl millet does not contain prussic acid. Pearl millet can be recommended for grazing, hay and baleage. The slow drying time of this forage may limit the use of pearl millet as a hay crop, and relatively low yields, when compared to corn and forage sorghum, limit its use as a silage crop. Grazing should be delayed until the plants are 18 to 20 inches tall and hay should be harvested when the plants are 30 to 40 inches tall or in the boot stage, whichever comes first. Pearl millet varieties were planted at the rate of 25 lbs./acre with a drill on June 10, 2004, at the Southeast Research Station. Phosphorus (P) and potassium (K) were applied at planting at the rate of 48 lbs./acre for each. Nitrogen (N) was applied at planting, at establishment and after the first cutting for a total of 118 lbs./acre/season.

23
2004 Results, Pearl Millet Variety Cut 1 Cut 2 Total 7/22/04 9/2/04 Avg. Lbs./Acre Dry Matter Tifleaf 3 2332 2763 5095 Tift Exp #4 2373 2202 4575 MilHy 300 2118 2761 4879 MilHy 400 2504 2939 5443 MilHy 500 2143 2579 4722 Mean 2294 2649 4943 LSD (0.05) 582 1522 1999 CV% 13 31 21
Sorghum x Sudangrass
Sorghum x sudangrass hybrids are recommended for use in areas with limited drainage and heavy soils. They are intolerant of low soil pH and should be planted only on those soils with a pH of 5.5 or above. Sorghum x sudangrass contains prussic acid, a chemical dangerous to livestock. To minimize the risk of prussic acid poisoning, grazing should not be done until the plants reach 24 inches tall or higher and should not be done if plants are drought stressed. This forage is useful for summer grazing, hay and baleage. The thick, slow-drying stems make it more difficult to harvest as hay, but the shorter drying period necessary for baleage improves its usefulness. Lower dry matter yields and lower quality in relation to corn and forage sorghum limit the potential for this crop as silage. Sorghum x sudangrass plots were planted on June 10, 2004, at the Southeast Research Station. Seeding rates were 30 lbs./acre, drilled. Phosphorus (P) and potassium (K) were each applied at the rate of 48 lbs./acre at planting, and nitrogen (N) was applied at planting, establishment and after harvesting for 118 lbs./acre/season of nitrogen.
3-year Results, Pearl Millet, 2002-2004
Entry # Variety Avg. Lbs/Acre Dry
Matter
31 Tifleaf 3 5946 22 Tift Exp. #4 5549 28 MilHy 400 5414
Mean 5637 C.V.,% 21.12
LSD(0.05) 1223

24
Forage Sorghum. Forage sorghum is recommended for silage production in limited moisture areas or if it is too late to plant temperate corn. It can also be harvested for hay or used as summer grazing. As with the other large-stemmed summer annuals, drying for hay is difficult. It can, however, be harvested more easily as baleage because of the lower drying time to reach the appropriate dry matter rate. Silage quality is typically not as high as with temperate corn silage; however this annual can be useful in improving the quantity of silage capable of being stored in a season when corn production is limited. Forage sorghum plots were planted on June 10, 2004, at the Southeast Research Station. Seeding rates were 25 lbs./acre, drilled. Forty-eight pounds of phosphorus (P) and of potassium (K) were applied at planting, and nitrogen (N) was applied at planting, establishment and after harvesting for a total application of 118 lbs./acre of nitrogen.
3-year Results, Forage Sorghum, 2002-2004
3-year Results, Sorghum x Sudangrass, 2002-2004
Entry # Variety Avg. Lbs./Acre Dry Matter
55 Super Su 22 3776 54 Sugar Beef 3598 58 PS 210 BMR 3097
Mean 3490 C.V.,% 10.39
LSD(0.05) 373
2004 Results, Sorghum x Sudangrass Variety Cut 1 Cut 2 Total
7/22/04 9/2/04 Avg.Lbs./Acre Dry Matter
Nutri + Plus BMR 2937 2498 5435 Sugar Beef 3122 2453 5575 Super Su 22 3748 2779 6527 SS 200 BMR 4138 2498 6636 PS 210 BMR 4264 2258 6522 Drystalk BMR 2618 2222 4840 Nutrimax Drystalk BMR 3614 2495 6109 Mean 3492 2458 5941 CV% 11 15 11 LSD (0.05) 705 666 1200

25
2004 Results, Forage Sorghum
Variety Cut 1 Cut 2 Total
7/22/04 9/2/04 Avg. Lbs. / Acre Dry
Matter NK 300 1597 2622 4219 FS 555 2378 2458 4836 BMR 100 2677 2607 5284 Red Top + BMR 2994 2186 5180 BMR 106 2700 2198 4898 FS 515HQ 3765 2203 5968 BMR 110S 2687 2219 4906 Mean 2685 2356 5042 CV% 16 21 14 LSD (0.05) 771 860 1249
Entry # Variety Avg. Lbs./Acre Dry Matter
37 FS 555 5272 40 BMR 100 3831
Mean 4552 C.V.,% 14.75
LSD(0.05) 774

26
Performance of Cool-season Annual Forage Crops at the Southeast Research Station, 2003-2004
Wink Alison, Tara Doughty, Jerry Simmons, Mike McCormick, Ruben Anders
Each year, LSU AgCenter researchers conduct variety trials of cool-season annual grasses at research stations and cooperating agencies across the state. These trials provide information on the performance of annual ryegrass, oat, wheat and cereal rye varieties under varying soil and climactic conditions. With this information, the researchers can recommend varieties for use by Louisiana forage producers for the production of green chop, hay and silage and for grazing of livestock. A list of recommended varieties is developed and made available for distribution through the LSU AgCenter Cooperative Extension Service and on the LSU AgCenter Web site at www.lsuagcenter.com. To be included on the list, a commercially available variety must be tested for three consecutive years and have an average yield of not less than 90% of the three-year average (mean) yield of the top three producing varieties. A variety is listed as “promising” if, following two consecutive years of production, it has shown acceptable agronomic characteristics and has yielded at least 90% of the average of the top three performing varieties. A variety is removed from the list if it becomes no longer available to producers or if it consistently performs unsatisfactorily. All commercially available and advanced experimental lines developed by either public or private breeding programs are eligible for inclusion in the performance trials. Multiple varieties of each species are submitted for evaluation each year, but no wheat variety has been entered during the last three trials. The trials are conducted each year using production practices recommended by the LSU AgCenter Cooperative Extension Service for each species. Soil tests are conducted regularly, and phosphorus, potassium, lime and trace elements are applied as necessary. Applications of pesticides are as needed to manage weeds, insects and diseases. The trials are conducted in randomized complete block designs with three to four replications. Data are collected from each trial indicating the total forage yield per variety during the growing season, as well as the forage yield per variety per cutting within the season. This information allows the researchers to determine those varieties most useful for early or late season production and those suitable for overall produc tion of forage. Harvesting of the trial plots occurs periodically throughout the growing season by cutting to a stubble height of 2 to 4 inches when 8 to 12 inches tall. Cutting the plots eight to 10 weeks after planting and approximately every 30 days thereafter is a normal part of the protocol. Cumulative forage yield data are combined over one to three years and analyzed by analysis of variance procedures to evaluate variety yields. The least significant difference (LSD) value represents the minimum amount by which variety yields must differ to be considered statistically different from one another. If differences are not detected among varieties, the LSD value is not presented.

27
Annual Ryegrass Test Southeast Research Station, 2004
Variety Cut 1 Cut 2 Cut 3 Cut 4 Cut 5 Total 12/16/03 1/23/04 3/11/04 4/9/04 5/24/04
Beefbuilder III 524 448 1774 3577 2112 8435 Stampede 932 753 2057 3215 1432 8389 Dyna Gain 554 770 2265 3452 1280 8322 4X 439 588 1949 4256 1073 8306 Prine 475 533 1804 4292 1185 8288 WD-40 631 804 2495 3516 834 8279 Marshall 335 435 2135 4330 950 8184 Bar 9 Tam 518 476 1892 3903 1300 8089 Passeral Plus 599 594 1708 3542 1615 8058 Gulf 594 470 1775 4300 890 8029 Diamond T 421 572 1931 3528 1494 7945 Rio 659 601 1950 3289 1370 7869 Tam 90 758 809 2276 3078 940 7862 Wax ME94 487 434 1791 4070 1036 7818 King 535 513 2676 2726 1319 7769 Jackson 526 427 1658 3742 1323 7675 WMN97 496 439 1695 4014 1017 7661 FLX2002(new2)LRCT 402 410 2085 3331 1410 7639 FL/NE X2003 259 402 2263 3297 1395 7616 Abundant 421 485 1732 3849 1128 7615 Graze-n-Gro 580 453 1650 3493 1358 7534 Ed 495 444 2034 3137 1363 7474 FL/OK 2001(New1) 275 431 2032 3285 1285 7307 Brigadier 390 429 2065 3058 1293 7236 FL X2003 (New2) ER 285 486 3010 1644 688 6114 Ducado 406 539 2111 2280 749 6085 Shiwasuaoba 686 1264 2594 1292 160 5996 Mean 507 556 2052 3389 1185 7689 LSD (0.05) NS 256 428 360 259 849

28
Annual ryegrass is an excellent cool-season forage crop for use as grazing, hay and silage (haylage/baleage). It can be successfully grown on most soils and can be planted into a prepared seedbed or overseeded into permanent summer pastures. It can also be drilled into the sod with excellent results using a no-till planting system. Annual ryegrass plots were planted at the rate of 30 lbs./acre into a prepared seedbed of Tangi silt loam soil October 13, 2004. Phosphorus (P) and potassium (K) fertilizer was applied to the plots at planting according to soil test recommendations made by the Louisiana Cooperative Extension Service. Nitrogen (N) was applied at planting, at establishment and after the second and fourth harvest. The total amount of nitrogen was 190 lbs./acre per season. The recommended varieties of ryegrass based on statewide trials are as follows: Gulf, Jackson, Marshall, Passerel Plus, TAM 90, Beefbuilder III, Prine, Brigadier and Ed. Diamond T and WD-40 are promising varieties.
Southeast Research Station Ryegrass Varieties, 3-year Average 2003-2004
Entry # Variety Avg. Lbs/A Dry
Matter
113 Beefbuilder 8821 108 Brigadier 7791 110 Ed 7633 12 Gulf 7742 23 Jackson 6780 8 Marshal 7957
63 ME 94 7826 96 Passeral Plus 7902 93 Prine 7925 27 Tam 90 7337 112 WMN97 6586
Mean 7664 C.V.,% 9.72
LSD(0.05) 1638

29
Cereal Rye
Cereal rye is generally more cold tolerant than most varieties of annual ryegrass and is more tolerant of lower soil pH than ryegrass or other small-grain species including oats and wheat. It has the capacity to produce more forage during late fall and early spring than does annual ryegrass. Cereal rye is recommended either alone or in a mixture with annual ryegrass for winter grazing and as a spring hay crop on most types of soils.
Plots were planted into a Tangi silt loam soil October 14, 2003, as pure stands at the rate of 90 lbs. of seed per acre into a prepared seedbed. Phosphorus (P) and Potassium (K) were applied according to soil test recommendations made by the LSU AgCenter Cooperative Extension Service. Nitrogen (N) was applied at planting, at establishment and after every other harvest, beginning with the second, for a total N application of 140 lbs./acre. The recommended cereal rye varieties for 2004 based on statewide studies are as follows: Bates, Elbon, Oklon, Maton and Wintergrazer 70.
2003-2004 Cereal Rye Production, Dry Matter /Acre
Variety Cut 1 Cut 2 Cut 3 Cut 4 Total 12/19/03 1/23/04 3/11/04 4/9/04
Elbon 285 221 1963 2618 5086 WR 2001 448 401 2782 1370 5001 Oklon 506 446 2733 1251 4935 Wintermore 485 397 2501 1525 4907 Maton 278 190 2382 2052 4903 NF 109 229 203 2091 2165 4687 Wintergrazer 70 483 352 2349 1382 4565 Noble Foundation NF65 523 425 2885 621 4453 Mean 405 329 2461 1623 4817 CV% 20 20 9 12 8 LSD (0.05) 144 113 381 344 NS
3-year Results, Cereal Rye 2003-2004
Entry # Variety Avg. Lbs/A Dry Matter
2 Maton 4588 3 Elbon 5036 5 Wintergrazer90 4862
24 Oklon 4526 29 Bates 4898 48 NF65exp. 4987
Mean 4816 C.V.,% 13.91
LSD(0.05) 773

30
Oats
Oats can be planted somewhat earlier than and have the capacity to produce earlier growth than ryegrass, generating high quality forage in the early winter. Varieties can be planted either alone or in mixtures with annual ryegrass to take advantage of these characteristics. Cold tolerance is generally somewhat less than annual ryegrass or cereal rye. Trial plots of oats were planted into a Tangi silt loam soil October 14, 2003, as pure stands. Seeding rate was 100 lbs./acre, planted into a prepared seedbed. Phosphorus (P) and potassium (K) were applied according to soil test recommendations made by the LSU AgCenter Cooperative Extension Service. Nitrogen was applied at planting, at establishment and after every other harvest, beginning with the second, for a total nitrogen application of 140 lbs./acre. The recommended oat varieties for 2004 based on statewide studies are as follows: LA 9339 and Horizon 314. Horizon 474 is a promising variety.
3-year Results, Oats 2003-2004
Entry # Variety Avg. Lbs/A Dry Matter
48 Horizon 314 3690 56 LA9339 4205
Mean 3948 C.V.,% 14.68
LSD(0.05) 1135
2003-2004 Production, Oats (Dry Matter/Acre)
Variety Cut 1 Cut 2 Cut 3 Cut 4 Total
12/16/03 1/23/04 3/11/04 4/9/04 LA 9339 592 513 1836 3688 6628 FL9708-P37 exp 513 354 2215 3376 6458 Plantation Seed Horizon 474 709 529 2719 2045 6001 LSUAGCTR LA976GBS-22-B-S2 383 357 2076 2876 5692 LSUAGCTR LA966BSB119-1 514 539 1613 2647 5314 LSUAGCTR LA9810SBS-58 626 647 1885 1988 5146 LSUAGCTR LA989SBS-49-B-S1 189 406 1928 2470 4993 Horizon 314 424 383 1626 2546 4980 LSUAGCTR LA9533D63-1-C-S3 528 478 1557 2238 4802 Magnum 2000 1105 778 861 1222 3967
Mean 558 498 1832 2510 5398 LSD (0.05) 210 173 553 277 700
31
Southeast Research Station Forage Quality Laboratory Producer Sample Results, 2004
Randy Walz, Mike McCormick, Laura Zeringue, and Jerry Simmons
The Southeast Research Station Forage Quality Lab was constructed to serve the
forage analyses needs of Louisiana livestock and hay producers and to provide a resource for rapid analysis of samples generated by beef, dairy, wildlife, and forage scientists throughout the state. In 1991, a memorandum of understanding between MAFES and the LSU AgCenter extended the forage lab’s services to producers in southern Missis sippi. At the present time, the laboratory does not charge producers or other scientists for the analyses conducted. Producer samples are received primarily via mail from parish and county agents in Louisiana and Mississippi, though a significant number are brought in by local producers, consultants, and others. All feedstuffs including by-products, grains, commercial mixes, forages, total mixed rations, and organic fertilizers are accepted. Soil samples, commercial fertilizers, and mineral supplements are not analyzed.
Routine producer samples are assayed for dry matter, crude protein, acid detergent fiber, neutral detergent fiber, and an estimate of energy. In addition, a producer may request a mineral analysis on the sample that will include calcium, phosphorus, magnesium, potassium, copper, manganese, and zinc. Fiber and protein concentrations are determined by near infrared spectroscopy or wet chemistry. With the exception of phosphorus, which is determined colorimetrically, all mineral concentrations are determined by atomic absorption spectroscopy.
Generally, analyses are returned via Internet to county or parish agents within a week or less of sample reception. Sample results are also mailed to producers. Between 2,000 and 3,000 producer samples are analyzed annually, with about one-fourth coming from Mississippi producers.
Average quality analyses from producers samples received in 2004 are provided in the table below. In addition to the average we have also provided the maximum (highest) and minimum (lowest) values for each forage type. Protein concentrations were highest for ryegrass pasture (26.09%), clover pasture (19.00%) and alfalfa hay (21.91%). Of the stored forages, ryegrass haylage and baleage and clover hay contained the highest protein concentrations. Bahiagrass hay, on average, contained the least protein (7.86%). Annual pastures also contained the most energy. Alfalfa hay and corn silage samples were similar in digestibility, averaging about 66% total digestible nutrients (TDN).
Data indicate that some of the highest quality forage crops grown by local producers are ryegrass pasture, corn silage, ryegrass haylage, ryegrass baleage, and miscellaneous legumes. Summer perennial hays such as bermudagrass and bahiagrass can be harvested at a nutritious state, but intensive pasture/hayfield management is required.

32
Producer Sample Forage Quality Analyses for Major Forage Crops Submitted to the SERS Forage Quality Lab (% DM), 2004 Protein Protein Protein ADF ADF ADF NDF NDF NDF TDN TDN
Samples Product Min Max Avg Min Max Avg Min Max Avg Min Max 8 Clover pasture 12.62 26.59 19.00 21.66 37.33 28.09 31.73 50.22 41.41 58.76 75.50 68.63
13 Clover hay 8.49 21.59 14.72 31.25 43.63 35.64 40.16 61.11 50.89 52.02 65.25 60.56 46 Alfalfa hay 17.30 28.76 21.91 24.08 38.23 30.17 27.34 49.48 38.08 57.80 72.92 66.41 14 Misc legume pasture 13.46 30.61 21.56 11.33 28.87 19.26 19.82 42.22 30.52 67.80 86.54 78.06 12 Misc legume hay 9.66 20.85 13.45 30.77 50.54 40.56 39.19 83.21 54.92 44.64 65.77 55.31 5 Bahiagrass pasture 6.32 12.89 10.03 35.37 47.53 40.74 68.80 77.90 73.59 44.67 56.90 51.53
184 Bahiagrass hay 4.47 13.79 7.86 34.12 53.71 42.82 67.13 84.80 75.89 39.51 57.52 49.19 10 Bahiagrass baleage 6.47 15.65 9.21 38.61 54.58 43.79 60.19 80.91 72.39 38.50 54.40 48.64 21 Bermuda pasture 7.21 15.50 11.60 31.54 43.06 36.52 64.69 79.72 73.08 49.00 60.77 55.64 658 Bermuda hay 4.01 18.28 9.83 28.31 53.45 38.60 61.67 86.22 75.05 22.40 63.01 53.27 8 Bermuda baleage 6.50 13.52 9.28 34.29 44.39 40.10 63.65 81.41 73.61 48.07 57.99 52.01
21 Mixed grass pasture 6.46 13.27 10.06 30.28 46.32 39.31 55.61 81.53 72.90 46.23 61.12 52.85 214 Mixed grass hay 3.02 20.41 8.57 31.03 59.52 42.02 55.99 93.71 75.32 33.28 60.64 50.02 4 Mixed grass baleage 7.19 13.90 10.15 38.22 50.50 43.51 58.81 77.11 67.83 42.20 54.47 49.05 4 Crabgrass hay 8.40 18.43 12.10 34.35 38.76 37.05 65.99 74.02 69.75 52.99 57.63 55.05 4 Crabgrass baleage 9.39 11.63 10.77 38.94 41.95 40.94 58.20 69.51 65.33 50.64 53.08 51.48 4 Millet baleage 6.72 13.45 9.78 42.53 48.09 45.90 67.68 78.83 73.08 44.55 49.38 46.81
16 Ryegrass pasture 15.27 32.42 26.09 14.55 24.43 19.37 29.24 47.27 35.52 75.18 84.42 79.51 95 Ryegrass hay 4.79 22.41 10.71 27.99 56.44 40.67 48.78 83.51 69.44 43.40 68.72 57.07 47 Ryegrass haylage 8.09 22.12 14.49 23.23 44.08 34.63 44.11 69.38 55.08 53.75 72.88 63.44 117 Ryegrass baleage 7.11 24.79 14.07 23.04 46.53 33.85 37.89 73.01 54.60 52.34 74.25 63.93 22 Ryegrass greenchop 8.77 27.02 15.14 21.78 38.63 32.66 38.56 60.33 56.23 59.12 76.25 65.24 39 Winter mix hay 4.88 20.56 9.14 33.59 54.64 39.81 59.30 82.61 69.50 44.46 65.68 57.25 3 Winter mix baleage 8.80 13.37 10.63 28.60 30.69 29.78 53.30 54.77 54.05 64.70 67.89 66.04 2 Wheat haylage 11.54 12.87 12.20 34.34 35.38 34.86 56.36 56.82 56.59 62.30 62.69 62.50 2 Oat haylage 3.89 10.42 7.16 38.84 55.89 47.36 66.00 79.41 72.70 42.91 58.72 50.81
189 Corn silage 3.94 16.91 8.11 18.77 54.16 28.56 34.72 78.90 46.78 47.22 73.76 66.42 44 Corn greenchop 7.00 11.05 8.46 24.21 35.27 29.56 38.53 57.98 47.95 61.39 69.68 65.67

33
26 Misc summer hay 5.02 17.08 8.41 33.22 56.41 41.64 61.71 78.49 71.21 36.63 58.61 50.34
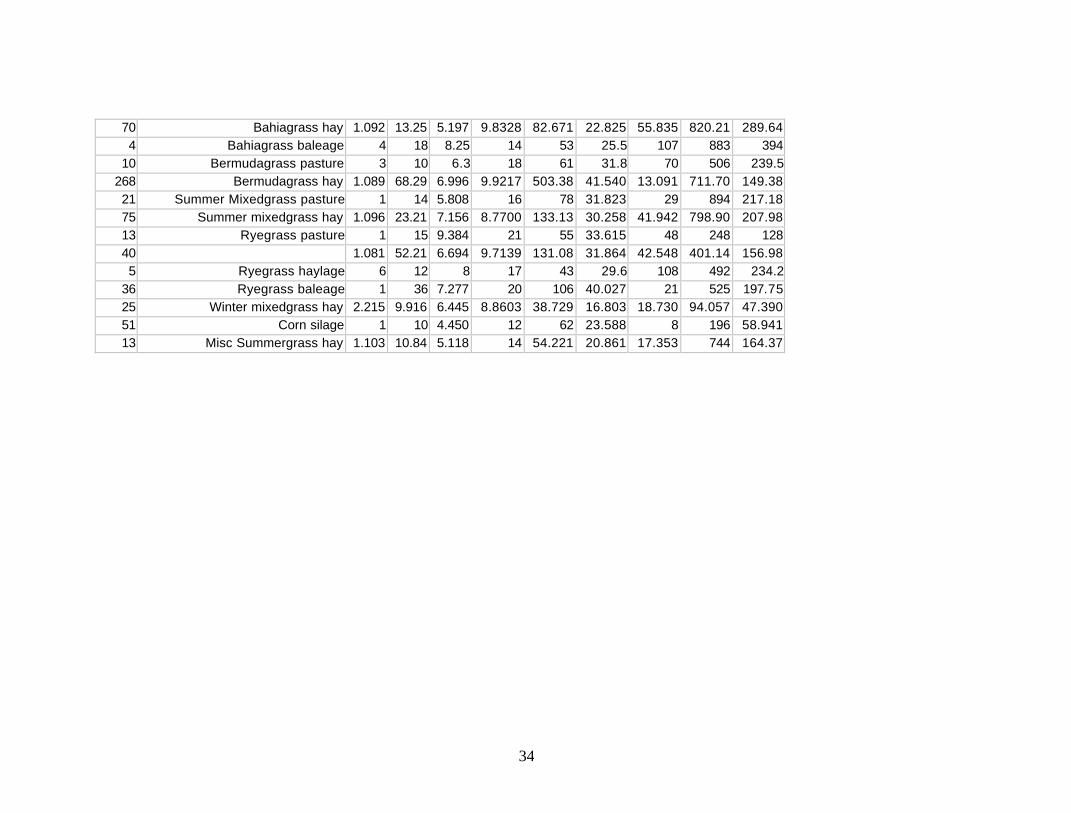
Mineral Analyses for Producer Samples Submitted to the SERS Forage Lab, 2004
Ca Ca Ca P P P Mg Mg Mg K K K #
NumProduct Description Min
OfDMaxOfD
AvgOfD
MinOfD
MaxOfD
AvgOfD
MinOfD
MaxOfD
AvgOfD
MinOfD
MaxOfD
AvgOfD3 Clover pasture 0.93 1.38 1.23 0.28 0.38 0.33 0.33 0.40 0.36 2.01 3.81 2.72
2 Clover hay 0.92 1.43 1.18 0.28 0.29 0.29 0.32 0.52 0.42 1.76 2.89 2.32 18 Alfalfa hay 0.78 1.60 1.15 0.14 0.32 0.26 0.21 0.53 0.32 1.31 3.50 2.59 4 Bahiagrass pasture 0.31 0.46 0.36 0.12 0.16 0.14 0.14 0.86 0.36 0.19 1.37 0.96
70 Bahiagrass hay 0.13 0.47 0.29 0.11 0.45 0.22 0.12 0.64 0.28 0.35 3.27 1.25 4 Bahiagrass baleage 0.13 0.32 0.23 0.12 0.36 0.23 0.24 0.37 0.30 0.92 3.12 1.83
10 Bermudagrass pasture 0.18 0.51 0.33 0.19 0.39 0.27 0.07 0.31 0.18 1.23 2.19 1.63 268 Bermudagrass hay 0.12 1.28 0.35 0.10 0.65 0.26 0.06 0.93 0.18 0.01 3.97 1.70 21 Summer mixedgrass pasture 0.20 0.50 0.37 0.13 0.36 0.25 0.14 0.53 0.27 0.15 2.01 1.36 75 Summer mixedgrass hay 0.11 1.01 0.37 0.11 0.59 0.25 0.09 0.49 0.24 0.55 3.17 1.63 13 Ryegrass pasture 0.24 0.56 0.39 0.33 0.80 0.53 0.15 0.36 0.21 3.03 5.03 3.79 40 Ryegrass hay 0.18 1.71 0.49 0.09 0.57 0.26 0.06 0.44 0.20 0.24 3.48 1.70 5 Ryegrass haylage 0.39 0.59 0.47 0.13 0.46 0.28 0.18 0.28 0.23 1.25 3.53 2.22
36 Ryegrass baleage 0.34 0.92 0.48 0.13 0.66 0.33 0.14 0.47 0.22 1.11 4.89 2.33 25 Winter mixedgrass hay 0.16 0.61 0.31 0.15 0.28 0.22 0.10 0.25 0.14 1.20 2.56 1.92 51 Corn silage 0.05 0.44 0.14 0.13 0.35 0.25 0.06 0.22 0.15 0.40 2.00 1.16 13 Misc Summergrass hay 0.28 0.54 0.36 0.11 0.44 0.19 0.10 0.24 0.15 1.45 2.25 1.74
Micro-mineral Analyses for SERS Producer Samples, 2004.
Cu Cu Cu Zn Zn Zn Mn Mn Mn #
NumProduct Description Min Max Avg Min Max Avg Min Max Avg
3 Clover pasture 5.6503561
22 14.216785
26 103.96655240
58.322184134
87 132.21833294
112.406110982 Clover hay 6.720
430111.196954
8.9586924
24.641577397
47.027209884
35.834393641
50.403226495
108.61046092
79.50684371018 Alfalfa hay 4.570
906015.905476
8.3905516
12.569991694
26.519337016
19.989153529
21.711803835
95.967098333
56.0477337444 Bahiagrass pasture 2 4 2.551
085620 89 41.587
48461096.991
068824610 454.74
776720
34
70 Bahiagrass hay 1.0925379
13.252346
5.1971945
9.8328418223
82.671956559
22.825118454
55.835342724
820.21723563
289.649460004 Bahiagrass baleage 4 18 8.25 14 53 25.5 107 883 394
10 Bermudagrass pasture 3 10 6.3 18 61 31.8 70 506 239.5 268 Bermudagrass hay 1.089
205968.296982
6.9969461
9.9217286857
503.38500849
41.540942138
13.091860703
711.70082533
149.3871254521 Summer Mixedgrass pasture 1 14 5.808
508316 78 31.823
95384829 894 217.18
38492075 Summer mixedgrass hay 1.0967317
23.214680
7.1560873
8.7700064601
133.13440107
30.258115966
41.942605562
798.90109890
207.9869796213 Ryegrass pasture 1 15 9.384
615321 55 33.615
38461548 248 128
40 1.0814318
52.210621
6.6941328
9.7139771740
131.08198667
31.864104605
42.548547285
401.14299216
156.985400335 Ryegrass haylage 6 12 8 17 43 29.6 108 492 234.2
36 Ryegrass baleage 1 36 7.2777777
20 106 40.027777777
21 525 197.75 25 Winter mixedgrass hay 2.215
08479.9162624
6.4454964
8.8603388181
38.729665747
16.803425915
18.730717937
94.057759673
47.39095032851 Corn silage 1 10 4.450
980312 62 23.588
2352948 196 58.941
17647013 Misc Summergrass hay 1.1038746
10.845987
5.1188864
14 54.221532046
20.861306211
17.353579750
744 164.37180195


