38
Southern Company Biomass to Electricity Research Jeremiah Haswell Southern Company Research & Environmental Affairs LSU Alternative Energy 2009 April 23 rd , 2009
| Date post: | 31-Dec-2015 |
| Category: |
Documents |
| Upload: | karin-joseph |
| View: | 227 times |
| Download: | 0 times |
Southern CompanyBiomass to Electricity Research
Jeremiah HaswellSouthern Company Research & Environmental Affairs
LSU Alternative Energy 2009April 23rd, 2009
Outline
• Southern Company Introduction• Renewable Portfolio Standards• Renewable Options in the Southeast• Biomass Co-Firing Research• Plant Mitchell• Questions
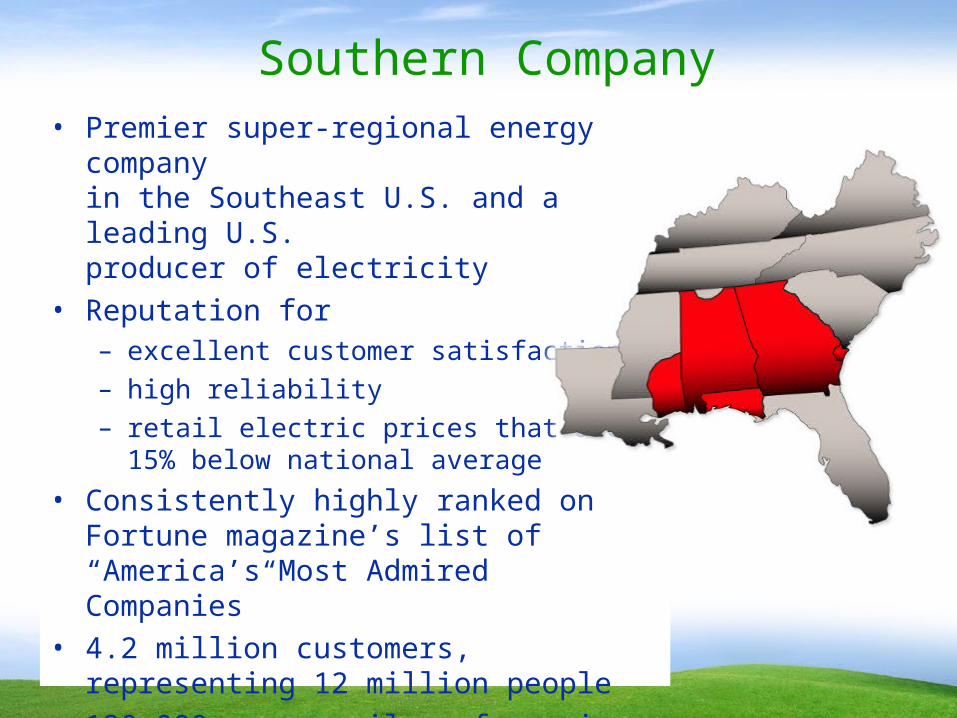
Southern Company• Premier super-regional energy company
in the Southeast U.S. and a leading U.S. producer of electricity
• Reputation for– excellent customer satisfaction– high reliability – retail electric prices that are
15% below national average• Consistently highly ranked on
Fortune magazine’s list of“America’s Most Admired Companies”
• 4.2 million customers, representing 12 million people• 120,000 square miles of service territory• 40,000+ MW of generating capacity
CC
OPCO Plant Type
GPC
APC
GULF
MPC
SPC
H Weiss Dam
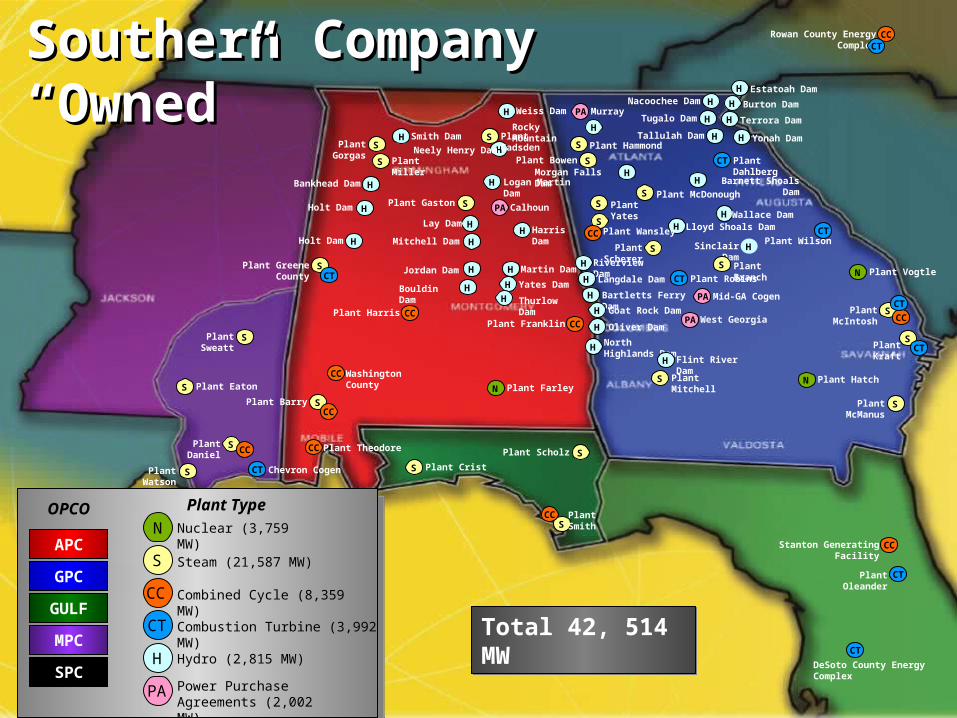
Total 42, 514 MW Total 42, 514 MW
Southern Company “Owned”Southern Company “Owned”
N
S
Combined Cycle (8,359 MW)
H
CT
PA
Nuclear (3,759 MW)
Steam (21,587 MW)
Combustion Turbine (3,992 MW)
Hydro (2,815 MW)
Power Purchase Agreements (2,002 MW)
HLay Dam
HMitchell Dam
H Martin Dam
H Yates Dam
H Thurlow Dam
HSinclair Dam
H Logan Martin Dam
HHolt Dam
HNeely Henry Dam
HHolt Dam
HJordan Dam
HBankhead Dam
HBouldin Dam
H Riverview Dam
H Smith Dam
H Harris Dam
HRocky Mountain
HMorgan Falls Dam
H Langdale Dam
H Bartletts Ferry Dam
H Goat Rock Dam
H Oliver Dam
H North Highlands Dam
H Flint River Dam
H Lloyd Shoals Dam
SPlant McManus
H Wallace Dam
H Barnett Shoals Dam
H Estatoah Dam
H Burton Dam
H Terrora Dam
H Yonah Dam
HNacoochee Dam
HTugalo Dam
HTallulah DamSPlant Gorgas
N Plant Vogtle
S Plant Miller
SPlant Greene County
S Plant Gadsden
SPlant Bowen
SPlant Gaston
SPlant Barry
SPlant Scholz
S Plant Mitchell
SPlant Wansley
S Plant YatesS Plant McDonough
SPlant Scherer
S Plant Hammond
SPlant McIntosh
SPlant Kraft
SPlant Smith
SPlant Watson
SPlant Daniel
SPlant Sweatt
S Plant Eaton
S Plant Crist
N Plant FarleyN Plant Hatch
S Plant Branch
CCStanton Generating Facility
CC Washington County
CC
CC CC Plant Theodore
CC
CCPlant HarrisCCPlant Franklin
CC
CC
CT
DeSoto County Energy Complex
CT Chevron Cogen
CT
CT
CTPlant Wilson
CT Plant Dahlberg
CT Plant RobinsCT
CTPlant Oleander
PA Murray
PA Calhoun
PA Mid-GA Cogen
PA West Georgia
CCRowan County Energy ComplexCT
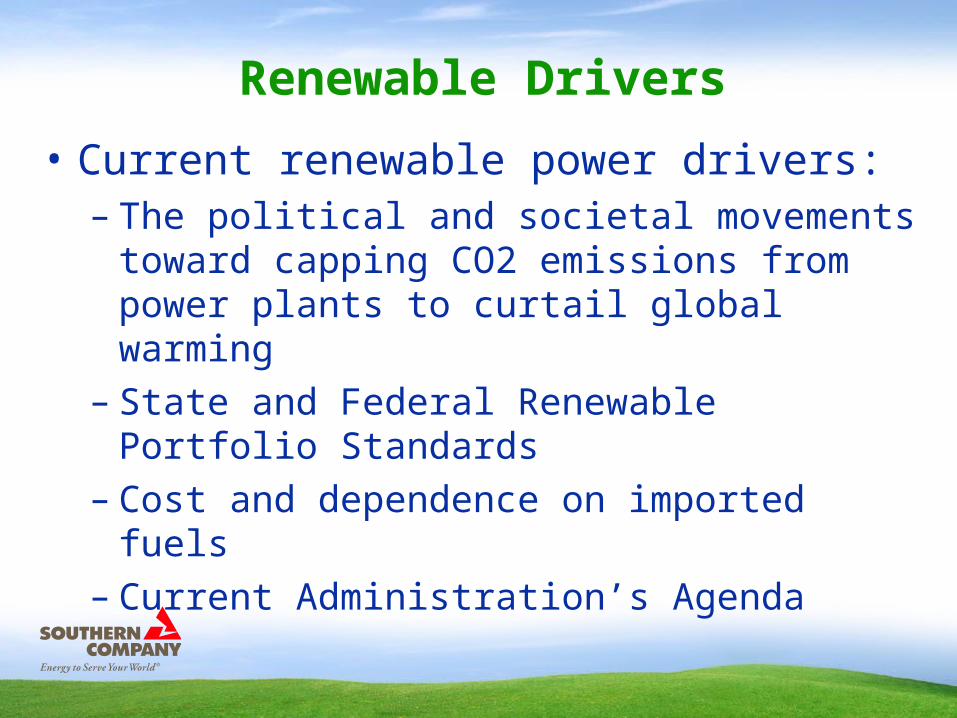
Renewable Drivers
• Current renewable power drivers:– The political and societal movements toward capping CO2
emissions from power plants to curtail global warming– State and Federal Renewable Portfolio Standards– Cost and dependence on imported fuels– Current Administration’s Agenda
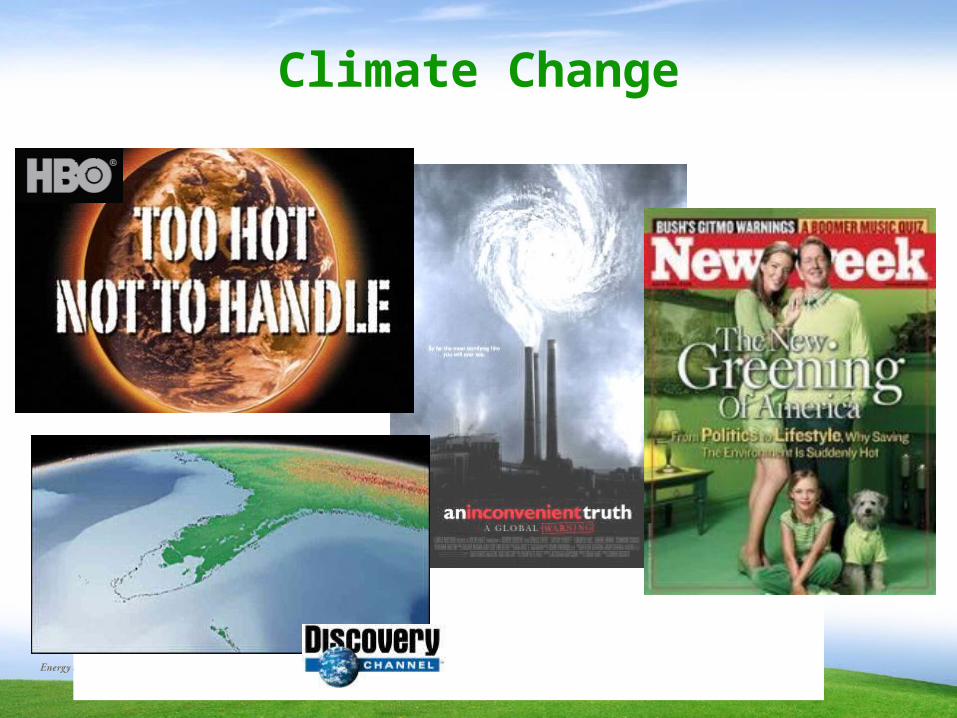
Climate Change
“Global Warming” Articles in Major U.S. Newspapers
0
100
200
300
400
500
600
700
NYTimes
AJC Wash.Post
LATimes
WSJ
1996
2001
2006
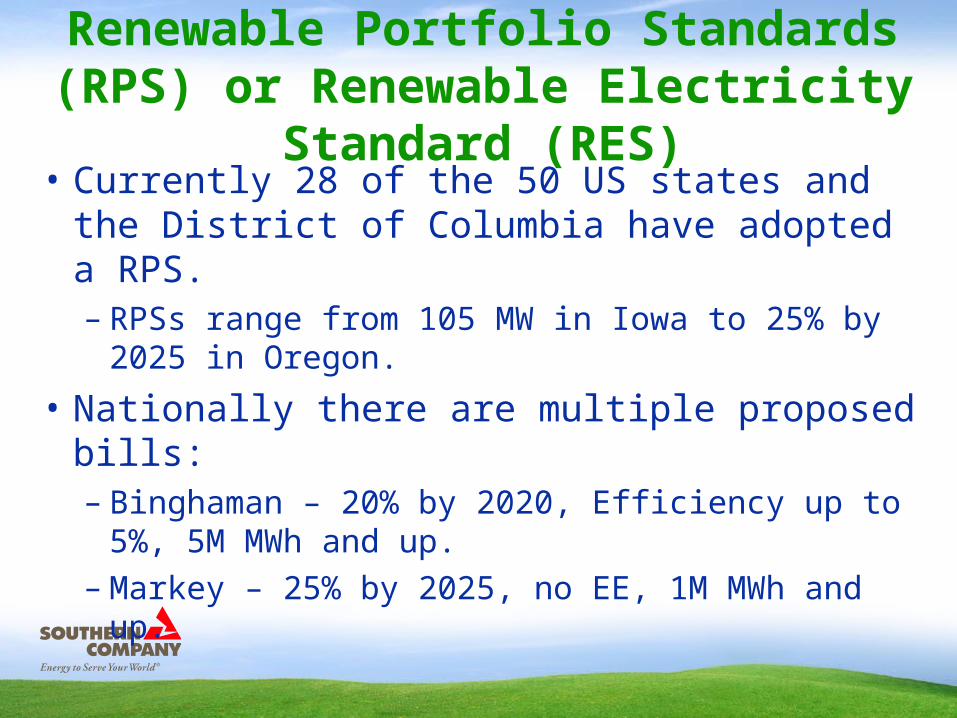
Renewable Portfolio Standards (RPS) or Renewable Electricity Standard (RES)
• Currently 28 of the 50 US states and the District of Columbia have adopted a RPS.– RPSs range from 105 MW in Iowa to 25% by 2025 in
Oregon.• Nationally there are multiple proposed bills:
– Binghaman – 20% by 2020, Efficiency up to 5%, 5M MWh and up.
– Markey – 25% by 2025, no EE, 1M MWh and up.
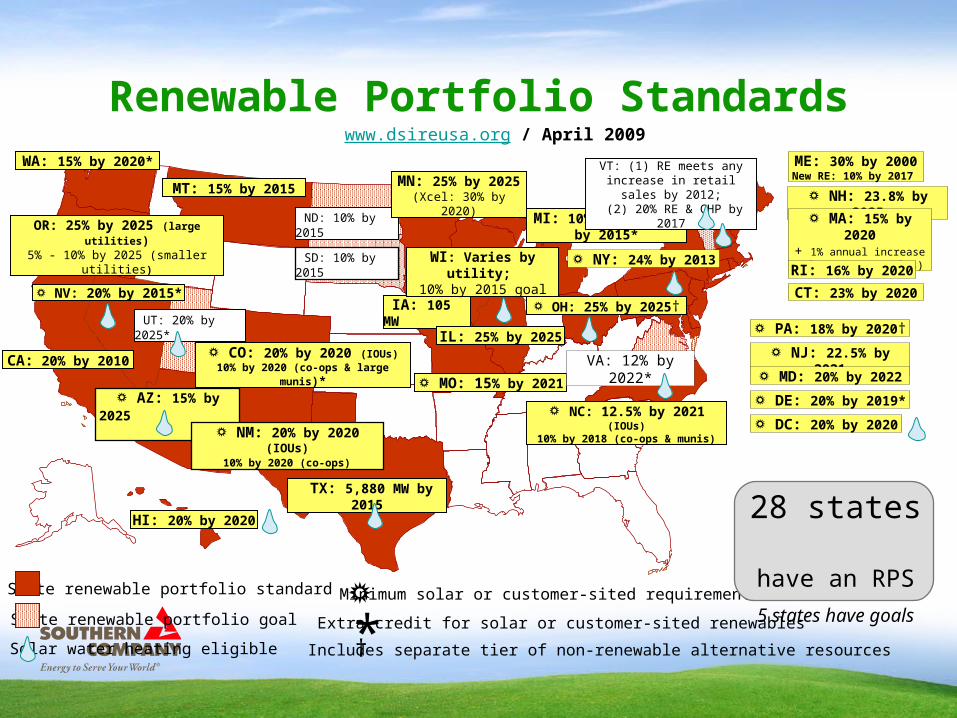
Renewable Portfolio Standards
State renewable portfolio standard
State renewable portfolio goal
www.dsireusa.org / April 2009
Solar water heating eligible *† Extra credit for solar or customer-sited renewables
Includes separate tier of non-renewable alternative resources
WA: 15% by 2020*
OR: 25% by 2025 (large utilities)
5% - 10% by 2025 (smaller utilities)
CA: 20% by 2010
☼ NV: 20% by 2015*
☼ AZ: 15% by 2025
☼ NM: 20% by 2020 (IOUs)
10% by 2020 (co-ops)
HI: 20% by 2020
☼ Minimum solar or customer-sited requirement
TX: 5,880 MW by 2015
UT: 20% by 2025*
☼ CO: 20% by 2020 (IOUs)10% by 2020 (co-ops & large
munis)*
MT: 15% by 2015
ND: 10% by 2015
SD: 10% by 2015
IA: 105 MW
MN: 25% by 2025(Xcel: 30% by 2020)
☼ MO: 15% by 2021
IL: 25% by 2025
WI: Varies by utility;
10% by 2015 goal
MI: 10% + 1,100 MW by 2015*
☼ OH: 25% by 2025†
ME: 30% by 2000New RE: 10% by 2017
☼ NH: 23.8% by 2025☼ MA: 15% by
2020+ 1% annual increase(Class I Renewables)RI: 16% by 2020
CT: 23% by 2020
☼ NY: 24% by 2013
☼ NJ: 22.5% by 2021
☼ PA: 18% by 2020†
☼ MD: 20% by 2022
☼ DE: 20% by 2019*
☼ DC: 20% by 2020
VA: 12% by 2022*
☼ NC: 12.5% by 2021 (IOUs)
10% by 2018 (co-ops & munis)
VT: (1) RE meets any increase in retail sales by
2012; (2) 20% RE & CHP by 2017
28 states have an RPS
5 states have goals

US Wind Resources
Source: Wind Energy Atlas of the United States (NREL)
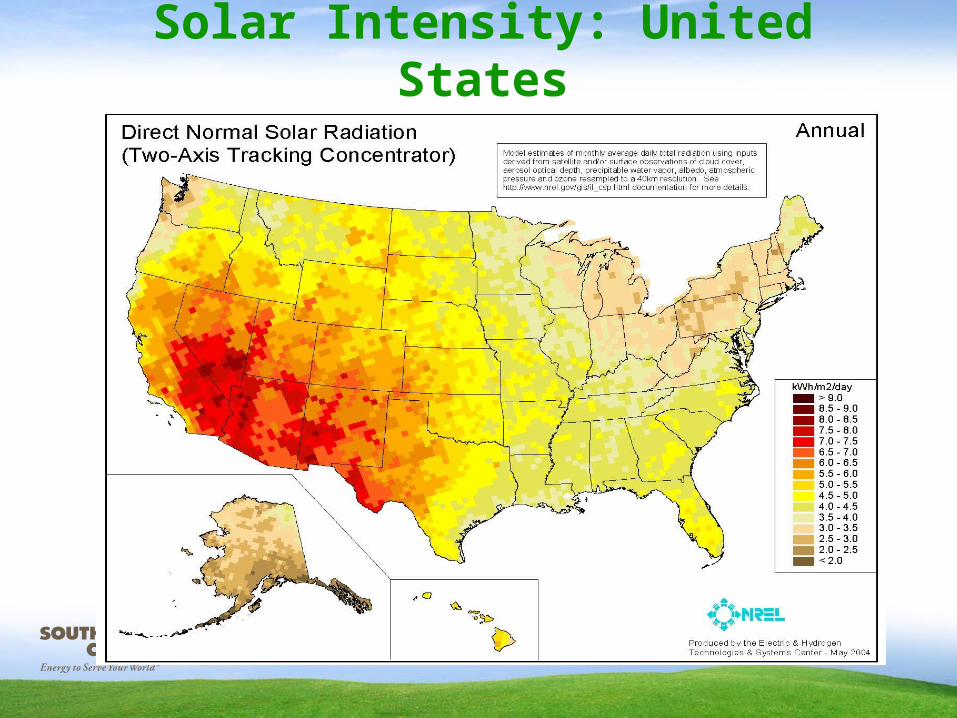
Solar Intensity: United States
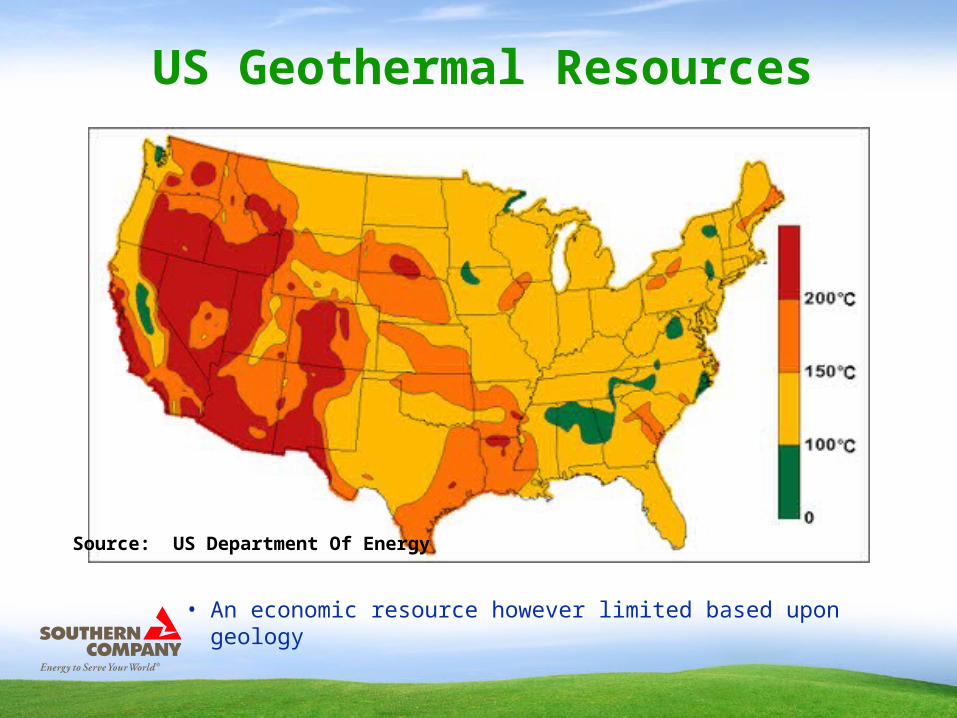
US Geothermal Resources
• An economic resource however limited based upon geology
Source: US Department Of Energy
Bioenergy
• Energy derived from Biomass• Biomass is defined by Ralph Sims as “recent organic
matter originally derived from plants as a result of the photosynthetic conversion process, or from animals, and which is destined to be utilized as a store of chemical energy to provide heat, electricity, or transport fuels”
• Biomass is an abundant resource in the Southeast.• 21,000 MW worldwide (8,300 MW US) - 2005
Biomass to Electricity Options
• Co-firing– Co-Milling– Direct Injection (DI)
• Dedicated Biomass Plants– Biomass Repowering of an existing unit– Brownfield or Greenfield sites
• Biomass Gasification - DI, CT, CC• Biodiesel Co-firing in CT’s or boilers

Co-Milling Project Objectives
• Determine the costs and benefits of co-firing whole tree green wood chips on:– power plant fuel handling– combustion efficiency– and air emissions
• Determine cost and feasibility of harvesting trees for co-firing fuel in an existing coal fired boiler.
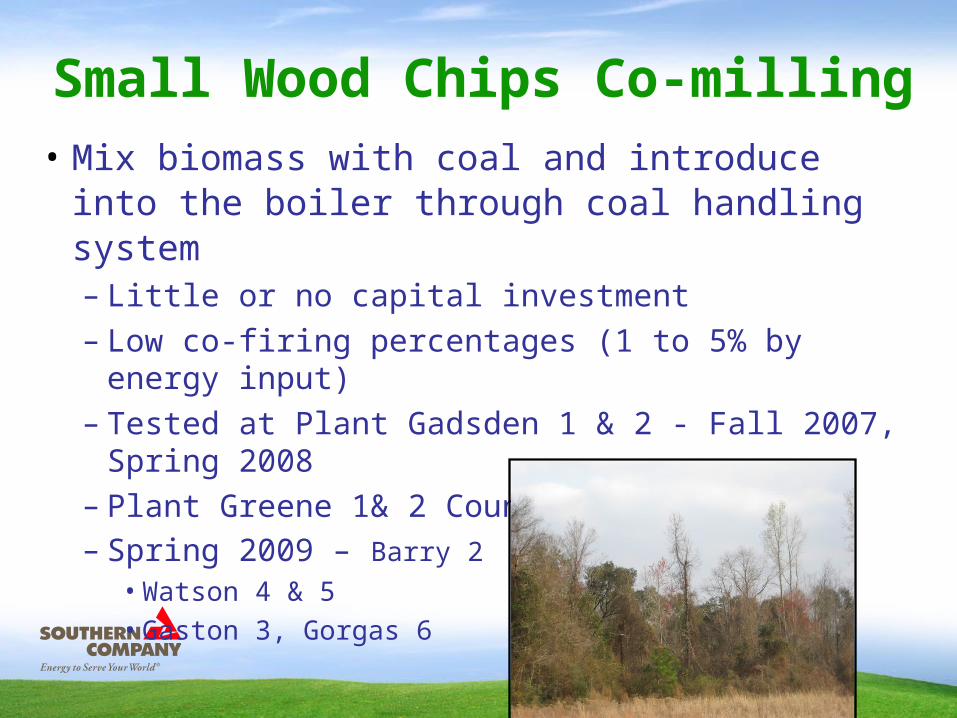
Small Wood Chips Co-milling• Mix biomass with coal and introduce into the boiler
through coal handling system– Little or no capital investment– Low co-firing percentages (1 to 5% by energy input)– Tested at Plant Gadsden 1 & 2 - Fall 2007, Spring 2008– Plant Greene 1& 2 County - Fall 2008– Spring 2009 – Barry 2
• Watson 4 & 5• Gaston 3, Gorgas 6
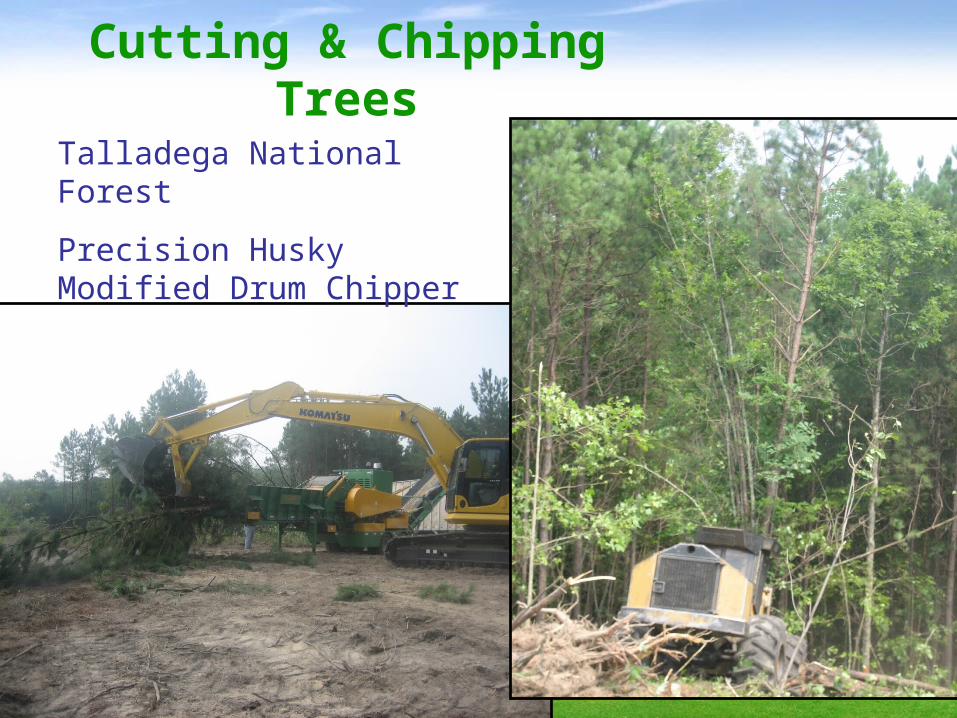
Cutting & Chipping Trees
Talladega National Forest
Precision Husky Modified Drum Chipper
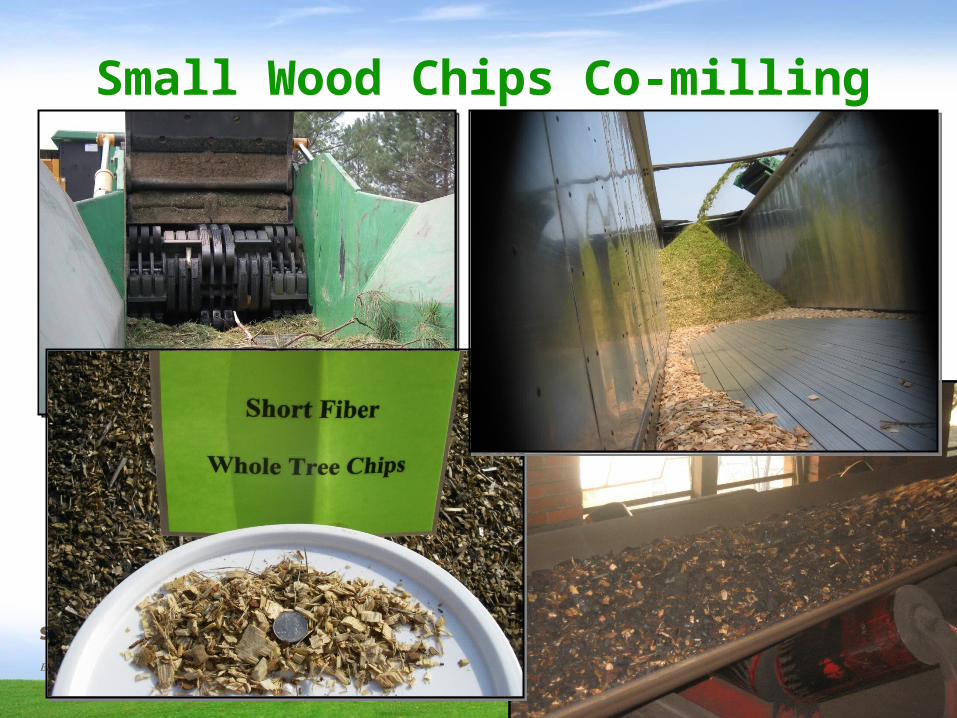
Small Wood Chips Co-milling
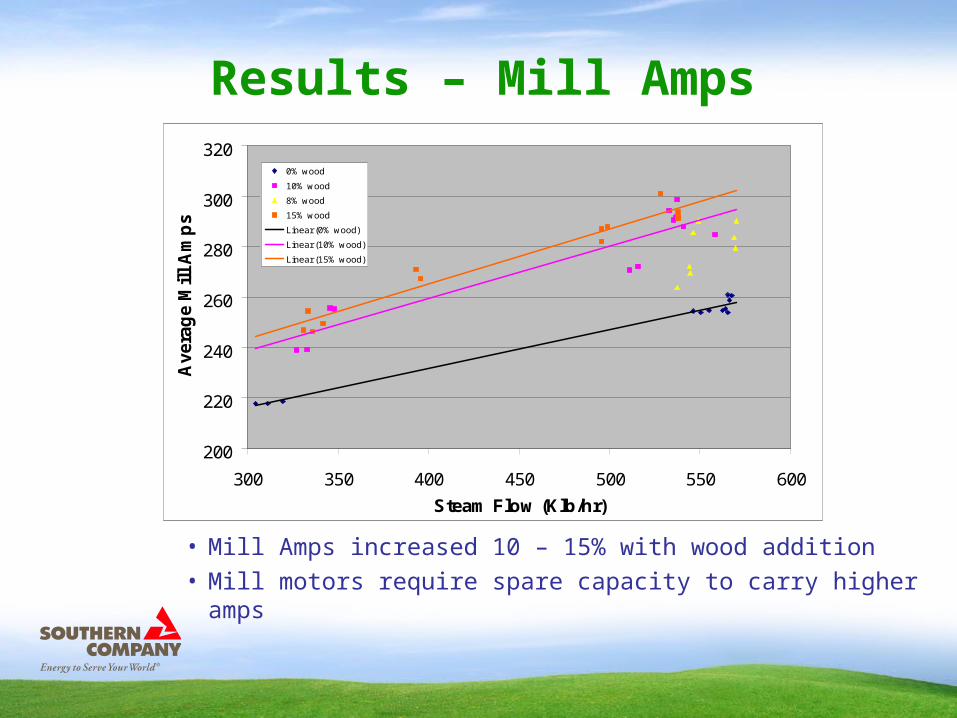
Results – Mill Amps
• Mill Amps increased 10 – 15% with wood addition• Mill motors require spare capacity to carry higher amps
200
220
240
260
280
300
320
300 350 400 450 500 550 600
Steam Flow (Klb/hr)
Avera
ge M
ill
Am
ps
0% wood
10% wood
8% wood
15% wood
Linear (0% wood)
Linear (10% wood)
Linear (15% wood)
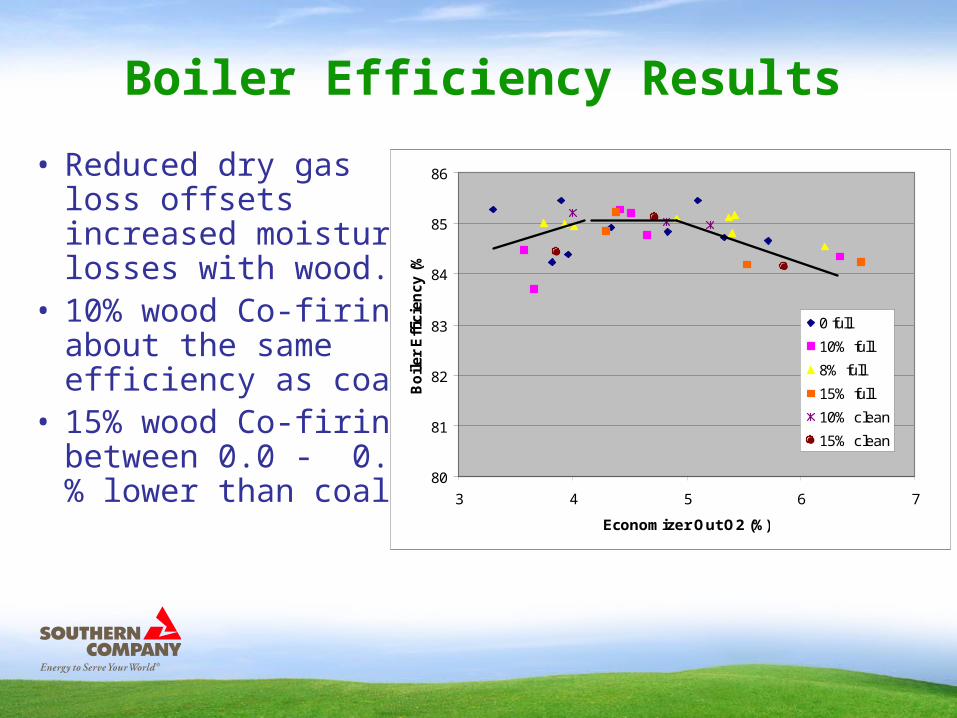
Boiler Efficiency Results
• Reduced dry gas loss offsets increased moisture losses with wood.
• 10% wood Co-firing about the same efficiency as coal
• 15% wood Co-firing between 0.0 - 0.7 % lower than coal
80
81
82
83
84
85
86
3 4 5 6 7
Economizer Out O2 (%)
Bo
iler
Eff
icie
ncy
(%
)
0 full
10% full
8% full
15% full
10% clean
15% clean
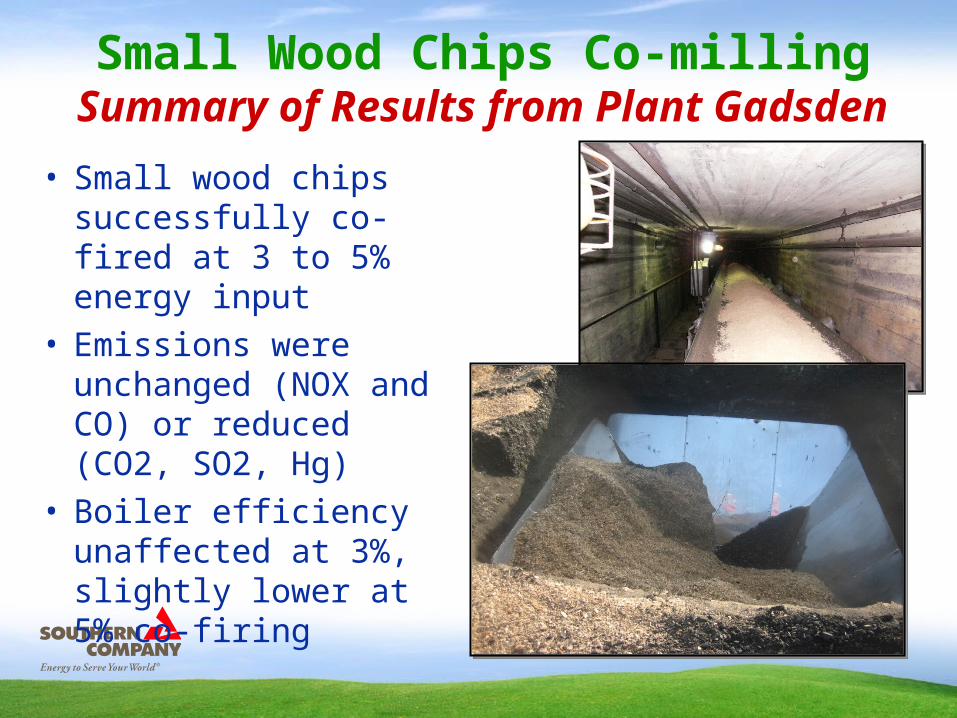
Small Wood Chips Co-millingSummary of Results from Plant Gadsden
• Small wood chips successfully co-fired at 3 to 5% energy input
• Emissions were unchanged (NOX and CO) or reduced (CO2, SO2, Hg)
• Boiler efficiency unaffected at 3%, slightly lower at 5% co-firing
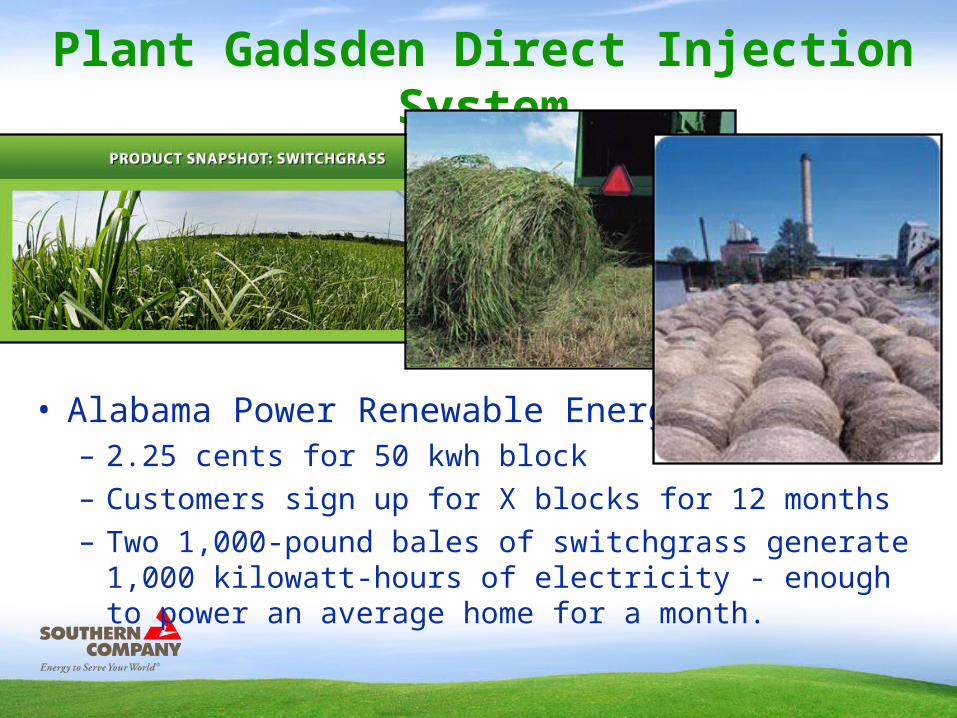
Plant Gadsden Direct Injection System
• Alabama Power Renewable Energy Rate– 2.25 cents for 50 kwh block– Customers sign up for X blocks for 12 months– Two 1,000-pound bales of switchgrass generate 1,000 kilowatt-hours
of electricity - enough to power an average home for a month.
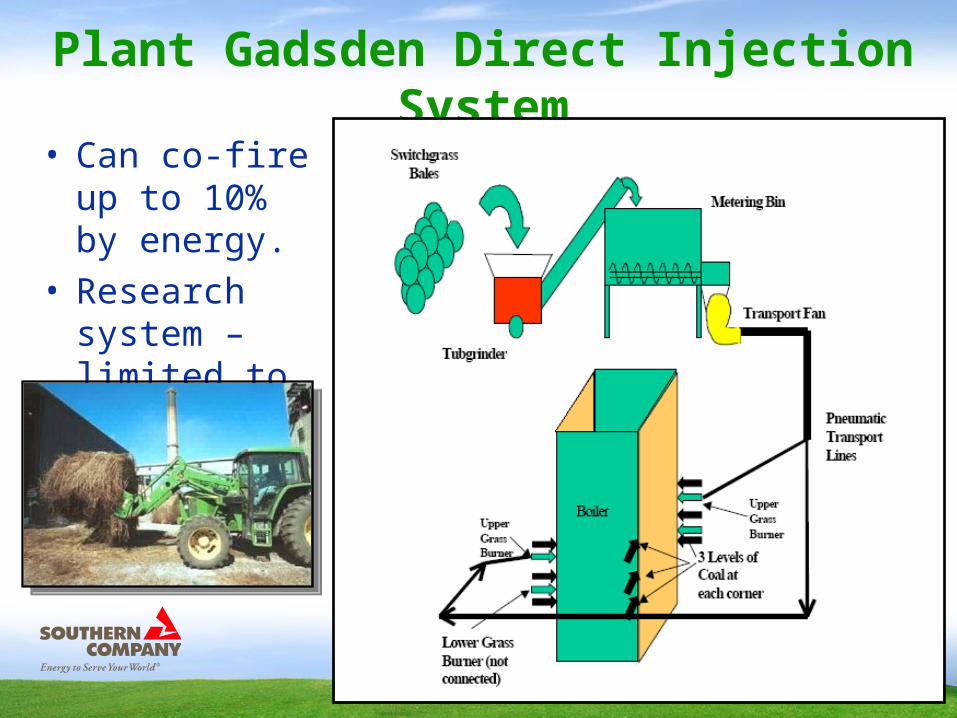
Plant Gadsden Direct Injection System
• Can co-fire up to 10% by energy.
• Research system – limited to 7,000 lb/hr.
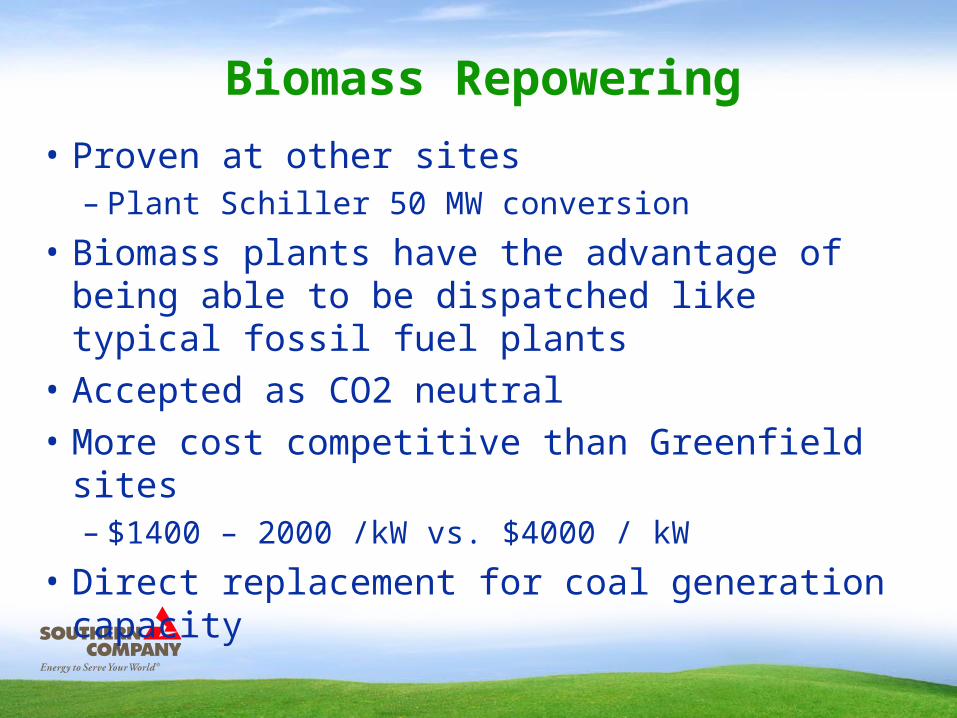
Biomass Repowering
• Proven at other sites– Plant Schiller 50 MW conversion
• Biomass plants have the advantage of being able to be dispatched like typical fossil fuel plants
• Accepted as CO2 neutral• More cost competitive than Greenfield sites
– $1400 – 2000 /kW vs. $4000 / kW• Direct replacement for coal generation capacity
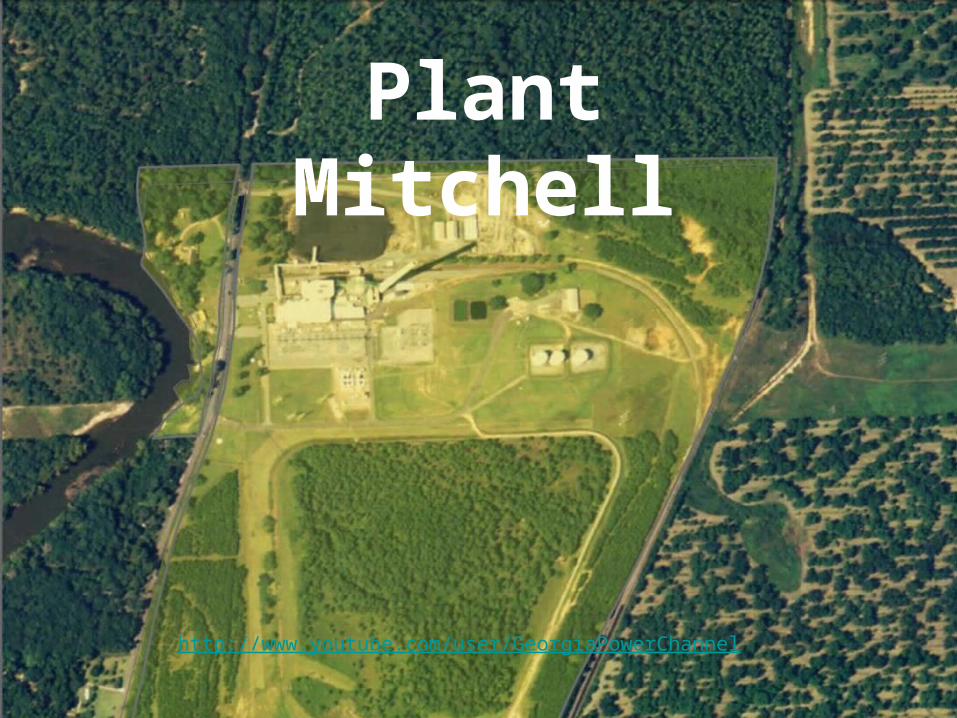
Plant Mitchell
http://www.youtube.com/user/GeorgiaPowerChannel
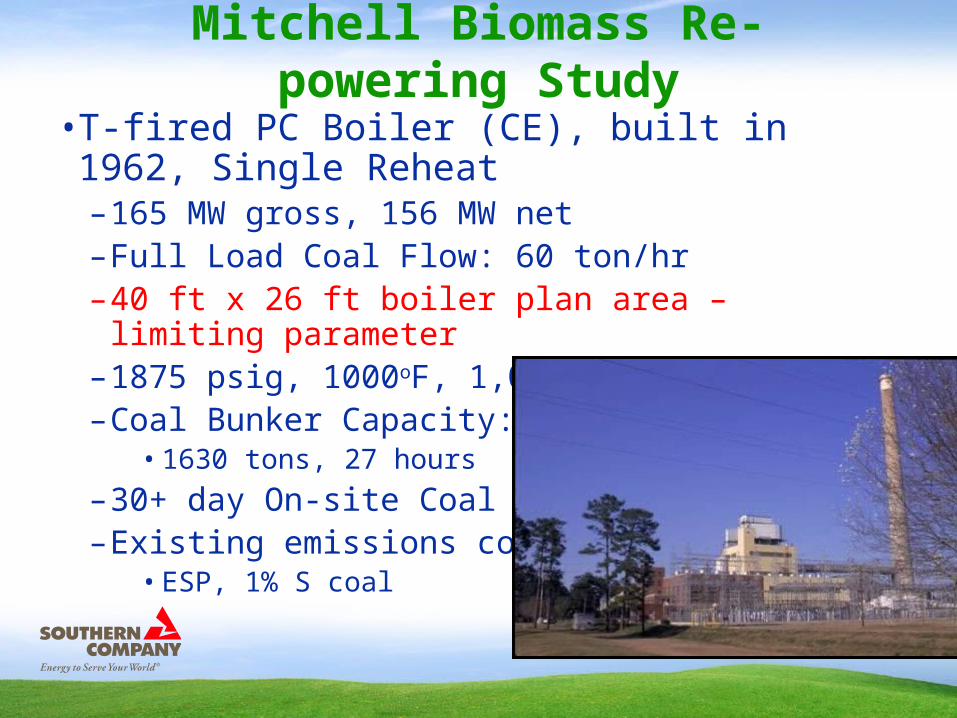
Mitchell Biomass Re-powering Study
• T-fired PC Boiler (CE), built in 1962, Single Reheat– 165 MW gross, 156 MW net– Full Load Coal Flow: 60 ton/hr– 40 ft x 26 ft boiler plan area – limiting parameter– 1875 psig, 1000oF, 1,075,000 lb/hr– Coal Bunker Capacity:
• 1630 tons, 27 hours– 30+ day On-site Coal Supply– Existing emissions controls
• ESP, 1% S coal
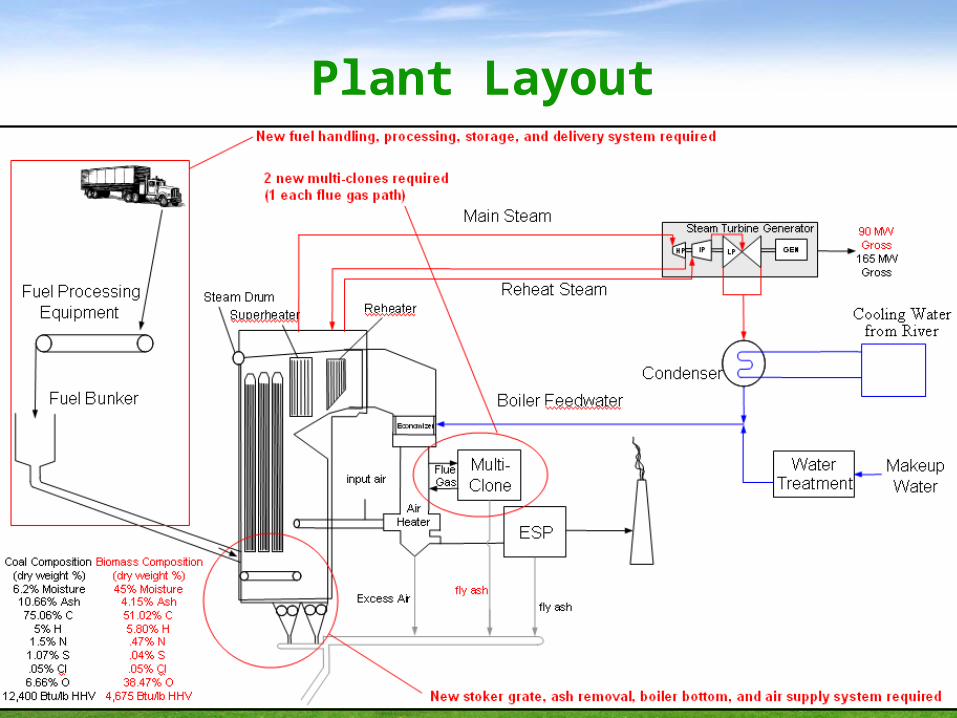
Plant Layout
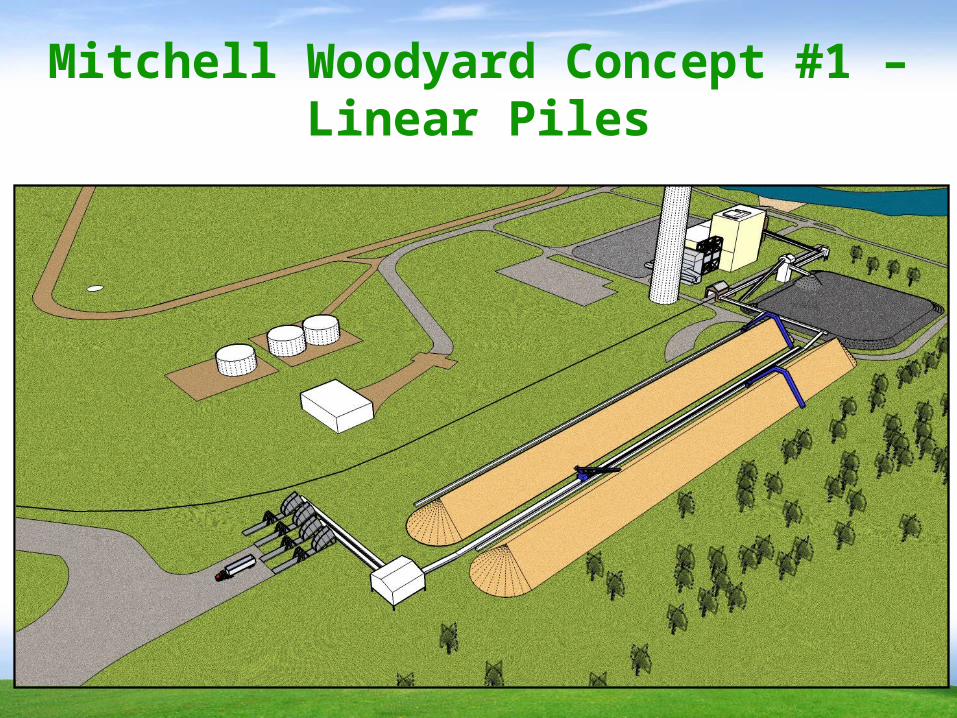
Mitchell Woodyard Concept #1 – Linear Piles
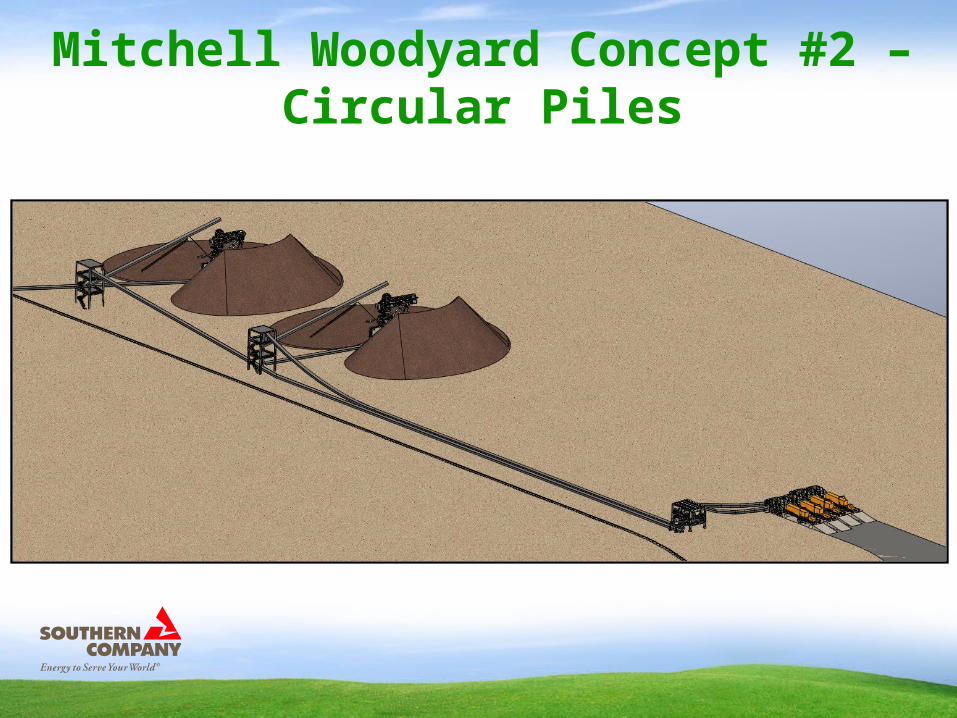
Mitchell Woodyard Concept #2 – Circular Piles
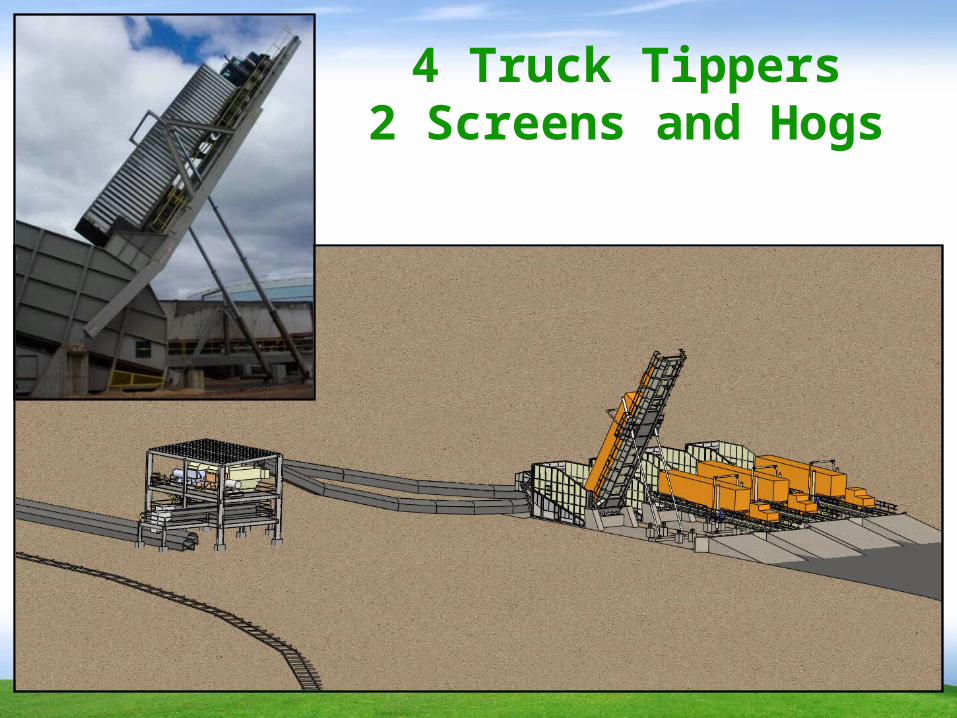
4 Truck Tippers2 Screens and Hogs
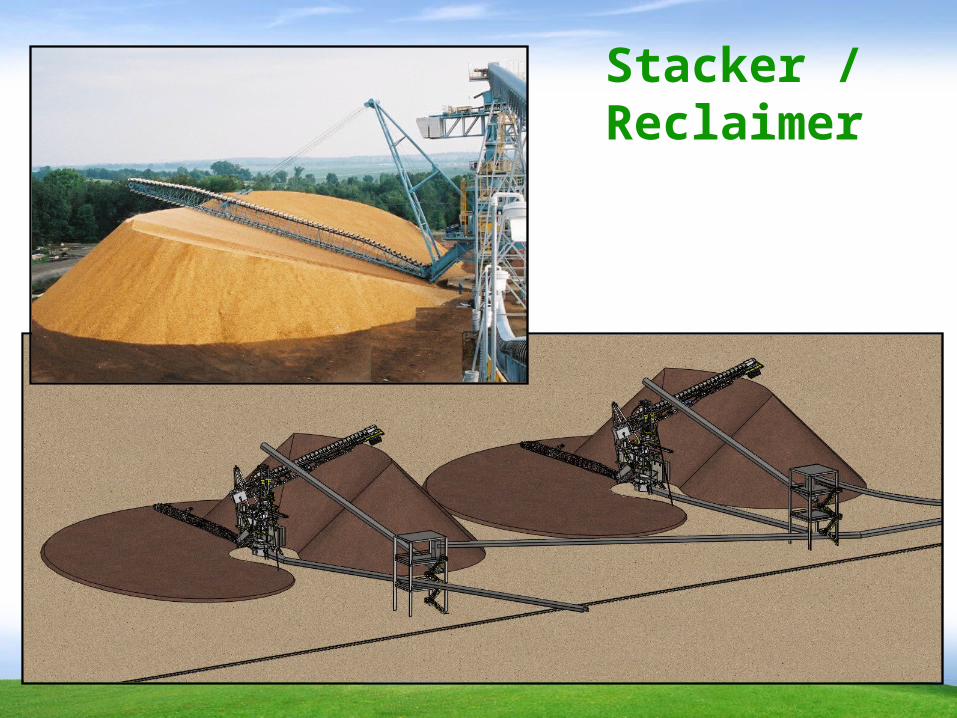
Stacker / Reclaimer

Boiler House Retrofit Requirements
Install:– Wood chip delivery system– Stoker grate– Air supply ductwork, including new booster fans for fuel distributors– Replace furnace bottom, pressure parts, etc.– Bottom ash collection system– Grate cooling water supply– Foundation upgrades– Install multi-clone between economizer and air heater (1 ea. path)– New retractable sootblowers for air heaters (1 each) – Controls
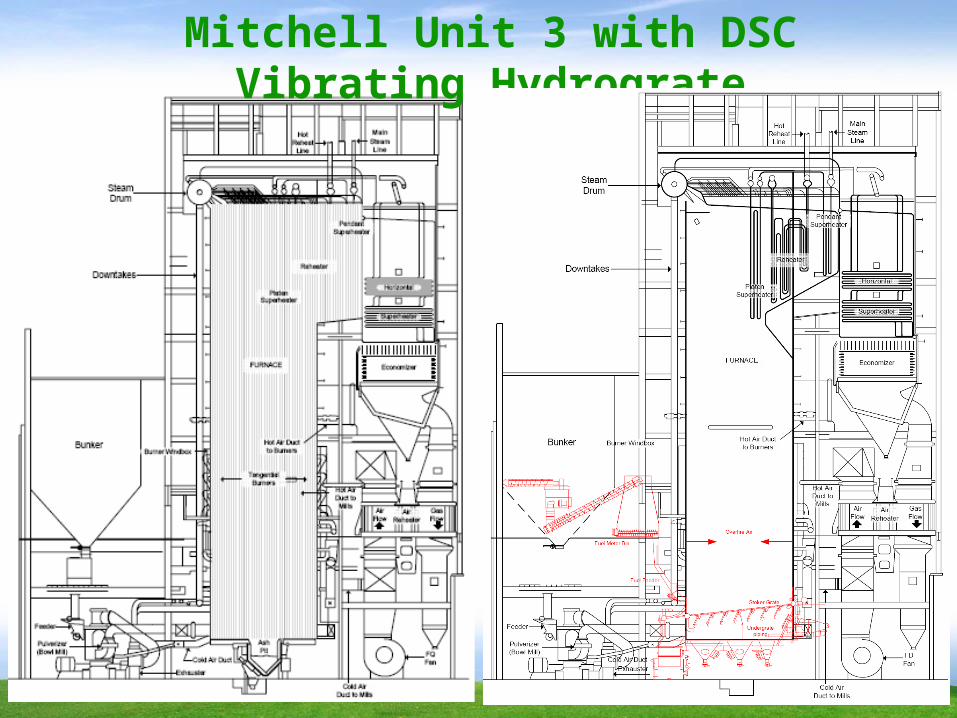
Mitchell Unit 3 with DSC Vibrating Hydrograte
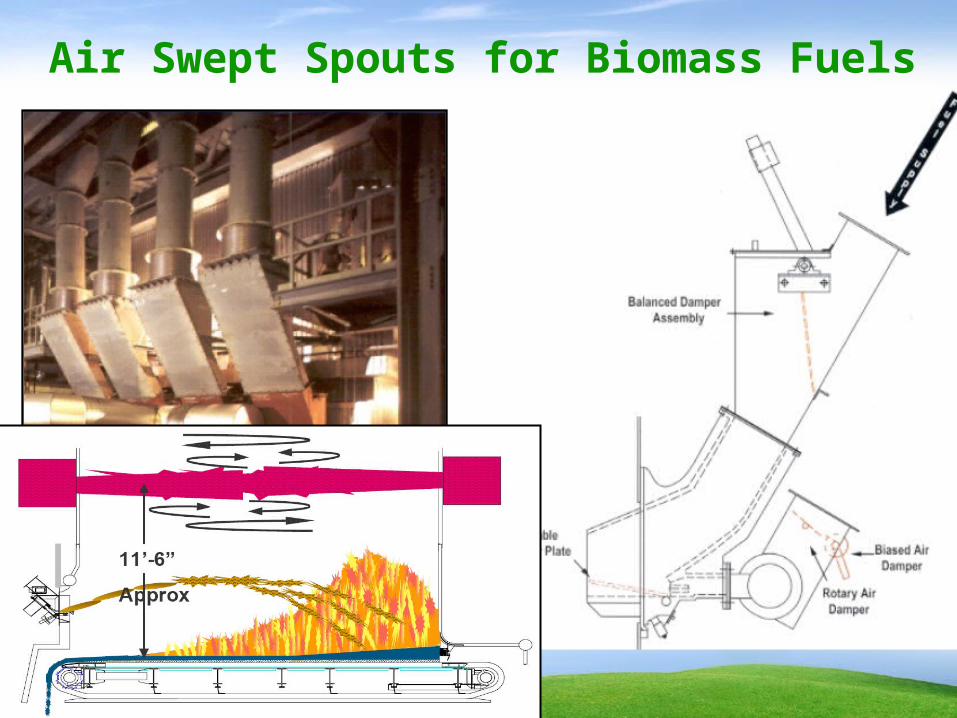
Air Swept Spouts for Biomass Fuels
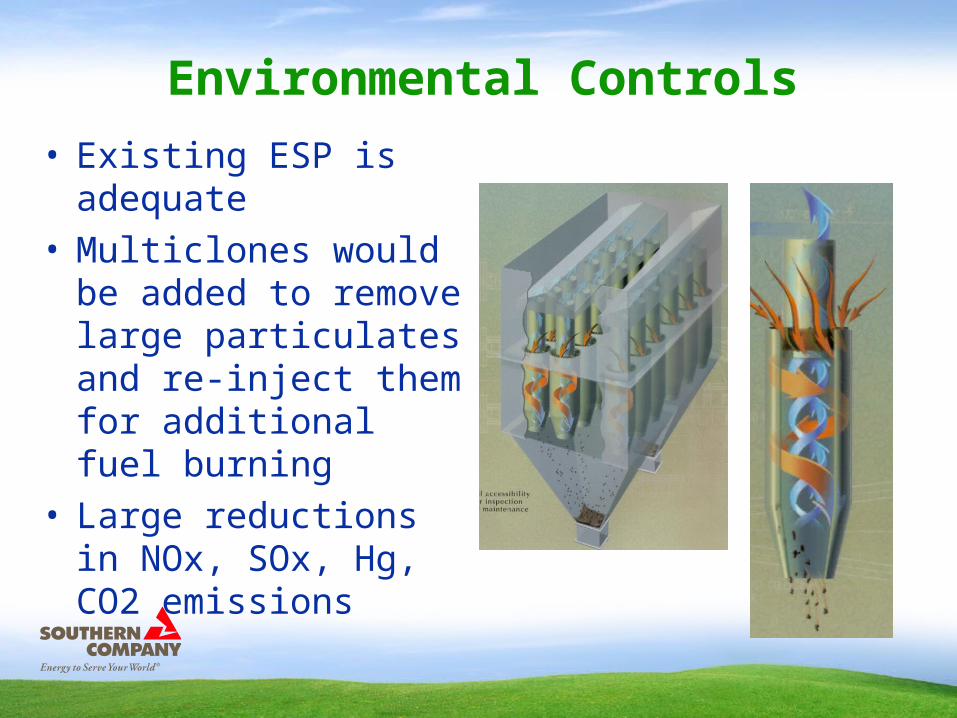
Environmental Controls
• Existing ESP is adequate• Multiclones would be added
to remove large particulates and re-inject them for additional fuel burning
• Large reductions in NOx, SOx, Hg, CO2 emissions
100% Biomass Operation• Capacity:
– 96 MW net w/ new Stoker Grate and Suspension Firing– Heat Rate ~ 12,500 Btu / Hr
• Approx. 1.1 million ton/yr biomass use– Biomass delivery would be on the order of 160 trucks per day for a
5.5 day delivery schedule.• Timeline
– August 22, 2008 Filed with GA PSC– December 2008 Air permit filed with EPD– March 17, 2009 PSC Unanimous Approval, 5 -0– March 2010 Final air permit expected– April 2011 Retrofit construction begins– June 2012 Begin operations
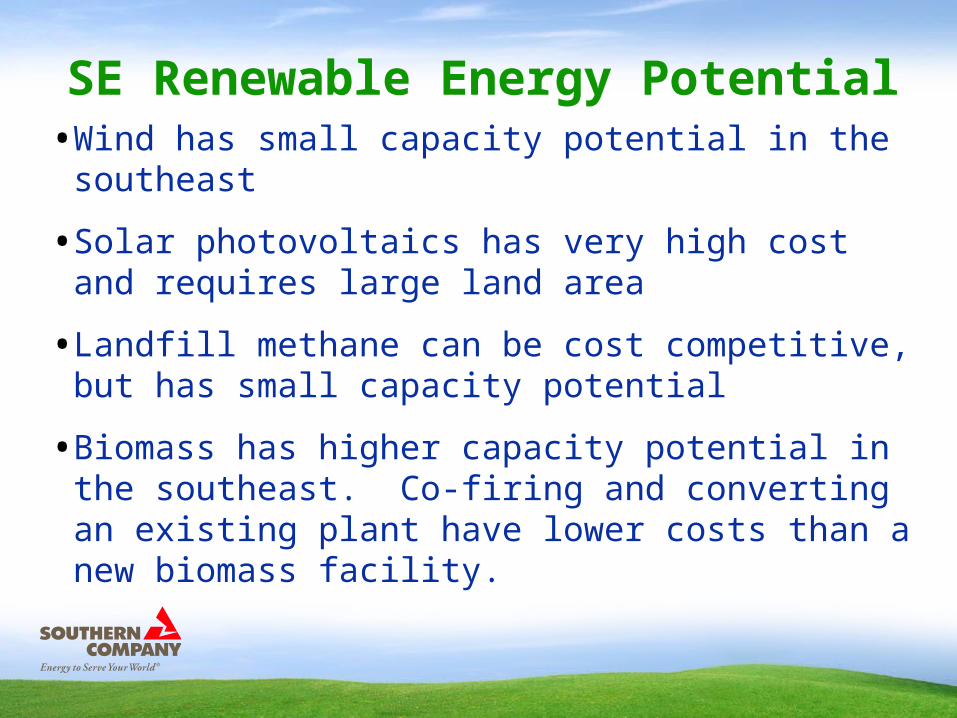
• Wind has small capacity potential in the southeast
• Solar photovoltaics has very high cost and requires large land area
• Landfill methane can be cost competitive, but has small capacity potential
• Biomass has higher capacity potential in the southeast. Co-firing and converting an existing plant have lower costs than a new biomass facility.
SE Renewable Energy Potential
Summary
• State and National RPS are more of a when than why.• Biomass is the most economical option in the
Southeast• Southern Company must develop a comprehensive
list of possible solutions which includes all forms of renewable generation.

Questions
If we knew what we were doing, it wouldn't be called research, would it?
- Albert Einstein


