Mycorrhizal Fungi for Improved Soil Fertility and Plant Health (or “Management and Utilization of Arbuscular Mycorrhizal Fungi”) David Douds USDA-ARS Eastern Regional Research Center [email protected]
Transcript
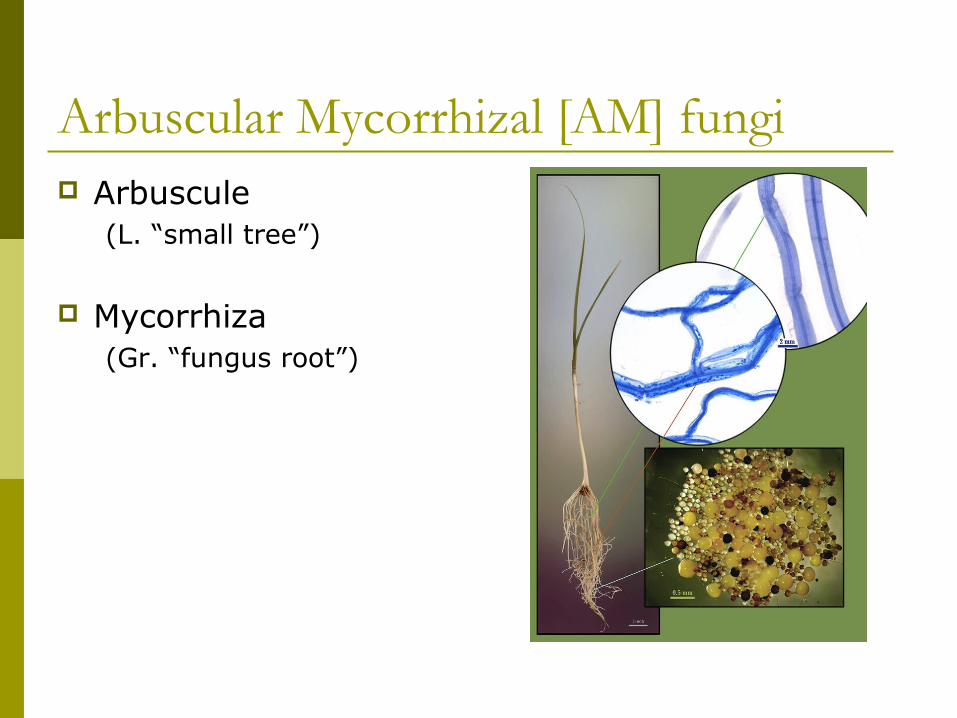
Mycorrhizal Fungi for Improved Soil Fertility and Plant Health
(or “Management and Utilization of Arbuscular Mycorrhizal Fungi”)
I. Farm management practices that influence indigenous AM fungi
Fertilization Pesticide application Over wintering cover crops Crop rotation Tillage Farming System
Cooperative research with The Rodale Institute
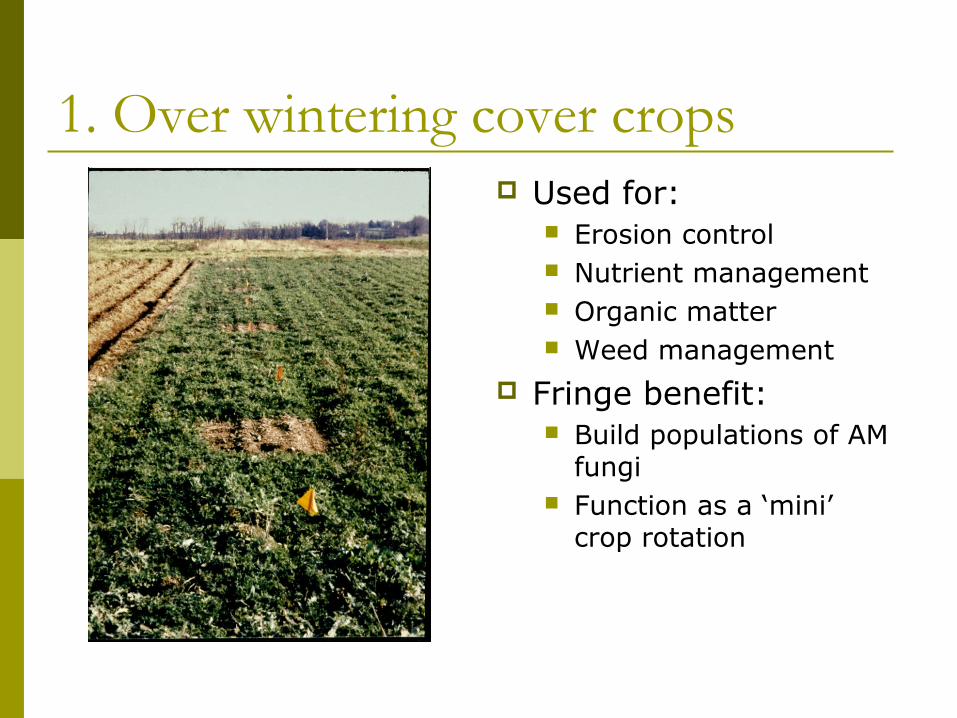
1. Over wintering cover crops Used for:
Erosion control Nutrient management Organic matter Weed management
Fringe benefit: Build populations of AM
fungi Function as a ‘mini’
crop rotation
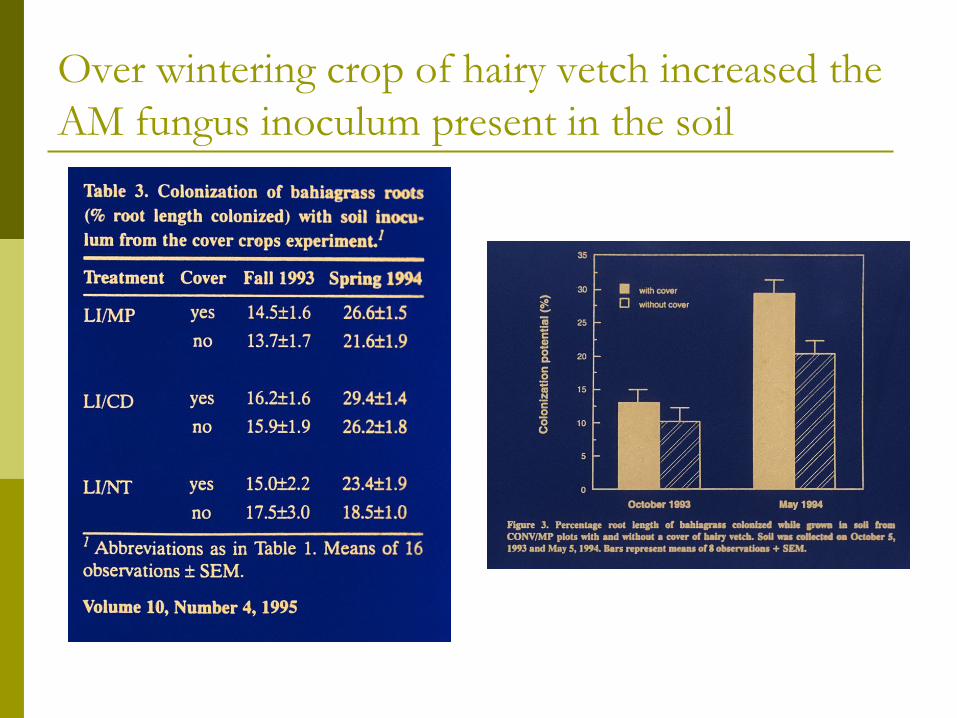
Over wintering crop of hairy vetch increased the AM fungus inoculum present in the soil
Long fallow disorder
Similar to bare fallows: Flooded soil syndrome Stale weed seed bank treatments
2. Crop rotation Some AM fungi are more
prolific when grown with a particular host plant
The AM fungi most prevalent after growth of one crop may not be the ones most beneficial to that crop
AM fungi may play a role in yield decline characteristic of continuous monoculture
Implications for a big switch to continuous corn for ethanol production?
3. Tillage Tillage interferes with
two functions of the extraradical mycelium of AM fungi:
1. As infective propagules
2. As nutrient absorbing organs of the symbiosis
Fairchild and Miller, 1990
1 2 30.3
0.4
0.5
0.6
0.7
0.8
0.9UndisturbedDisturbed
No added P
Cycle
Sh
oo
t d
ry w
t (g
)
1 2 30.4
0.5
0.6
0.7
0.8
0.9
+ 160 µgP g-1 Soil
Cycle
Sh
oo
t d
ry w
t (g
)
a. Corn grown for 4 wks in inoculated soil
b. Harvest shoot only
c. Disturb soil in half of pots, replant
d. Repeat cycle
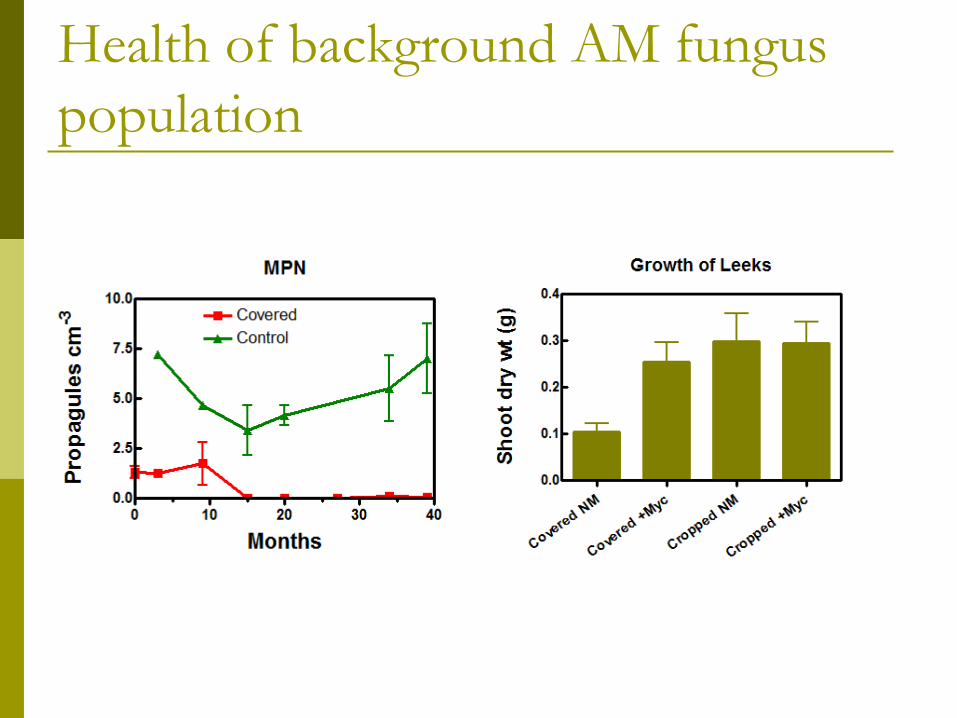
6. Farming system The Farming Systems Trial®
Soils from the organic rotations have a higher AM fungus inoculum potential
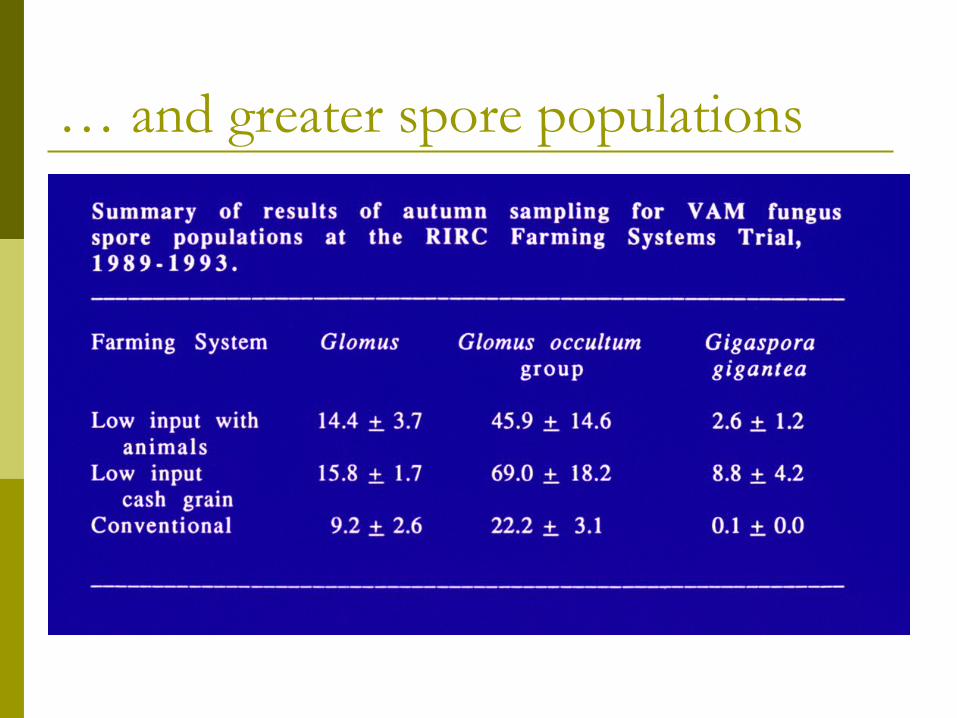
… and greater spore populations
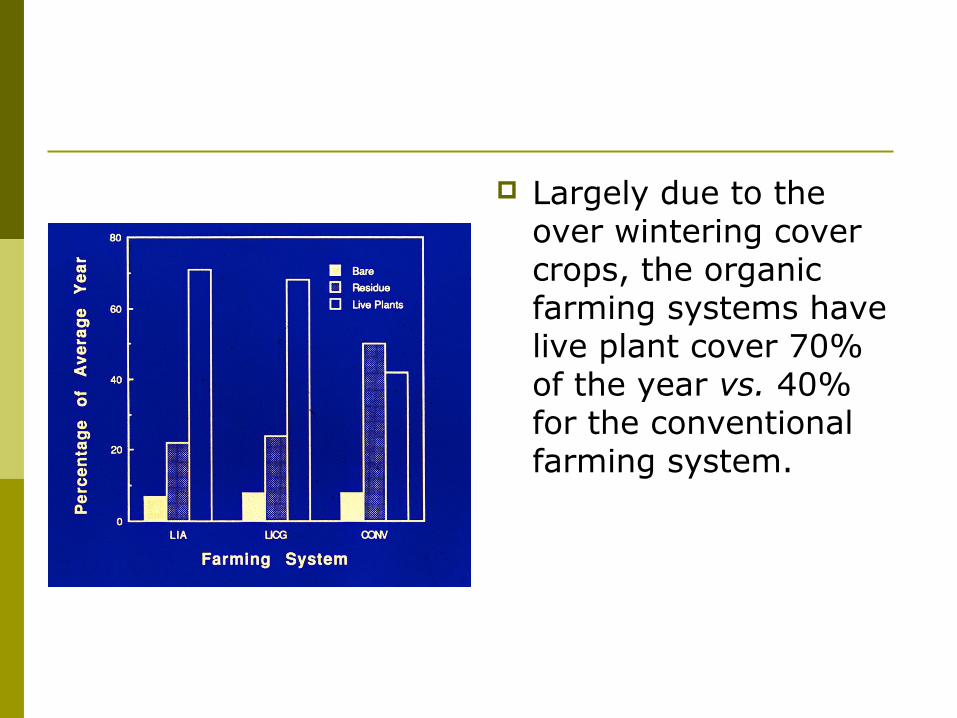
Largely due to the over wintering cover crops, the organic farming systems have live plant cover 70% of the year vs. 40% for the conventional farming system.
II. Inoculation with AM fungi
Options:commercially available inoculaproduce it yourself
Target farmers:vegetable producers who grow their own seedlings
labor intensive farms
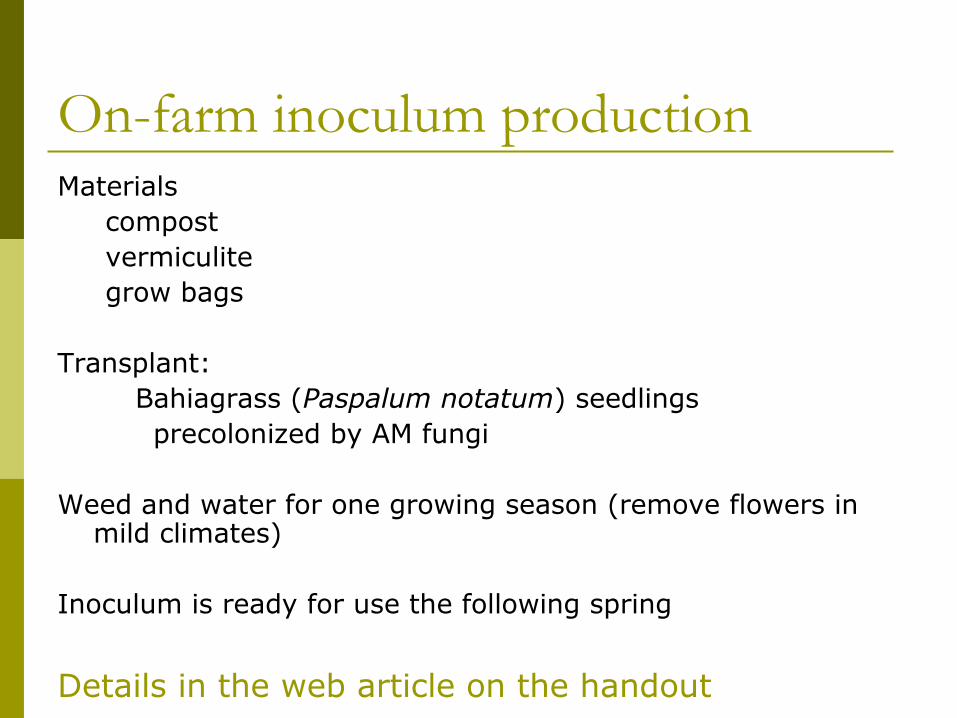
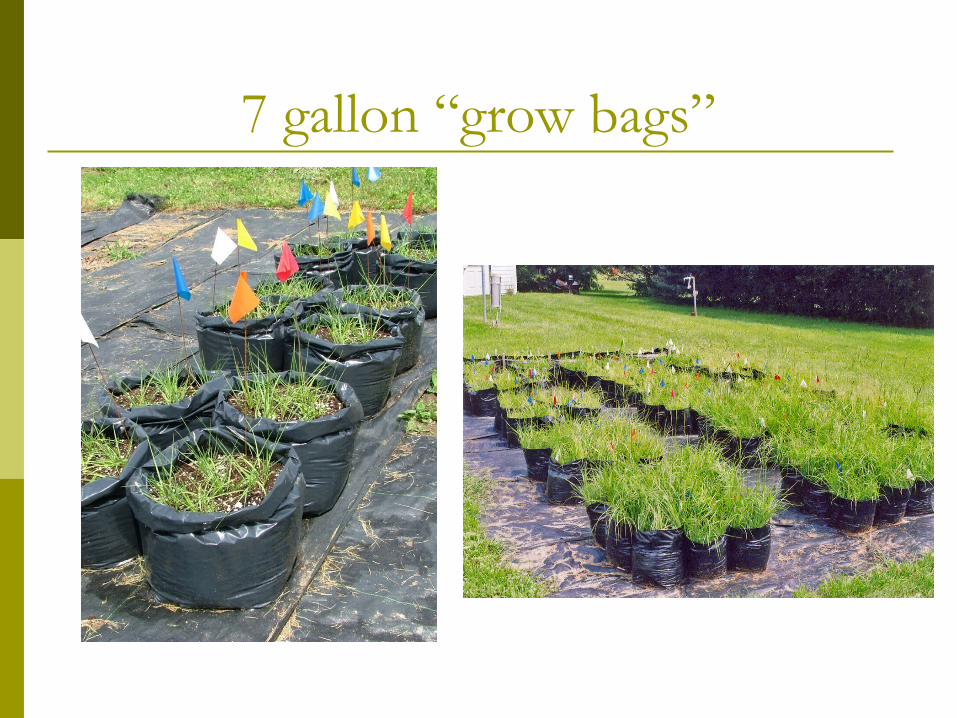
On-farm inoculum productionMaterials
compostvermiculitegrow bags
Transplant:Bahiagrass (Paspalum notatum) seedlingsprecolonized by AM fungi
Weed and water for one growing season (remove flowers in mild climates)
Inoculum is ready for use the following spring
Details in the web article on the handout
Considerations Introduce pathogens?
Compost has pathogen suppressive qualities Bahiagrass unlikely to share pathogens with
eventual crop host
Introduce weeds? Bahiagrass is frost killed (temperate climates) Some weeds are present in the compost
Functional diversity of AM fungi
7 gallon “grow bags”
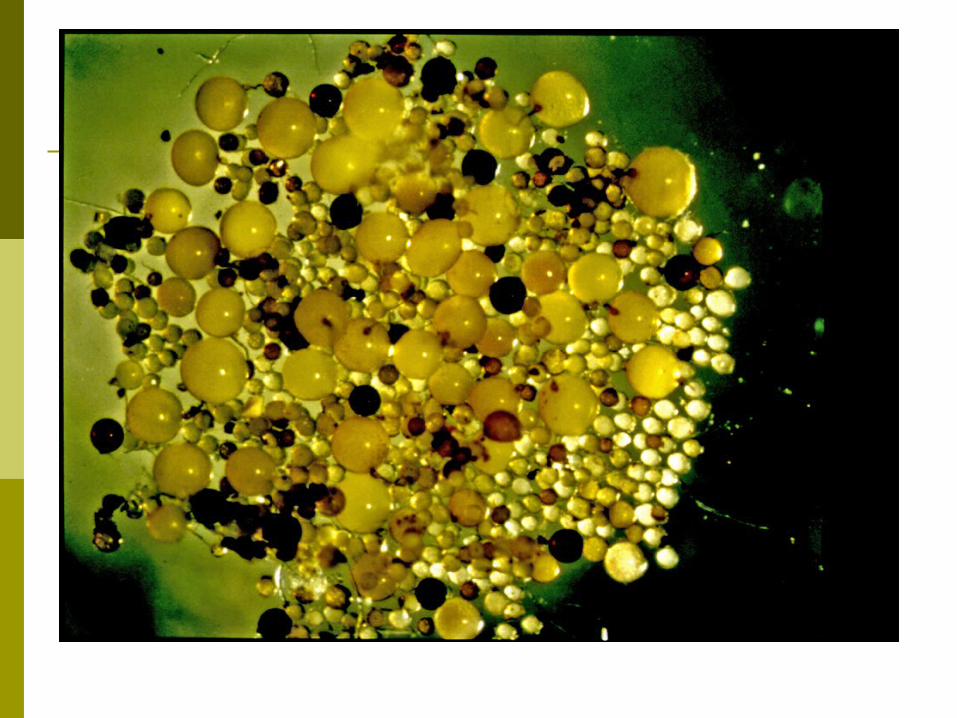
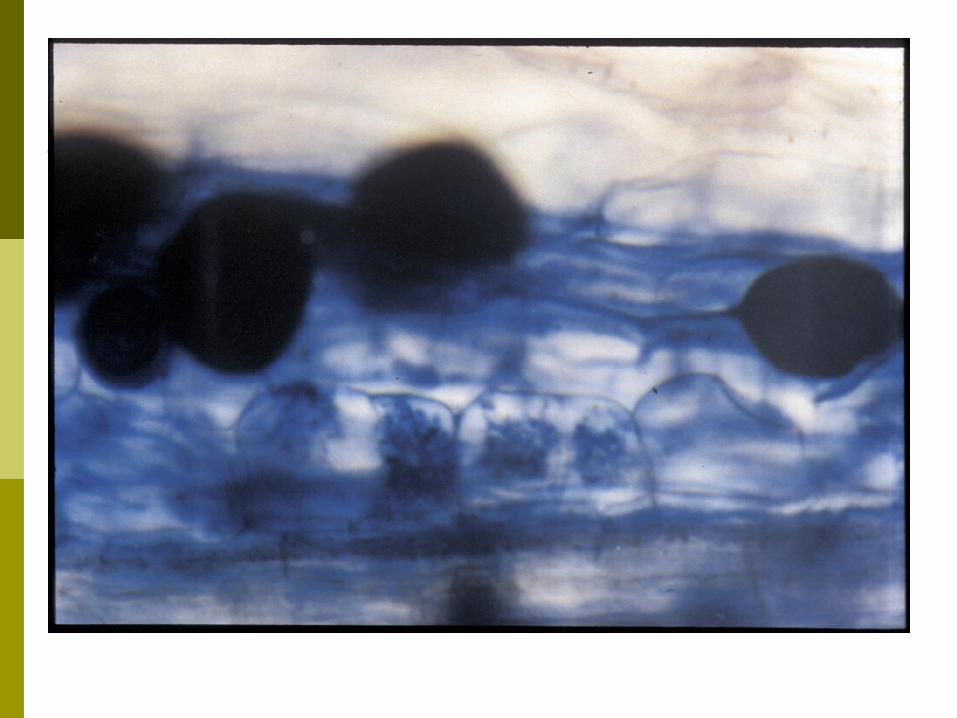
Inoculum of AM fungi
Spores
Infective hyphae
Colonized roots
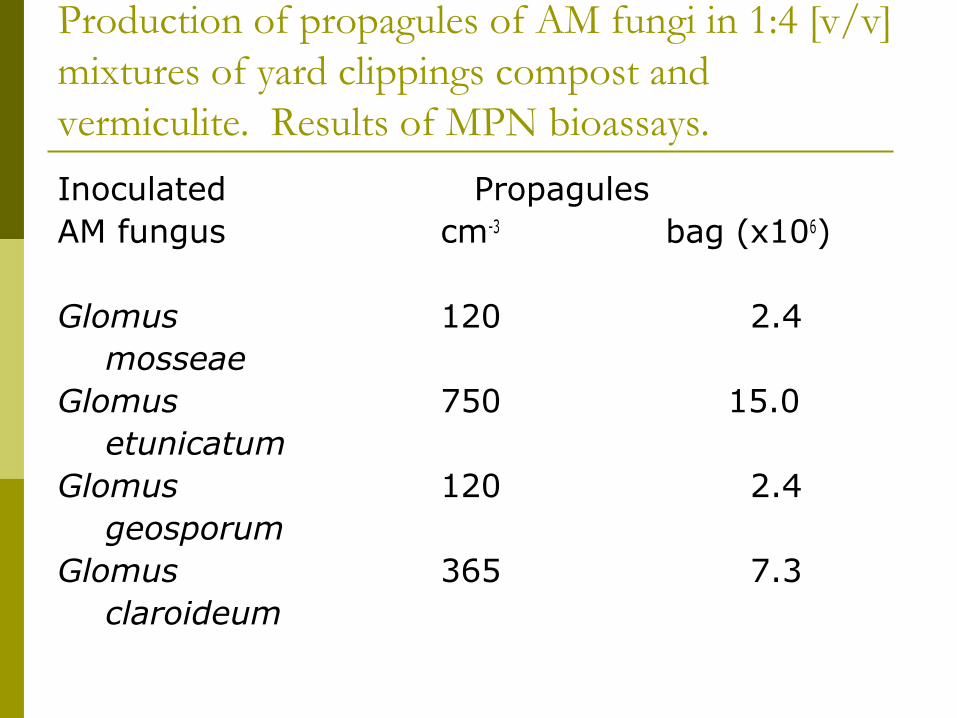
Production of propagules of AM fungi in 1:4 [v/v] mixtures of yard clippings compost and vermiculite. Results of MPN bioassays.
Inoculated PropagulesAM fungus cm-3 bag (x106)
Glomus 120 2.4mosseae
Glomus 750 15.0etunicatum
Glomus 120 2.4geosporum
Glomus 365 7.3claroideum
Spore production varies with dilution
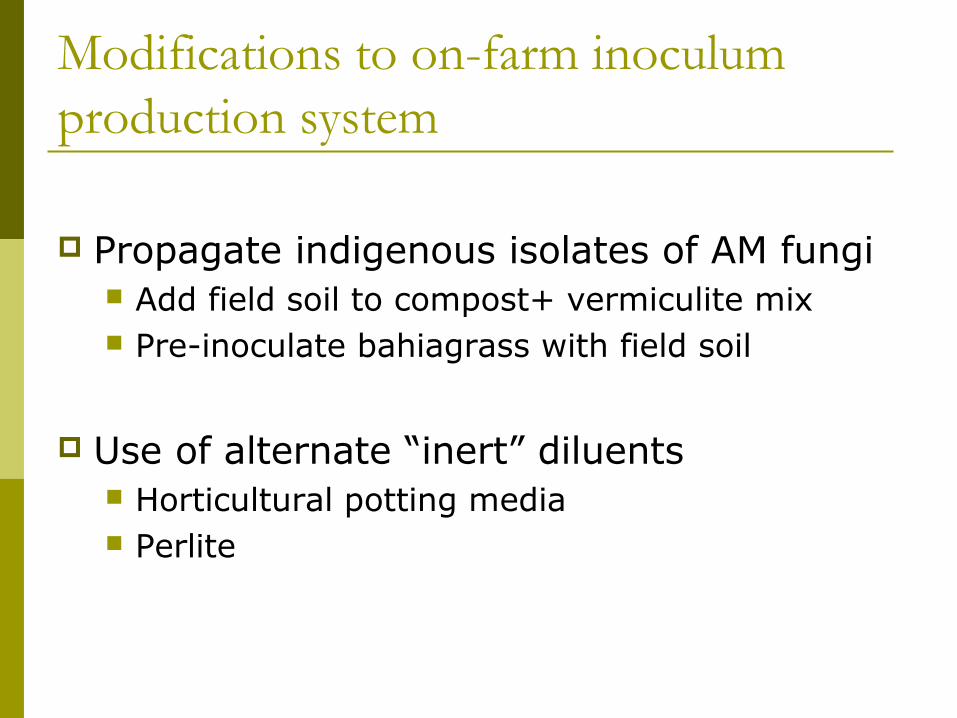
Modifications to on-farm inoculum production system
Propagate indigenous isolates of AM fungi Add field soil to compost+ vermiculite mix Pre-inoculate bahiagrass with field soil
Use of alternate “inert” diluents Horticultural potting media Perlite
Modifications to on-farm system
Diluents Field soil
Means of 3 years
0 10 20 30 40 50 60 70 800
20
40
60
80
100
Conv
Legume
Manure
Soil Depth
Pro
pag
ule
s cm
-3
Where to collect the soil- top 2-4 inches
Rodale Farming Systems Trial
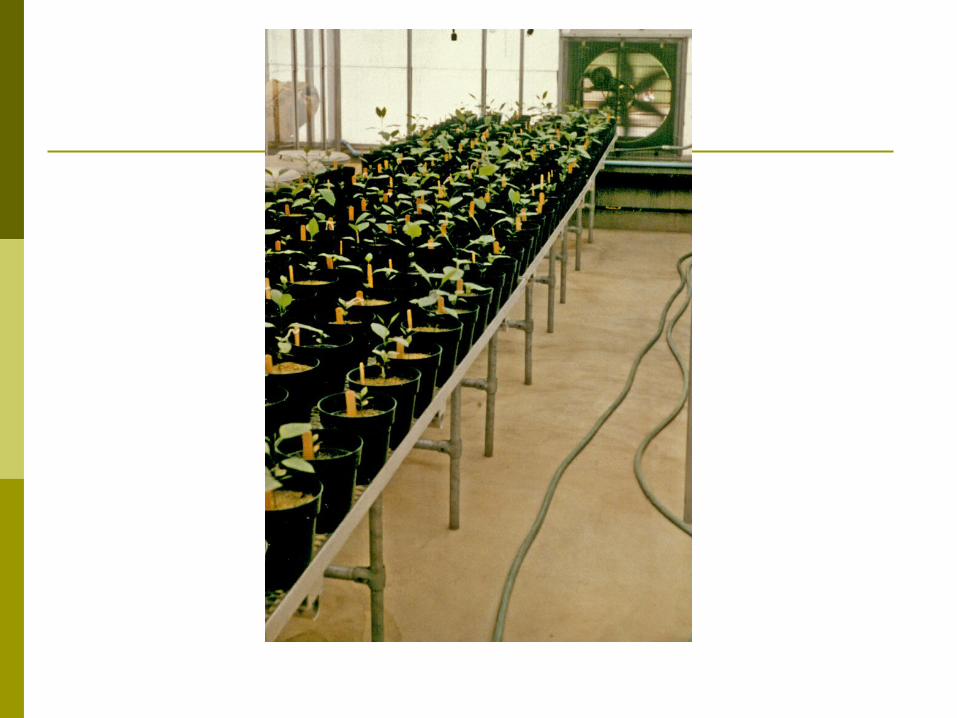
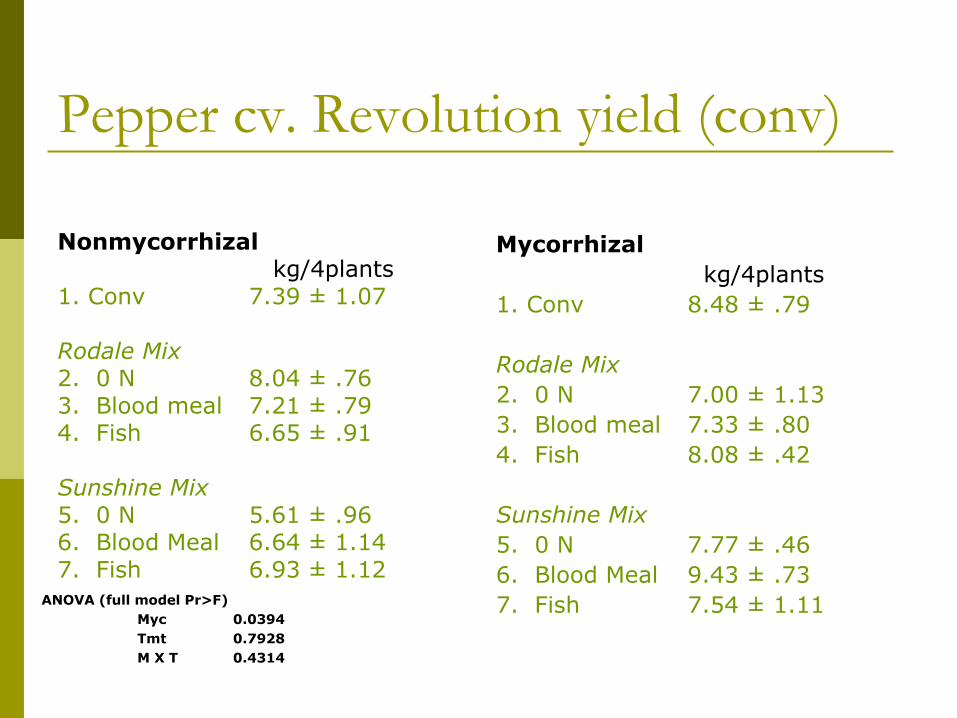
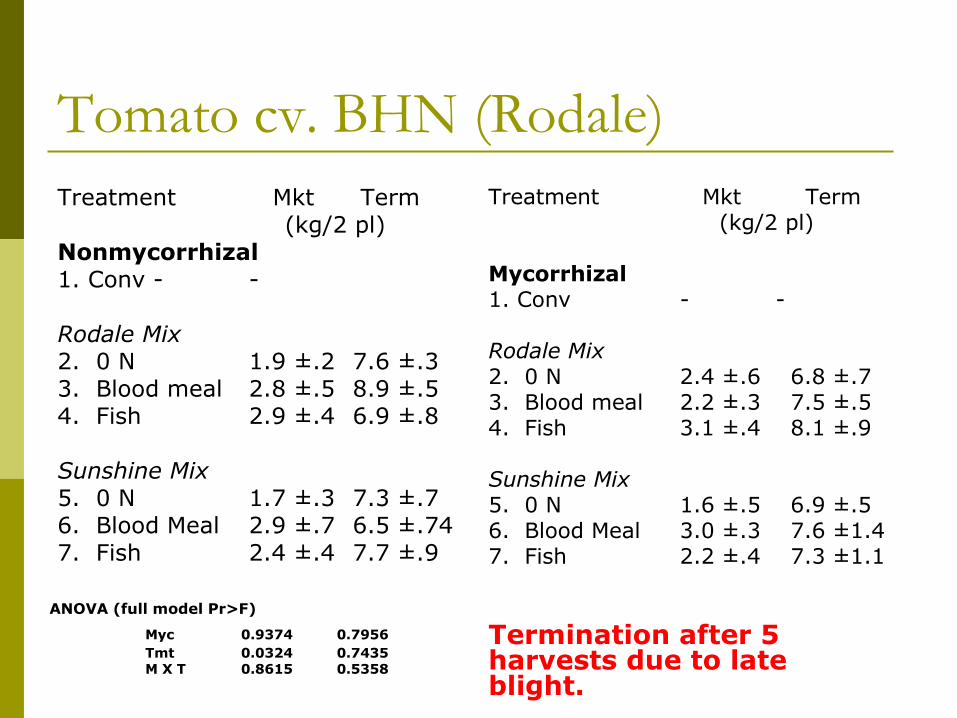
Utilization of inoculum in the greenhouse
Goal: produce a well-colonized seedling via organic practices, of comparable size to a conv.-grown seedling.
Manipulation of media, N P availability
Response of colonization to P level for tomato, pepper, and bahiagrass
0 10 20 30 40 50 60 700
10
20
30
40
50
60
70Tomato (Crista)
Pepper (Lafayette)
Bahiagrass
P concentration (ppm)
Ro
ot
len
gth
co
lon
ize
d (
%)
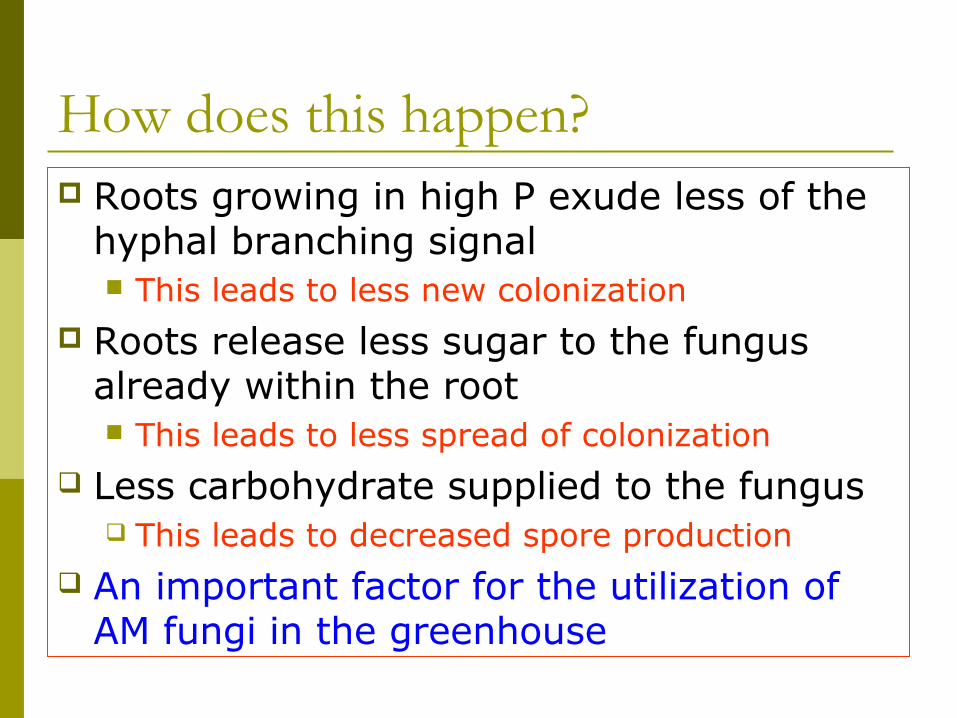
How does this happen? Roots growing in high P exude less of the
hyphal branching signal This leads to less new colonization
Roots release less sugar to the fungus already within the root This leads to less spread of colonization
Less carbohydrate supplied to the fungus This leads to decreased spore production
An important factor for the utilization of AM fungi in the greenhouse
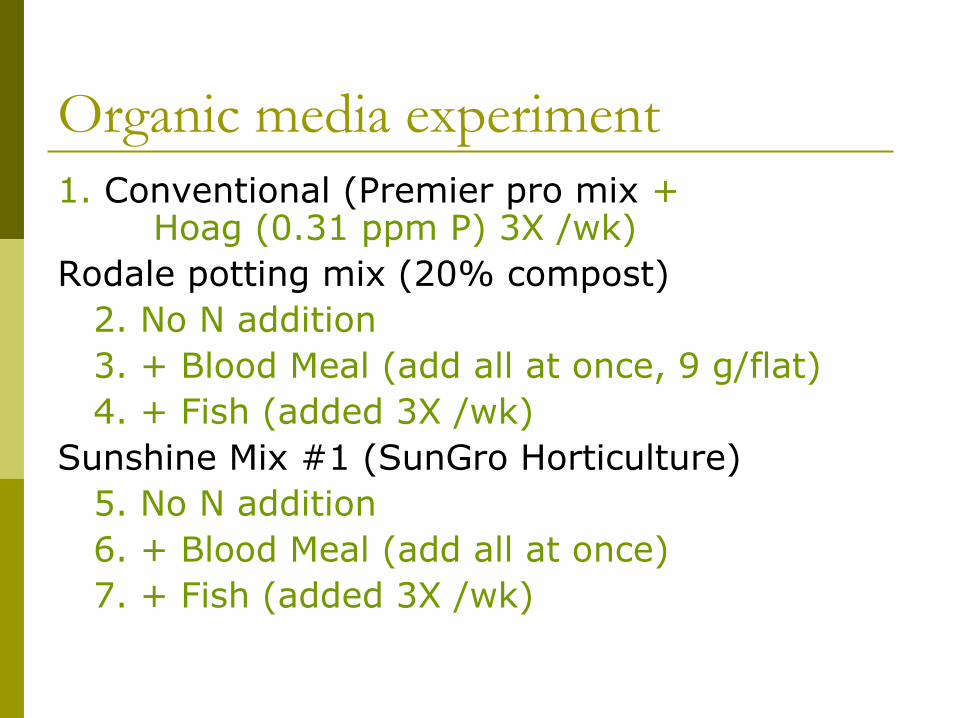
Organic media experiment1. Conventional (Premier pro mix +