16
Southwest Alaska Southwest Alaska Rural Energy Project Rural Energy Project
| Date post: | 24-Dec-2015 |
| Category: |
Documents |
| Upload: | valentine-chandler |
| View: | 214 times |
| Download: | 0 times |
Southwest AlaskaSouthwest Alaska
Rural Energy ProjectRural Energy Project

Community:Community: March March 0606
Fuel # 1Fuel # 1
March 06March 06
GasolineGasolineAvg. Resid.Avg. Resid.
Electric RateElectric Rate
06-30-0606-30-06
After PCEAfter PCE
06-30-200406-30-2004DieselDiesel
UsedUsed
By UtilityBy Utility
DillinghamDillingham $3.95/$3.95/galgal
$4.44$4.44 24.3924.39
cents per cents per kwhkwh
16.5816.58
cents per cents per kwhkwh
1,242,521,242,5222
gallonsgallons
ManokotakManokotak $6.05/$6.05/galgal
$7.00/gal$7.00/gal 34.0034.00
cents per cents per kwhkwh
27.2727.27
Cents per Cents per kwhkwh
97,05297,052
gallonsgallons
High Cost EnergyHigh Cost Energy

Peak Oil:Peak Oil:The point we have recovered half of all available oilThe point we have recovered half of all available oil
“Our ignorance is not so vast as our failure to use what we know”
Dr. M. King Hubbert
After making a prediction in 1956 that U.S. oil production would peak in 1970 and decline thereafter, he was laughed out of the industry. His prediction was only one year off.

Peak Oil: Peak Oil: Has it happened yet on a global scale?
A number of theorists believe some peak in world oil production has already occurred. Colin Campbell of the Association for the Study of Peak Oil & Gas (ASPO) has calculated that the global production of conventional oil peaked in the spring of 2004.
Kenneth S. Deffeyes predicted in his book Beyond Oil - The View From Hubbert's Peak that global oil production would hit a peak on Thanksgiving Day 2005 (Deffeyes has since revised his claim, and now argues that world oil production peaked on December 16 2005).
“Peaking will result in dramatically higher oil prices, which will cause protracted economic hardship in the United States and the world. However, the problems are not insoluble. Timely, aggressive mitigation initiatives addressing both the supply and the demand sides of the issue will be required.”

VolatilitVolatilitVolatilityVolatility
Crude Oil Imports (Top 15 Countries)(Thousand Barrels per Day)
CountryMar-
06Feb-
06YTD
2006Mar-
05Jan - Mar
2005
CANADA 1,716 1,710 1,732 1,451 1,509
MEXICO 1,697 1,774 1,722 1,590 1,500
SAUDI ARABIA
1,322 1,418 1,356 1,553 1,561
VENEZUELA 1,183 1,178 1,197 1,315 1,340
NIGERIA 1,114 1,342 1,191 879 996
ANGOLA 510 464 465 675 493
IRAQ 476 450 487 548 516
ALGERIA 281 163 228 134 165
ECUADOR 242 222 281 305 322
COLOMBIA 170 126 156 108 110
UNITED KINGDOM
145 82 88 290 215
BRAZIL 123 164 114 32 38
NORWAY 121 71 87 165 128
KUWAIT 111 152 111 179 184
CHAD 84 77 79 46 73

Renewable Energy Renewable Energy
Environmentally Friendly
Harnessed LocallyEndless Supply
Economical
Decentralized
Diversified Sources
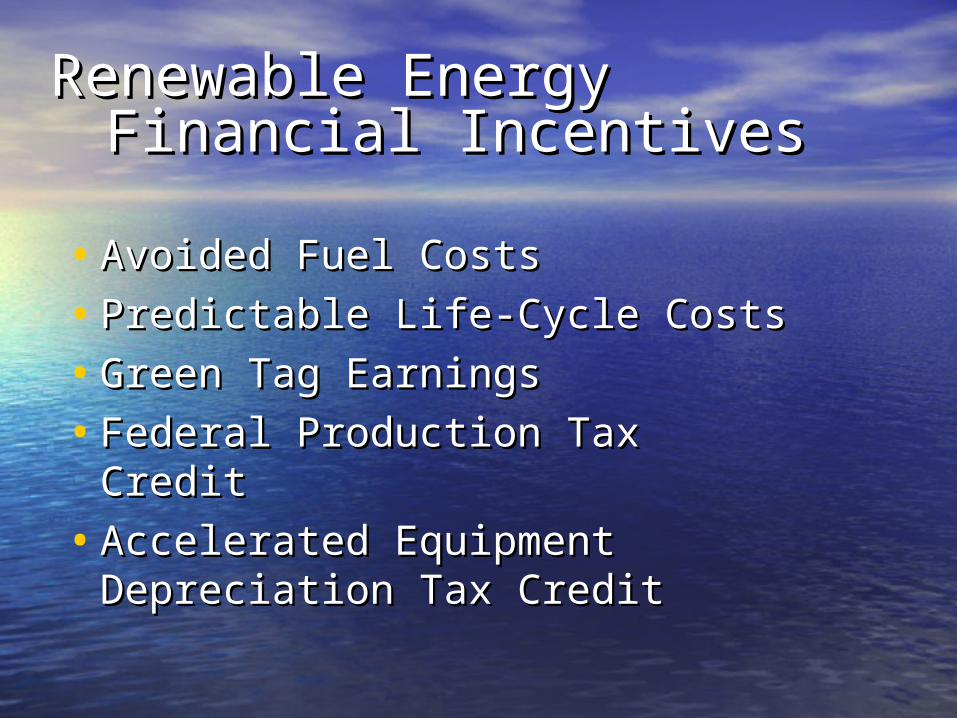
Financial IncentivesFinancial Incentives
• Avoided Fuel CostsAvoided Fuel Costs
• Predictable Life-Cycle CostsPredictable Life-Cycle Costs
• Green Tag EarningsGreen Tag Earnings
• Federal Production Tax CreditFederal Production Tax Credit
• Accelerated Equipment Accelerated Equipment Depreciation Tax CreditDepreciation Tax Credit
Renewable EnergyRenewable Energy

Renewable Portfolio Renewable Portfolio Standards Standards
Currently 22 States have a mandated Renewable Energy Requirement
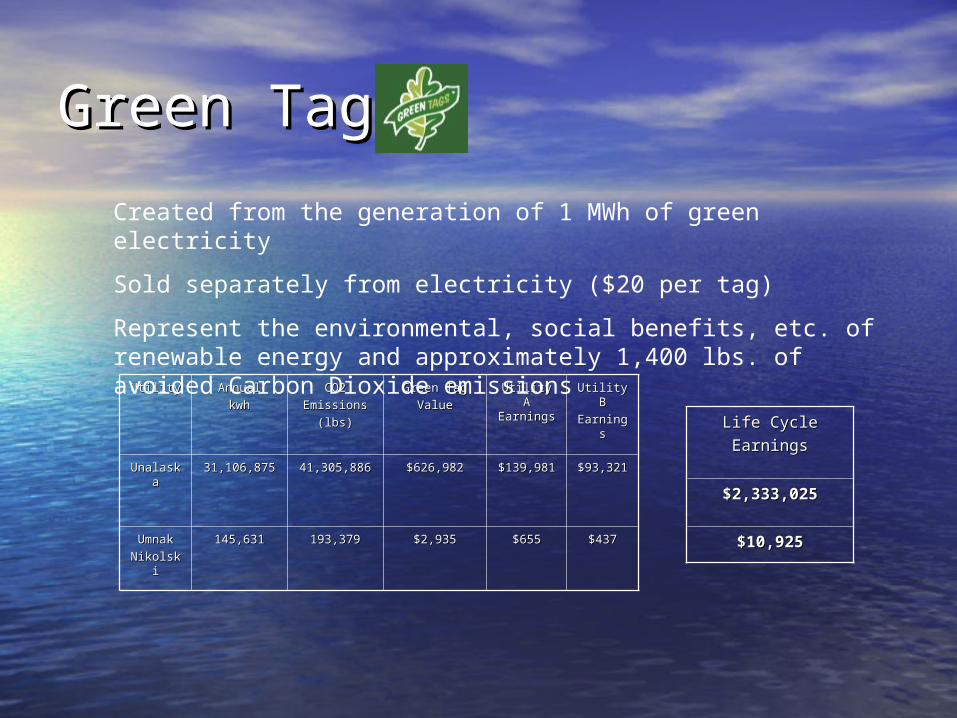
Green TagsGreen Tags
UtilityUtility AnnualAnnual
kwhkwhCO2CO2
EmissionsEmissions
(lbs)(lbs)
Green TagGreen Tag
ValueValueUtility A Utility A EarningsEarnings
Utility BUtility B
EarningsEarnings
UnalaskUnalaskaa
31,106,87531,106,875 41,305,88641,305,886 $626,982$626,982 $139,981$139,981 $93,321$93,321
UmnakUmnak
NikolskiNikolski145,631145,631 193,379193,379 $2,935$2,935 $655$655 $437$437
Created from the generation of 1 MWh of green electricity
Sold separately from electricity ($20 per tag)
Represent the environmental, social benefits, etc. of renewable energy and approximately 1,400 lbs. of avoided Carbon Dioxide emissions
Life CycleLife Cycle
EarningsEarnings
$2,333,025$2,333,025
$10,925$10,925

Green Tags:Green Tags:
• Utilities required to meet RPSUtilities required to meet RPS
• Organizations looking to green Organizations looking to green operationsoperations
• Individuals in areas without local Individuals in areas without local green energy purchasing optionsgreen energy purchasing options
Who Buys Them?
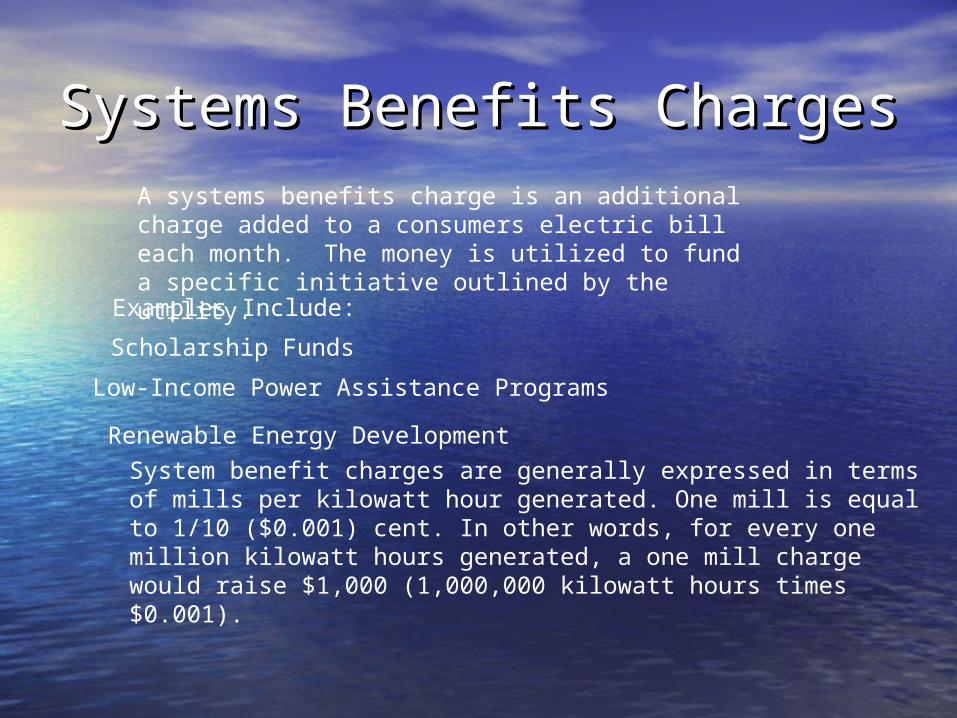
Systems Benefits ChargesSystems Benefits Charges
System benefit charges are generally expressed in terms of mills per kilowatt hour generated. One mill is equal to 1/10 ($0.001) cent. In other words, for every one million kilowatt hours generated, a one mill charge would raise $1,000 (1,000,000 kilowatt hours times $0.001).
A systems benefits charge is an additional charge added to a consumers electric bill each month. The money is utilized to fund a specific initiative outlined by the utility.
Examples Include:
Scholarship Funds
Low-Income Power Assistance Programs
Renewable Energy Development
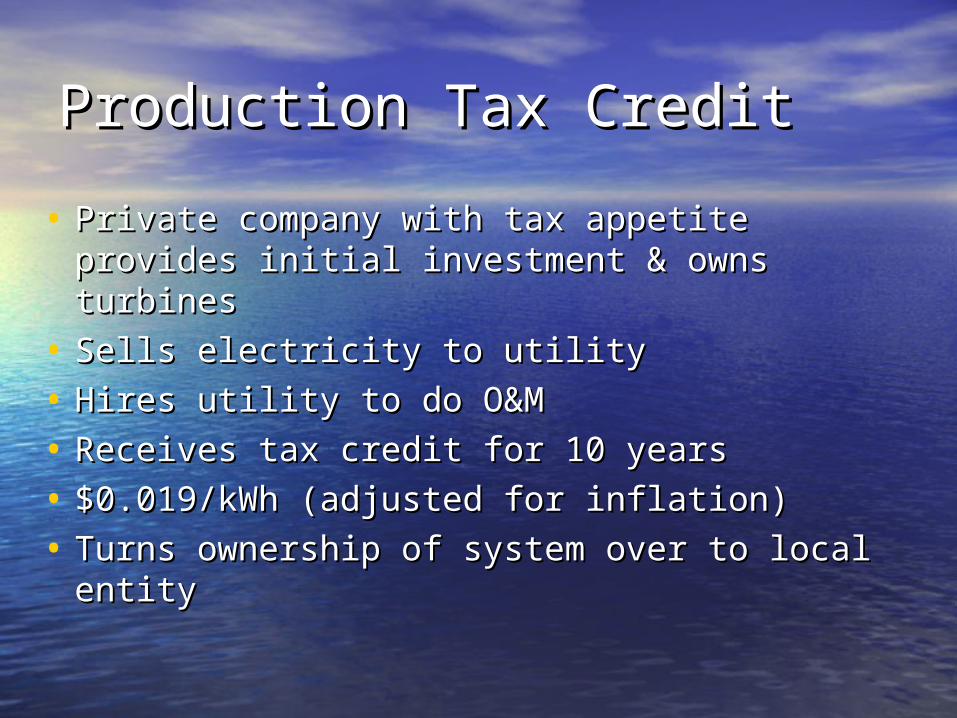
Production Tax CreditProduction Tax Credit
• Private company with tax appetite Private company with tax appetite provides initial investment & owns turbinesprovides initial investment & owns turbines
• Sells electricity to utilitySells electricity to utility
• Hires utility to do O&MHires utility to do O&M
• Receives tax credit for 10 yearsReceives tax credit for 10 years
• $0.019/kWh (adjusted for inflation)$0.019/kWh (adjusted for inflation)
• Turns ownership of system over to local Turns ownership of system over to local entityentity

PTC ExamplePTC Example
Installed cost = $8 millionElectricity generated = 8,100,000 kWh/yr
Investor:PTC = $121,500/yr ($1,215,000 over 10 yrs)Sales to utility = $810,000/yr (8,100,000 over 10 yrs)
Utility:Payments to turbine owner = $810,000/yr (8,100,000 over 10 yrs)
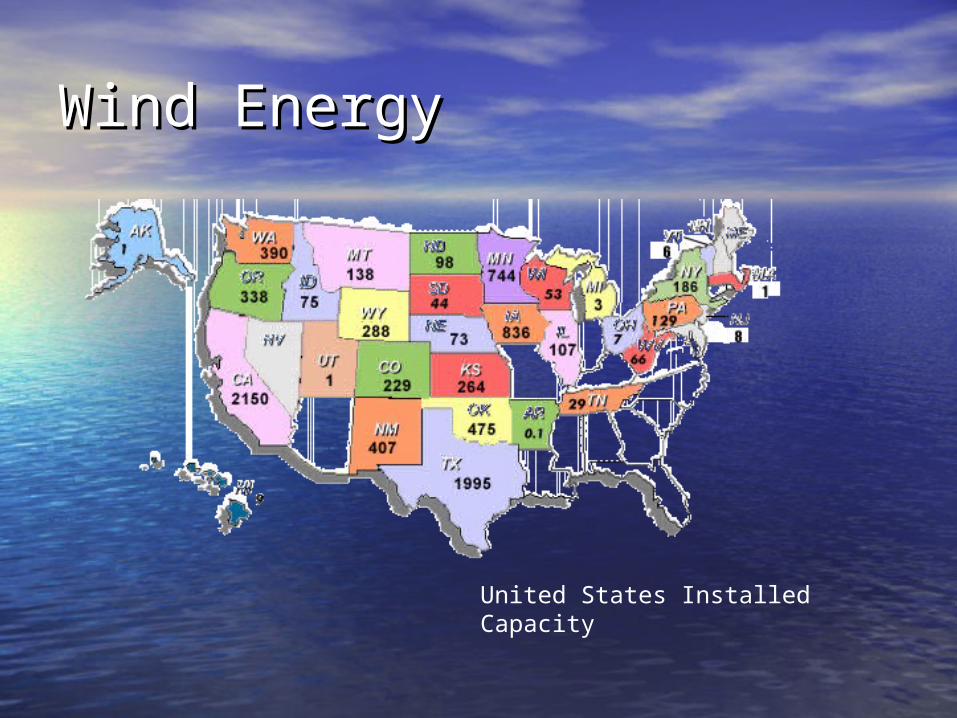
Wind EnergyWind Energy
United States Installed Capacity

Wind EnergyWind Energy
Alaska Wind Energy Development
Existing Project or Area
Owner Date Online
MW Power Purchaser/User
Turbine /Units
1. Kotzebue Kotzebue Electric Assoc.(KEA)
1997 0.15 Kotzebue Electric Assoc. Atlantic Orient (3)
St. Paul Island Tanadgusix Corp. March 1999
0.225 Tanadgusix Corp. Vestas (1)
1. Kotzebue(Phases II and III)
Kotzebue Electric Assoc. May 1999 0.35 Kotzebue Electric Assoc. Atlantic Orient 15/50 (7)
Wales Wind Energy Project
Kotzebue Electric Assoc. Oct 2000 0.1 Alaska Village Electric Coop
Atlantic Orient 15/50 (2)
1. Kotzebue Kotzebue Elec. Assoc. 2002 0.1 Kotzebue Elec. Assoc. NPS Northwind 100 (1)
Selawik Wind Project Kotzebue Electric Assoc. 2003 0.2 Alaska Village Electric Coop
AOC 15/50 (4)
Selawik Wind Project KEA/ Alaska Village Electric Coop
2004 0.15 Alaska Village Electric Coop
AOC 15/50 (3)
Kotzebue Wind Project Alaska Village Elec Coop 2005 0.3 Alaska Village Elec Coop Northern Power Systems 100 kW (3)
1.6 MW
Alaska Installed Capacity

What Can We Do?What Can We Do?


![Resid Vectors[1]](https://static.documents.pub/doc/80x56/577d2aac1a28ab4e1ea9c7c5/resid-vectors1.jpg)


