Holtz/Kowasch/Hasenkamp (eds.): Region in Transition Bertram: Sovereignty and Material Welfare 391 Sovereignty and Material Welfare in Small Island Jurisdictions Geoff Bertram Abstract: Across the world’s small island economies, sovereign independent political status is negatively associated with present-day per capita income. Does this reflect a causal link whereby political sovereignty has held development back since decolonisation, or does it indicate the persistence of pre-decolonisation differentials? If the latter, is there any reason why poorer colonies might have tended to end up independent while richer ones tended to remain non-sovereign? These issues are explored in this paper by inspecting time-series data on income, life expectancy, and imports for small islands that identified by the UN General Assembly in the 1940s as candidates for decolonisation. Data at this stage of the research programme are still very incomplete and the results are inconclusive, but suggest three hypotheses for future work. First, sovereign and non-sovereign island economies appear to have had the same growth rates of income since 1970. Second, there may have been a period up to 2000 when non-sovereigns outperformed sovereigns, followed by a period in which the pattern was reversed. Third, longer-run data back to the 1940s seems to indicate persistent differentials of income and imports but convergence of life expectancy (and potentially, therefore, other social and health indicators). No generalised development- related reasons to change the political status quo have been identified at this stage of what is an ongoing research programme, leaving political status a matter to be determined by the non-economic specifics of particular cases. Keywords: non/sovereign jusridictions, decolonisation, per-capita income
Transcript
Holtz/Kowasch/Hasenkamp (eds.): Region in Transition
Bertram: Sovereignty and Material Welfare 391
Sovereignty and Material Welfare
in Small Island Jurisdictions
Geoff Bertram
Abstract: Across the world’s small island economies, sovereign independent
political status is negatively associated with present-day per capita income.
Does this reflect a causal link whereby political sovereignty has held
development back since decolonisation, or does it indicate the persistence of
pre-decolonisation differentials? If the latter, is there any reason why poorer
colonies might have tended to end up independent while richer ones tended to
remain non-sovereign? These issues are explored in this paper by inspecting
time-series data on income, life expectancy, and imports for small islands that
identified by the UN General Assembly in the 1940s as candidates for
decolonisation. Data at this stage of the research programme are still very
incomplete and the results are inconclusive, but suggest three hypotheses for
future work. First, sovereign and non-sovereign island economies appear to
have had the same growth rates of income since 1970. Second, there may
have been a period up to 2000 when non-sovereigns outperformed
sovereigns, followed by a period in which the pattern was reversed. Third,
longer-run data back to the 1940s seems to indicate persistent differentials of
income and imports but convergence of life expectancy (and potentially,
therefore, other social and health indicators). No generalised development-
related reasons to change the political status quo have been identified at this
stage of what is an ongoing research programme, leaving political status a
matter to be determined by the non-economic specifics of particular cases.
Keywords: non/sovereign jusridictions, decolonisation, per-capita income
Holtz/Kowasch/Hasenkamp (eds.): Region in Transition
392 Bertram: Sovereignty and Material Welfare
Introduction
Small islands have special interest for social scientists because of the way
they throw up surprises that remind us of the limitations of common
assumptions and theories. My own initial encounter with small-island reality
was in 1979 in Tuvalu, then a newly-independent country of 8,000 people,
with effectively no export earnings other than philatelic revenue from the sale
of stamps issued by the new government to collectors around the world.
Before arriving there I was inclined to think of both the enterprise of
sovereign independence, and the prospect of achieving any standard of living
above the subsistence provided by local village agriculture and fishing, as
‘unsustainable’ – a favourite economists’ term for things that seem to defy
gravity but nonetheless manage to continue.
Within an hour of stepping off the plane I had abandoned those
preconceptions and had begun to appreciate how a very small - but ethnically
and culturally close-knit – community could achieve things that much larger
countries around the developing world were struggling to manage. With a
seat in the UN General Assembly, and a diplomatic presence that was obvious
to anyone watching the 2009 world climate-change summit in Copenhagen,
Tuvalu confounds conventional wisdom in both its politics and its economy.
Three pillars of development ‘conventional wisdom’ have come under threat
from the empirical record in small island economies. The three are:
The view that developmental success in a small open economy (that
is, an economy that is exposed to global markets) requires strong
export performance to sustain material standards of living
Holtz/Kowasch/Hasenkamp (eds.): Region in Transition
Bertram: Sovereignty and Material Welfare 393
The presumption that there are crucial economies of scope and scale
in economic development (implying that very small economic units
are at a developmental disadvantage)
The proposition that sovereign independent statehood is positively
related to the achievement of gains in material welfare for the
population
In research over the past three decades I and a number of other scholars
around the world have worked our way down that list, using data on a
widening set of small islands. At each stage the key insights have come from
confronting conventional wisdom with the empirical evidence, and finding
the former wanting. Export-led growth is not necessary for achieving
prosperity; smallness is not inherently a drag on prosperity; and sovereign
independence, which potentially limits development options and imposes
large cost burdens not faced by sub-national island jurisdictions, is not
associated with any clear economic advantage – rather the opposite. This
paper summarises these research findings before reporting some new data on
the relationship between decolonisation and material welfare.
Growth need not be export led
The first pillar to fall was the supposed importance of exporting success.
The MIRAB model1 (Bertram and Watters 1985; Bertram 1986, 1993, 1998)
was developed to explain the obvious dominance of import-led development
across much of the small-island Pacific, with balance-of-payments figures
showing very large trade deficits which persisted for decades without
1 The initials stand for MIgration, Remittances, Aid and Bureaucracy (see also Tisdell in this volume).
Holtz/Kowasch/Hasenkamp (eds.): Region in Transition
394 Bertram: Sovereignty and Material Welfare
triggering signs of economic stress such as rising indebtedness. In an earlier
publication I demonstrated the goods and services balances of seventeen
Pacific economies over the period 1975-2004 (see Bertram 2013:329; Figure
27.1).
In MIRAB economies, the imports that sustain islanders’ standards of
living are financed from a combination of migrant remittances and official aid
transfers. Since the original MIRAB work was published, two other general
small-island development strategies have been recognised as enabling trade
deficits to be sustainably financed. One of these is tourism, whose rapid rise
in both tropical and cold-water island destinations has been documented and
analysed by Baldacchino (2006), McElroy (2006), McElroy and Parry (2010),
McElroy and Hamma (2010), and Milne (1992). The other is the exploitation
of niches of jurisdictional opportunity in a globalising world – what
Baldacchino (2004) has labelled the ‘PROFIT’ strategy based on “the
resourcefulness of jurisdiction” (Baldacchino/Milne 2000) – involving a wide
range of leading sectors: offshore financial centres and tax havens (Shaxson
2011), rentals from foreign-controlled fishery and mineral activities in
expanded exclusive economic zones, provision of strategic geopolitical
services including military bases and weapons testing (see Poirine 1995;
Drezner 2001; Baldacchino 2006b). The resulting three-way classification of
development paths into MIRAB, SITE and PROFIT models, with export-led
growth merely a subset of the PROFIT group, is summarised in Bertram
(2006) and Baldacchino and Bertram (2009, from which figure 1 has been
reproduced). A more detailed classification by Bertram and Poirine (2007:
Table 8 and Figure 12, 353-364) identified nine developmental paths across
80 small island economies, with export-led growth being only one of the nine.
Holtz/Kowasch/Hasenkamp (eds.): Region in Transition
Bertram: Sovereignty and Material Welfare 395
Figure 1: A three-fold taxonomy of small-island economies
Source: Baldacchino and Bertram (2009:152, figure 1)
Smallness is not a handicap
There is a strong school of thought that regards small countries as
inherently vulnerable simply on account of their size (Briguglio 1995;
Streeten 1993) but this “vulnerability paradigm” does not perform well
empirically (Baldacchino/Bertram 2009:146-148). Vulnerability as measured
by its proponents has turned out to be positively, not negatively, related to
income per capita (Armstrong et al 1998; Easterly/Kraay 2002; Sampson
2005). Small islands, rather, seem characterised by strategic flexibility, with
MIRAB: Cape Verde Comoros Dominica Haiti Kiribati Marshall Islands Mayotte Micronesia Montserrat Samoa Sao Tome & Prinicipe St Pierre et Miquelon Tokelau Tonga Tuvalu Wallis & Futuna
MIRAB/SITE: French Polynesia, Guadeloupe, Martinique, Palau, Pitcairn, Reunion
SITE/PROFIT: Anguilla Antigua & Barbados Aruba Bahamas Barbados Bermuda British Virgin Islands Cayman Islands Cyprus Fiji, Grenada Maledives Malta Marianas Seychelles St Kitts & Nevis St Lucia St Vincent & Grenadines US Virgin Islands Vanuatu
PROFIT: America Samoa, Bahrain, Falklands, Faroes, Guernsey, Iceland, Isle of Man, Jersey, Mauritius
MIRAB/PROFIT: Greenland, Nauru, New Caledonia, Solomon Islands, St Helena
MIRABs SITEs
PROFITs
Holtz/Kowasch/Hasenkamp (eds.): Region in Transition
396 Bertram: Sovereignty and Material Welfare
non-sovereign island jurisdictions leading the way (Baldacchino/Bertram
2009). Work by numerous researchers since 1990 has focused on the
relatively strong development performance of very small, often island,
economies relative to larger entities – a finding that throws doubt on the
extent to which diseconomies of scale and scope necessarily constrain
material welfare. Table 1 shows the top fifteen economies in the world on the
basis of Gross National Income (GNI) per capita in 2007, according to the
World Bank’s development indicators. The list includes five very small
countries (less than 100,000 population), and three island economies, two of
them very small ones. The World Development Indicators lack data on many
Table 1: World Bank Development Indicators Top Fifteen
GNI per capita Population
Monaco 161.470 35.013
Bermuda 117.640 64.888
Liechtenstein 111.790 35.308
Luxembourg 79.670 479.993
Norway 76.950 4.709.153
Qatar 63.440 1.152.459
Switzerland 59.040 7.551.117
Iceland 58.780 311.566
Denmark 54.700 5.461.438
Ireland 49.150 4.356.931
Sweden 48.900 9.148.092
United States 48.640 301.231.207
Isle of Man 48.550 81.812
San Marino 46.880 30.377
Netherlands 46.310 16.381.696
Source: http://data.worldbank.org/indicator/NY.GNP.PCAP.CD/countries?page=1&display=default and
http://data.worldbank.org/indicator/SP.POP.TOTL?page=1 (23 January 2014).
Holtz/Kowasch/Hasenkamp (eds.): Region in Transition
Bertram: Sovereignty and Material Welfare 397
of the smallest island economies several of which (such as Aruba, Sint
Maarten, Cayman Islands, US Virgin Islands) belong among the world’s
highest-income economies. In short, at the very small end of the size
spectrum we encounter the world’s richest economies in terms of GNI per
capita. As Easterly and Kraay conclude (2002:2015), “if we control for the
location by continent of all countries, whether they are oil producers, and
whether they belong to the OECD, then small states are actually significantly
richer than other states”. Diseconomies of scale and scope due to small size
have not proved crippling.
Sovereign independence has not been a developmental advantage
A by-product of the statistical work on size and income was the
explanatory power of political status in relation to modern income levels.
Many small island jurisdictions are sub-national jurisdictions within larger
metropolitan economies, rather than sovereign independent nation states.
Intuitively it seems quite probable that in very small units, there would be
diseconomies of scope and scale in running a full-service government, and
that this might be expected to be a drag on economic performance. In other
words, non-sovereign jurisdictions are able to ‘travel light’ in terms of the
resources that have to be allocated to operating the public sector. This
intuition runs counter to the strong belief among world opinion leaders in the
second half of the twentieth century that liberation of a people from ‘colonial
rule’ should unleash creative and productive potential, and enable a greater
share of the economic surplus to be retained to finance development. Given
that some trade-offs can be expected, the issue is ultimately an empirical one.
Strong statistical evidence that, among small economies at least, non-
sovereign status is positively related to the level of per capita GDP, was
Holtz/Kowasch/Hasenkamp (eds.): Region in Transition
398 Bertram: Sovereignty and Material Welfare
found by Armstrong et al. (1998), Armstrong and Read (2000, 2002), Bertram
(2004), McElroy and Pearce (2006), McElroy and Parry (2012) and Sampson
(2005:7). Sampson found, however, no significant effect of sovereignty status
on the growth rate, and a negative effect on growth of being a small state after
controlling for sovereignty. Higher incomes today, in other words, may be
explained by past, not current, economic prosperity. If so, it may be that
during the decolonisation era there was a tendency for poorer colonies to
become independent and for richer ones to remain non-sovereign; if that were
to be the case, then causality could run from relative wealth to political status,
not from political status to relative wealth. This question is central to the
present paper.
Bertram (1986) reviewed the various options for decolonisation -
sovereign independence, integration with another state, self-government in
free association, and possible unspecified other options – and argued that
sovereign independence was likely to be an inferior option for very small
islands. In later statistical work on small islands Bertram (2004) estimated
that integrated political status added between $5,600 and $7,500 in US dollars
to per capita income, relative to sovereign independence. He concluded that
sovereignty operates as a tax on material welfare, and hypothesised that non-
sovereign political status confers advantages in political-economy terms
because by being integrated with a larger, usually richer, economy, a small
island community can secure more favourable treatment in terms of financial
aid, migration access, other market access, and ability to leverage off some
functions of large-country government services such as education and health.
Poirine (1999) demonstrated that in the 1990s not only did island
economies in general receive more aid per capita than larger, non-island
Holtz/Kowasch/Hasenkamp (eds.): Region in Transition
Bertram: Sovereignty and Material Welfare 399
countries, but that non-sovereign islands secured 36 times more bilateral aid
than comparable sovereign independent island states.
All of these studies essentially used modern-day cross-section
comparisons of income levels across countries, with regression analysis based
on panel data, to draw the conclusion that non-sovereignty seemed to pay off.
What was lacking in that first generation of research was engagement with
the long-run historical determinants of modern political and economic
outcomes. As the wider development literature is giving increasing attention
to economic history and especially to the long-run impacts of colonialism and
biogeography on the modern world, it is time to gather more historical
material together.
A 2009 statistical exercise by Feyer and Sacerdote investigated the long-
term effects of colonialism across a sample of 81 islands. Most of their paper
was concerned with finding an instrumental variable for date of colonisation,
which they hypothesised was an important determinant of modern income
levels (they used wind direction because most European colonisation of small
islands took place in the age of sailing ships, which meant that the
geographical intensity of search and discovery was influenced by prevailing
winds). But their data set showed a pattern that ran against the conventional
wisdom on decolonisation: the number of centuries an island economy had
been a colony was positively, not negatively, related to modern per capita
income (Feyrer/Sacerdote 2009: Figure 1, 251). They commented (ibid.:248)
that “there is a robust positive relationship between colonial tenure and
modern outcomes. The obvious question is why? More intensive involvement
with Europeans or longer colonial rule might have left islands with a more
stable or better structured government. This theory is most associated with
Holtz/Kowasch/Hasenkamp (eds.): Region in Transition
400 Bertram: Sovereignty and Material Welfare
Acemoglu, Johnson, and Robinson… Unfortunately, it is not easy to identify
which governmental institutions are the most critical, and measuring
institutional quality is extremely difficult. Furthermore, even if we had a
modern index of say, expropriation risk or corruption for these islands, one
might worry that good modern institutions were caused by high incomes
rather than the other way around. We offer two partial (and admittedly
imperfect) solutions to this conundrum.”
The answers tested were who was the coloniser, and when did
colonisation occur? Along the way, their econometric work included the end
date of colonialism in each case as well as the initial date, which meant that
they had a set of cases in their sample (the modern non-sovereigns) with no
end date. Their regression that included this information threw up the finding
that “(b)eing a colony at the end of the twentieth century remains very
positively associated with income [even though] [c]onditional on making it to
the end of the century as a colony, years as a colony in the twentieth century
are negatively associated with income” (ibid.).
Decolonisation options
By “remaining a colony”, Feyrer and Sacerdote (2009) meant being
subordinated to a larger metropolitan power. But this misconstrues the issue.
Decolonisation does not necessarily have to consist of moving to a sovereign
independent nation state, and sub-national status is not synonymous with
colonial status. On the contrary, small islands have been the laboratory for
exploring various ways of exiting from the colonial era, and sub-national
status in the early twenty-first century is fully compatible with the genuine
exercise of autonomous local agency in economic and social development, as
Holtz/Kowasch/Hasenkamp (eds.): Region in Transition
Bertram: Sovereignty and Material Welfare 401
Godfrey Baldacchino and I have been arguing (Baldacchino/Bertram 2009).
The confusion of sub-national jurisdictions with ‘colonies’ may be
understandable given the pro-independence rhetoric of the United Nations
Committee on Decolonisation over the past half-century, but misses the point
that the test of decolonisation laid down by UN Resolution 1514 (December
1960) was not sovereign independence but simply “a full measure of self-
government”, which could be consistent with “integration with an
independent State” or “free association with an independent state”, as viable
post-colonial alternatives to sovereign independence. The real issue is the
extent of local autonomy, agency and initiative. Decolonisation in a sub-
national context is a change in degree rather than in kind on these dimensions.
Decolonisation was one of the great historical transformations of the mid-
twentieth century in Asia and Africa, but it is often overlooked that in the
Americas there was a similar political upheaval in the years 1775 to 1825, as
a colonial order established on the North and South American continents by
Britain, Spain, Portugal and France was supplanted by a swarm of new
sovereign nation states. The dominant process then, as in twentieth century
decolonisation, was the installation of sovereign national governments in
place of the colonial administrators among the large nations of the two
continents. But foreshadowing twentieth-century experience, the sovereign-
independence model ran aground in the small islands of the Caribbean. There
is a striking contrast between the continental American drive to sovereign
national independence and the survival of colonial rule in the islands of the
Caribbean.
Only in relatively-large Haiti did an independent nation state emerge,
following a slave revolt (related to the Revolution in the metropolitan power,
Holtz/Kowasch/Hasenkamp (eds.): Region in Transition
402 Bertram: Sovereignty and Material Welfare
France) that displaced the previous ruling groups. In much of the Caribbean
the continuation of colonial rule was favoured by the ruling slave-owning
elites, reinforced by the superior military power the colonial powers could
wield against small territories. No genuinely indigenous population or culture
had survived from pre-colonial times to provide a basis for self-conscious
national identity, and the transition out of slavery helped to defuse political
activism amongst the black populations.
Effectively, the social contract that developed was one in which the elites
controlling the Caribbean islands threw in their lot with the metropolitan
colonial powers as a matter of straightforward self-interest. Over time the
range of groups that benefited from holding onto the colonial relationship
encompassed a growing proportion of the islander population, especially in
the British, French and Dutch Caribbean. Eventually this provided the basis
for the great post-World War II burst of West Indian migration to Britain:
between 1948 and 1970 about half a million people moved, out of a
population in the British West Indies of 3-4 million – about 15% out-
migration. When decolonisation finally got underway in the Caribbean in the
1950s and 1960s, a substantial number of the island territories turned down
the option of sovereign nationhood and opted instead for sub-national status.
Bermuda, Anguilla, the British Virgin Islands, the Cayman Islands, and the
Netherland Antilles including Aruba, joined Puerto Rico and the US Virgin
Islands (see below) as post-colonial sub-national jurisdictions in the region.
Meantime Spanish colonial rule in the Caribbean had been broken not by
popular resistance but by the USA in its 1898 war with Spain, the outcome of
which was one nation state (Cuba) and one sub-national jurisdiction (Puerto
Rico) which has remained non-sovereign since and has become increasingly
Holtz/Kowasch/Hasenkamp (eds.): Region in Transition
Bertram: Sovereignty and Material Welfare 403
closely linked into the US economy. The USA subsequently moved on to buy
the US Virgin Islands from Denmark in 1917; these are still an
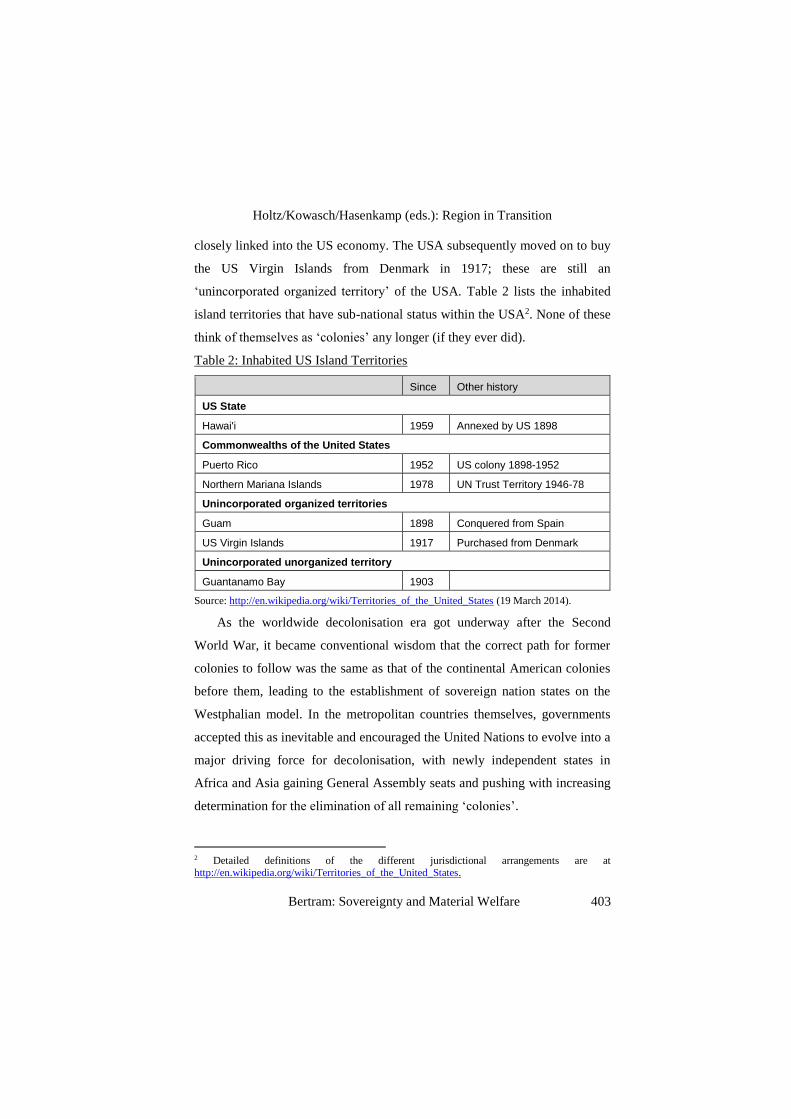
‘unincorporated organized territory’ of the USA. Table 2 lists the inhabited
island territories that have sub-national status within the USA2. None of these
think of themselves as ‘colonies’ any longer (if they ever did).
Table 2: Inhabited US Island Territories
Since Other history
US State
Hawai'i 1959 Annexed by US 1898
Commonwealths of the United States
Puerto Rico 1952 US colony 1898-1952
Northern Mariana Islands 1978 UN Trust Territory 1946-78
Unincorporated organized territories
Guam 1898 Conquered from Spain
US Virgin Islands 1917 Purchased from Denmark
Unincorporated unorganized territory
Guantanamo Bay 1903
Source: http://en.wikipedia.org/wiki/Territories_of_the_United_States (19 March 2014).
As the worldwide decolonisation era got underway after the Second
World War, it became conventional wisdom that the correct path for former
colonies to follow was the same as that of the continental American colonies
before them, leading to the establishment of sovereign nation states on the
Westphalian model. In the metropolitan countries themselves, governments
accepted this as inevitable and encouraged the United Nations to evolve into a
major driving force for decolonisation, with newly independent states in
Africa and Asia gaining General Assembly seats and pushing with increasing
determination for the elimination of all remaining ‘colonies’.
2 Detailed definitions of the different jurisdictional arrangements are at http://en.wikipedia.org/wiki/Territories_of_the_United_States.
Holtz/Kowasch/Hasenkamp (eds.): Region in Transition
Bertram: Sovereignty and Material Welfare 407
natural experiment in the economic effects of alternative trajectories. Similar
work to this, with a substantial data set for the most recent decades, is in
McElroy and Parry (2012). Chapter XI of the United Nations Charter contains
a ‘Declaration Regarding Non-Self-Governing Territories’, within which
Article 73 requires the administering powers of non-self-governing territories
to “transmit regularly to the Secretary-General for information purposes,
subject to such limitation as security and constitutional considerations may
require, statistical and other information of a technical nature relating to
economic, social, and educational conditions in the territories for which they
are respectively responsible…”
This placed a reporting requirement on administering powers which put
their performance under an international spotlight. Reporting obligations also
applied to states administering UN mandates or trusts over non-self-
governing territories captured during the two World Wars, under Chapter XII
of the Charter. In 1946 the eight ‘administering powers’3 submitted a list of
74 territories under their control which were to be subject to Chapter XI4. In
addition, under Chapter XII of the Charter eleven territories were listed as
trust territories5. Subsequent additions to the UN’s list of non-self-governing
territories brought the total up to 97 entities6, of which 36 are islands or
groups of islands with populations under 5 million. In terms of the current
world political map these 36 entities comprise 61 individual islands or
3 Australia, Belgium, Denmark, France, the Netherlands, New Zealand, the United Kingdom and
the United States. Notably missing was Portugal, whose dependent territories were not included in the UN list until 1963. 4 The list can be found in General Assembly Resolution 66(1) ‘Transmission of information
under Article 73e of the Charter’, 9 February 1946, at http://daccess-ods.un.org/TMP/3443695.60480118.html (accessed 27 January 2014). 5 These are described at http://www.un.org/en/decolonization/its.shtml and listed at
http://www.un.org/en/decolonization/selfdet.shtml (both accessed 27 January 2014). 6 Listed at http://www.un.org/en/decolonization/nonselfgov.shtml (accessed 27 January 2014).
Holtz/Kowasch/Hasenkamp (eds.): Region in Transition
408 Bertram: Sovereignty and Material Welfare
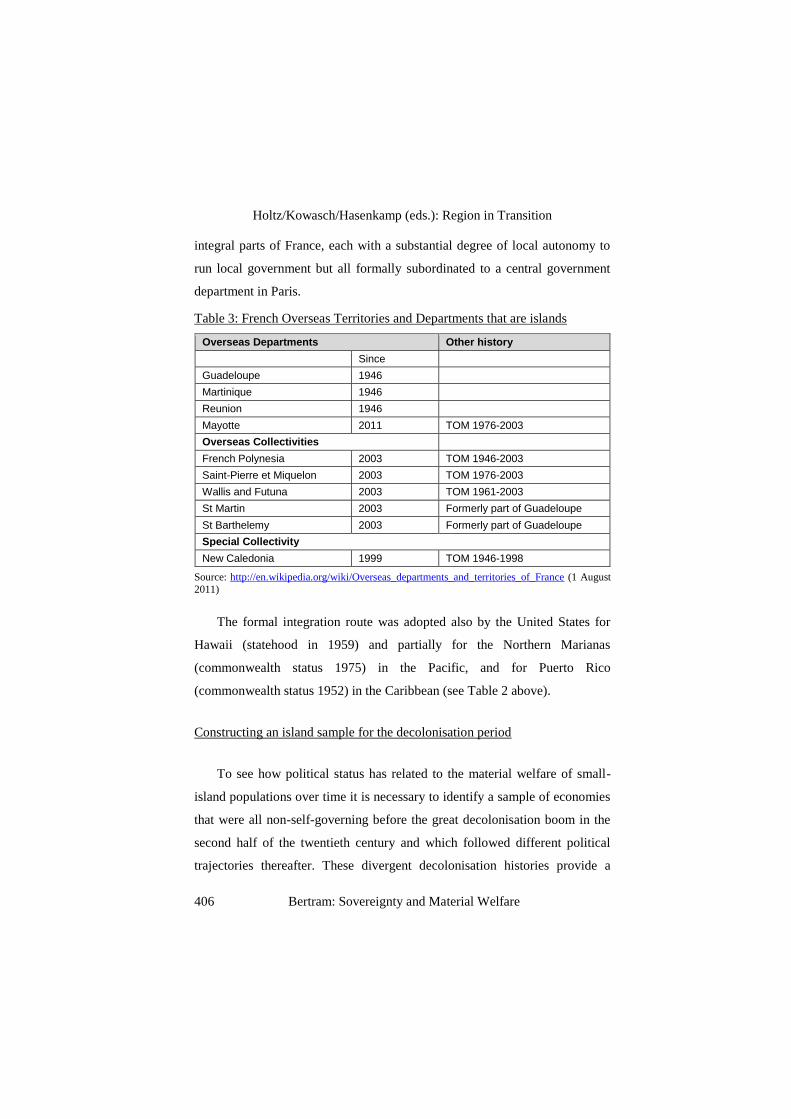
closely-linked archipelagos, as shown in Table 4 (see next page), or 57 if the
Netherlands Antilles except for Aruba are treated as an entity. These islands
provide the sample for the statistical comparisons that follow.7 The research
programme, from which this chapter gives some early results, takes the small
island countries in Table 4 as a representative sample of candidates for
‘decolonisation’ after the Second World War, divides them between those
that (as of 2012) have moved to become sovereign states and those that have
become sub-national island jurisdictions (SNIJs), and then compares the two
groups over time on indicators such as population, income per head, life
expectancy, early childhood mortality, and imports per head.
Decolonisation outcomes and economic trajectories
A preliminary question is whether, among the 61 islands in Table 4, it
was the small ones that became sub-national and the large ones that became
sovereign. Figure 2 shows the pattern across the sample. A tendency for non-
sovereign status to be more common among very small units is suggested,
and possibly some tendency for sovereign status to be more common in the
population range 500,000 - 1 million, but there is no statistically significant
conclusion to be drawn. The average population of sovereigns in the sample
is 437,500 and that of non-sovereigns is 243,300 but the standard deviations
in both cases are bigger than the means.
7 Sources: Islands list compiled from http://www.un.org/en/decolonization/nonselfgov.shtml, plus
the 1946 list at http://www.statehoodhawaii.org/hist/nsgt.html and UN Resolution 66(1) 9
February 1946 at http://daccess-ods.un.org/TMP/3443695.60480118.html (all accessed January 2014). Population from UN Demographic Yearbook 2012 Table 5 at
http://unstats.un.org/unsd/demographic/products/dyb/dyb2012.htm, accessed January 2014, with
gaps filled using Wikipedia entries for individual islands. WDI income data from World Bank, World Development Indicators, http://wdi.worldbank.org/table/1.1#, accessed 29 January 2014.
UN income data from http://unstats.un.org/unsd/snaama/resQuery.asp, accessed 29 January 2014.
CIA income data from https://www.cia.gov/library/publications/the-world-factbook/rankorder/ 2004rank.html accessed 29 January 2014.
Holtz/Kowasch/Hasenkamp (eds.): Region in Transition
Bertram: Sovereignty and Material Welfare 409
Table 4: Islands that were listed as ‘non-self-governing territories’ or ‘trust
territories’ by the UN at some time since 1946
Isla
nd
terr
ito
ry a
t 1946
Co
mp
on
en
t is
lan
ds
Me
tro
po
lita
n p
ow
er
Po
liti
cal S
tatu
s a
t 2012
Po
pu
lati
on
2010 P
er
cap
ita
inc
om
e a
t 2012
acco
rdin
g t
o
thre
e
da
tab
ases
WD
I 2012
UN
S
tati
sti
cal
Div
isio
n
CIA
Wo
rld
Fa
ctb
oo
k
American Samoa American Samoa
USA SNIJ8 66,000
8,000
Bahamas Bahamas UK Sovereign 346,900 20,600 21,102 31,300
Barbados Barbados UK Sovereign 276,302 15,080 14,739 25,000
Bermuda Bermuda UK SNIJ 64,566 104,590 105,171 86,000
Cape Verde Cape Verde Portugal Sovereign 517,831 3,830 3,731 4,400
Cocos (Keeling) Islands
Cocos (Keeling) Islands
Australia SNIJ 600
Cook Islands
Cook Islands
New Zealand
SNIJ 23,600
14,918 9,100
Niue New Zealand
SNIJ 1,496
5,800
Cyprus Cyprus UK Sovereign 827,697 26,110 25,580 26,800
Fiji Fiji UK Sovereign 857,000 4,110 4,507 4,700
French Establishments in Oceania
French Polynesia
France SNIJ 268,500
26,113 22,000
Wallis and Futuna
France SNIJ 15,000
3,800
Greenland Greenland Denmark SNIJ 56,534
40,303 37,400
Guadeloupe Guadeloupe France SNIJ 401,784
Hawaii Hawaii USA SNIJ 1,360,301
High Commission Territories of the Western Pacific
Kiribati UK Sovereign 100,000 2,520 2,077 6,200
Tuvalu UK Sovereign 10,924 5,650 7,051 3,400
Solomon Islands
UK Sovereign 530,669 1,130 1,543 3,300
Pitcairn UK SNIJ 58
Jamaica
Jamaica UK Sovereign 2,702,310 5,120 5,187 8,900
Cayman Islands
UK SNIJ 54,878
53,393
8 SNIJ = sub-national island jurisdictions.
Holtz/Kowasch/Hasenkamp (eds.): Region in Transition
410 Bertram: Sovereignty and Material Welfare
Isla
nd
terr
ito
ry a
t 1946
Co
mp
on
en
t is
lan
ds
Me
tro
po
lita
n p
ow
er
Po
liti
cal S
tatu
s a
t 2012
Po
pu
lati
on
2010
Per
cap
ita
inc
om
e a
t 2012
acco
rdin
g t
o
thre
e
da
tab
ases
WD
I 2012
UN
Sta
tisti
cal
Div
isio
n
CIA
Wo
rld
Fa
ctb
oo
k
Leeward Islands
Antigua and Barbuda
UK Sovereign 90,801 12,480 12,740 17,800
British Virgin Islands
UK SNIJ 21,689
29,436 42,300
Montserrat UK SNIJ 5,020
12,049 8,500
St Kitts & Nevis
UK Sovereign 51,970 13,610 13,777 16,100
Anguilla UK SNIJ 16,373
19,895 12,200
Madagascar and dependencies
Mayotte France SNIJ 212,645
Comoros France Sovereign 798,000 840 830 1,300
Malta Malta UK Sovereign 415,275 19,760 19,265 26,900
Martinique Martinique France SNIJ 396,308
Mauritius Mauritius UK Sovereign 1,280,924 8,570 9,337 15,400
Nauru Nauru Australia Sovereign 9,378
12,577 5,000
New Caledonia and dependencies
New Caledonia
France SNIJ 250,040
38,869 37,700
New Hebrides Vanuatu France & UK
Sovereign 221,417 3,000 2,869 4,800
Netherlands Antilles
Aruba Netherlands SNIJ 101,860
23,367 25,300
Bonaire Netherlands SNIJ 14,006
18,168
Curacao
15,000
Sint Maarten
Netherlands SNIJ 917
18,168 15.400
Saba Netherlands SNIJ 1,991
18,168
Sint Eustacius
Netherlands SNIJ 3,543
18,168
Puerto Rico Puerto Rico USA SNIJ 3,721,208 18,000 18,634 16,300
Pacific Islands Trust Territories
Marshall Islands
USA SNIJ 54,305 4,040 4,748 8,600
Federated States of Micronesia
USA Sovereign 107,839 3,230 3,317 7,100
Palau USA Sovereign 21,388 9,860 8,853 10,500
Northern Marianas
USA SNIJ 48,317
13,600
Holtz/Kowasch/Hasenkamp (eds.): Region in Transition
Bertram: Sovereignty and Material Welfare 411
Isla
nd
terr
ito
ry a
t 1946
Co
mp
on
en
t is
lan
ds
Me
tro
po
lita
n p
ow
er
Po
liti
cal S
tatu
s a
t 2012
Po
pu
lati
on
2010 P
er
cap
ita
inc
om
e a
t 2012
acco
rdin
g t
o
thre
e
da
tab
ases
WD
I 2012
UN
S
tati
sti
cal
Div
isio
n
CIA
Wo
rld
Fa
ctb
oo
k
Reunion Reunion France SNIJ 828,054
Samoa Samoa New Zealand
Sovereign 184,032 3,260 3,436 6,200
Sao Tome and Principe
Sao Tome and Principe
Portugal Sovereign 163,783
1,397 2,100
Seychelles Seychelles UK Sovereign 89,770 12,260 10,198 25,000
St. Pierre and Miquelon
St. Pierre and Miquelon
France SNIJ 6,080
34,900
St Helena and dependencies
St Helena UK SNIJ 4,250
7,800
Tristan da Cunha
UK SNIJ 263
7,800
Ascension UK SNIJ 702
7,800
Tokelau Islands Tokelau New Zealand
SNIJ 1,400
1,000
Trinidad and Tobago
Trinidad and Tobago
UK Sovereign 1,317,714 14,710 18,067 19,800
US Virgin Islands US Virgin Islands
USA SNIJ 110,000
14,500
Windward Islands
Dominica UK Sovereign 69,017 6,440 6,710 14,000
Grenada UK Sovereign 110,821 7,220 6,989 13,500
St Lucia UK Sovereign 172,370 6,890 7,204 13,000
St Vincent and the Grenadines
UK Sovereign 100,892 6,400 6,314 11,800
In fact the key conclusion to be drawn from Figure 2 is that the choice of
political status has been wide open across the size range of the sample. A
second point to emerge from the detail of Figure 2 is that the UK has been far
less amenable than France and the USA to conceding non-sovereign status for
its larger territories. The largest non-sovereign with the UK as its metropole is
Bermuda, with a population of 65,000; above this level all the islands that
were under UK rule in 1946 have moved through to sovereign independence.
Holtz/Kowasch/Hasenkamp (eds.): Region in Transition
412 Bertram: Sovereignty and Material Welfare
Figure 2: Political status and population size of small islands
Holtz/Kowasch/Hasenkamp (eds.): Region in Transition
Bertram: Sovereignty and Material Welfare 413
The next question to ask is how income per capita compares today after
half a century of divergent political evolution in the two sets of islands. A
major problem is data: the big international agencies which prepare consistent
national accounting measures across economies commonly do not collect and
publish figures for very small territories, especially if those territories are
non-sovereign (hence not members of the UN or the World Bank). Of the 61
island economies in Table 4, only 27 have their Gross National Income per
capita reported in the World Bank’s ‘World Development Indicators’ and
these are all sovereigns with the sole exception of Bermuda. The Penn World
Tables 6.3 covers none of the non-sovereign islands in the sample. The UN
Statistical Agency’s national accounts database has better coverage: 42 of the
61 islands in the sample, of which 26 are sovereigns and 16 are non-
sovereigns. The CIA World Factbook covers 50 of the 61 islands, comprising
26 sovereigns and 24 non-sovereigns, but is less methodologically rigorous
than the other international organisations. The reliability of the sources, in
fact, is inversely related to their coverage of non-sovereign territories, but
data availability prevails, for the moment, over strict rigour. Table 4 shows
the UN and CIA figures, and Figures 3 and 4 plot the data.
The impression given by both these charts (in common with the previous
literature reviewed above, which generally analyses data for territorial units
without adjusting for population size) - that non-sovereigns among the sample
tend to exhibit higher income levels than sovereigns today – could be
misleading if the charts have been biased by giving undue weight to a large
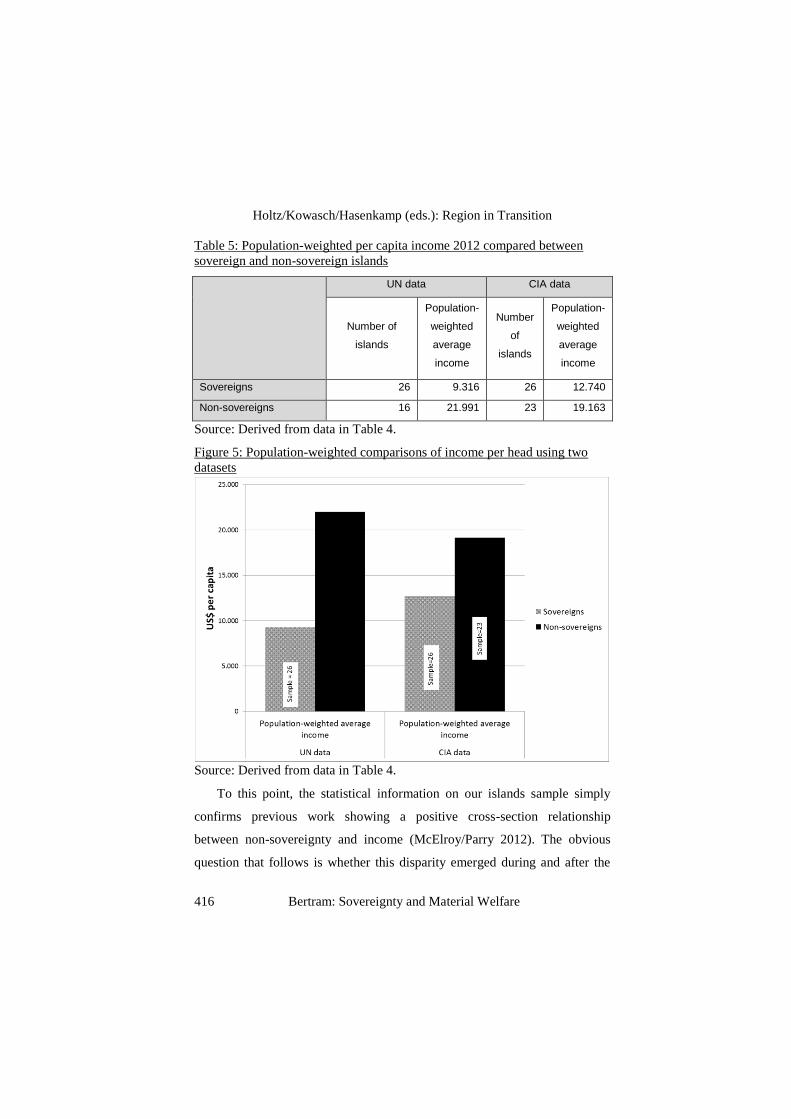
number of very small economies. Table 5 and Figure 5 show the comparison
of aggregated income per capita across all the sovereign island populations
and across the non-sovereigns. This population-weighted calculation confirms
the proposition that non-sovereigns have an advantage.
Holtz/Kowasch/Hasenkamp (eds.): Region in Transition
414 Bertram: Sovereignty and Material Welfare
Figure 3: Political status and income per head at 2012 according to the UN
Statistical Agency
Holtz/Kowasch/Hasenkamp (eds.): Region in Transition
Bertram: Sovereignty and Material Welfare 415
Figure 4: Political status and income per head at 2012 according to the CIA
World Factbook
Holtz/Kowasch/Hasenkamp (eds.): Region in Transition
416 Bertram: Sovereignty and Material Welfare
Table 5: Population-weighted per capita income 2012 compared between
sovereign and non-sovereign islands
UN data CIA data
Number of
islands
Population-
weighted
average
income
Number
of
islands
Population-
weighted
average
income
Sovereigns 26 9.316 26 12.740
Non-sovereigns 16 21.991 23 19.163
Source: Derived from data in Table 4.
Figure 5: Population-weighted comparisons of income per head using two
datasets
Source: Derived from data in Table 4.
To this point, the statistical information on our islands sample simply
confirms previous work showing a positive cross-section relationship
between non-sovereignty and income (McElroy/Parry 2012). The obvious
question that follows is whether this disparity emerged during and after the
Holtz/Kowasch/Hasenkamp (eds.): Region in Transition
Bertram: Sovereignty and Material Welfare 417
decolonisation process, or existed prior to decolonisation. For this, we require
either time series data going back to 1946, or at least a data set showing
income across the islands at 1946 or 1950, that would enable us to see
whether the modern income disparity was present or absent at the beginning
of decolonisation. Such income data is not at this stage available on a
worldwide basis.
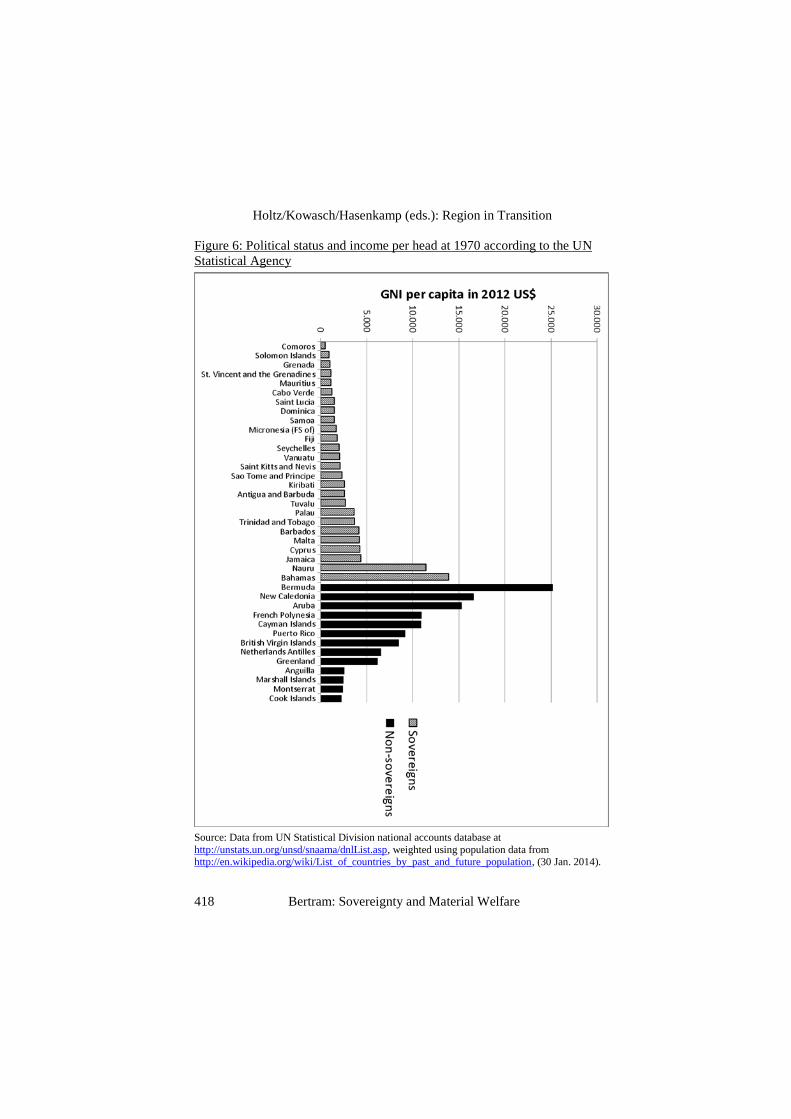
As a first step I have used the UN Statistical Division’s macroeconomic
database to trace per capita income over the 40-year period 1970-2010 for 26
of the sovereign islands in the sample and 13 of the non-sovereigns. For each
economy covered I take Gross National Income per capita in US dollars and
deflate to 2012 US dollars using the US GDP deflator. I then calculate the
population-weighted average per capita real GNI for the sovereigns and non-
sovereigns and plot the results at five-yearly intervals. The results of this
exercise are shown in Figures 6 and 7. In Figure 6, the 1970 distribution of
per capita income is plotted on the same basis as the 2012 distribution in
Figure 3 above, showing that the shape of the distribution hardly changed
over the 40 years, although the detailed ranking of individual economies has
changed, and the leading 1970 sovereign cases Bahamas and Nauru clearly
fell behind relative to the leading 2012 non-sovereigns Bermuda and the
Cayman Islands.
Holtz/Kowasch/Hasenkamp (eds.): Region in Transition
418 Bertram: Sovereignty and Material Welfare
Figure 6: Political status and income per head at 1970 according to the UN
Statistical Agency
Source: Data from UN Statistical Division national accounts database at
http://unstats.un.org/unsd/snaama/dnlList.asp, weighted using population data from http://en.wikipedia.org/wiki/List_of_countries_by_past_and_future_population, (30 Jan. 2014).
Holtz/Kowasch/Hasenkamp (eds.): Region in Transition
Bertram: Sovereignty and Material Welfare 419
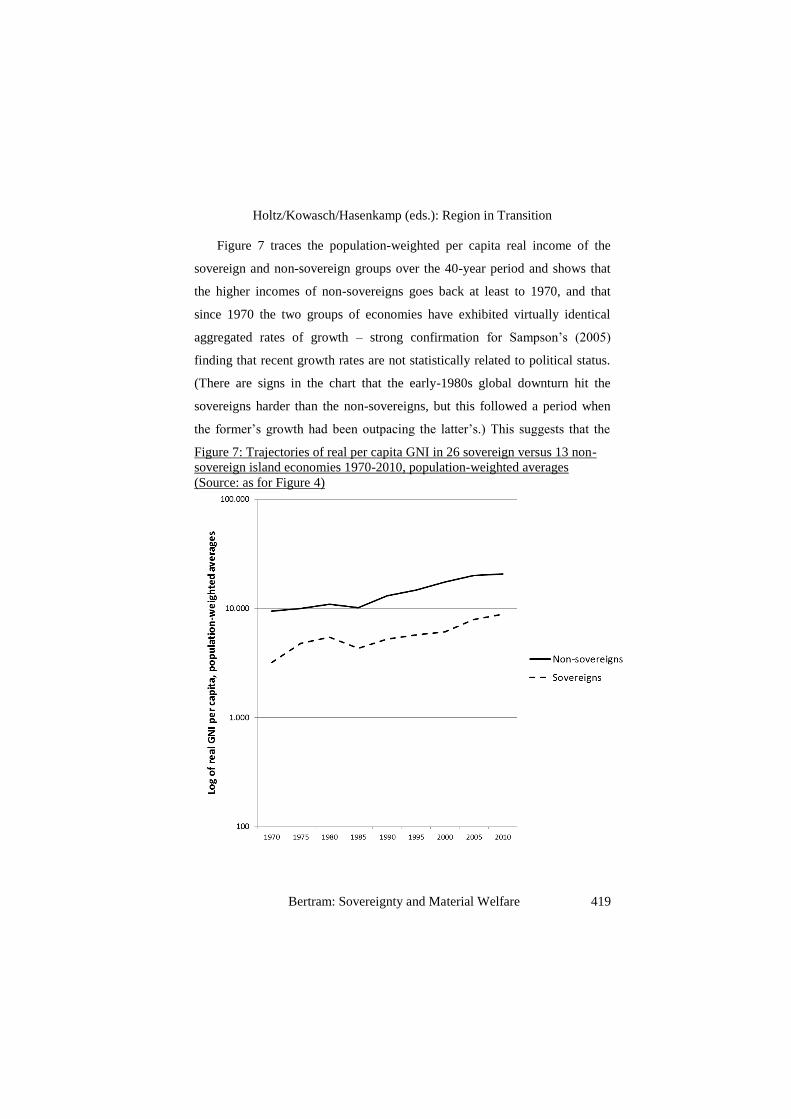
Figure 7 traces the population-weighted per capita real income of the
sovereign and non-sovereign groups over the 40-year period and shows that
the higher incomes of non-sovereigns goes back at least to 1970, and that
since 1970 the two groups of economies have exhibited virtually identical
aggregated rates of growth – strong confirmation for Sampson’s (2005)
finding that recent growth rates are not statistically related to political status.
(There are signs in the chart that the early-1980s global downturn hit the
sovereigns harder than the non-sovereigns, but this followed a period when
the former’s growth had been outpacing the latter’s.) This suggests that the
Figure 7: Trajectories of real per capita GNI in 26 sovereign versus 13 non-
sovereign island economies 1970-2010, population-weighted averages
(Source: as for Figure 4)
Holtz/Kowasch/Hasenkamp (eds.): Region in Transition
420 Bertram: Sovereignty and Material Welfare
difference in material welfare between the two types of political status was
established already at 1970, which means that either something happened
very early in the decolonisation era to separate the two groups of islands, or
the hypothesis of a causal relation running from political status to income
differentials (advanced, e.g., by Bertram 2004) loses ground to the competing
hypothesis that wealthier territories were more successful in avoiding
independence.
Another way to measure convergence or divergence over time between
the two groups of island economies is the ratio of per capita income. This is
shown in Figure 8 over the four decades 1970-2010. The pattern that shows
Figure 8: Ratio of population-weighted GNI per capita between 26 sovereign
and 13 non-sovereign island economies, 1970-2010 (Source: as for Figure 4)
up is of non-sovereigns falling behind relative to sovereigns during the
1970s, but pulling away again in the 1980s before dropping back again in the
Holtz/Kowasch/Hasenkamp (eds.): Region in Transition
Bertram: Sovereignty and Material Welfare 421
2000s. Over the forty-year period there is no clear secular trend, but the steep
drop in the early 1970s makes it all the more important to push the analysis
further back to see whether the 1970 data may be an anomaly.
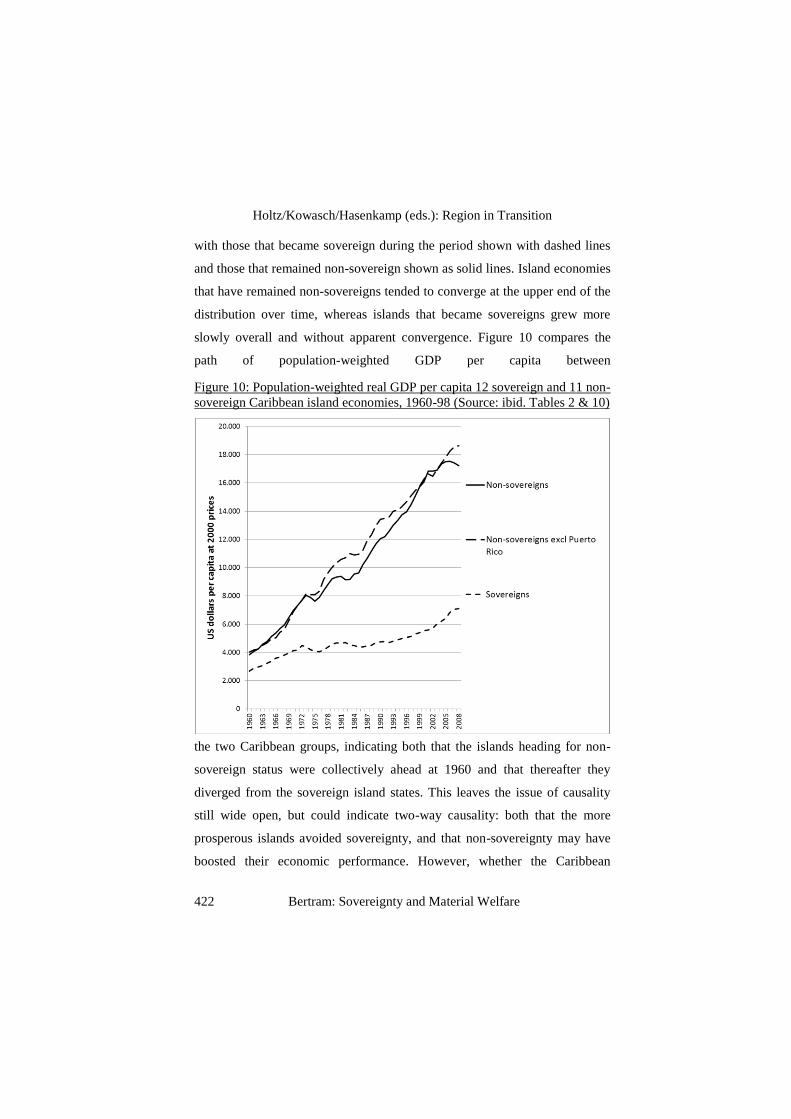
For one region it is possible to carry income comparisons back a further
decade. A long-run study of the Caribbean islands has been published with a
database going back to the early nineteenth century, which offers GDP
estimates for the period 1960-1998 (Bulmer-Thomas 2001: Table 10). Figure
9 compares the time paths of individual islands over that 1960-1998 period,
Figure 9: GDP per capita of 12 sovereign and 11 non-sovereign Caribbean
island economies, 1960-1998
Source: Bulmer-Thomas 2001: Table 10.
Holtz/Kowasch/Hasenkamp (eds.): Region in Transition
422 Bertram: Sovereignty and Material Welfare
with those that became sovereign during the period shown with dashed lines
and those that remained non-sovereign shown as solid lines. Island economies
that have remained non-sovereigns tended to converge at the upper end of the
distribution over time, whereas islands that became sovereigns grew more
slowly overall and without apparent convergence. Figure 10 compares the
path of population-weighted GDP per capita between
Figure 10: Population-weighted real GDP per capita 12 sovereign and 11 non-
sovereign Caribbean island economies, 1960-98 (Source: ibid. Tables 2 & 10)
the two Caribbean groups, indicating both that the islands heading for non-
sovereign status were collectively ahead at 1960 and that thereafter they
diverged from the sovereign island states. This leaves the issue of causality
still wide open, but could indicate two-way causality: both that the more
prosperous islands avoided sovereignty, and that non-sovereignty may have
boosted their economic performance. However, whether the Caribbean
Holtz/Kowasch/Hasenkamp (eds.): Region in Transition
Bertram: Sovereignty and Material Welfare 423
experience can be generalised to islands in other regions remains to be
explored. I turn now to two other measures that are more readily available for
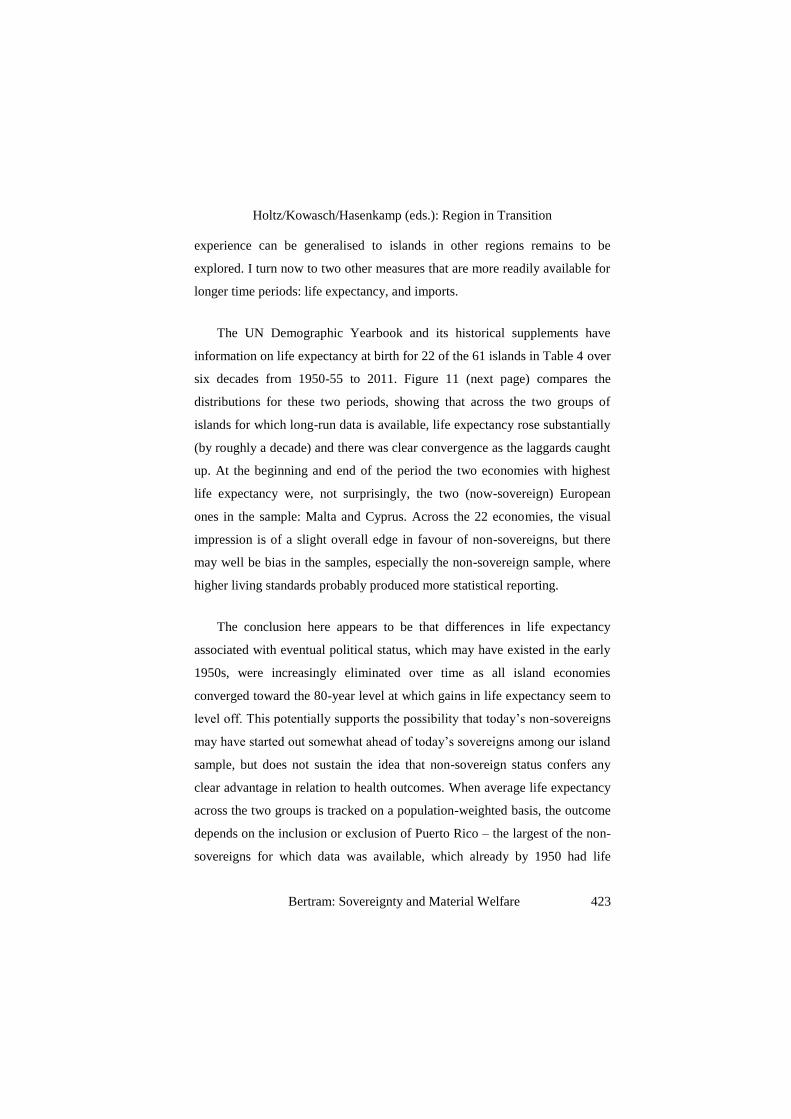
longer time periods: life expectancy, and imports.
The UN Demographic Yearbook and its historical supplements have
information on life expectancy at birth for 22 of the 61 islands in Table 4 over
six decades from 1950-55 to 2011. Figure 11 (next page) compares the
distributions for these two periods, showing that across the two groups of
islands for which long-run data is available, life expectancy rose substantially
(by roughly a decade) and there was clear convergence as the laggards caught
up. At the beginning and end of the period the two economies with highest
life expectancy were, not surprisingly, the two (now-sovereign) European
ones in the sample: Malta and Cyprus. Across the 22 economies, the visual
impression is of a slight overall edge in favour of non-sovereigns, but there
may well be bias in the samples, especially the non-sovereign sample, where
higher living standards probably produced more statistical reporting.
The conclusion here appears to be that differences in life expectancy
associated with eventual political status, which may have existed in the early
1950s, were increasingly eliminated over time as all island economies
converged toward the 80-year level at which gains in life expectancy seem to
level off. This potentially supports the possibility that today’s non-sovereigns
may have started out somewhat ahead of today’s sovereigns among our island
sample, but does not sustain the idea that non-sovereign status confers any
clear advantage in relation to health outcomes. When average life expectancy
across the two groups is tracked on a population-weighted basis, the outcome
depends on the inclusion or exclusion of Puerto Rico – the largest of the non-
sovereigns for which data was available, which already by 1950 had life
Holtz/Kowasch/Hasenkamp (eds.): Region in Transition
424 Bertram: Sovereignty and Material Welfare
Figure 11: Total life expectancy at birth in 13 sovereign and nine non-
sovereign island economies 1950-55 and 2011
Sources: Most data from UN Demographic Yearbook Historical Supplement http://unstats.un.org/unsd/demographic/products/dyb/dybhist.htm. 1990s and 2000s data from
Holtz/Kowasch/Hasenkamp (eds.): Region in Transition
Bertram: Sovereignty and Material Welfare 425
expectancy of over 60 years after half a century of close connection to the
USA. The calculation is crude, and prone to errors arising from gaps in the
data and sample selection bias (only islands for which data was available are
included). Data was located for 22 sovereigns and 14 non-sovereigns – a total
of 36 of the 61 islands in Table 4. The results are in Figure 12, first with
Puerto Rico included and then with it excluded. With Puerto Rico excluded,
the remaining 13 non-sovereigns started out behind the sovereigns in 1950
but had caught up by 1970 and moved well ahead by 2010.
The life expectancy evidence, therefore, is inconclusive with respect to
the key question of causality – whether relative wealth preceded political
dependence, or vice versa. The second panel of Figure 12 is the best evidence
at this point for the second position. We turn, therefore, to imports per head –
probably the best proxy for consumption standards for which long-run data is
available.
Figure 12: Population-weighted average life expectancy at birth, 22
sovereigns compared with 14 non-sovereigns including Puerto Rico
Holtz/Kowasch/Hasenkamp (eds.): Region in Transition
426 Bertram: Sovereignty and Material Welfare
Figure 12 cont.
Trade data
Statistics of merchandise trade were collected and published for most
small island territories throughout the colonial era, and have continued to
appear for both sovereign and non-sovereign islands since decolonisation.
The World Trade Organisation’s online database begins in 1948, but is almost
completely restricted to sovereign states, and for a number of the sovereign
islands in the Table 4 sample only shorter runs of data for more recent dates
are provided. Other sources fill some of the gaps, and provide figures for
some non-sovereign islands. In this section a preliminary analysis is
undertaken by assembling per capita import figures in US dollars for as many
as possible of the islands in our sample at ten-yearly intervals from 1950 to
2010.
Holtz/Kowasch/Hasenkamp (eds.): Region in Transition
Bertram: Sovereignty and Material Welfare 427
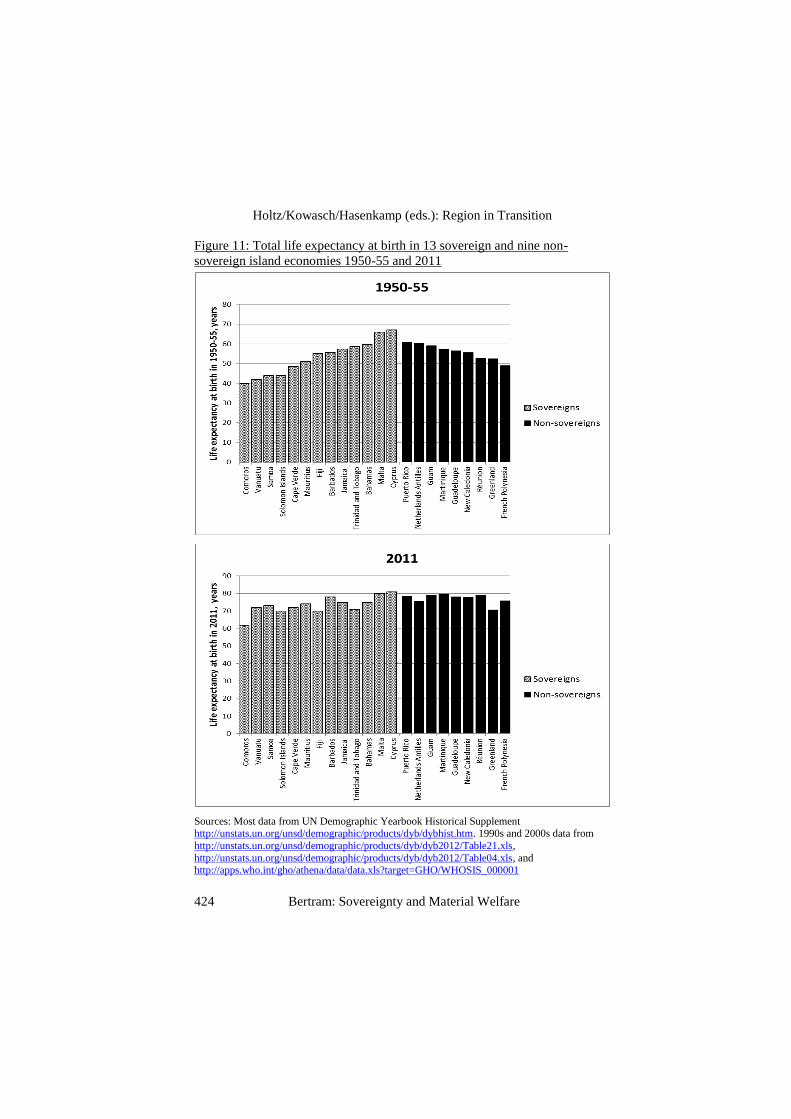
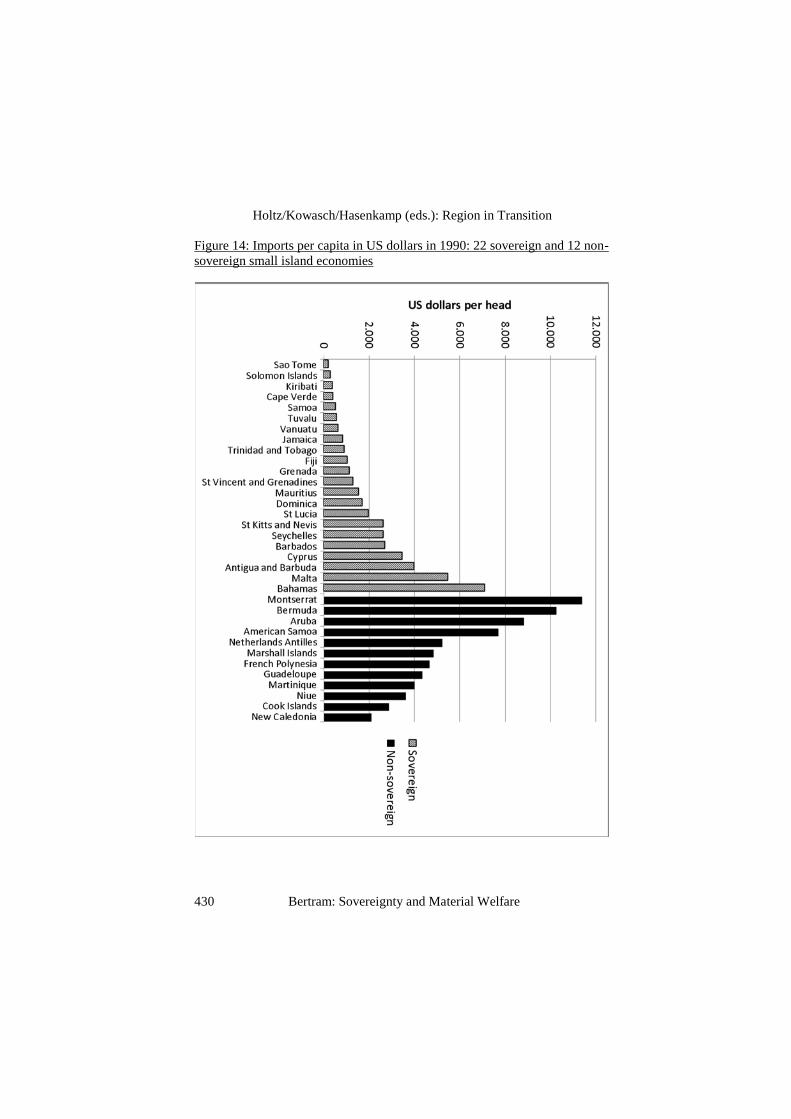
At this stage (early 2014) it has been possible to locate data on
merchandise imports per capita in US dollars for only 22 sovereign small-
island economies and eleven non-sovereigns – a total of 33, just over half the
economies in the Table 4 sample. Future research will be directed to
substantially increasing the representation of non-sovereigns. Figure 13 plots
the data, first with the Netherlands Antilles included and then with this outlier
excluded. (Imports to the Netherlands Antilles at that time were dominated by
oil passing through the refineries on Aruba and re-exported after processing –
in other words, were mainly intermediate goods rather than destined for final
consumption.)
No clear-cut general conclusions are possible from this exercise.
Obviously two or three individual non-sovereigns (Bermuda, New Caledonia,
Netherlands Antilles) stand out ahead of the bunch at 1950 but across the
remainder of the islands covered there is no strong pattern. Provisionally
Figure 13 could be consistent with the hypothesis that the gap between
sovereign and non-sovereign groups opened up during or after decolonisation
and was not pre-existing - but the fact that the three top cases in the import
data at 1950 were all economies that later retained non-sovereign status keeps
alive the alternative hypothesis that for at least part of the sample causality
may have run from economic to political status.
Repeating the exercise for two post-decolonisation years, 1990 and 2010,
produces the results in Figures 14 (for 1990) and 15 (for 2010) on the
following pages for essentially the same sets of islands (American Samoa is
added in 1990, Aruba appears separately from the rest of the Netherlands
Antilles, and a couple of other non-sovereigns enter or leave the set as a result
of data availability).
Holtz/Kowasch/Hasenkamp (eds.): Region in Transition
428 Bertram: Sovereignty and Material Welfare
Figure 13: Imports per capita in US dollars in 1950: 22 sovereign and 11 non-
sovereign small island economies
Holtz/Kowasch/Hasenkamp (eds.): Region in Transition
Bertram: Sovereignty and Material Welfare 429
Figure 13 cont.
Holtz/Kowasch/Hasenkamp (eds.): Region in Transition
430 Bertram: Sovereignty and Material Welfare
Figure 14: Imports per capita in US dollars in 1990: 22 sovereign and 12 non-
sovereign small island economies
Holtz/Kowasch/Hasenkamp (eds.): Region in Transition
Bertram: Sovereignty and Material Welfare 431
Figure 15: Imports per capita in US dollars in 2010: 22 sovereign and 12 non-
sovereign small island economies
Visually, comparing Figures 14 and 15 with Figure 13 might seem to
support the hypothesis of non-sovereign political status driving stronger
economic performance over time, but statistically significant results would
Holtz/Kowasch/Hasenkamp (eds.): Region in Transition
432 Bertram: Sovereignty and Material Welfare
still require systematic analysis that controlled for other factors, plus a bigger
data set with wider coverage of non-sovereigns. This remains the object of
future work.
One corrective to the visual impression gained from Figures 13-15 is to
calculate the population-weighted imports per head across the islands for
which data was available. The result, in Figure 16, is remarkable. It appears
Figure 16: Population-weighted imports per head, US dollars, sovereign
versus non-sovereign island economies
to provide quite strong support for the idea that the islands that eventually
became non-sovereign (a) started out ahead prior to decolonisation, and (b)
retained basically the same lead sixty years later after (c) experiencing a
period during the late twentieth century when they pulled strongly ahead of
Holtz/Kowasch/Hasenkamp (eds.): Region in Transition
Bertram: Sovereignty and Material Welfare 433
the sovereigns before falling back again at the beginning of the twenty-first
century. Thus analyses that emphasised the superior performance of non-
sovereigns up to the 1990s may have captured a phenomenon that was only
temporary and that may have been reversed in the past decade. The data are
not yet, however, strong enough to sustain any definite conclusion.
Conclusion
The research programme discussed in this chapter is still in progress and
a great deal remains to be done. The question of whether non-sovereign
political status confers economic advantage remains a fascinating one, which
has produced many research findings at the level of individual island case
studies while stimulating the search for statistically-valid generalisations. One
central proposition has stood the test of the work reported in this chapter:
non-sovereign economies at least have done no worse than sovereign ones in
raising and sustaining the material living standards of their populations. The
choice of political status is therefore not one that can be founded on any
obvious superiority of sovereign independence. The opposite hypothesis - that
non-sovereign status wins out on economic performance - remains unproven
at the general level, however persuasively it can be argued for the histories of
particular cases.
For non-sovereign island communities facing the possibility of moving to
sovereign independence – for example New Caledonia and Bougainville – the
economic evidence analysed here offers no clear positive guidelines. Gains in
per capita income should not be expected to flow from independence; but
neither is it clear that the change necessarily implies sacrificing the material
welfare of the population. This position is a considerable shift from the
argument in my previous work that gaining sovereign independence has
typically involved a trade-off: lower material welfare as the price of gaining
national identity and pride. But until more long-run data spanning the entire
decolonisation period is assembled and analysed, the fundamental question of
whether there is indeed any general relationship between sovereignty and
material welfare in small islands will remain open.
References:
Armstrong, Harvey, De Kervenoael, Ronan J./Li, X./Read, Robert (1998): A comparison of the
economic performance of different microstates and between microstates and larger countries, in:
World Development, 26(4) 1998, 639–656.
Armstrong, Harvey/Read, Robert (2000): Comparing the economic performance of dependent
territories and sovereign micro-states, in: Economic Development and Cultural Change, 48(2)
2000, 285–306.
Armstrong, Harvey/Read, Robert (2002): The phantom of liberty? Economic growth and the
vulnerability of small states, in: Journal of international development, 14(3) 2002, 435–458.
Baldacchino, Godfrey (2004): Autonomous but not sovereign? A review of island sub-nationalism, in: Canadian Review of Studies in Nationalism, 31(1-2) 2004, 77-90.
Baldacchino, Godfrey (2006): Extreme tourism: lessons from the world’s cold water islands,
Oxford.
Baldacchino, Godfrey (2006b): Managing the hinterland beyond: two, ideal-type strategies of
economic development for small island territories, in: Asia-Pacific Viewpoint, 47(1) 2006, 45-60.
Baldacchino, Godfrey and Milne, David (eds.) (2000): Lessons from the political economy of small islands: the resourcefulness of jurisdiction, Basingstoke.
Baldacchino, Godfrey/Bertram, Geoff (2009): The beak of the finch: insights into the economic
development of small, often island, economies, in: The Round Table, 98(401) 2009, 141-160.
Bertram, Geoff (1986): “Sustainable development" in Pacific micro-economies, in: World
Development, 14(7) 1986, 809–822.
Bertram, Geoff (1993): Sustainability, aid, and material welfare in small South Pacific island economies, 1900–1990, in: World Development, 21(2) 1993, 247–258.
Bertram, Geoff (1998): The MIRAB model twelve years on, in: The Contemporary Pacific, 11(1)
1998, 105–138.
Bertram, Geoff (2004): On the convergence of small island economies with their metropolitan
patrons, in: World Development, 32(2) 2004, 343–364.
Bertram, Geoff (2006): Introduction: the MIRAB model in the twenty-first century, in: Asia Pacific Viewpoint, 47(1) 2006, 1–14.
Holtz/Kowasch/Hasenkamp (eds.): Region in Transition
Bertram: Sovereignty and Material Welfare 435
Bertram, Geoff (2013): Pacific Island economies, in: Moshe Rapaport (ed): The Pacific Islands:
Environment and Society, revised edition, Honolulu, 325-340.
Bertram, Geoff/Poirine, Bernard (2007): Island Political Economy, in: Godfrey Baldacchino
(ed.): A World of Islands, Institute of Island Studies, University of Prince Edward Island,
Charlottetown, 325–377.
Bertram, Geoff/Watters, Ray F. (1985): The MIRAB economy in South Pacific microstates, in:
Pacific Viewpoint, 26(3) 1985, 852-867.
Briguglio, Lino (1995): Small island developing states and their vulnerabilities, in: World Development, 23(9) 1995, 1615-1632.
Bulmer-Thomas, Victor (2001): The wider Caribbean in the twentieth century: a long run
development perspective, in: Integration and Trade Journal, 5(15):5-56; reprinted in: Denis Pantin (ed.) (2005): The Caribbean economy: a reader, Kingston and Miami, 257-303.
Drezner, Daniel (2001): Sovereignty for Sale, in: Foreign Policy, 126/September 2001, 76-77.
Easterly, William/Kraay, Aart (2002): Small states, small problems? Income, growth, and volatility in small states, in: World Development, 28(11) November 2002, 2013-2027.
Feyrer, James/Sacerdote, Bruce (2009): Colonialism and Modern Income: Islands as Natural
Experiments, in: Review of Economics and Statistics, 91(2) May 2009, 245–262.
McElroy, Jerome L. (2006): Small Island Tourist Economies across the Life Cycle, in: Asia
Pacific Viewpoint, 47/2006, 61-77.
McElroy, Jerome L./Parry, Courtney E. (2010): The characteristics of small island tourist economies, in: Tourism and Hospitality Research, 10(4) 2010, 315-328.
McElroy, Jerome L./Parry, Courtney E. (2012): The long term propensity for political affiliation
in island microstates, in: Commonwealth and Comparative Politics, 50(4) Nov. 2012, 403-421.
McElroy, Jerome L./Pearce, Kara B. (2006): The advantages of political affiliation: dependent
and independent small island profiles, in: The Round Table, 95(386) September 2006, 529-539.
McElroy, Jerome. L./Hamma, Perri. E. (2010): SITEs revisited: socioeconomic and demographic contours of small island tourist economies, in: Asia Pacific Viewpoint, 51(1), 36–46.
Milne, Simon (1992): Tourism and development in South Pacific microstates, in: Annals of Tourism Research, 19(2) 1992, 191–212.
Poirine, Bernard (1995): Les petites economies insulaires: theorie et strategies de
developpement, Paris.
Poirine, Bernard (1999): A theory of aid as trade with special reference to small islands, in:
Economic Development and Cultural Change, 47(4) 1999, 831–852.
Sampson, Thomas (2005): Notes on the economic performance of small states 1995–2003, Working Paper No. 2, ADB-Commonwealth Secretariat Joint Report to the PIF Secretariat,