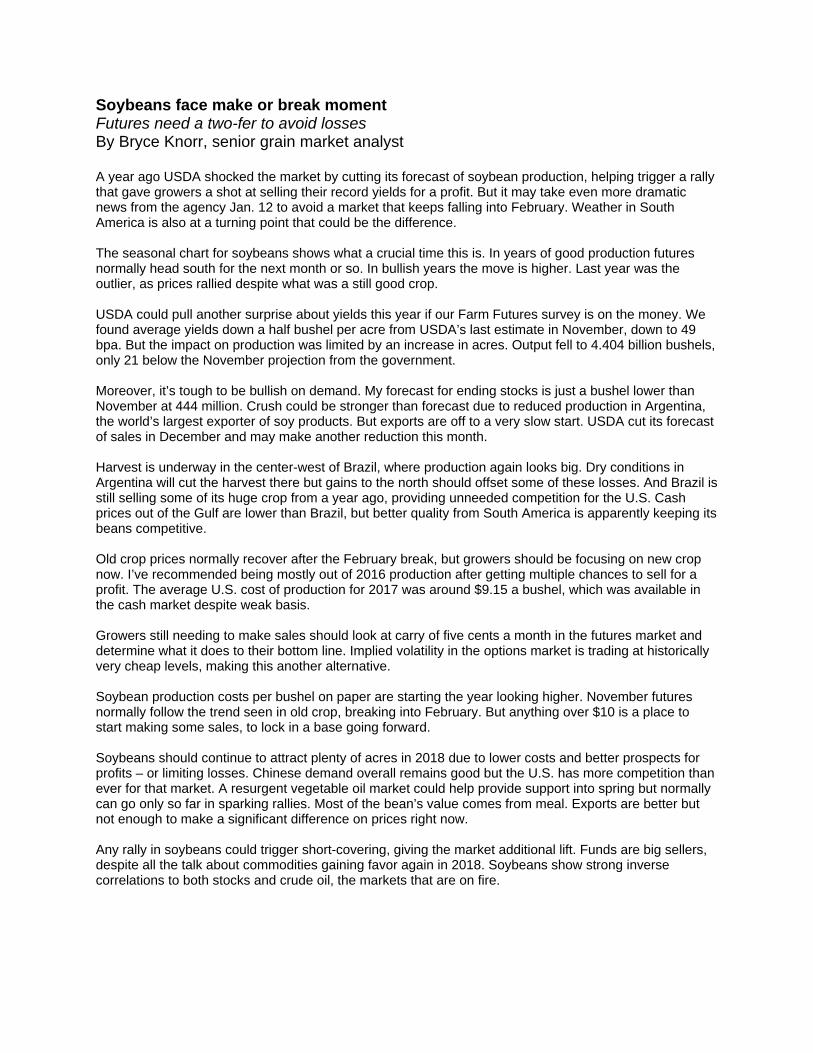
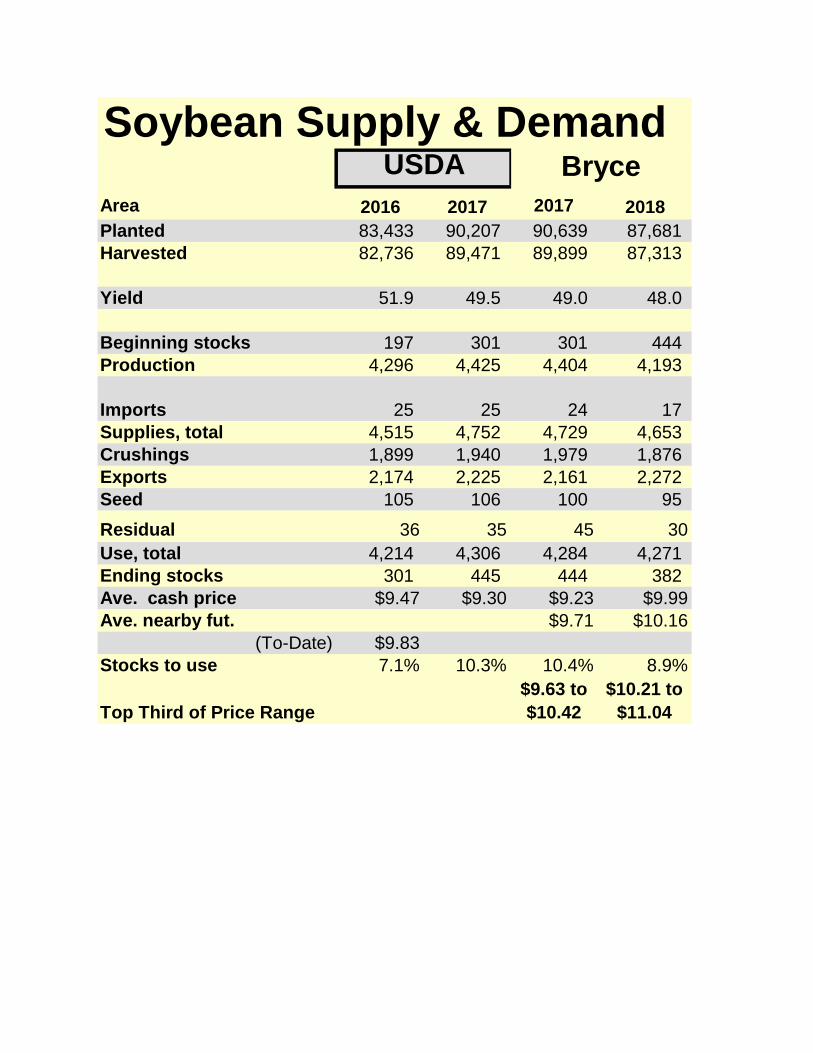
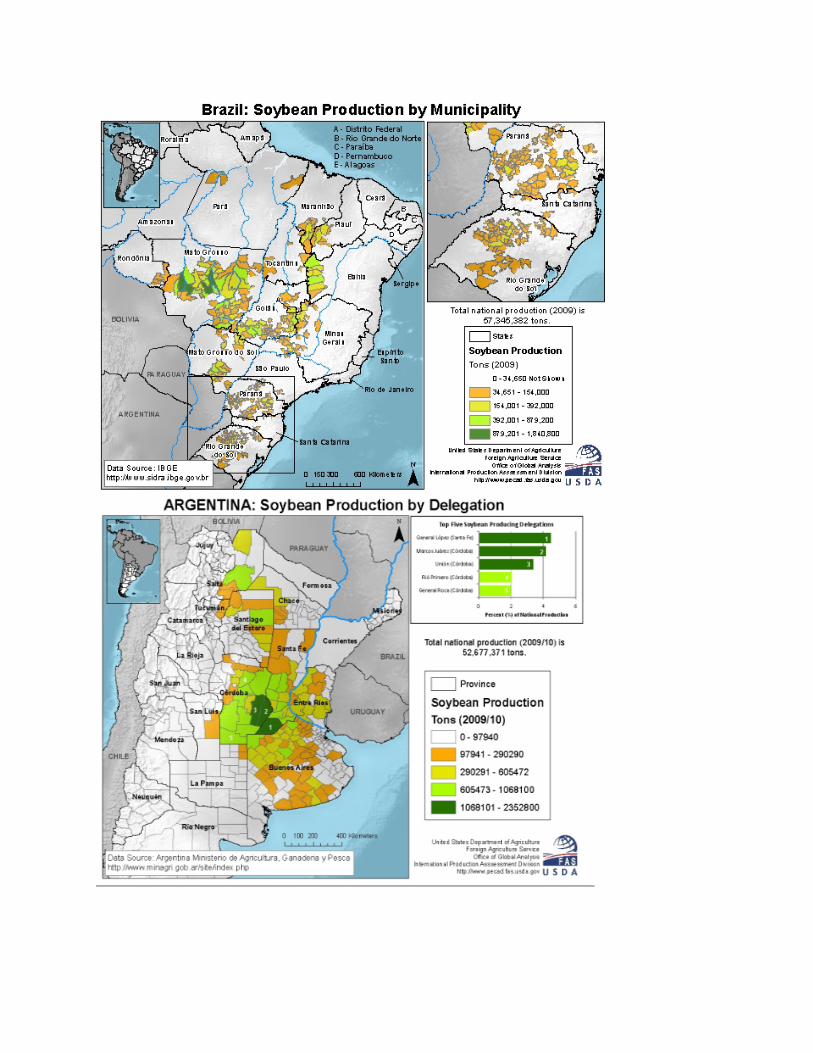
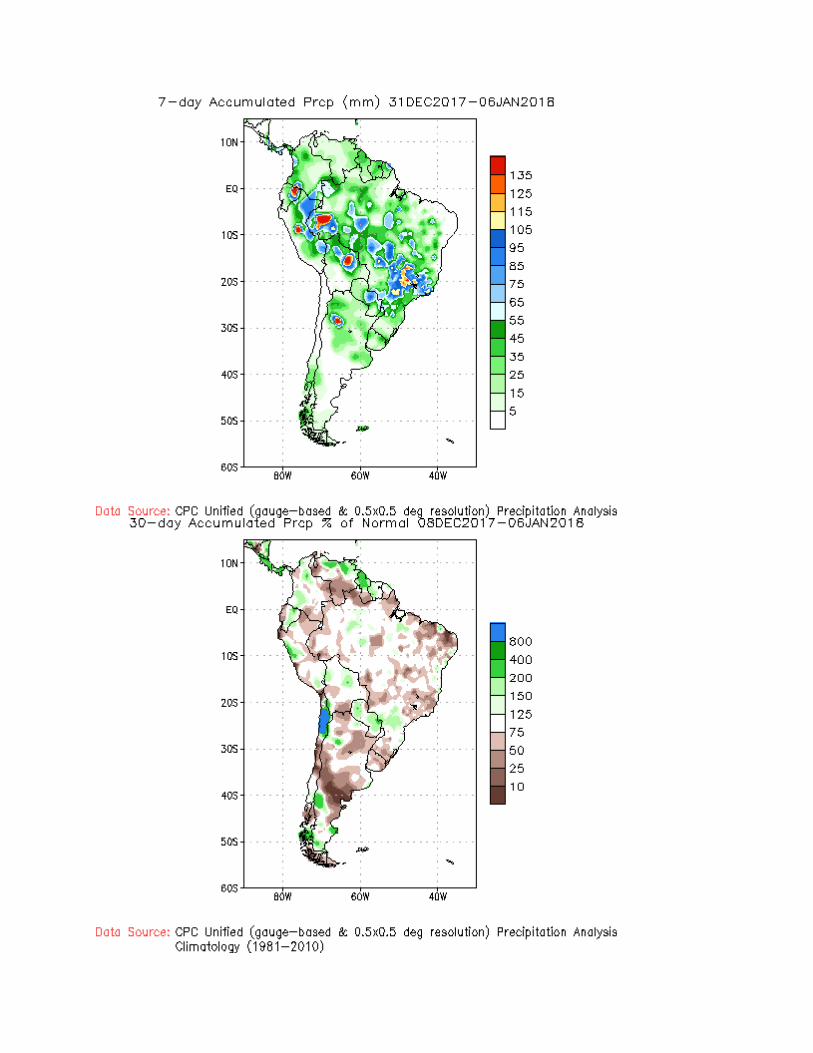
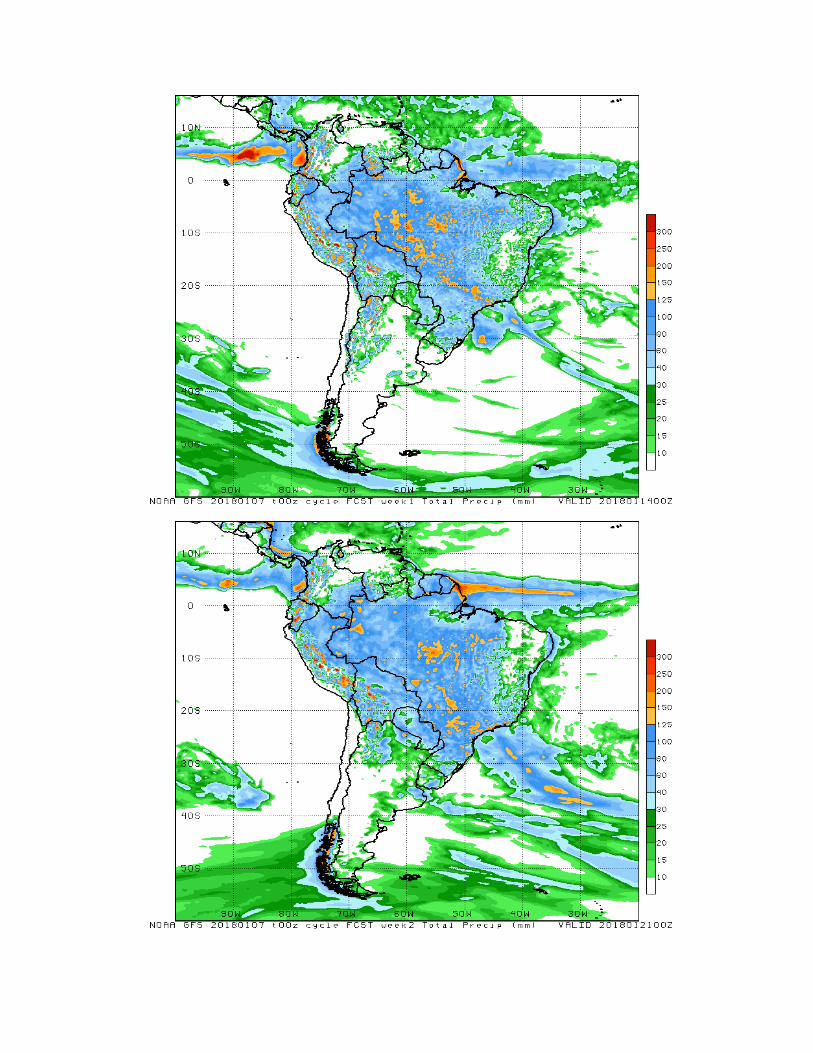
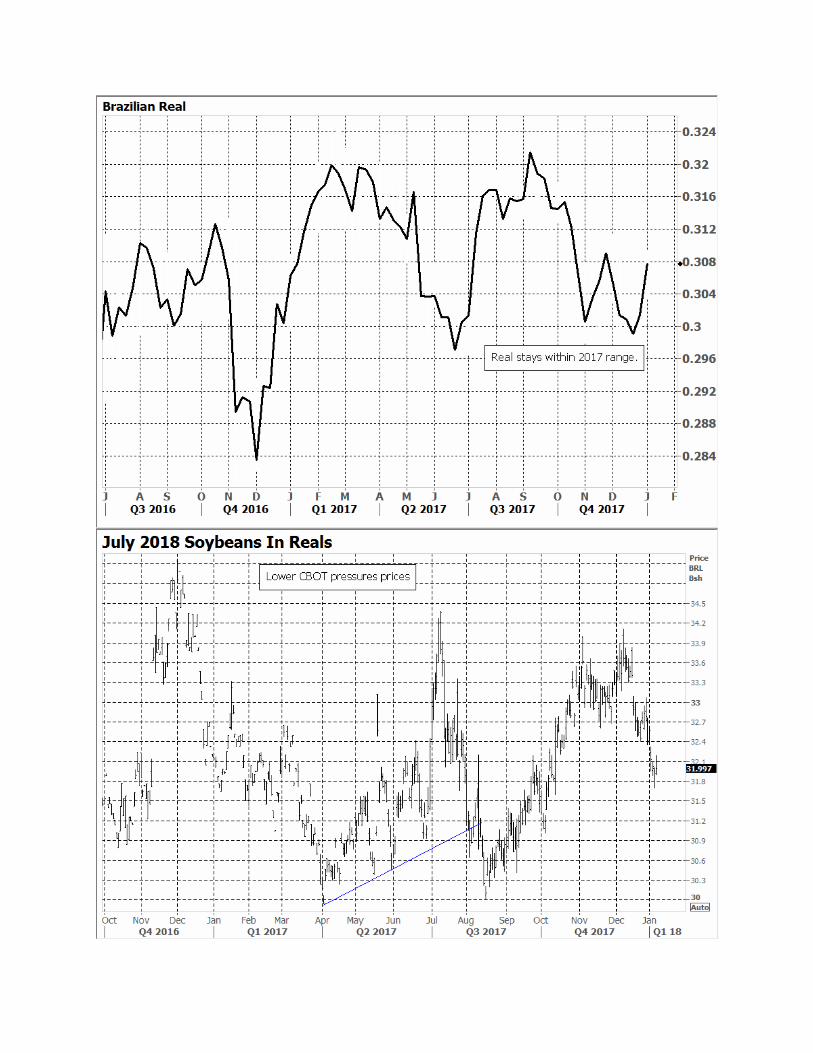
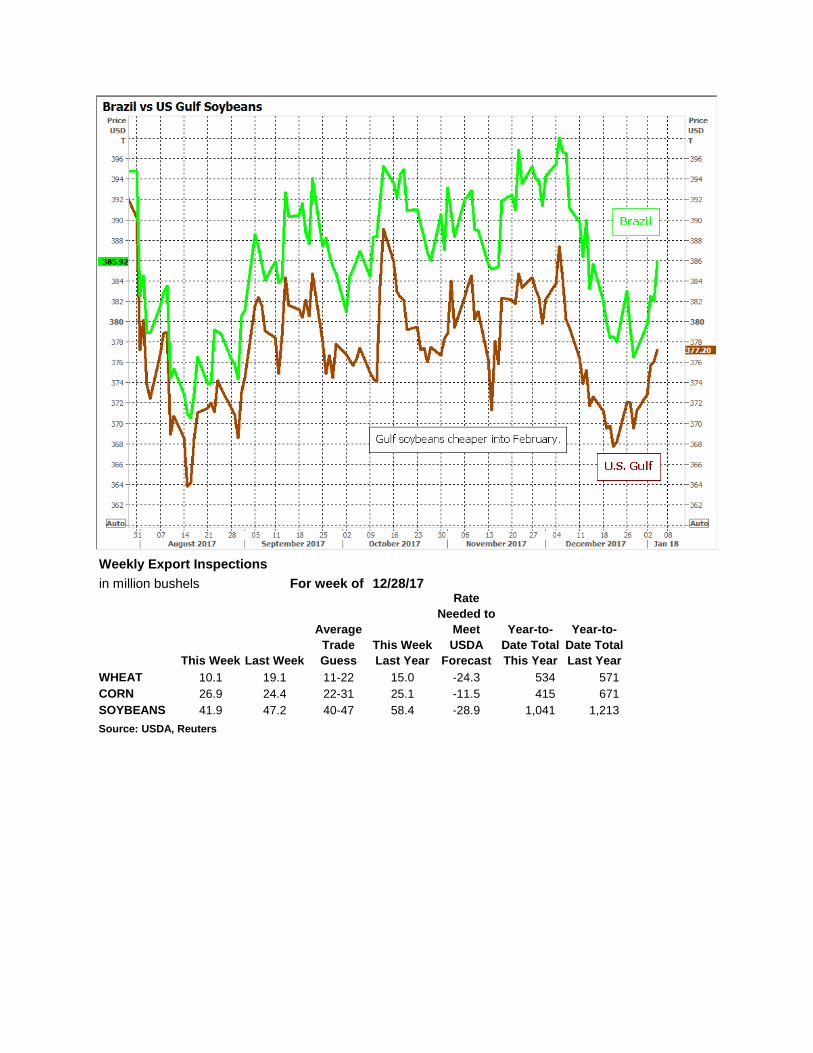
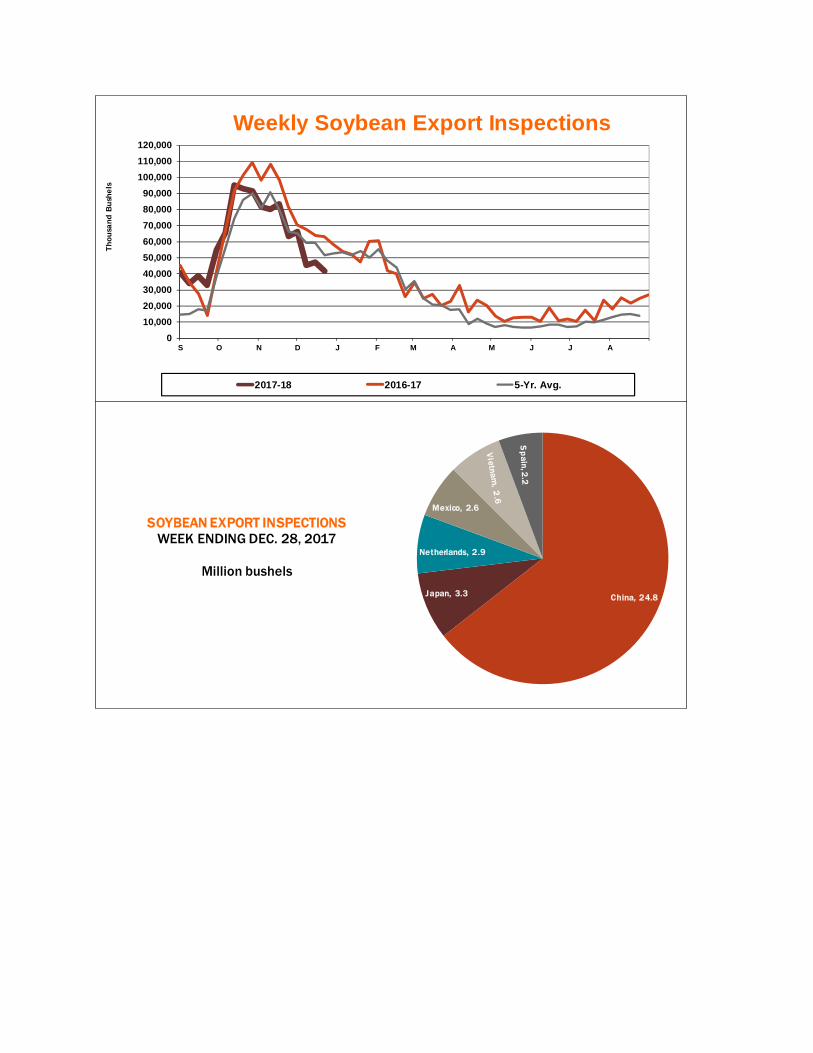
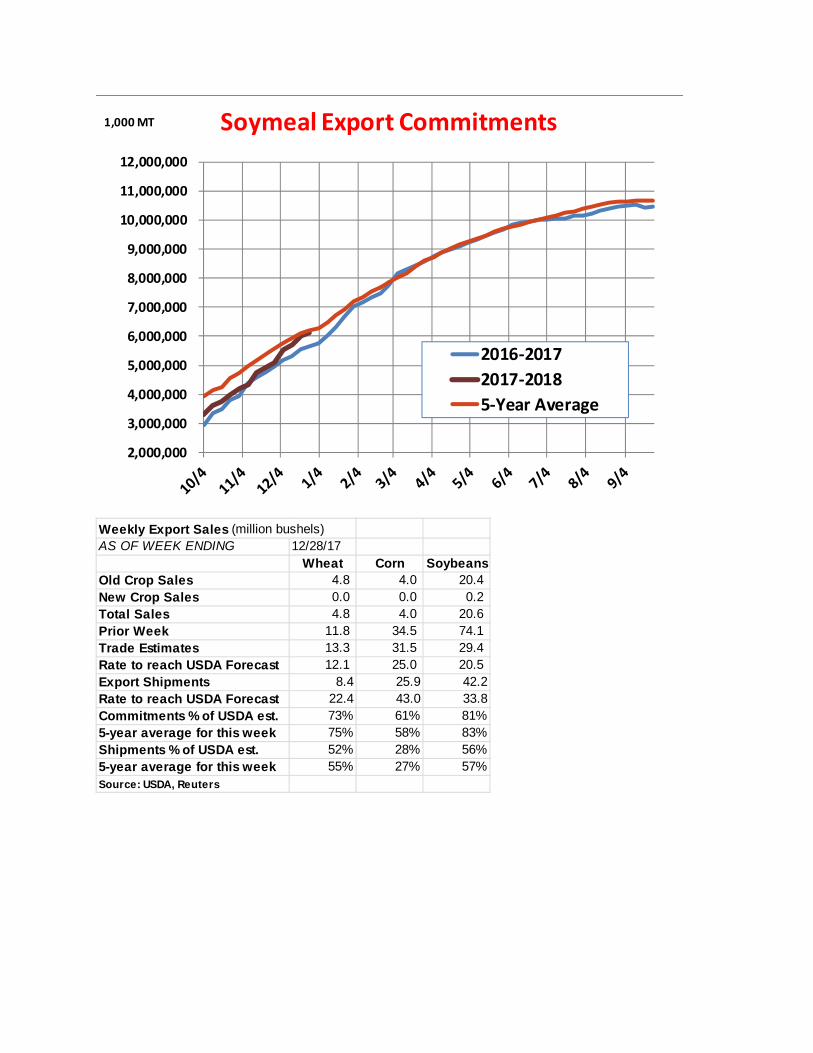
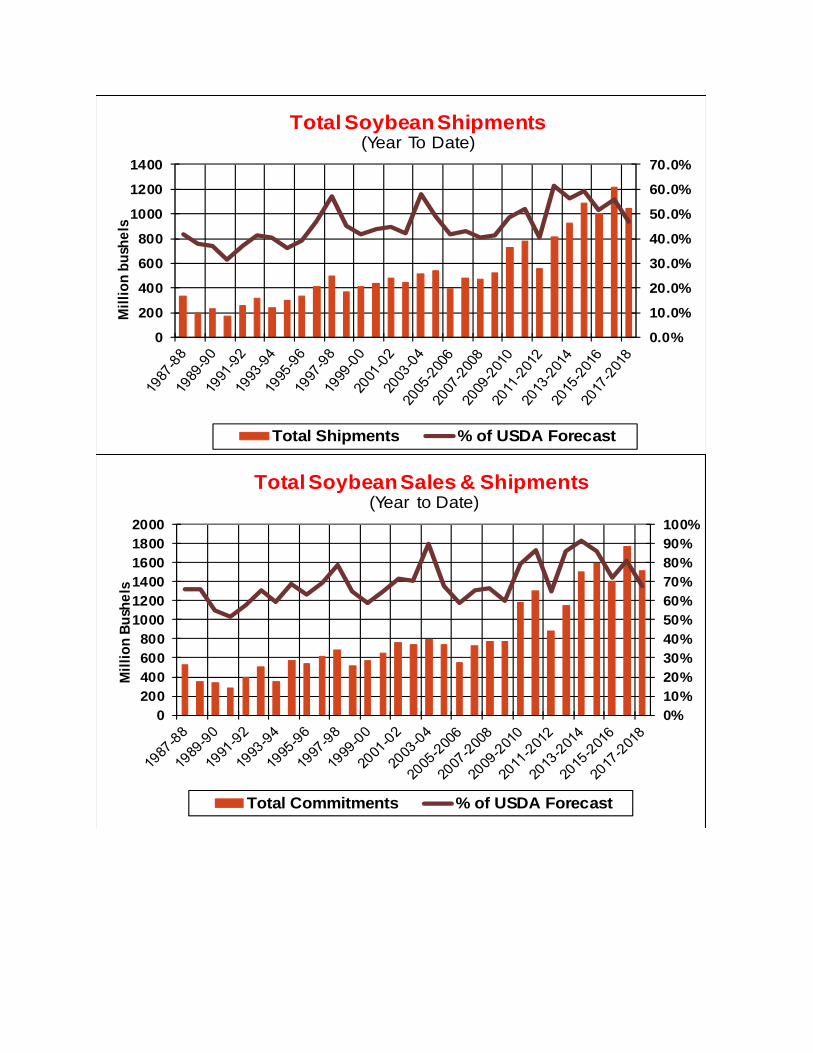
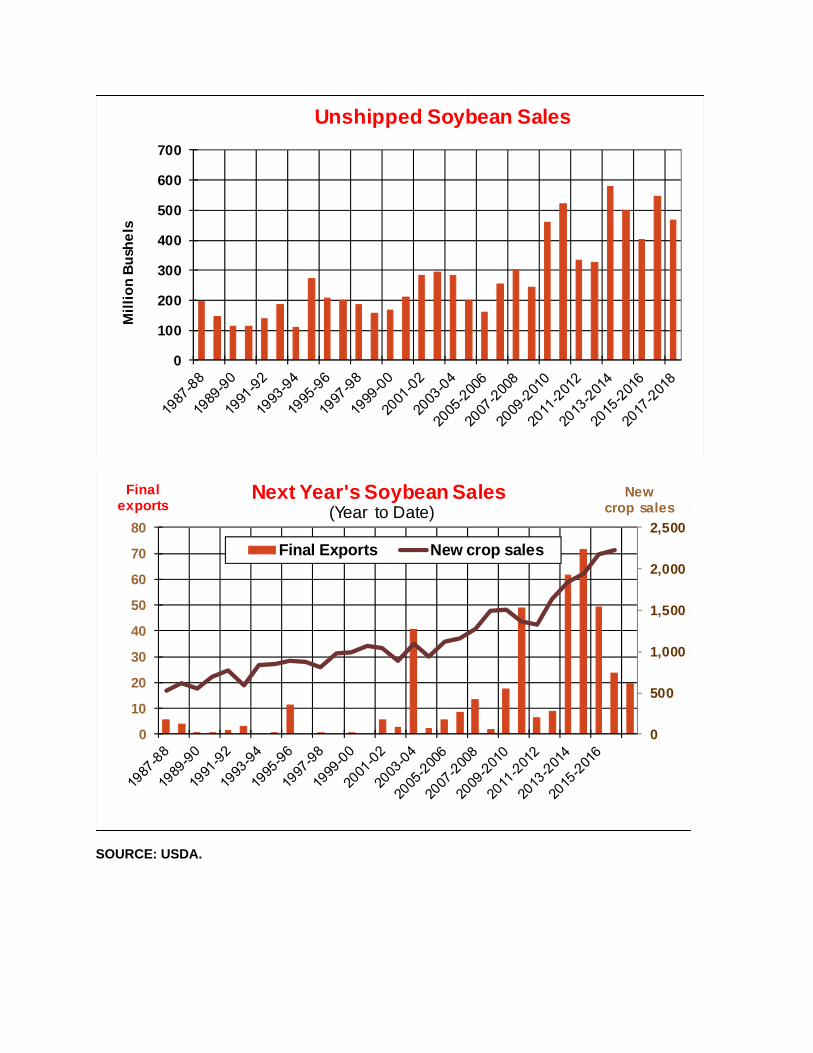
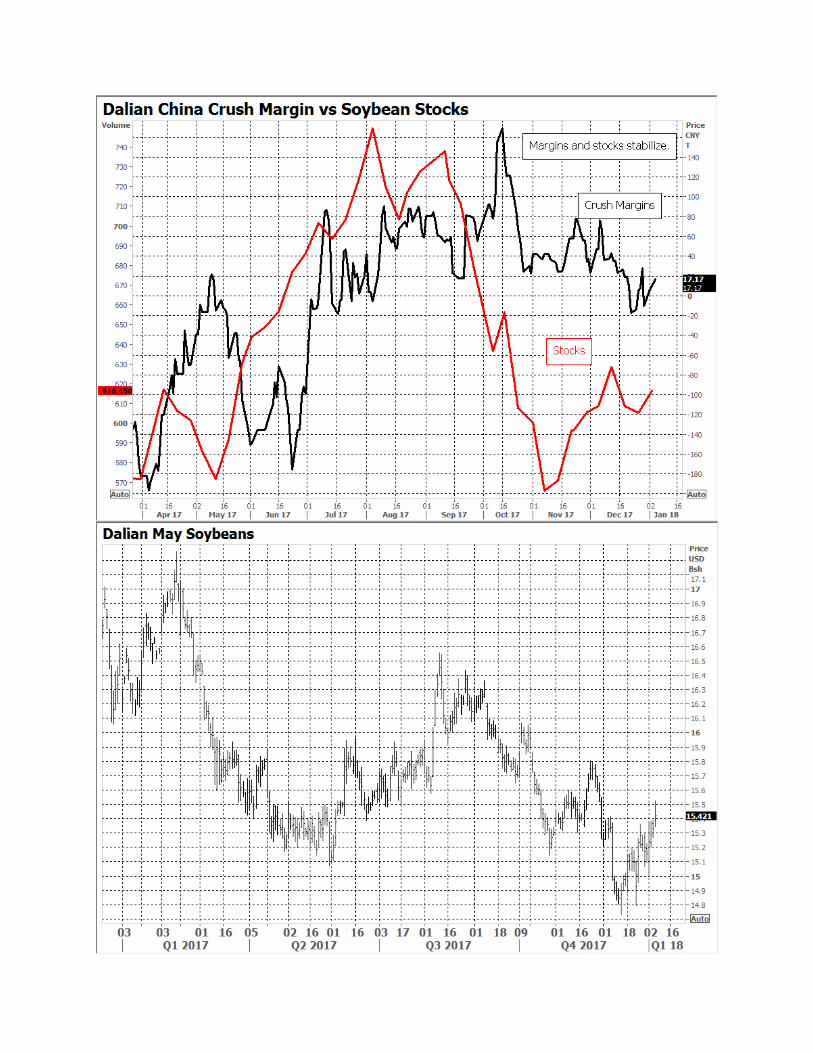
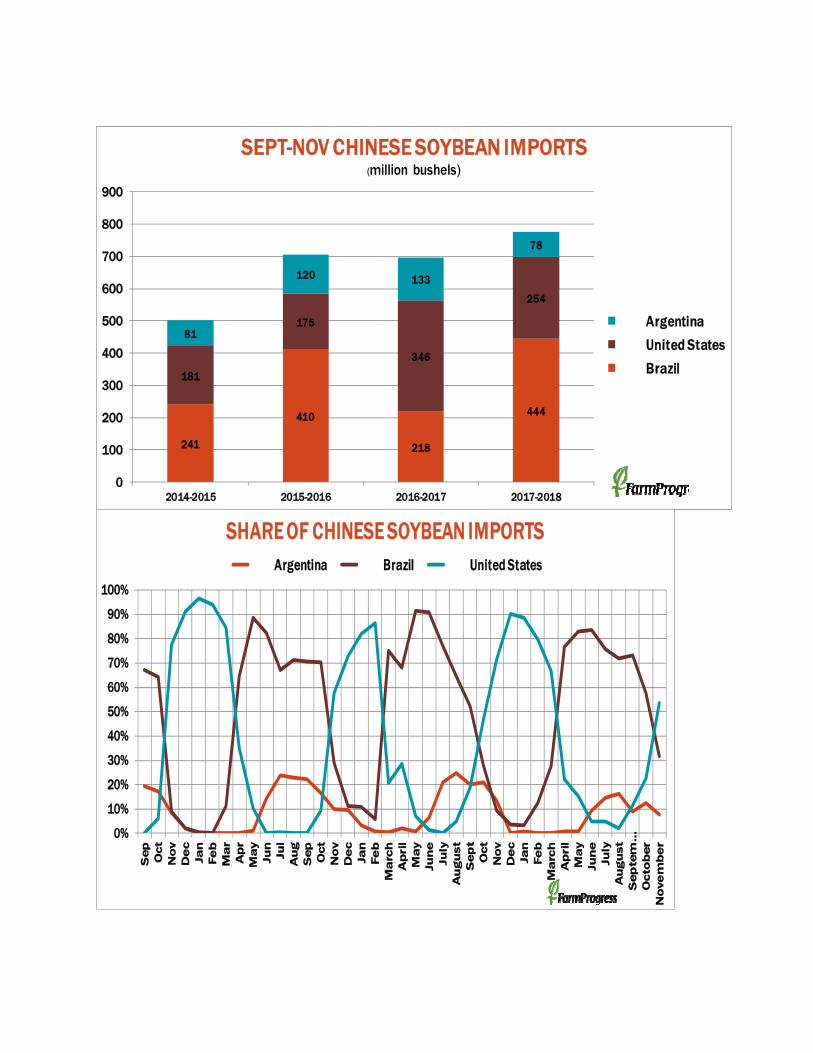
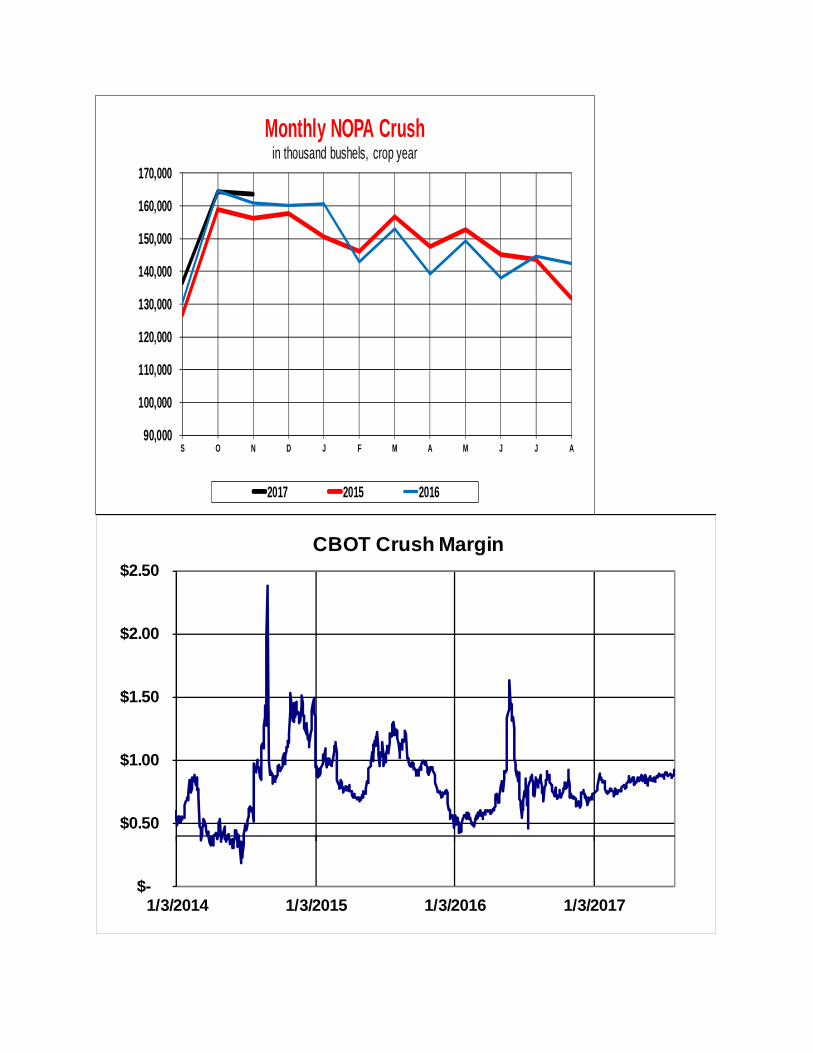
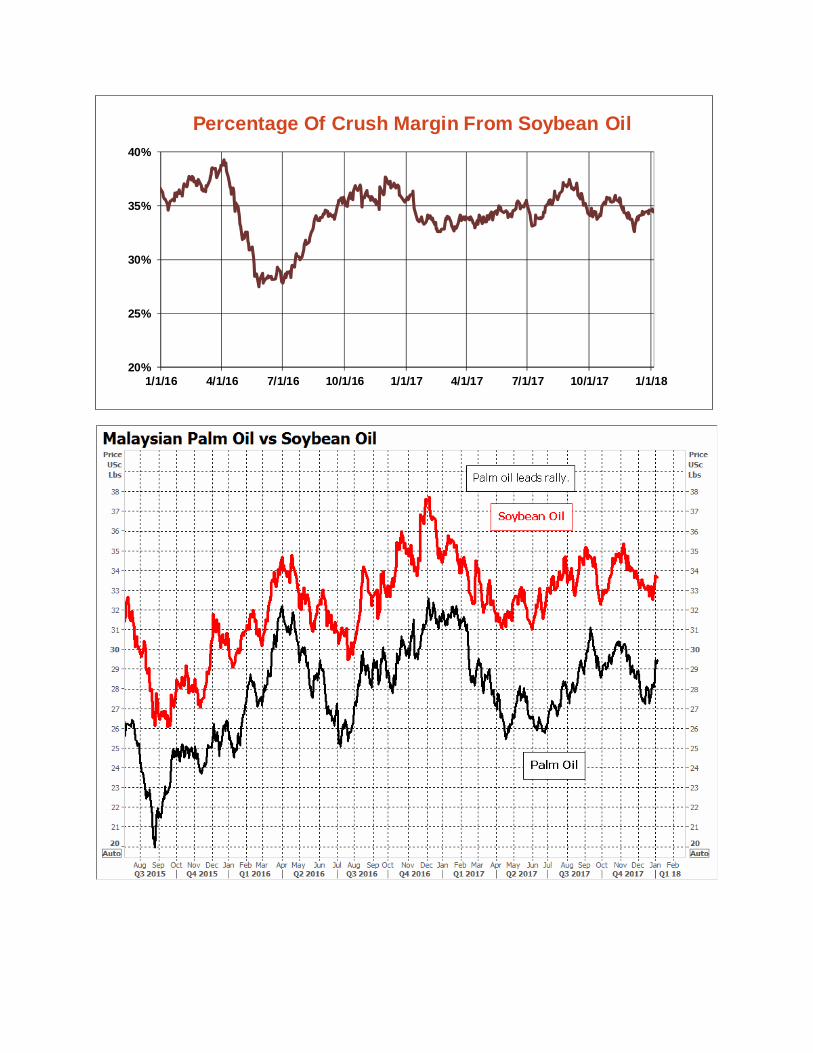
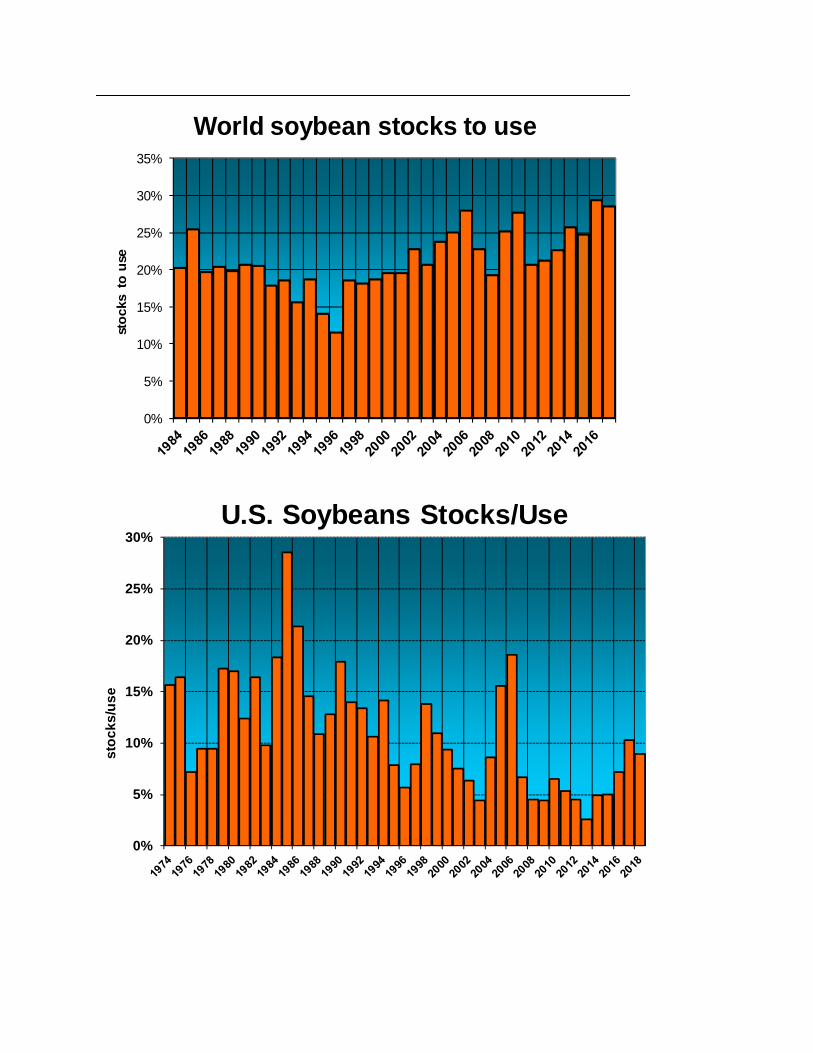
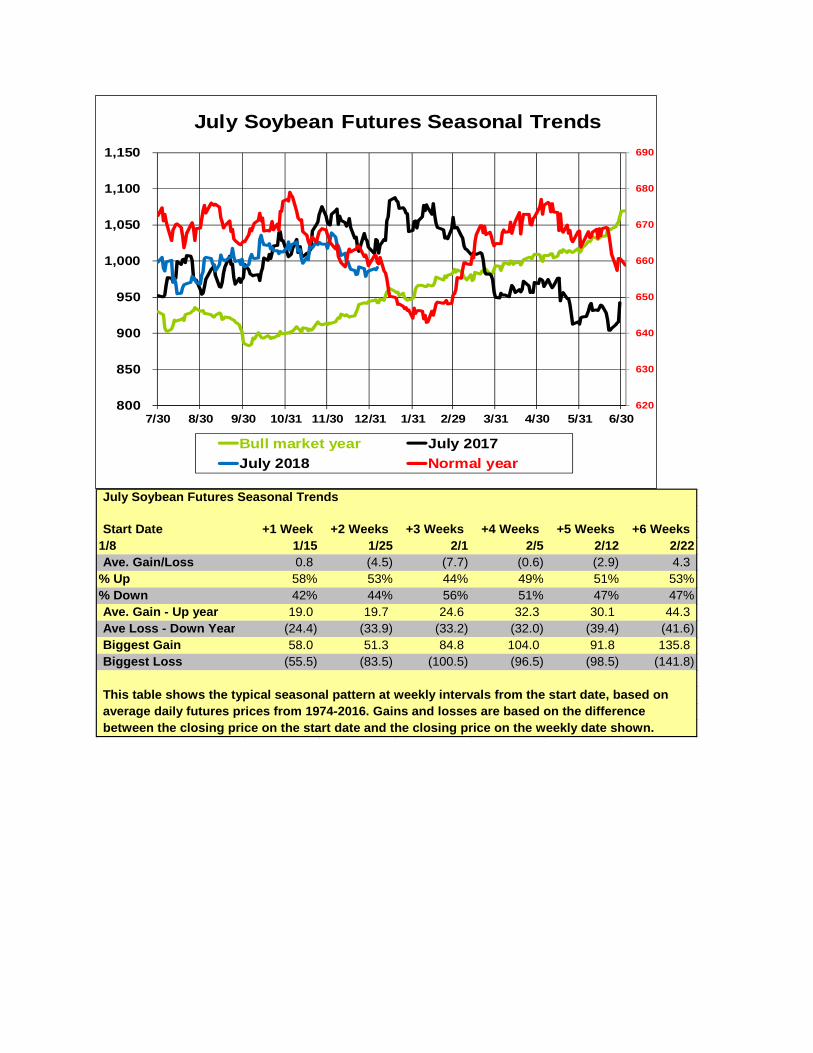
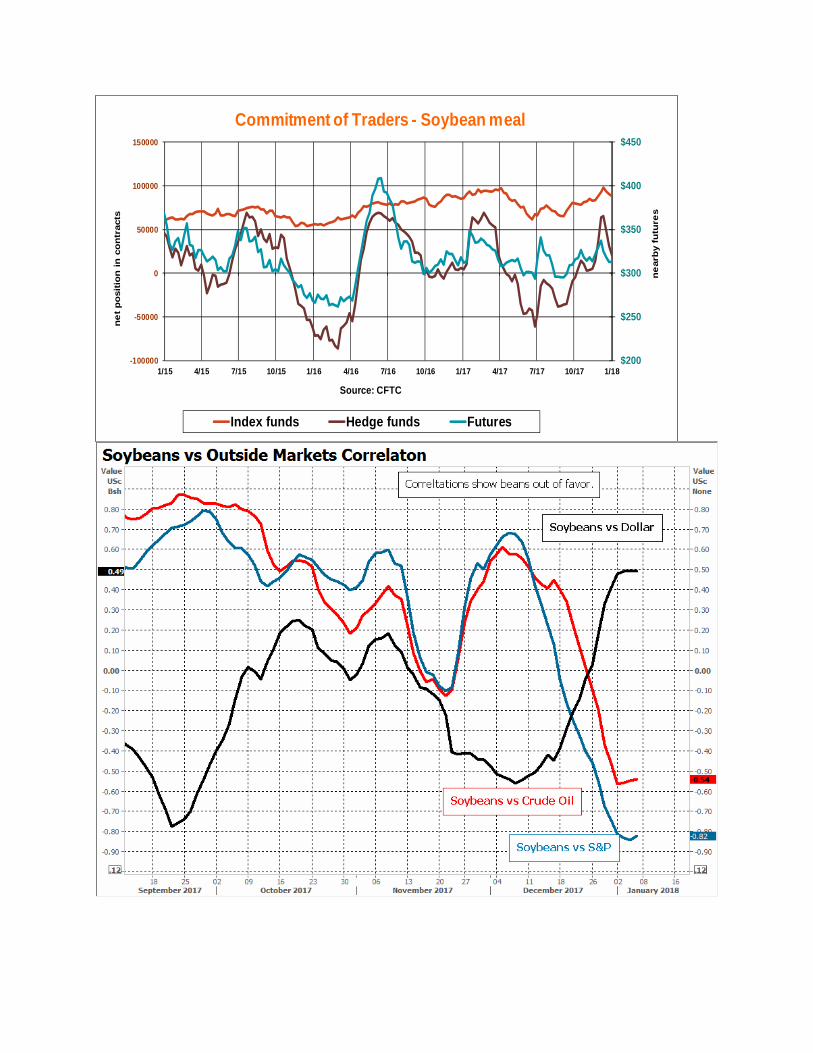
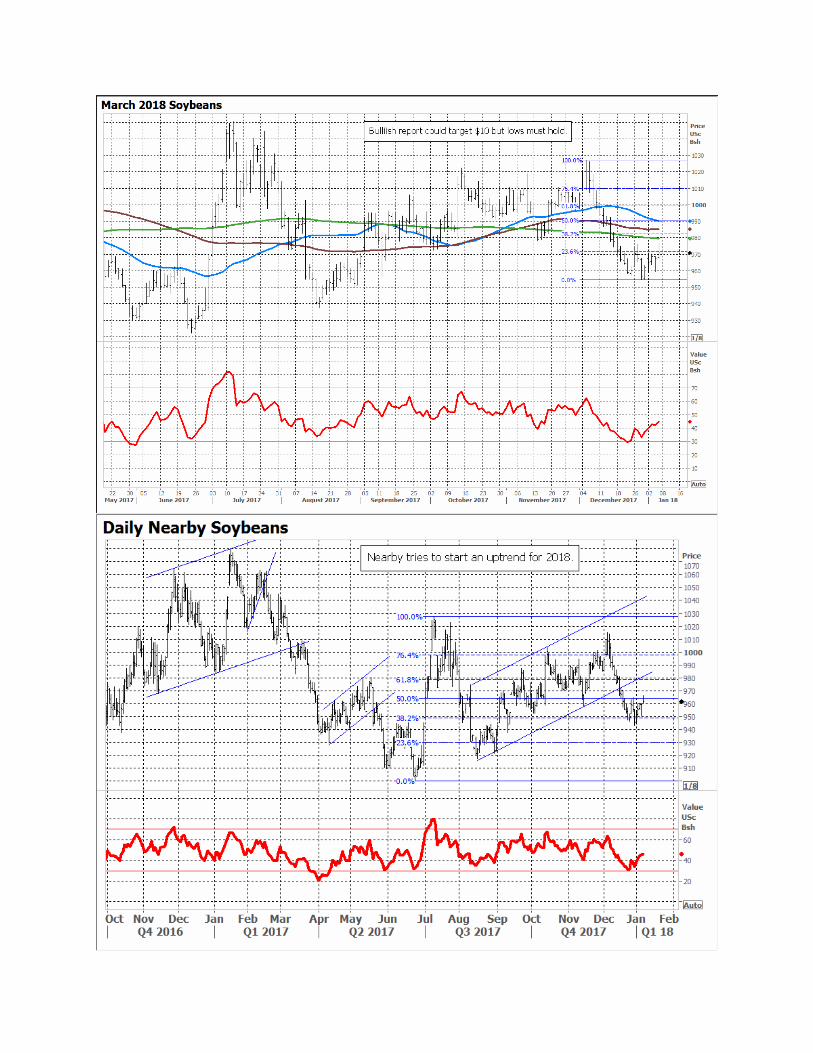
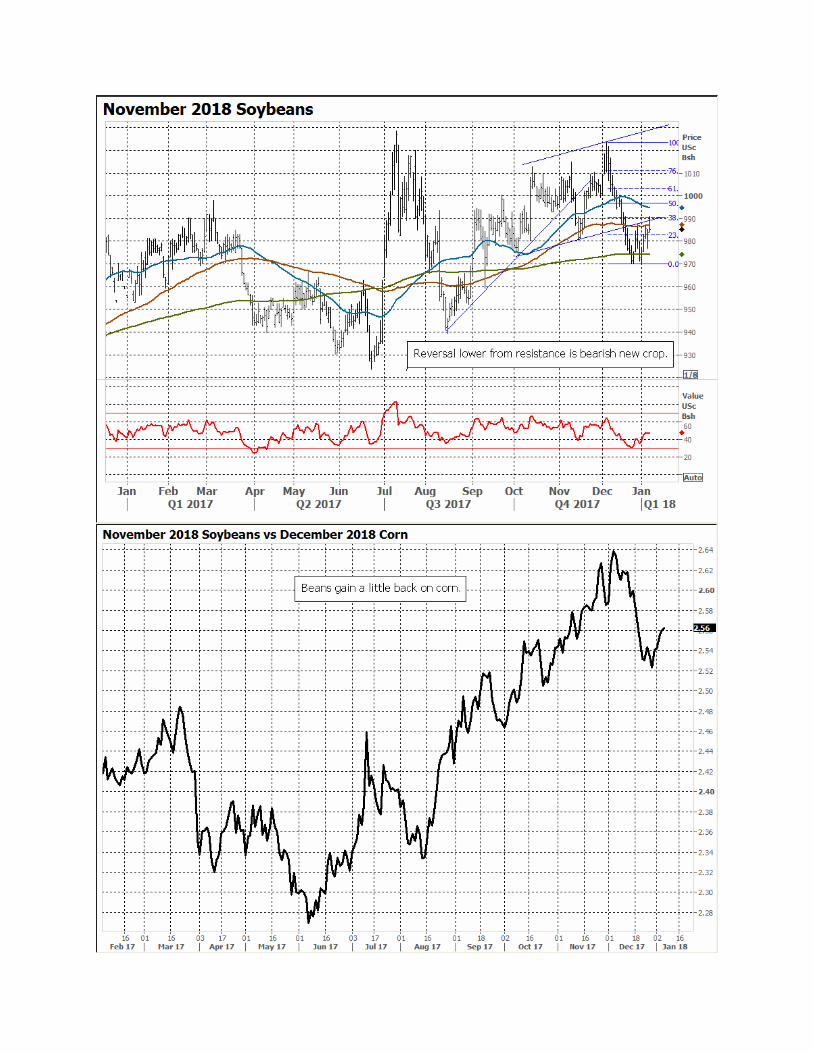
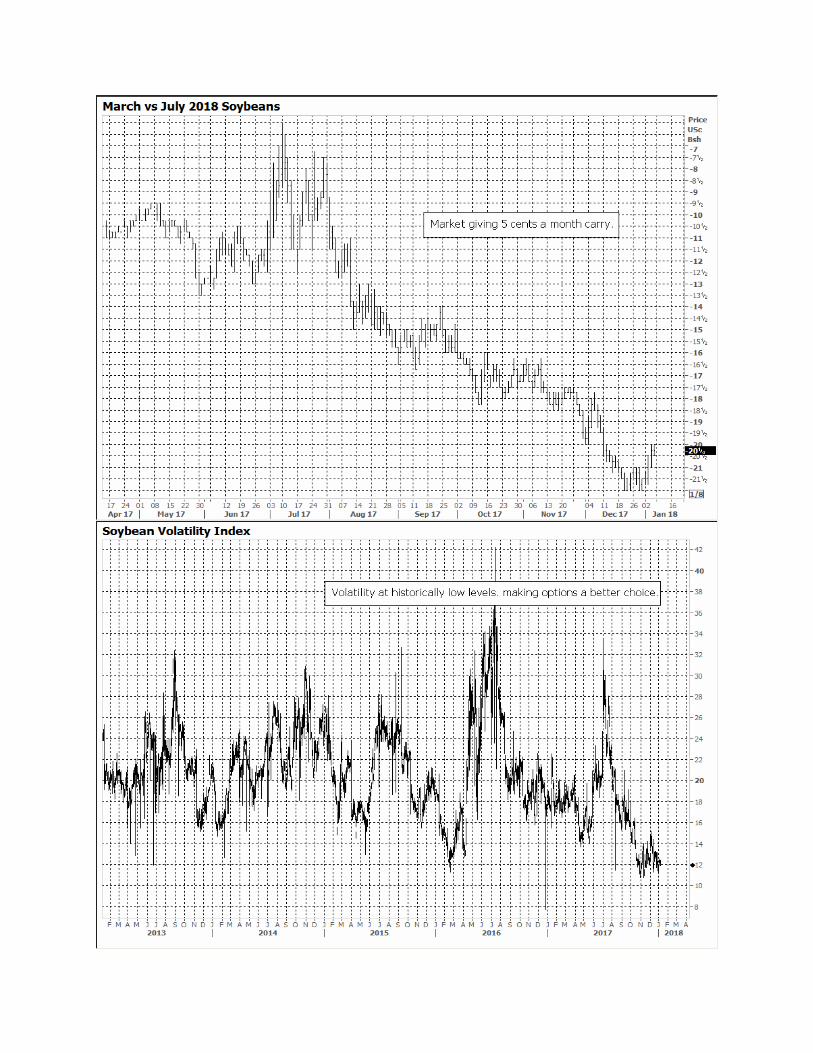
Soybeans face make or break moment Futures need a two-fer to avoid losses By Bryce Knorr, senior grain market analyst A year ago USDA shocked the market by cutting its forecast of soybean production, helping trigger a rally that gave growers a shot at selling their record yields for a profit. But it may take even more dramatic news from the agency Jan. 12 to avoid a market that keeps falling into February. Weather in South America is also at a turning point that could be the difference. The seasonal chart for soybeans shows what a crucial time this is. In years of good production futures normally head south for the next month or so. In bullish years the move is higher. Last year was the outlier, as prices rallied despite what was a still good crop. USDA could pull another surprise about yields this year if our Farm Futures survey is on the money. We found average yields down a half bushel per acre from USDA’s last estimate in November, down to 49 bpa. But the impact on production was limited by an increase in acres. Output fell to 4.404 billion bushels, only 21 below the November projection from the government. Moreover, it’s tough to be bullish on demand. My forecast for ending stocks is just a bushel lower than November at 444 million. Crush could be stronger than forecast due to reduced production in Argentina, the world’s largest exporter of soy products. But exports are off to a very slow start. USDA cut its forecast of sales in December and may make another reduction this month. Harvest is underway in the center-west of Brazil, where production again looks big. Dry conditions in Argentina will cut the harvest there but gains to the north should offset some of these losses. And Brazil is still selling some of its huge crop from a year ago, providing unneeded competition for the U.S. Cash prices out of the Gulf are lower than Brazil, but better quality from South America is apparently keeping its beans competitive. Old crop prices normally recover after the February break, but growers should be focusing on new crop now. I’ve recommended being mostly out of 2016 production after getting multiple chances to sell for a profit. The average U.S. cost of production for 2017 was around $9.15 a bushel, which was available in the cash market despite weak basis. Growers still needing to make sales should look at carry of five cents a month in the futures market and determine what it does to their bottom line. Implied volatility in the options market is trading at historically very cheap levels, making this another alternative. Soybean production costs per bushel on paper are starting the year looking higher. November futures normally follow the trend seen in old crop, breaking into February. But anything over $10 is a place to start making some sales, to lock in a base going forward. Soybeans should continue to attract plenty of acres in 2018 due to lower costs and better prospects for profits – or limiting losses. Chinese demand overall remains good but the U.S. has more competition than ever for that market. A resurgent vegetable oil market could help provide support into spring but normally can go only so far in sparking rallies. Most of the bean’s value comes from meal. Exports are better but not enough to make a significant difference on prices right now. Any rally in soybeans could trigger short-covering, giving the market additional lift. Funds are big sellers, despite all the talk about commodities gaining favor again in 2018. Soybeans show strong inverse correlations to both stocks and crude oil, the markets that are on fire.
Transcript
Soybeans face make or break moment Futures need a two-fer to avoid losses By Bryce Knorr, senior grain market analyst A year ago USDA shocked the market by cutting its forecast of soybean production, helping trigger a rally that gave growers a shot at selling their record yields for a profit. But it may take even more dramatic news from the agency Jan. 12 to avoid a market that keeps falling into February. Weather in South America is also at a turning point that could be the difference. The seasonal chart for soybeans shows what a crucial time this is. In years of good production futures normally head south for the next month or so. In bullish years the move is higher. Last year was the outlier, as prices rallied despite what was a still good crop. USDA could pull another surprise about yields this year if our Farm Futures survey is on the money. We found average yields down a half bushel per acre from USDA’s last estimate in November, down to 49 bpa. But the impact on production was limited by an increase in acres. Output fell to 4.404 billion bushels, only 21 below the November projection from the government. Moreover, it’s tough to be bullish on demand. My forecast for ending stocks is just a bushel lower than November at 444 million. Crush could be stronger than forecast due to reduced production in Argentina, the world’s largest exporter of soy products. But exports are off to a very slow start. USDA cut its forecast of sales in December and may make another reduction this month. Harvest is underway in the center-west of Brazil, where production again looks big. Dry conditions in Argentina will cut the harvest there but gains to the north should offset some of these losses. And Brazil is still selling some of its huge crop from a year ago, providing unneeded competition for the U.S. Cash prices out of the Gulf are lower than Brazil, but better quality from South America is apparently keeping its beans competitive. Old crop prices normally recover after the February break, but growers should be focusing on new crop now. I’ve recommended being mostly out of 2016 production after getting multiple chances to sell for a profit. The average U.S. cost of production for 2017 was around $9.15 a bushel, which was available in the cash market despite weak basis. Growers still needing to make sales should look at carry of five cents a month in the futures market and determine what it does to their bottom line. Implied volatility in the options market is trading at historically very cheap levels, making this another alternative. Soybean production costs per bushel on paper are starting the year looking higher. November futures normally follow the trend seen in old crop, breaking into February. But anything over $10 is a place to start making some sales, to lock in a base going forward. Soybeans should continue to attract plenty of acres in 2018 due to lower costs and better prospects for profits – or limiting losses. Chinese demand overall remains good but the U.S. has more competition than ever for that market. A resurgent vegetable oil market could help provide support into spring but normally can go only so far in sparking rallies. Most of the bean’s value comes from meal. Exports are better but not enough to make a significant difference on prices right now. Any rally in soybeans could trigger short-covering, giving the market additional lift. Funds are big sellers, despite all the talk about commodities gaining favor again in 2018. Soybeans show strong inverse correlations to both stocks and crude oil, the markets that are on fire.
% Up 58% 53% 44% 49% 51% 53%% Down 42% 44% 56% 51% 47% 47%Ave. Gain - Up year 19.0 19.7 24.6 32.3 30.1 44.3 Ave Loss - Down Year (24.4) (33.9) (33.2) (32.0) (39.4) (41.6) Biggest Gain 58.0 51.3 84.8 104.0 91.8 135.8 Biggest Loss (55.5) (83.5) (100.5) (96.5) (98.5) (141.8)
This table shows the typical seasonal pattern at weekly intervals from the start date, based onaverage daily futures prices from 1974-2016. Gains and losses are based on the difference between the closing price on the start date and the closing price on the weekly date shown.