Page 1
Stock Market Briefing:S&P 500/400/600 Weekly
Forward Earnings & ValuationYardeni Research, Inc.
May 16, 2018
Dr. Edward Yardeni516-972-7683
[email protected]
Joe Abbott732-497-5306
[email protected]
Please visit our sites atwww.yardeni.comblog.yardeni.com
thinking outside the box
Page 2
Table Of Contents Table Of ContentsTable Of Contents
May 16, 2018 / S&P 500/400/600 Weekly Forward Earnings & Valuation www.yardeni.com
Yardeni Research, Inc.
S&P 500/400/600 Annual Earnings 3S&P 500/400/600 Annual Revenues 4S&P 500/400/600 Annual Margins 5S&P 500 Annual & Quarterly Earnings 6S&P 400 Annual & Quarterly Earnings 7S&P 600 Annual & Quarterly Earnings 8S&P 500/400/600 2018 Quarterly Earnings 9S&P 500/400/600 2018 Quarterly Y/Y Earnings Growth 10S&P 500/400/600 Indexes & Forward Earnings 11S&P 500/400/600 Forward Revenues & Margins 12S&P 500/400/600 P/Es 13S&P 500/400/600 P/Sales 14S&P 500 Revenues, Earnings, & Margins 15S&P 400 Revenues, Earnings, & Margins 16S&P 600 Revenues, Earnings, & Margins 17S&P 500/400/600 Blue Angels 18S&P 500 Forward Revenues & Earnings 19S&P 500/400/600 Sectors Forward Earnings 20S&P 500/400/600 Sectors Annual Earnings: 2018 21S&P 500/400/600 Sectors Annual Earnings: 2019 22S&P 500 Sectors Forward Earnings 23S&P 500 Sectors Forward Revenues 24S&P 500 Sectors Forward Profit Margin 25S&P 500 Sectors Forward P/Es 26S&P 500 Sectors Forward P/Sales 27S&P 500 Sectors Net Earnings Revisions Index 28S&P 500 Sectors Net Revenue Revisions Index 29S&P 400 Sectors Forward Earnings 30S&P 400 Sectors Forward Revenues 31S&P 400 Sectors Forward Profit Margin 32S&P 400 Sectors Forward P/Es 33S&P 400 Sectors Forward P/Sales 34S&P 400 Sectors Net Earnings Revisions Index 35
continued...
Page 3
May 16, 2018 / S&P 500/400/600 Weekly Forward Earnings & Valuation www.yardeni.com
Yardeni Research, Inc.
S&P 400 Sectors Net Revenue Revisions Index 36S&P 600 Sectors Forward Earnings 37S&P 600 Sectors Forward Revenues 38S&P 600 Sectors Forward Profit Margin 39S&P 600 Sectors Forward P/Es 40S&P 600 Sectors Forward P/Sales 41S&P 600 Sectors Net Earnings Revisions Index 42S&P 600 Sectors Net Revenue Revisions Index 43S&P 500/400/600 Sectors Forward Profit Margin 44S&P 500/400/600 Sectors Forward P/Es 45S&P 500/400/600 Sectors Forward P/Sales 46
Page 4
Figure 1.
2003 2004 2005 2006 2007 2008 2009 2010 2011 2012 2013 2014 2015 2016 2017 2018 2019 202050
75
100
125
150
175
200
50
75
100
125
150
175
200
2018 2019 Frwd May 3 160.14 175.48 165.45 May 10 160.40 175.72 166.00
17 1819
5/10
S&P 500 OPERATING EARNINGS PER SHARE(consensus analysts’ estimates in dollars, weekly, ratio scale)
Consensus Forecasts
Annual Earnings
Forward Earnings*
2003 2004 2005 2006 2007 2008 2009 2010 2011 2012 2013 2014 2015 2016 2017 2018 2019 202025
45
65
85
105
125
145
25
45
65
85
105
125
145
2018 2019 Frwd May 3 111.44 124.90 116.10 May 10 111.87 125.27 116.77
17 18
19 5/10
S&P 400
Consensus Forecasts
Annual Earnings
Forward Earnings*
2003 2004 2005 2006 2007 2008 2009 2010 2011 2012 2013 2014 2015 2016 2017 2018 2019 202010
20
30
40
50
60
70
10
20
30
40
50
60
70
2018 2019 Frwd May 3 52.51 61.30 55.55 May 10 52.93 61.82 56.18
1718
195/10
S&P 600
Consensus Forecasts
Annual Earnings
Forward Earnings*
* Time-weighted average of consensus estimates for current and next year.Source: Thomson Reuters I/B/E/S.
yardeni.com
S&P 500/400/600 Annual Earnings
Page 3 / May 16, 2018 / S&P 500/400/600 Weekly Forward Earnings & Valuation www.yardeni.com
Yardeni Research, Inc.
Page 5
Figure 2.
2006 2007 2008 2009 2010 2011 2012 2013 2014 2015 2016 2017 2018 2019900
1000
1100
1200
1300
1400
900
1000
1100
1200
1300
1400
18
19 5/10
17
S&P 500 REVENUES PER SHARE(consensus analysts estimates in dollars, weekly, ratio scale)
Consensus ForecastsAnnual RevenuesForward Revenues*
2006 2007 2008 2009 2010 2011 2012 2013 2014 2015 2016 2017 2018 2019600
800
1000
1200
1400
1600
600
800
1000
1200
1400
1600
1819 5/10
17
S&P 400
Consensus ForecastsAnnual RevenuesForward Revenues*
2006 2007 2008 2009 2010 2011 2012 2013 2014 2015 2016 2017 2018 2019350
475
600
725
850
975
1100
350
475
600
725
850
975
1100
17
18
19
5/10S&P 600
Consensus ForecastsAnnual RevenuesForward Revenues*
* Time-weighted average of consensus revenue estimates for current and next year.Source: Thomson Reuters I/B/E/S.
yardeni.com
S&P 500/400/600 Annual Revenues
Page 4 / May 16, 2018 / S&P 500/400/600 Weekly Forward Earnings & Valuation www.yardeni.com
Yardeni Research, Inc.
Page 6
Figure 3.
2006 2007 2008 2009 2010 2011 2012 2013 2014 2015 2016 2017 2018 20196
7
8
9
10
11
12
13
6
7
8
9
10
11
12
13
1819
5/1017
S&P 500 PROFIT MARGIN(using analysts average earnings and sales forecasts, percent)
Consensus Forecasts
Forward Margins* (12.2)
Annual Margins
2006 2007 2008 2009 2010 2011 2012 2013 2014 2015 2016 2017 2018 20194
5
6
7
8
9
4
5
6
7
8
9
18
195/10
17
S&P 400
Consensus Forecasts
Forward Margins* (7.5)
Annual Margins
2006 2007 2008 2009 2010 2011 2012 2013 2014 2015 2016 2017 2018 20193
4
5
6
7
3
4
5
6
7
17
18
195/10
yardeni.com
S&P 600
Consensus Forecasts
Forward Margins* (5.4)
Annual Margins
* Time-weighted average of the consensus estimates for current and next year. Source: Thomson Reuters I/B/E/S and Standard & Poor’s.
S&P 500/400/600 Annual Margins
Page 5 / May 16, 2018 / S&P 500/400/600 Weekly Forward Earnings & Valuation www.yardeni.com
Yardeni Research, Inc.
Page 7
2003 2004 2005 2006 2007 2008 2009 2010 2011 2012 2013 2014 2015 2016 2017 2018 2019 202050
75
100
125
150
175
200
50
75
100
125
150
175
200
2018 2019 Frwd May 3 160.14 175.48 165.45 May 10 160.40 175.72 166.00
17 18
195/10
S&P 500 OPERATING EARNINGS PER SHARE(analysts’ consensus estimates, dollars, weekly, ratio scale)
Consensus ForecastsAnnualForward*
* Time-weighted average of consensus estimates for current year and next year.Source: Thomson Reuters I/B/E/S.
yardeni.com
Figure 4.
I II III IV I II III IV I II2017 2018 2019
32
34
36
38
40
42
44
32
34
36
38
40
42
44
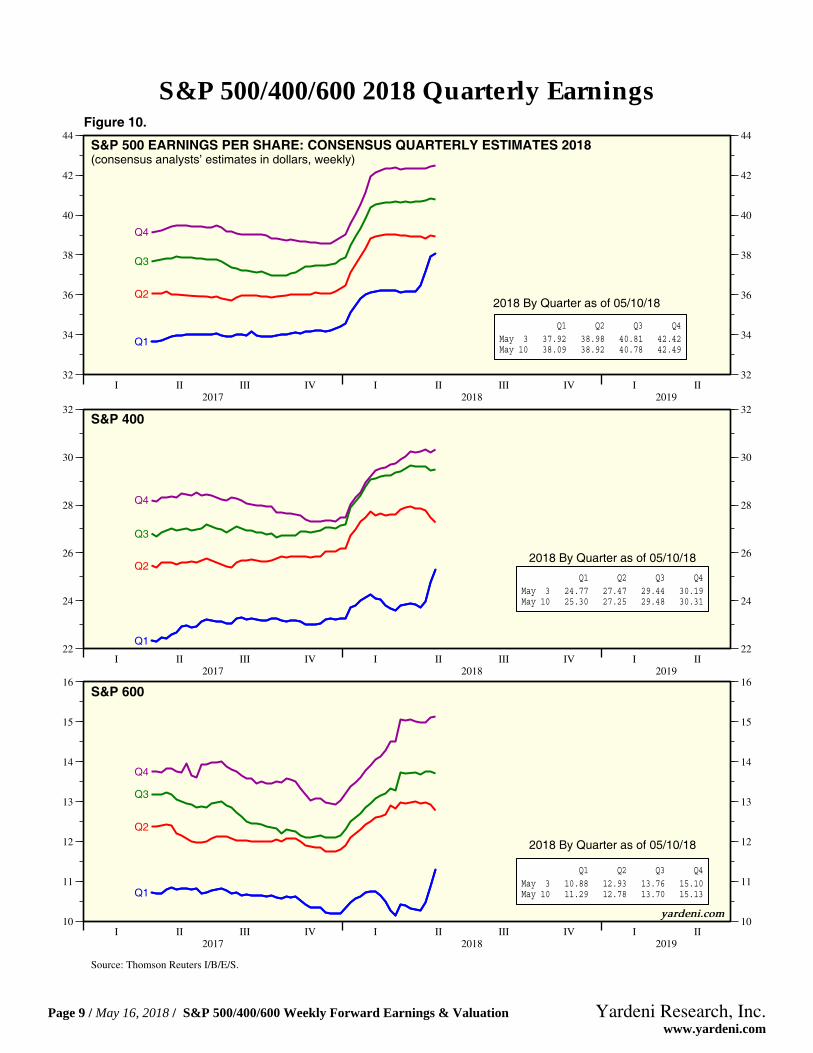
Q1 Q2 Q3 Q4 May 3 37.92 38.98 40.81 42.42 May 10 38.09 38.92 40.78 42.49
Q1
Q2
Q3
Q4
2018 By Quarter as of 05/10/18
Source: Thomson Reuters I/B/E/S.
yardeni.com
S&P 500 OPERATING EARNINGS PER SHARE: QUARTERLY FORECASTS 2018(analysts’ consensus estimates, dollars, weekly)
Figure 5.
S&P 500 Annual & Quarterly Earnings
Page 6 / May 16, 2018 / S&P 500/400/600 Weekly Forward Earnings & Valuation www.yardeni.com
Yardeni Research, Inc.
Page 8
2003 2004 2005 2006 2007 2008 2009 2010 2011 2012 2013 2014 2015 2016 2017 2018 2019 202025
45
65
85
105
125
145
25
45
65
85
105
125
145
2018 2019 Frwd May 3 111.44 124.90 116.10 May 10 111.87 125.27 116.77
17 18
19 5/10
S&P 400 MIDCAP OPERATING EARNINGS PER SHARE*(consensus analysts’ estimates in dollars, weekly)
Consensus ForecastsAnnual
52-Week Forward*
* Time-weighted average of the current year’s and next year’s consensus earnings estimates.Source: Thomson Reuters I/B/E/S.
yardeni.com
Figure 6.
I II III IV I II III IV I II2017 2018 2019
22
24
26
28
30
32
22
24
26
28
30
32
Q1 Q2 Q3 Q4 May 3 24.77 27.47 29.44 30.19 May 10 25.30 27.25 29.48 30.31
Q1
Q2
Q3
Q4
2018 By Quarter as of 05/10/18
Source: Thomson Reuters I/B/E/S.
yardeni.com
S&P 400 MIDCAP EARNINGS PER SHARE: CONSENSUS QUARTERLY ESTIMATES 2018(consensus analysts’ estimates in dollars, weekly)
Figure 7.
S&P 400 Annual & Quarterly Earnings
Page 7 / May 16, 2018 / S&P 500/400/600 Weekly Forward Earnings & Valuation www.yardeni.com
Yardeni Research, Inc.
Page 9
2003 2004 2005 2006 2007 2008 2009 2010 2011 2012 2013 2014 2015 2016 2017 2018 2019 202010
20
30
40
50
60
70
10
20
30
40
50
60
70
2018 2019 Frwd May 3 52.51 61.30 55.55 May 10 52.93 61.82 56.18
1718
195/10
S&P 600 SMALLCAP OPERATING EARNINGS PER SHARE(consensus analysts estimates in dollars, weekly)
Consensus Forecasts
Annual
52-Week Forward*
* Time-weighted average of consensus operating earnings estimates for current and next year.Source: Thomson Reuters I/B/E/S.
yardeni.com
Figure 8.
I II III IV I II III IV I II2017 2018 2019
10
11
12
13
14
15
16
10
11
12
13
14
15
16
Q1 Q2 Q3 Q4 May 3 10.88 12.93 13.76 15.10 May 10 11.29 12.78 13.70 15.13
Q1
Q2
Q3
Q4
2018 By Quarter as of 05/10/18
Source: Thomson Reuters I/B/E/S.
yardeni.com
S&P 600 SMALLCAP EARNINGS PER SHARE: CONSENSUS QUARTERLY ESTIMATES 2018(consensus analysts’ estimates in dollars, weekly)
Figure 9.
S&P 600 Annual & Quarterly Earnings
Page 8 / May 16, 2018 / S&P 500/400/600 Weekly Forward Earnings & Valuation www.yardeni.com
Yardeni Research, Inc.
Page 10
Figure 10.
I II III IV I II III IV I II2017 2018 2019
32
34
36
38
40
42
44
32
34
36
38
40
42
44
Q1 Q2 Q3 Q4 May 3 37.92 38.98 40.81 42.42 May 10 38.09 38.92 40.78 42.49
Q1
Q2
Q3
Q4
2018 By Quarter as of 05/10/18
S&P 500 EARNINGS PER SHARE: CONSENSUS QUARTERLY ESTIMATES 2018(consensus analysts’ estimates in dollars, weekly)
I II III IV I II III IV I II2017 2018 2019
22
24
26
28
30
32
22
24
26
28
30
32
Q1 Q2 Q3 Q4 May 3 24.77 27.47 29.44 30.19 May 10 25.30 27.25 29.48 30.31
Q1
Q2
Q3
Q4
2018 By Quarter as of 05/10/18
S&P 400
I II III IV I II III IV I II2017 2018 2019
10
11
12
13
14
15
16
10
11
12
13
14
15
16
Q1 Q2 Q3 Q4 May 3 10.88 12.93 13.76 15.10 May 10 11.29 12.78 13.70 15.13 Q1
Q2
Q3
Q4
2018 By Quarter as of 05/10/18
Source: Thomson Reuters I/B/E/S.
yardeni.com
S&P 600
S&P 500/400/600 2018 Quarterly Earnings
Page 9 / May 16, 2018 / S&P 500/400/600 Weekly Forward Earnings & Valuation www.yardeni.com
Yardeni Research, Inc.
Page 11
Figure 11.
I II III IV I II III IV I II2017 2018 2019
8
10
12
14
16
18
20
22
24
26
8
10
12
14
16
18
20
22
24
26
Q1 Q2 Q3 Q4 May 3 22.7 19.6 22.0 17.8 May 10 23.3 19.5 21.9 18.0
Q1
Q2
Q3
2018 By Quarter as of 05/10/18
S&P 500 CONSENSUS QUARTERLY Y/Y EPS GROWTH 2018(consensus analysts’ estimates in percent, weekly)
Q4
I II III IV I II III IV I II2017 2018 2019
10
15
20
25
30
10
15
20
25
30
Q1 Q2 Q3 Q4 May 3 22.0 18.6 26.1 18.8 May 10 24.6 17.7 26.3 19.2
Q1
Q2Q3
2018 By Quarter as of 05/10/18
S&P 400
Q4
I II III IV I II III IV I II2017 2018 2019
15
20
25
30
35
40
15
20
25
30
35
40
Q1 Q2 Q3 Q4 May 3 25.1 32.9 38.8 25.5 May 10 29.8 31.3 38.2 25.8
Q1
Q2Q3Q4
2018 By Quarter as of 05/10/18
Source: Thomson Reuters I/B/E/S.
yardeni.com
S&P 600
S&P 500/400/600 2018 Quarterly Y/Y Earnings Growth
Page 10 / May 16, 2018 / S&P 500/400/600 Weekly Forward Earnings & Valuation www.yardeni.com
Yardeni Research, Inc.
Page 12
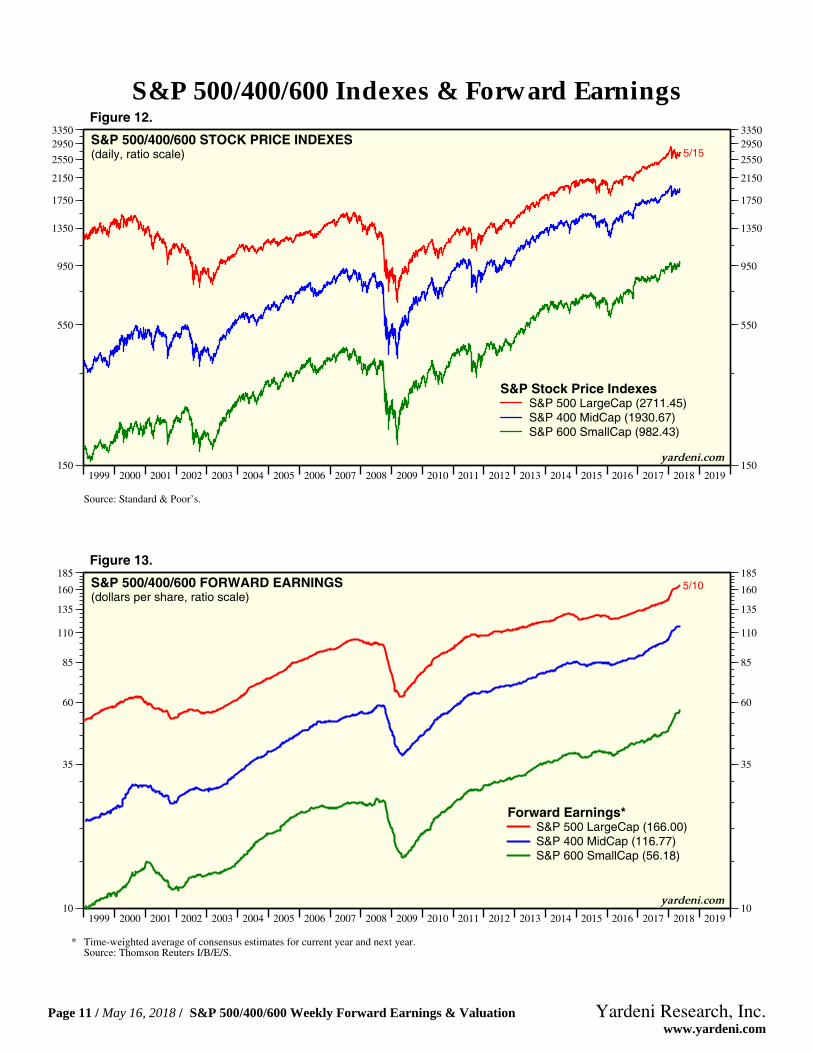
1999 2000 2001 2002 2003 2004 2005 2006 2007 2008 2009 2010 2011 2012 2013 2014 2015 2016 2017 2018 2019150
550
950
1350
1750
2150
2550
29503350
150
550
950
1350
1750
2150
2550
29503350
5/15S&P 500/400/600 STOCK PRICE INDEXES(daily, ratio scale)
S&P Stock Price IndexesS&P 500 LargeCap (2711.45)S&P 400 MidCap (1930.67)S&P 600 SmallCap (982.43)
Source: Standard & Poor’s.
yardeni.com
Figure 12.
1999 2000 2001 2002 2003 2004 2005 2006 2007 2008 2009 2010 2011 2012 2013 2014 2015 2016 2017 2018 201910
35
60
85
110
135
160
185
10
35
60
85
110
135
160
1855/10S&P 500/400/600 FORWARD EARNINGS
(dollars per share, ratio scale)
Forward Earnings*S&P 500 LargeCap (166.00)S&P 400 MidCap (116.77)S&P 600 SmallCap (56.18)
* Time-weighted average of consensus estimates for current year and next year.Source: Thomson Reuters I/B/E/S.
yardeni.com
Figure 13.
S&P 500/400/600 Indexes & Forward Earnings
Page 11 / May 16, 2018 / S&P 500/400/600 Weekly Forward Earnings & Valuation www.yardeni.com
Yardeni Research, Inc.
Page 13
2004 2005 2006 2007 2008 2009 2010 2011 2012 2013 2014 2015 2016 2017 2018 2019275
475
675
875
1075
1275
1475
1675
275
475
675
875
1075
1275
1475
1675
5/10
S&P 500/400/600 FORWARD REVENUES(dollars per share, ratio scale)
Forward Revenues*S&P 500 LargeCap (1350)S&P 400 MidCap (1490)S&P 600 SmallCap (988)
* Time-weighted average of consensus estimates for current year and next year.Source: Thomson Reuters I/B/E/S.
yardeni.com
Figure 14.
2006 2007 2008 2009 2010 2011 2012 2013 2014 2015 2016 2017 2018 20193
4
5
6
7
8
9
10
11
12
13
3
4
5
6
7
8
9
10
11
12
13
5/10
yardeni.com
S&P FORWARD PROFIT MARGINS*(using analysts average earnings and sales forecasts, percent)
S&P 500 (12.2)S&P 400 (7.5)S&P 600 (5.4)
* Time-weighted average of the consensus estimates for current and next year.Source: Thomson Reuters I/B/E/S and Standard & Poor’s.
Figure 15.
S&P 500/400/600 Forward Revenues & Margins
Page 12 / May 16, 2018 / S&P 500/400/600 Weekly Forward Earnings & Valuation www.yardeni.com
Yardeni Research, Inc.
Page 14
1999 2000 2001 2002 2003 2004 2005 2006 2007 2008 2009 2010 2011 2012 2013 2014 2015 2016 2017 2018 20198
10
12
14
16
18
20
22
24
26
28
8
10
12
14
16
18
20
22
24
26
28
5/11
FORWARD P/E RATIOS FOR S&P INDEXES*(weekly)
S&P 500 LargeCap (16.4)S&P 400 MidCap (16.6)S&P 600 SmallCap (17.6)
* Price divided by 52-week forward consensus expected operating earnings per share.Source: Thomson Reuters I/B/E/S.
yardeni.com
Figure 16.
1999 2000 2001 2002 2003 2004 2005 2006 2007 2008 2009 2010 2011 2012 2013 2014 2015 2016 2017 2018 20198
10
12
14
16
18
20
22
24
26
28
8
10
12
14
16
18
20
22
24
26
28
5/15
FORWARD P/E RATIOS FOR S&P STOCK PRICE INDEXES*(daily)
S&P 500 LargeCap (16.3)S&P 400 MidCap (16.5)S&P 600 SmallCap (17.5)
* Daily stock price index divided by 52-week forward consensus expected operating earnings per share.Source: Thomson Reuters I/B/E/S and Standard & Poor’s.
yardeni.com
Figure 17.
S&P 500/400/600 P/Es
Page 13 / May 16, 2018 / S&P 500/400/600 Weekly Forward Earnings & Valuation www.yardeni.com
Yardeni Research, Inc.
Page 15
2004 2005 2006 2007 2008 2009 2010 2011 2012 2013 2014 2015 2016 2017 2018 2019.4
.6
.8
1.0
1.2
1.4
1.6
1.8
2.0
2.2
2.4
.4
.6
.8
1.0
1.2
1.4
1.6
1.8
2.0
2.2
2.4
5/10
FORWARD P/SALES RATIOS FOR S&P STOCK PRICE INDEXES*(weekly)
S&P 500 LargeCap (2.00)S&P 400 MidCap (1.29)S&P 600 SmallCap (0.99)
* Price divided by 52-week forward consensus expected revenues per share.Source: Thomson Reuters I/B/E/S.
yardeni.com
Figure 18.
2013 2014 2015 2016 2017 2018 2019.8
1.0
1.2
1.4
1.6
1.8
2.0
2.2
2.4
.8
1.0
1.2
1.4
1.6
1.8
2.0
2.2
2.4
5/15
FORWARD P/SALES RATIOS FOR S&P STOCK PRICE INDEXES*(daily)
S&P 500 LargeCap (2.01)S&P 400 MidCap (1.30)S&P 600 SmallCap (0.99)
* Daily stock price index divided by 52-week forward consensus expected revenues per share.Source: Thomson Reuters I/B/E/S and Standard & Poor’s Corporation.
yardeni.com
Figure 19.
S&P 500/400/600 P/Sales
Page 14 / May 16, 2018 / S&P 500/400/600 Weekly Forward Earnings & Valuation www.yardeni.com
Yardeni Research, Inc.
Page 16
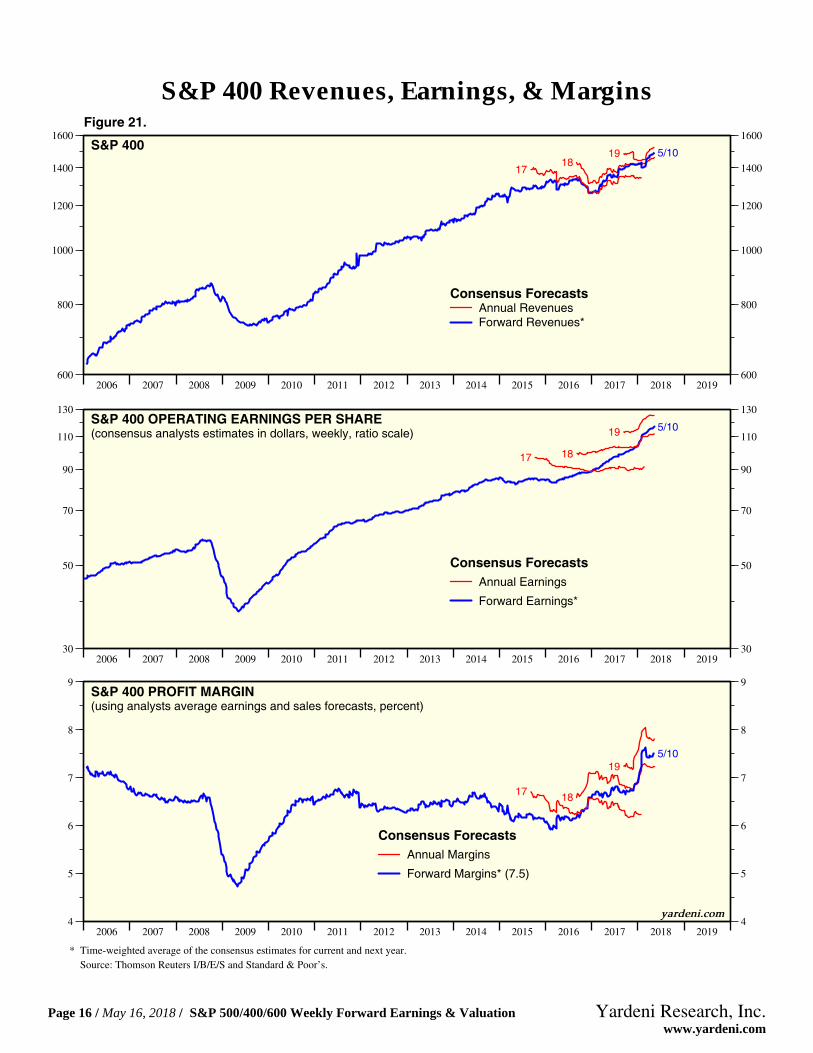
Figure 20.
2006 2007 2008 2009 2010 2011 2012 2013 2014 2015 2016 2017 2018 2019900
1000
1100
1200
1300
1400
900
1000
1100
1200
1300
1400
18
19 5/10
17
S&P 500 REVENUES PER SHARE(consensus analysts estimates in dollars, weekly, ratio scale)
Consensus ForecastsAnnual RevenuesForward Revenues*
2006 2007 2008 2009 2010 2011 2012 2013 2014 2015 2016 2017 2018 201950
75
100
125
150
175
200
50
75
100
125
150
175
200
5/10
17 1819
S&P 500 OPERATING EARNINGS PER SHARE(consensus analysts estimates in dollars, weekly, ratio scale)
Consensus ForecastsAnnual EarningsForward Earnings*
2006 2007 2008 2009 2010 2011 2012 2013 2014 2015 2016 2017 2018 20196
7
8
9
10
11
12
13
6
7
8
9
10
11
12
13
1819
5/1017
yardeni.com
S&P 500 PROFIT MARGIN(using analysts average earnings and sales forecasts, percent)
Consensus Forecasts
Forward Margins* (12.2)Annual Margins
* Time-weighted average of the consensus estimates for current and next year. Source: Thomson Reuters I/B/E/S and Standard & Poor’s.
S&P 500 Revenues, Earnings, & Margins
Page 15 / May 16, 2018 / S&P 500/400/600 Weekly Forward Earnings & Valuation www.yardeni.com
Yardeni Research, Inc.
Page 17
Figure 21.
2006 2007 2008 2009 2010 2011 2012 2013 2014 2015 2016 2017 2018 2019600
800
1000
1200
1400
1600
600
800
1000
1200
1400
1600
1819 5/10
17
S&P 400
Consensus ForecastsAnnual RevenuesForward Revenues*
2006 2007 2008 2009 2010 2011 2012 2013 2014 2015 2016 2017 2018 201930
50
70
90
110
130
30
50
70
90
110
130
5/10
17 18
19S&P 400 OPERATING EARNINGS PER SHARE(consensus analysts estimates in dollars, weekly, ratio scale)
Consensus ForecastsAnnual Earnings
Forward Earnings*
2006 2007 2008 2009 2010 2011 2012 2013 2014 2015 2016 2017 2018 20194
5
6
7
8
9
4
5
6
7
8
9
18
195/10
17
yardeni.com
S&P 400 PROFIT MARGIN(using analysts average earnings and sales forecasts, percent)
Consensus Forecasts
Forward Margins* (7.5)
Annual Margins
* Time-weighted average of the consensus estimates for current and next year. Source: Thomson Reuters I/B/E/S and Standard & Poor’s.
S&P 400 Revenues, Earnings, & Margins
Page 16 / May 16, 2018 / S&P 500/400/600 Weekly Forward Earnings & Valuation www.yardeni.com
Yardeni Research, Inc.
Page 18
Figure 22.
2006 2007 2008 2009 2010 2011 2012 2013 2014 2015 2016 2017 2018 2019350
475
600
725
850
975
1100
350
475
600
725
850
975
1100
17
18
19
5/10S&P 600 REVENUES PER SHARE(consensus analysts estimates in dollars, weekly, ratio scale)
Consensus ForecastsAnnual Revenues
Forward Revenues*
2006 2007 2008 2009 2010 2011 2012 2013 2014 2015 2016 2017 2018 201915
25
35
45
55
65
15
25
35
45
55
65
5/10
1718
19
S&P 600 OPERATING EARNINGS PER SHARE(consensus analysts estimates in dollars, weekly, ratio scale)
Consensus ForecastsAnnual Earnings
Forward Earnings*
2006 2007 2008 2009 2010 2011 2012 2013 2014 2015 2016 2017 2018 20193
4
5
6
7
3
4
5
6
7
17
18
195/10
yardeni.com
S&P 600 PROFIT MARGIN(using analysts average earnings and sales forecasts, percent)
Consensus Forecasts
Forward Margins* (5.4)
Annual Margins
* Time-weighted average of the consensus estimates for current and next year. Source: Thomson Reuters I/B/E/S and Standard & Poor’s.
S&P 600 Revenues, Earnings, & Margins
Page 17 / May 16, 2018 / S&P 500/400/600 Weekly Forward Earnings & Valuation www.yardeni.com
Yardeni Research, Inc.
Page 19
Figure 23.
2007 2008 2009 2010 2011 2012 2013 2014 2015 2016 2017 2018 2019500
1000
1500
2000
2500
3000
3500
500
1000
1500
2000
2500
3000
3500
x10
x12
x14
x16
x18
x20S&P STOCK PRICE INDEXES, FORWARD EARNINGS, & VALUATIONS&P 50005/15/18
S&P 500 Blue AngelsImplied Price Index*05/10/18
2007 2008 2009 2010 2011 2012 2013 2014 2015 2016 2017 2018 2019300
600
900
1200
1500
1800
2100
2400
2700
300
600
900
1200
1500
1800
2100
2400
2700
x10
x12
x14
x16
X18
X20S&P 40005/15/18
S&P 400 Blue AngelsImplied Price Index*05/10/18
2007 2008 2009 2010 2011 2012 2013 2014 2015 2016 2017 2018 2019100
300
500
700
900
1100
1300
100
300
500
700
900
1100
1300
x10
x12
x14
x16
x18
x20
x22
S&P 50005/15/18 05/15/18
S&P 600 Blue AngelsImplied Price Index*05/10/18
* Implied stock price index calculated using actual 52-week consensus expected forward earnings times hypothetical forward P/Es.Source: Standard & Poors and Thomson Reuters I/B/E/S.
yardeni.com
S&P 500/400/600 Blue Angels
Page 18 / May 16, 2018 / S&P 500/400/600 Weekly Forward Earnings & Valuation www.yardeni.com
Yardeni Research, Inc.
Page 20
79 80 81 82 83 84 85 86 87 88 89 90 91 92 93 94 95 96 97 98 99 00 01 02 03 04 05 06 07 08 09 10 11 12 13 14 15 16 17 18 19 2010
35
60
85
110
135
160
185210
10
35
60
85
110
135
160
185210
S&P 500 FORWARD EARNINGS& REVENUES PER SHARE
(ratio scale)
5/10
ForwardEarnings* (166.0)
ForwardRevenues*Divided by 10 (135.0)
7% GrowthRate**
* Time-weighted average of consensus estimates for current and next year. Monthly through April 1994, then weekly.** Compounded monthly to yield 7% annually.
Note: Shaded areas denote recessions according to the National Bureau of Economic Research.Source: Thomson Reuters I/B/E/S.
yardeni.com
Figure 24.
2008 2009 2010 2011 2012 2013 2014 2015 2016 2017 2018 2019-5
0
5
10
15
20
25
-5
0
5
10
15
20
25
11
12 1314
15
18
19
16
17
yardeni.com
Source: Thomson Reuters I/B/E/S.
S&P 500 OPERATING EARNINGS ANNUAL GROWTH FORECASTS*(based on analysts’ consensus estimates, percent, weekly)
2011 (14.9)2012 (6.0)2013 (6.1)2014 (7.0)2015 (0.5)2016 (1.5)2017 (11.2)2018 (21.5)2019 (9.7)
Latest data thru 05/10/18
Figure 25.
S&P 500 Forward Revenues & Earnings
Page 19 / May 16, 2018 / S&P 500/400/600 Weekly Forward Earnings & Valuation www.yardeni.com
Yardeni Research, Inc.
Page 21
Figure 26.
I II III IV I II III IV I II III IV I II III IV I II2014 2015 2016 2017 2018
0
10
20
30
40
50
60
70
80
90
0
10
20
30
40
50
60
70
80
90
5/10
S&P 500 SECTORS:FORWARD EARNINGS PER SHARE*
Consumer DiscretionaryConsumer StaplesEnergyFinancialsHealth CareIndustrials
Information TechnologyMaterialsReal EstateTelecommunication ServicesUtilities
I II III IV I II III IV I II III IV I II III IV I II2014 2015 2016 2017 2018
-20
0
20
40
60
80
100
120
140
-20
0
20
40
60
80
100
120
140
5/10
S&P 400 SECTORS: Consumer DiscretionaryConsumer StaplesEnergyFinancialsHealth CareIndustrials
Information TechnologyMaterialsReal EstateTelecommunication ServicesUtilities
I II III IV I II III IV I II III IV I II III IV I II2014 2015 2016 2017 2018
-40
-20
0
20
40
60
80
100
120
140
-40
-20
0
20
40
60
80
100
120
140
5/10
S&P 600 SECTORS: Consumer DiscretionaryConsumer StaplesEnergyFinancialsHealth CareIndustrials
Information TechnologyMaterialsReal EstateTelecommunication ServicesUtilities
* Time-weighted average of the consensus estimates for current and next year. Source: Thomson Reuters I/B/E/S.
yardeni.com
S&P 500/400/600 Sectors Forward Earnings
Page 20 / May 16, 2018 / S&P 500/400/600 Weekly Forward Earnings & Valuation www.yardeni.com
Yardeni Research, Inc.
Page 22
Figure 27.
I II III IV I II III IV I II III IV I II2016 2017 2018 2019
0
10
20
30
40
50
60
70
80
0
10
20
30
40
50
60
70
80
5/10
S&P 500 SECTORS:2018 EARNINGS PER SHARE*
Consumer DiscretionaryConsumer StaplesEnergyFinancialsHealth Care
IndustrialsInformation TechnologyMaterialsReal EstateTelecommunication ServicesUtilities
I II III IV I II III IV I II III IV I II2016 2017 2018 2019
-20
0
20
40
60
80
100
120
140
160
180
-20
0
20
40
60
80
100
120
140
160
180
5/10
S&P 400 SECTORS: Consumer DiscretionaryConsumer StaplesEnergyFinancialsHealth Care
IndustrialsInformation TechnologyMaterialsReal EstateTelecommunication ServicesUtilities
I II III IV I II III IV I II III IV I II2016 2017 2018 2019
-25
0
25
50
75
100
125
150
-25
0
25
50
75
100
125
150
5/10
S&P 600 SECTORS: Consumer DiscretionaryConsumer StaplesEnergyFinancialsHealth Care
IndustrialsInformation TechnologyMaterialsReal EstateTelecommunication ServicesUtilities
* Consensus expected operating earnings per share. Source: Thomson Reuters I/B/E/S.
yardeni.com
S&P 500/400/600 Sectors Annual Earnings: 2018
Page 21 / May 16, 2018 / S&P 500/400/600 Weekly Forward Earnings & Valuation www.yardeni.com
Yardeni Research, Inc.
Page 23
Figure 28.
I II III IV I II III IV I II III IV I II2017 2018 2019 2020
0
10
20
30
40
50
60
70
80
0
10
20
30
40
50
60
70
80
5/10
S&P 500 SECTORS:2019 EARNINGS PER SHARE*
Consumer DiscretionaryConsumer StaplesEnergyFinancialsHealth Care
IndustrialsInformation TechnologyMaterialsReal EstateTelecommunication ServicesUtilities
I II III IV I II III IV I II III IV I II2017 2018 2019 2020
-20
0
20
40
60
80
100
120
140
160
-20
0
20
40
60
80
100
120
140
160
5/10
S&P 400 SECTORS: Consumer DiscretionaryConsumer StaplesEnergyFinancialsHealth Care
IndustrialsInformation TechnologyMaterialsReal EstateTelecommunication ServicesUtilities
I II III IV I II III IV I II III IV I II2017 2018 2019 2020
-20
0
20
40
60
80
100
120
-20
0
20
40
60
80
100
120
5/10
S&P 600 SECTORS: Consumer DiscretionaryConsumer StaplesEnergyFinancialsHealth Care
IndustrialsInformation TechnologyMaterialsReal EstateTelecommunication ServicesUtilities
* Consensus expected operating earnings per share. Source: Thomson Reuters I/B/E/S.
yardeni.com
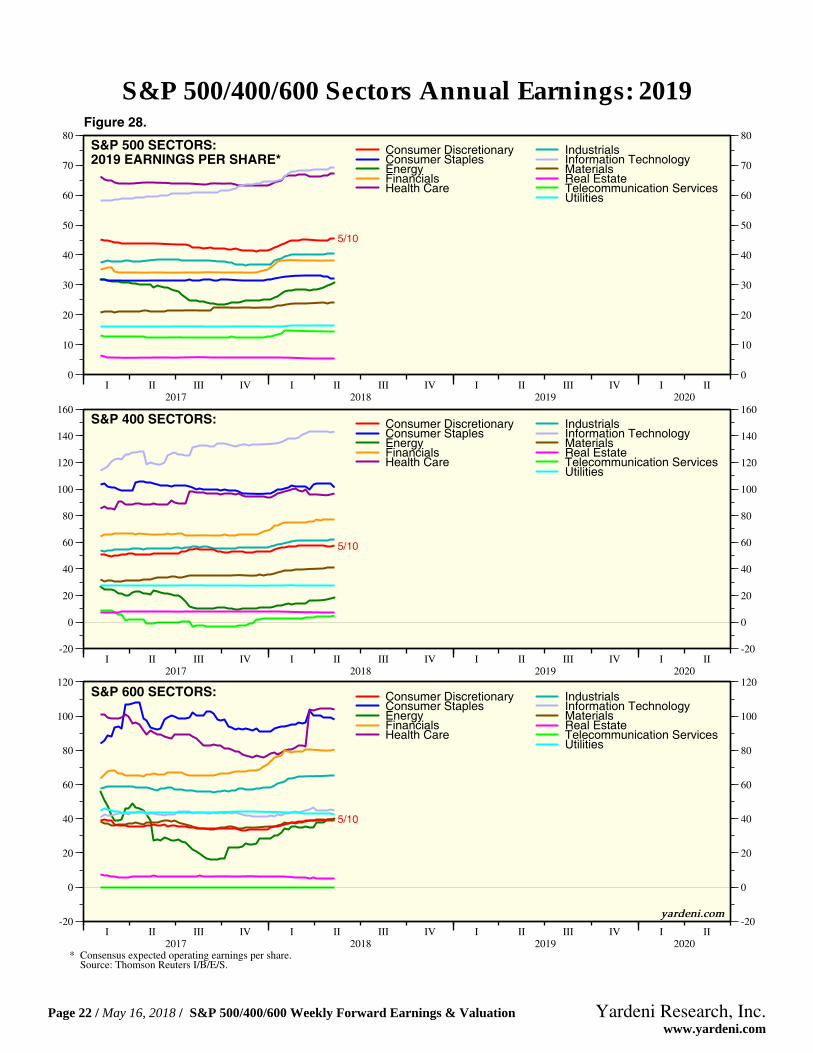
S&P 500/400/600 Sectors Annual Earnings: 2019
Page 22 / May 16, 2018 / S&P 500/400/600 Weekly Forward Earnings & Valuation www.yardeni.com
Yardeni Research, Inc.
Page 24
Figure 29.
06 07 08 09 10 11 12 13 14 15 16 17 18 1960
90
120
150
180210
18 19 5/10S&P 500(forward earnings*)
Annual consensusestimatesForward earnings
06 07 08 09 10 11 12 13 14 15 16 17 18 1913
19
25
31
3743
1819 5/10INDUSTRIALS
06 07 08 09 10 11 12 13 14 15 16 17 18 195
17
29
4153
18 19 5/10CONSUMER DISCRETIONARY
06 07 08 09 10 11 12 13 14 15 16 17 18 1915
30
45
60
75
1819 5/10INFORMATION TECHNOLOGY
06 07 08 09 10 11 12 13 14 15 16 17 18 1913
19
25
31
37
18 19 5/10CONSUMER STAPLES
06 07 08 09 10 11 12 13 14 15 16 17 18 196
11
16
21
26
1819 5/10MATERIALS
06 07 08 09 10 11 12 13 14 15 16 17 18 198
28
48
6888
108
18 195/10
ENERGY
06 07 08 09 10 11 12 13 14 15 16 17 18 191
3
5
79
19 5/1017 18REAL ESTATE
06 07 08 09 10 11 12 13 14 15 16 17 18 198
20
32
4456
1819 5/10
FINANCIALS
Includes Real Estatethrough September 2016
06 07 08 09 10 11 12 13 14 15 16 17 18 197
9
11
13
15
17
1819
5/10TELECOMMUNICATIONS SERVICES
06 07 08 09 10 11 12 13 14 15 16 17 18 1920
35
50
65
80
18 19 5/10HEALTH CARE
* Time-weighted average (in blue) of consensus operating earnings estimates for current and next year (in red). Source: Thomson Reuters I/B/E/S.
06 07 08 09 10 11 12 13 14 15 16 17 18 1911
12
13
14
15
161718
1819 5/10
UTILITIES
yardeni.com
S&P 500 Sectors Forward Earnings
Page 23 / May 16, 2018 / S&P 500/400/600 Weekly Forward Earnings & Valuation www.yardeni.com
Yardeni Research, Inc.
Page 25
Figure 30.
06 07 08 09 10 11 12 13 14 15 16 17 18 19800
950
1100
1250
1400
1550
1819 5/10
S&P 500(forward revenues*)
Forward revenues*
06 07 08 09 10 11 12 13 14 15 16 17 18 19210
260
310
360
410
1819 5/10INDUSTRIALS
06 07 08 09 10 11 12 13 14 15 16 17 18 19250
325
400
475
550
625
18 19 5/10CONSUMER DISCRETIONARY
06 07 08 09 10 11 12 13 14 15 16 17 18 19125
175
225
275
325
1819 5/10INFORMATI0N TECHNOLOGY
06 07 08 09 10 11 12 13 14 15 16 17 18 19200
275
350
425
500
1819
5/10
CONSUMER STAPLES
06 07 08 09 10 11 12 13 14 15 16 17 18 19160
180
200
220
240
18 195/10
MATERIALS
06 07 08 09 10 11 12 13 14 15 16 17 18 19275
375
475
575
675
775
18 19 5/10
ENERGY
06 07 08 09 10 11 12 13 14 15 16 17 18 1920
25
30
35
40
45
5/1018
REAL ESTATE
06 07 08 09 10 11 12 13 14 15 16 17 18 19120
160
200
240
280
18
19 5/10
FINANCIALS
Includes Real Estatethrough September 2016
06 07 08 09 10 11 12 13 14 15 16 17 18 1995
105
115
125
135
18
19 5/10
TELECOMMUNICATION SERVICES
06 07 08 09 10 11 12 13 14 15 16 17 18 19175
275
375
475
575675
18 19 5/10HEALTH CARE
*Time-weighted average of consensus estimates for current year and next year. Source: Thomson Reuters I/B/E/S.
06 07 08 09 10 11 12 13 14 15 16 17 18 19120
135
150
165
180
18 19
5/10
UTILITIES
yardeni.com
S&P 500 Sectors Forward Revenues
Page 24 / May 16, 2018 / S&P 500/400/600 Weekly Forward Earnings & Valuation www.yardeni.com
Yardeni Research, Inc.
Page 26
Figure 31.
06 07 08 09 10 11 12 13 14 15 16 17 18 196
7
8
9
10
11
12
13
17 18 195/10S&P 500
(profit margin, percent)
AnnualForward* (12.2)
06 07 08 09 10 11 12 13 14 15 16 17 18 196
8
10
12
1718 19 5/10
INDUSTRIALS
(10.2)
06 07 08 09 10 11 12 13 14 15 16 17 18 191
3
5
7
9
11
1718 19 5/10
CONSUMER DISCRETIONARY
(8.3)
06 07 08 09 10 11 12 13 14 15 16 17 18 1910
15
20
25
17 18 195/10
INFORMATION TECHNOLOGY
(22.7)
06 07 08 09 10 11 12 13 14 15 16 17 18 195.5
6.0
6.5
7.0
7.5
8.0
8.5
17 18 19
5/10
CONSUMER STAPLES
(7.7)
06 07 08 09 10 11 12 13 14 15 16 17 18 194
6
8
10
12
14
1718
19 5/10
MATERIALS
(11.4)
06 07 08 09 10 11 12 13 14 15 16 17 18 190
3
6
9
12
15
17 18 195/10
ENERGY
(6.8)
06 07 08 09 10 11 12 13 14 15 16 17 18 196
9
12
15
18
21
24
5/1017 18 19
REAL ESTATE
(15.9)
06 07 08 09 10 11 12 13 14 15 16 17 18 194
8
12
16
20
24
18 19 5/1017
FINANCIALS
(18.7)
Includes Real Estatethrough September 2016
06 07 08 09 10 11 12 13 14 15 16 17 18 196
8
10
12
14
1718 19
5/10TELECOMMUNICATION SERVICES
(13.4)
06 07 08 09 10 11 12 13 14 15 16 17 18 199.5
10.0
10.5
11.0
11.5
12.0
17 18 19
5/10
HEALTH CARE
(10.5)
* Time-weighted average of the consensus estimates for current and next year. Source: Thomson Reuters I/B/E/S.
06 07 08 09 10 11 12 13 14 15 16 17 18 198
9
10
11
12
13
17
18
195/10UTILITIES
(12.3)yardeni.com
S&P 500 Sectors Forward Profit Margin
Page 25 / May 16, 2018 / S&P 500/400/600 Weekly Forward Earnings & Valuation www.yardeni.com
Yardeni Research, Inc.
Page 27
Figure 32.
06 07 08 09 10 11 12 13 14 15 16 17 18 198
10
12
14
16
18
20
5/10
S&P 500(forward P/E) P/E (16.4)
06 07 08 09 10 11 12 13 14 15 16 17 18 198
11
14
17
20
23
5/10
INDUSTRIALS(16.3)
06 07 08 09 10 11 12 13 14 15 16 17 18 1910
15
20
25
30
5/10
CONSUMER DISCRETIONARY
(19.4)
06 07 08 09 10 11 12 13 14 15 16 17 18 198
12
16
20
24
5/10
INFORMATION TECHNOLOGY(18.3)
06 07 08 09 10 11 12 13 14 15 16 17 18 1910
12
14
16
18
20
22
5/10
CONSUMER STAPLES(16.3)
06 07 08 09 10 11 12 13 14 15 16 17 18 195
10
15
20
25
5/10
MATERIALS(15.9)
06 07 08 09 10 11 12 13 14 15 16 17 18 195
15
25
35
45
55
65
5/10
ENERGY(19.5)
06 07 08 09 10 11 12 13 14 15 16 17 18 1915
25
35
45
55
65
75
5/10
REAL ESTATE(37.7)
06 07 08 09 10 11 12 13 14 15 16 17 18 196
8
10
12
14
16
18
20
5/10
FINANCIALS
Includes Real Estatethrough September 2016
(12.9)
06 07 08 09 10 11 12 13 14 15 16 17 18 198
10
12
14
16
18
20
22
5/10
TELECOMMUNICATION SERVICES(9.8)
06 07 08 09 10 11 12 13 14 15 16 17 18 198
10
12
14
16
18
20
5/10
HEALTH CARE
Source: Thomson Reuters I/B/E/S and Standard & Poor’s.
(14.6)
06 07 08 09 10 11 12 13 14 15 16 17 18 198
10
12
14
16
18
20
5/10
yardeni.com
UTILITIES(15.7)
S&P 500 Sectors Forward P/Es
Page 26 / May 16, 2018 / S&P 500/400/600 Weekly Forward Earnings & Valuation www.yardeni.com
Yardeni Research, Inc.
Page 28
Figure 33.
06 07 08 09 10 11 12 13 14 15 16 17 18 19.5
1.0
1.5
2.0
2.5
5/10
S&P 500(forward P/S ratio)
P/S (2.00)
06 07 08 09 10 11 12 13 14 15 16 17 18 19.50
.75
1.00
1.25
1.50
1.75
2.00
5/10INDUSTRIALS
(1.66)
06 07 08 09 10 11 12 13 14 15 16 17 18 19.4
.7
1.0
1.3
1.6
1.9
5/10CONSUMER DISCRETIONARY
(1.60)
06 07 08 09 10 11 12 13 14 15 16 17 18 191.0
1.5
2.0
2.5
3.0
3.5
4.0
4.55/10INFORMATION TECHNOLOGY
(4.15)
06 07 08 09 10 11 12 13 14 15 16 17 18 19.6
.8
1.0
1.2
1.4
1.6
5/10
CONSUMER STAPLES(1.25)
06 07 08 09 10 11 12 13 14 15 16 17 18 19.50
.75
1.00
1.25
1.50
1.75
2.00
2.25
5/10
MATERIALS(1.82)
06 07 08 09 10 11 12 13 14 15 16 17 18 19.50
.75
1.00
1.25
1.50
1.75
5/10
ENERGY(1.33)
06 07 08 09 10 11 12 13 14 15 16 17 18 191
2
3
4
5
6
7
8
5/10
REAL ESTATE(6.01)
06 07 08 09 10 11 12 13 14 15 16 17 18 19.5
1.0
1.5
2.0
2.5
3.0
5/10
FINANCIALS
Includes Real Estatethrough September 2016
(2.41)
06 07 08 09 10 11 12 13 14 15 16 17 18 19.75
1.00
1.25
1.50
1.75
2.00
5/10
TELECOMMUNICATION SERVICES(1.31)
06 07 08 09 10 11 12 13 14 15 16 17 18 19.75
1.00
1.25
1.50
1.75
2.00
2.25
5/10
HEALTH CARE
Source: Thomson Reuters I/B/E/S and Standard & Poor’s Corporation.
(1.54)
06 07 08 09 10 11 12 13 14 15 16 17 18 19.50
.75
1.00
1.25
1.50
1.75
2.00
2.25
5/10
yardeni.com
UTILITIES(1.93)
S&P 500 Sectors Forward P/Sales
Page 27 / May 16, 2018 / S&P 500/400/600 Weekly Forward Earnings & Valuation www.yardeni.com
Yardeni Research, Inc.
Page 29
Figure 34.
95 97 99 01 03 05 07 09 11 13 15 17 19 21-50
-30
-10
10
30
AprS&P 500
Net Earnings Revisions Index*NERI (13.9)
95 97 99 01 03 05 07 09 11 13 15 17 19 21-50
-30
-10
10
30
50
Apr
INDUSTRIALS
(17.8)
95 97 99 01 03 05 07 09 11 13 15 17 19 21-60
-40
-20
0
20
40
60
Apr
CONSUMER DISCRETIONARY
(11.4)
95 97 99 01 03 05 07 09 11 13 15 17 19 21-60
-40
-20
0
20
40
60
Apr
INFORMATION TECHNOLOGY
(22.0)
95 97 99 01 03 05 07 09 11 13 15 17 19 21-40
-20
0
20
40
Apr
CONSUMER STAPLES
(13.8)
95 97 99 01 03 05 07 09 11 13 15 17 19 21-60
-40
-20
0
20
40
Apr
MATERIALS
(16.9)
95 97 99 01 03 05 07 09 11 13 15 17 19 21-60
-40
-20
0
20
40
60
Apr
ENERGY
(14.2)
95 97 99 01 03 05 07 09 11 13 15 17 19 21-45
-30
-15
0
15
30
Apr
REAL ESTATE
(-15.2)
95 97 99 01 03 05 07 09 11 13 15 17 19 21-60
-40
-20
0
20
40
60
Apr
FINANCIALS
Includes Real Estatethrough September 2016(11.2)
95 97 99 01 03 05 07 09 11 13 15 17 19 21-40
-20
0
20
40
Apr
TELECOMMUNICATION SERVICES
(13.8)
95 97 99 01 03 05 07 09 11 13 15 17 19 21-20
-10
0
10
20
30
Apr
HEALTH CARE
* Three-month moving average of the number of estimates up less number of estimates down, expressed as a percentage of the total number of estimates. Source: Thomson Reuters I/B/E/S.
(15.6)
95 97 99 01 03 05 07 09 11 13 15 17 19 21-40
-20
0
20
40
Apr
UTILITIES
(0.8)
S&P 500 Sectors Net Earnings Revisions Index
Page 28 / May 16, 2018 / S&P 500/400/600 Weekly Forward Earnings & Valuation www.yardeni.com
Yardeni Research, Inc.
Page 30
Figure 35.
04 05 06 07 08 09 10 11 12 13 14 15 16 17 18 19-45
-30
-15
0
15
30
45
Apr
S&P 500
Net Revenue Revisions Index*NERI (14.0)
04 05 06 07 08 09 10 11 12 13 14 15 16 17 18 19-60
-40
-20
0
20
40
AprINDUSTRIALS
(21.7)
04 05 06 07 08 09 10 11 12 13 14 15 16 17 18 19-45
-30
-15
0
15
30
45
Apr
CONSUMER DISCRETIONARY
(12.5)
04 05 06 07 08 09 10 11 12 13 14 15 16 17 18 19-60
-40
-20
0
20
40
Apr
INFORMATION TECHNOLOGY
(16.0)
04 05 06 07 08 09 10 11 12 13 14 15 16 17 18 19-40
-30
-20
-10
0
10
20
30
Apr
CONSUMER STAPLES
(11.6)
04 05 06 07 08 09 10 11 12 13 14 15 16 17 18 19-60
-40
-20
0
20
40
AprMATERIALS
(20.9)
04 05 06 07 08 09 10 11 12 13 14 15 16 17 18 19-60
-40
-20
0
20
40
60
Apr
ENERGY
(9.7)
04 05 06 07 08 09 10 11 12 13 14 15 16 17 18 19-45
-30
-15
0
15
30
Apr
REAL ESTATE
(0.4)
04 05 06 07 08 09 10 11 12 13 14 15 16 17 18 19-40
-30
-20
-10
0
10
20AprFINANCIALS
(14.6)
04 05 06 07 08 09 10 11 12 13 14 15 16 17 18 19-60
-40
-20
0
20
40
Apr
TELECOMMUNICATION SERVICES
(9.3)
04 05 06 07 08 09 10 11 12 13 14 15 16 17 18 19-30
-20
-10
0
10
20AprHEALTH CARE
* Three-month moving average of the number of estimates up less number of estimates down, expressed as a percentage of the total number of estimates. Source: Thomson Reuters I/B/E/S.
(16.9)
04 05 06 07 08 09 10 11 12 13 14 15 16 17 18 19-30
-20
-10
0
10
20
Apr
UTILITIES
(-8.1)
S&P 500 Sectors Net Revenue Revisions Index
Page 29 / May 16, 2018 / S&P 500/400/600 Weekly Forward Earnings & Valuation www.yardeni.com
Yardeni Research, Inc.
Page 31
Figure 36.
06 07 08 09 10 11 12 13 14 15 16 17 18 1930
50
70
90
110130
1819 5/10S&P 400
(forward earnings)
Annual consensusestimatesForward earnings
06 07 08 09 10 11 12 13 14 15 16 17 18 1915
25
35
45
5565
1819 5/3INDUSTRIALS
06 07 08 09 10 11 12 13 14 15 16 17 18 199
24
39
5469
18 19 5/3CONSUMER DISCRETIONARY
06 07 08 09 10 11 12 13 14 15 16 17 18 1930
70
110
150
1819 5/3INFORMATION TECHNOLOGY
06 07 08 09 10 11 12 13 14 15 16 17 18 1925
55
85
11518 19 5/3CONSUMER STAPLES
06 07 08 09 10 11 12 13 14 15 16 17 18 199
19
29
39
49
1819
5/3MATERIALS
06 07 08 09 10 11 12 13 14 15 16 17 18 19-25
0
25
50
75
100
125
18 19 5/3
ENERGY
06 07 08 09 10 11 12 13 14 15 16 17 18 192
4
6
8
10
19 5/1017
18REAL ESTATE
06 07 08 09 10 11 12 13 14 15 16 17 18 1915
35
55
7595
18
195/3FINANCIALS
06 07 08 09 10 11 12 13 14 15 16 17 18 19-30
-20
-10
0
10
20
30
18
195/3
TELECOMMUNICATIONS SERVICES
06 07 08 09 10 11 12 13 14 15 16 17 18 1915
35
55
7595
115
1819 5/3HEALTH CARE
* Time-weighted average (in blue) of consensus operating earnings estimates for current and next year (in red). Source: Thomson Reuters I/B/E/S.
06 07 08 09 10 11 12 13 14 15 16 17 18 1913
17
21
25
29
1819 5/3UTILITIES
yardeni.com
S&P 400 Sectors Forward Earnings
Page 30 / May 16, 2018 / S&P 500/400/600 Weekly Forward Earnings & Valuation www.yardeni.com
Yardeni Research, Inc.
Page 32
Figure 37.
06 07 08 09 10 11 12 13 14 15 16 17 18 19600
800
1000
1200
1400
160018 19 5/10S&P 400
(forward revenues*)
Annual consensusestimatesForward revenues
06 07 08 09 10 11 12 13 14 15 16 17 18 19300
500
700
900
1100
1819 5/3
INDUSTRIALS
06 07 08 09 10 11 12 13 14 15 16 17 18 19250
450
650
850
10501250
18 19 5/3CONSUMER DISCRETIONARY
06 07 08 09 10 11 12 13 14 15 16 17 18 19500
900
1300
1700
210018
195/3INFORMATI0N TECHNOLOGY
06 07 08 09 10 11 12 13 14 15 16 17 18 19600
1200
1800
2400
3000
1819
5/3
CONSUMER STAPLES
06 07 08 09 10 11 12 13 14 15 16 17 18 19200
300
400
500
600
18
19 5/3MATERIALS
06 07 08 09 10 11 12 13 14 15 16 17 18 19250
500
750
100012501500
1819 5/3
ENERGY
06 07 08 09 10 11 12 13 14 15 16 17 18 1925
35
45
55
6519
5/10
17 18
REAL ESTATE
06 07 08 09 10 11 12 13 14 15 16 17 18 19200
250
300
350
400
450
18
195/3FINANCIALS
06 07 08 09 10 11 12 13 14 15 16 17 18 19100
350
600
8501100
1819
5/3
TELECOMMUNICATION SERVICES
06 07 08 09 10 11 12 13 14 15 16 17 18 19200
600
1000
14001800
18 19 5/3HEALTH CARE
* Time-weighted average (in blue) of the current year’s and next year’s consensus revenues estimates (in red).Source: Thomson Reuters I/B/E/S.
06 07 08 09 10 11 12 13 14 15 16 17 18 19200
250
300
350
1819
5/3
UTILITIES
yardeni.com
S&P 400 Sectors Forward Revenues
Page 31 / May 16, 2018 / S&P 500/400/600 Weekly Forward Earnings & Valuation www.yardeni.com
Yardeni Research, Inc.
Page 33
Figure 38.
06 07 08 09 10 11 12 13 14 15 16 17 18 194
5
6
7
8
9
1819
5/10
17
S&P 400(profit margin)
AnnualForward* (7.5)
06 07 08 09 10 11 12 13 14 15 16 17 18 193
4
5
6
7
8
17
18 19 5/3
INDUSTRIALS
(6.6)
06 07 08 09 10 11 12 13 14 15 16 17 18 193
4
5
6
7
8
17 18 195/3
CONSUMER DISCRETIONARY
(6.2)
06 07 08 09 10 11 12 13 14 15 16 17 18 193
4
5
6
7
8
9
17 18
195/3
INFORMATION TECHNOLOGY
(7.0)
06 07 08 09 10 11 12 13 14 15 16 17 18 192
3
4
5
6
7
17 18
195/3
CONSUMER STAPLES
(5.3)
06 07 08 09 10 11 12 13 14 15 16 17 18 194
5
6
7
8
9
17 1819
5/3
MATERIALS
(7.6)
06 07 08 09 10 11 12 13 14 15 16 17 18 19-5
0
5
10
15
20
25
1718 19 5/3
ENERGY(2.1)
06 07 08 09 10 11 12 13 14 15 16 17 18 196
8
10
12
14
16
18
20
5/1017
18
19
REAL ESTATE
(13.6)
06 07 08 09 10 11 12 13 14 15 16 17 18 196
9
12
15
18
21
1819
5/317
FINANCIALS
(17.2)
06 07 08 09 10 11 12 13 14 15 16 17 18 19-4
0
4
8
12
17 1819
5/3
TELECOMMUNICATION SERVICES
(1.4)
06 07 08 09 10 11 12 13 14 15 16 17 18 194
5
6
7
8
17
18
19 5/3
HEALTH CARE
(7.0)
* Time-weighted average of the consensus estimates for current and next year. Source: Thomson Reuters I/B/E/S.
06 07 08 09 10 11 12 13 14 15 16 17 18 194
6
8
10
12
1718
19 5/3UTILITIES
(10.6) yardeni.com
S&P 400 Sectors Forward Profit Margin
Page 32 / May 16, 2018 / S&P 500/400/600 Weekly Forward Earnings & Valuation www.yardeni.com
Yardeni Research, Inc.
Page 34
Figure 39.
06 07 08 09 10 11 12 13 14 15 16 17 18 198
10
12
14
16
18
20
22
5/10
S&P 400(forward P/E)
P/E (17.2)
06 07 08 09 10 11 12 13 14 15 16 17 18 195
10
15
20
25
5/10
INDUSTRIALS(17.0)
06 07 08 09 10 11 12 13 14 15 16 17 18 1910
15
20
25
5/10
CONSUMER DISCRETIONARY
(14.0)
06 07 08 09 10 11 12 13 14 15 16 17 18 195
10
15
20
25
5/10
INFORMATION TECHNOLOGY(18.2)
06 07 08 09 10 11 12 13 14 15 16 17 18 1910
15
20
25
5/10
CONSUMER STAPLES(17.2)
06 07 08 09 10 11 12 13 14 15 16 17 18 195
10
15
20
25
5/10
MATERIALS(12.8)
06 07 08 09 10 11 12 13 14 15 16 17 18 190
20
40
60
80
5/10
ENERGY(35.3)
06 07 08 09 10 11 12 13 14 15 16 17 18 1910
20
30
40
50
60
5/10
REAL ESTATE(30.3)
06 07 08 09 10 11 12 13 14 15 16 17 18 1910
15
20
25
5/10
FINANCIALS(14.2)
06 07 08 09 10 11 12 13 14 15 16 17 18 195101520253035404550
5/10TELECOMMUNICATION SERVICES
(40.0)
06 07 08 09 10 11 12 13 14 15 16 17 18 195
10
15
20
25
30
5/10
HEALTH CARE
Source: Thomson Reuters I/B/E/S and Standard & Poor’s Corporation.
(19.3)
06 07 08 09 10 11 12 13 14 15 16 17 18 198
12
16
20
24
5/10
yardeni.com
UTILITIES(19.3)
S&P 400 Sectors Forward P/Es
Page 33 / May 16, 2018 / S&P 500/400/600 Weekly Forward Earnings & Valuation www.yardeni.com
Yardeni Research, Inc.
Page 35
Figure 40.
06 07 08 09 10 11 12 13 14 15 16 17 18 19.50
.75
1.00
1.25
1.50
1.75
5/10
S&P 400(forward P/S ratio)
P/S (1.29)
06 07 08 09 10 11 12 13 14 15 16 17 18 19.25
.50
.75
1.00
1.25
1.50
5/10
INDUSTRIALS(1.13)
06 07 08 09 10 11 12 13 14 15 16 17 18 19.4
.6
.8
1.0
1.2
5/10
CONSUMER DISCRETIONARY
(0.86)
06 07 08 09 10 11 12 13 14 15 16 17 18 19.25
.50
.75
1.00
1.25
1.50
1.75
5/10
INFORMATION TECHNOLOGY(1.27)
06 07 08 09 10 11 12 13 14 15 16 17 18 19.25
.50
.75
1.00
1.25
5/10
CONSUMER STAPLES(0.89)
06 07 08 09 10 11 12 13 14 15 16 17 18 19.25
.50
.75
1.00
1.25
5/10
MATERIALS(0.98)
06 07 08 09 10 11 12 13 14 15 16 17 18 19.0
.5
1.0
1.5
2.0
2.5
3.0
3.5
5/10
ENERGY(0.74)
06 07 08 09 10 11 12 13 14 15 16 17 18 191
2
3
4
5
6
7
5/10
REAL ESTATE(4.12)
06 07 08 09 10 11 12 13 14 15 16 17 18 191.0
1.5
2.0
2.5
3.0
5/10
FINANCIALS(2.44)
06 07 08 09 10 11 12 13 14 15 16 17 18 19.0
.5
1.0
1.5
2.0
2.5
5/10
TELECOMMUNICATION SERVICES(0.53)
06 07 08 09 10 11 12 13 14 15 16 17 18 19.50
.75
1.00
1.25
1.50
1.75
2.00
5/10
HEALTH CARE
Source: Thomson Reuters I/B/E/S and Standard & Poor’s Corporation.
(1.36)
06 07 08 09 10 11 12 13 14 15 16 17 18 19.5
1.0
1.5
2.0
2.5
5/10
yardeni.com
UTILITIES(2.09)
S&P 400 Sectors Forward P/Sales
Page 34 / May 16, 2018 / S&P 500/400/600 Weekly Forward Earnings & Valuation www.yardeni.com
Yardeni Research, Inc.
Page 36
Figure 41.
04 05 06 07 08 09 10 11 12 13 14 15 16 17 18 19-50
-40
-30
-20
-10
0
10
20
AprS&P 400
Net Earnings Revisions Index*NERI (8.4)
04 05 06 07 08 09 10 11 12 13 14 15 16 17 18 19-45
-30
-15
0
15
30
AprINDUSTRIALS
(14.9)
04 05 06 07 08 09 10 11 12 13 14 15 16 17 18 19-45
-30
-15
0
15
30
45
Apr
CONSUMER DISCRETIONARY
(10.7)
04 05 06 07 08 09 10 11 12 13 14 15 16 17 18 19-40
-30
-20
-10
0
10
20
30
Apr
INFORMATION TECHNOLOGY
(13.6)
04 05 06 07 08 09 10 11 12 13 14 15 16 17 18 19-30
-20
-10
0
10
20
30
Apr
CONSUMER STAPLES
(3.3)
04 05 06 07 08 09 10 11 12 13 14 15 16 17 18 19-50-40-30-20-100102030
AprMATERIALS
(12.9)
04 05 06 07 08 09 10 11 12 13 14 15 16 17 18 19-60
-45
-30
-15
0
15
30
45
Apr
ENERGY
(-3.4)
04 05 06 07 08 09 10 11 12 13 14 15 16 17 18 19-50-40-30-20-100102030
Apr
REAL ESTATE
(-6.7)
04 05 06 07 08 09 10 11 12 13 14 15 16 17 18 19-45
-30
-15
0
15
30
45
Apr
FINANCIALS
(9.2)
04 05 06 07 08 09 10 11 12 13 14 15 16 17 18 19-100
-75
-50
-25
0
25
50
AprTELECOMMUNICATION SERVICES
(23.3)
04 05 06 07 08 09 10 11 12 13 14 15 16 17 18 19-30
-20
-10
0
10
20
Apr
HEALTH CARE
* Three-month moving average of the number of estimates up less number of estimates down, expressed as a percentage of the total number of estimates. Source: Thomson Reuters I/B/E/S.
(8.1)
04 05 06 07 08 09 10 11 12 13 14 15 16 17 18 19-30
-20
-10
0
10
20
Apr
UTILITIES
(5.3)
S&P 400 Sectors Net Earnings Revisions Index
Page 35 / May 16, 2018 / S&P 500/400/600 Weekly Forward Earnings & Valuation www.yardeni.com
Yardeni Research, Inc.
Page 37
Figure 42.
04 05 06 07 08 09 10 11 12 13 14 15 16 17 18 19-40
-30
-20
-10
0
10
20
30
Apr
S&P 400
Net Revenue Revisions Index*NERI (7.1)
04 05 06 07 08 09 10 11 12 13 14 15 16 17 18 19-45
-30
-15
0
15
30AprINDUSTRIALS
(20.8)
04 05 06 07 08 09 10 11 12 13 14 15 16 17 18 19-45
-30
-15
0
15
30
Apr
CONSUMER DISCRETIONARY
(6.4)
04 05 06 07 08 09 10 11 12 13 14 15 16 17 18 19-45
-30
-15
0
15
30
Apr
INFORMATION TECHNOLOGY
(10.8)
04 05 06 07 08 09 10 11 12 13 14 15 16 17 18 19-30
-15
0
15
30
45
Apr
CONSUMER STAPLES
(5.1)
04 05 06 07 08 09 10 11 12 13 14 15 16 17 18 19-60
-40
-20
0
20
40
AprMATERIALS
(22.2)
04 05 06 07 08 09 10 11 12 13 14 15 16 17 18 19-60
-45
-30
-15
0
15
30
45
Apr
ENERGY
(-6.1)
04 05 06 07 08 09 10 11 12 13 14 15 16 17 18 19-40
-30
-20
-10
0
10
20
Apr
REAL ESTATE
(-8.2)
04 05 06 07 08 09 10 11 12 13 14 15 16 17 18 19-30
-20
-10
0
10
20
Apr
FINANCIALS
(4.5)
04 05 06 07 08 09 10 11 12 13 14 15 16 17 18 19-60
-40
-20
0
20
40
60
Apr
TELECOMMUNICATION SERVICES
(19.4)
04 05 06 07 08 09 10 11 12 13 14 15 16 17 18 19-30
-20
-10
0
10
20
Apr
HEALTH CARE
* Three-month moving average of the number of estimates up less number of estimates down, expressed as a percentage of the total number of estimates. Source: Thomson Reuters I/B/E/S.
(4.8)
04 05 06 07 08 09 10 11 12 13 14 15 16 17 18 19-30
-20
-10
0
10
20
Apr
UTILITIES
(-14.1)
S&P 400 Sectors Net Revenue Revisions Index
Page 36 / May 16, 2018 / S&P 500/400/600 Weekly Forward Earnings & Valuation www.yardeni.com
Yardeni Research, Inc.
Page 38
Figure 43.
06 07 08 09 10 11 12 13 14 15 16 17 18 1910
20
30
405060
18 19 5/10S&P 600(forward earnings)
Annual consensusestimatesForward earnings
06 07 08 09 10 11 12 13 14 15 16 17 18 1915
30
45
60
75
5/318 19
INDUSTRIALS
06 07 08 09 10 11 12 13 14 15 16 17 18 195
15
25
3545
5/318 19CONSUMER DISCRETIONARY
06 07 08 09 10 11 12 13 14 15 16 17 18 195
20
35
5065
5/318
19INFORMATION TECHNOLOGY
06 07 08 09 10 11 12 13 14 15 16 17 18 1915
35
55
7595
1155/318 19CONSUMER STAPLES
06 07 08 09 10 11 12 13 14 15 16 17 18 195
15
25
3545
5/318 19MATERIALS
06 07 08 09 10 11 12 13 14 15 16 17 18 19-50-25
0255075
100125150
5/3
1819
ENERGY
06 07 08 09 10 11 12 13 14 15 16 17 18 19.5
5.5
10.515.520.5
19 5/1017 18
REAL ESTATE
06 07 08 09 10 11 12 13 14 15 16 17 18 1910
30
50
7090
5/3
1819FINANCIALS
06 07 08 09 10 11 12 13 14 15 16 17 18 19-.25
.00
.25
.50
.75
1.00
5/318 19
TELECOMMUNICATIONS SERVICES
06 07 08 09 10 11 12 13 14 15 16 17 18 1915
40
65
90115
5/318 19HEALTH CARE
* Time-weighted average (in blue) of consensus operating earnings estimates for current and next year (in red). Source: Thomson Reuters I/B/E/S.
06 07 08 09 10 11 12 13 14 15 16 17 18 1920
30
40
50
5/31819UTILITIES
yardeni.com
S&P 600 Sectors Forward Earnings
Page 37 / May 16, 2018 / S&P 500/400/600 Weekly Forward Earnings & Valuation www.yardeni.com
Yardeni Research, Inc.
Page 39
Figure 44.
06 07 08 09 10 11 12 13 14 15 16 17 18 19300
450
600
750
9001050
1819
5/10S&P 600(forward revenues*)
Annual consensusestimatesForward revenues
06 07 08 09 10 11 12 13 14 15 16 17 18 19400
600
800
1000
12001400
1819
5/3INDUSTRIALS
06 07 08 09 10 11 12 13 14 15 16 17 18 19300
550
800
1050
1300
18 19 5/3CONSUMER DISCRETIONARY
06 07 08 09 10 11 12 13 14 15 16 17 18 19125
225
325
425
525625
18 19
5/3INFORMATI0N TECHNOLOGY
06 07 08 09 10 11 12 13 14 15 16 17 18 19600
1600
2600
360046005600
18
19 5/3CONSUMER STAPLES
06 07 08 09 10 11 12 13 14 15 16 17 18 19300
400
500
600
700
800
1819 5/3MATERIALS
06 07 08 09 10 11 12 13 14 15 16 17 18 19250
1250
2250
32504250
18 19 5/3
ENERGY
06 07 08 09 10 11 12 13 14 15 16 17 18 1925
30
35
40
45
5055
195/1017
18
REAL ESTATE
06 07 08 09 10 11 12 13 14 15 16 17 18 19200
300
400
500
600700
18
19 5/3
FINANCIALS
06 07 08 09 10 11 12 13 14 15 16 17 18 191
6
111621
18 19
5/3
TELECOMMUNICATION SERVICES
06 07 08 09 10 11 12 13 14 15 16 17 18 19250
750
1250
175022502750
1819
5/3HEALTH CARE
* Time-weighted average (in blue) of the current year’s and next year’s consensus revenues estimates (in red).Source: Thomson Reuters I/B/E/S.
06 07 08 09 10 11 12 13 14 15 16 17 18 19250
325
400
475
550625700
1819 5/3
UTILITIES
yardeni.com
S&P 600 Sectors Forward Revenues
Page 38 / May 16, 2018 / S&P 500/400/600 Weekly Forward Earnings & Valuation www.yardeni.com
Yardeni Research, Inc.
Page 40
Figure 45.
06 07 08 09 10 11 12 13 14 15 16 17 18 193
4
5
6
7
8
1819 5/10
17
S&P 600(profit margin)
AnnualForward* (5.4)
06 07 08 09 10 11 12 13 14 15 16 17 18 193
4
5
6
1718
19 5/3
INDUSTRIALS
(4.8)
06 07 08 09 10 11 12 13 14 15 16 17 18 191
2
3
4
5
6
17
18 19 5/3
CONSUMER DISCRETIONARY
(3.5)
06 07 08 09 10 11 12 13 14 15 16 17 18 1934567891011
1718
19
5/3
INFORMATION TECHNOLOGY
(7.3)
06 07 08 09 10 11 12 13 14 15 16 17 18 191
2
3
4
5
17
18
195/3
CONSUMER STAPLES
(2.1)
06 07 08 09 10 11 12 13 14 15 16 17 18 192
3
4
5
6
7
17 1819 5/3
MATERIALS
(4.8)
06 07 08 09 10 11 12 13 14 15 16 17 18 19-10
-5
0
5
10
15
20
1718
195/3
ENERGY
(4.8)
06 07 08 09 10 11 12 13 14 15 16 17 18 190
5
10
15
20
25
30
1718
5/10
REAL ESTATE
(11.0)
06 07 08 09 10 11 12 13 14 15 16 17 18 195
10
15
20
25
17 18 195/3
FINANCIALS
(17.9)
06 07 08 09 10 11 12 13 14 15 16 17 18 19-5
0
5
10
15
17 1819
5/3
TELECOMMUNICATION SERVICES
(-0.5)
06 07 08 09 10 11 12 13 14 15 16 17 18 191
2
3
4
5
6
7
8
1718
195/3
HEALTH CARE
(3.9)
* Time-weighted average of the consensus estimates for current and next year. Source: Thomson Reuters I/B/E/S.
06 07 08 09 10 11 12 13 14 15 16 17 18 194
6
8
10
12
17
1819 5/3
UTILITIES
(10.3) yardeni.com
S&P 600 Sectors Forward Profit Margin
Page 39 / May 16, 2018 / S&P 500/400/600 Weekly Forward Earnings & Valuation www.yardeni.com
Yardeni Research, Inc.
Page 41
Figure 46.
06 07 08 09 10 11 12 13 14 15 16 17 18 198
12
16
20
24
5/10
S&P 600(forward P/E)
P/E (18.3)
06 07 08 09 10 11 12 13 14 15 16 17 18 195
10
15
20
25
5/10
INDUSTRIALS(17.0)
06 07 08 09 10 11 12 13 14 15 16 17 18 1910
15
20
25
5/10
CONSUMER DISCRETIONARY(15.3)
06 07 08 09 10 11 12 13 14 15 16 17 18 195
10
15
20
25
5/10
INFORMATION TECHNOLOGY(18.2)
06 07 08 09 10 11 12 13 14 15 16 17 18 1910
15
20
25
5/10
CONSUMER STAPLES(17.2)
06 07 08 09 10 11 12 13 14 15 16 17 18 195
10
15
20
25
5/10
MATERIALS(15.3)
06 07 08 09 10 11 12 13 14 15 16 17 18 190
20
40
60
80
5/10
ENERGY(35.3)
06 07 08 09 10 11 12 13 14 15 16 17 18 1910
20
30
40
50
60
70
5/10
REAL ESTATE(36.1)
06 07 08 09 10 11 12 13 14 15 16 17 18 1910
15
20
25
5/10
FINANCIALS(14.2)
06 07 08 09 10 11 12 13 14 15 16 17 18 195101520253035404550
1/4TELECOMMUNICATION SERVICES
(NA)
06 07 08 09 10 11 12 13 14 15 16 17 18 19101520253035404550
5/10
HEALTH CARE
Source: Thomson Reuters I/B/E/S and Standard & Poor’s Corporation.
(31.7)
06 07 08 09 10 11 12 13 14 15 16 17 18 1910
15
20
25
30
5/10
yardeni.com
UTILITIES(22.7)
S&P 600 Sectors Forward P/Es
Page 40 / May 16, 2018 / S&P 500/400/600 Weekly Forward Earnings & Valuation www.yardeni.com
Yardeni Research, Inc.
Page 42
Figure 47.
06 07 08 09 10 11 12 13 14 15 16 17 18 19.4
.6
.8
1.0
1.2
1.4
5/10
S&P 600(forward P/S ratio by sector)
P/S (0.99)
06 07 08 09 10 11 12 13 14 15 16 17 18 19.4
.6
.8
1.0
5/10
INDUSTRIALS(0.85)
06 07 08 09 10 11 12 13 14 15 16 17 18 19.2
.4
.6
.8
1.0
5/10
CONSUMER DISCRETIONARY
(0.55)
06 07 08 09 10 11 12 13 14 15 16 17 18 19.50
.75
1.00
1.25
1.50
1.75
5/10
INFORMATION TECHNOLOGY(1.24)
06 07 08 09 10 11 12 13 14 15 16 17 18 19.2
.4
.6
.8
1.0
5/10
CONSUMER STAPLES(0.38)
06 07 08 09 10 11 12 13 14 15 16 17 18 19.2
.4
.6
.8
1.0
5/10
MATERIALS(0.73)
06 07 08 09 10 11 12 13 14 15 16 17 18 19.0
.5
1.0
1.5
2.0
5/10
ENERGY(1.01)
06 07 08 09 10 11 12 13 14 15 16 17 18 191
2
3
4
5
6
7
5/10
REAL ESTATE(3.97)
06 07 08 09 10 11 12 13 14 15 16 17 18 191.0
1.5
2.0
2.5
3.0
3.5
5/10
FINANCIALS(2.60)
06 07 08 09 10 11 12 13 14 15 16 17 18 19.0
.5
1.0
1.5
2.0
2.5
3.0
5/10
TELECOMMUNICATION SERVICES(0.62)
06 07 08 09 10 11 12 13 14 15 16 17 18 19.50
.75
1.00
1.25
1.50
1.75
2.00
5/10
HEALTH CARE
Source: Thomson Reuters I/B/E/S and Standard & Poor’s Corporation.
(1.23)
06 07 08 09 10 11 12 13 14 15 16 17 18 19.5
1.0
1.5
2.0
2.5
3.0
5/10
yardeni.com
UTILITIES(2.28)
S&P 600 Sectors Forward P/Sales
Page 41 / May 16, 2018 / S&P 500/400/600 Weekly Forward Earnings & Valuation www.yardeni.com
Yardeni Research, Inc.
Page 43
Figure 48.
04 05 06 07 08 09 10 11 12 13 14 15 16 17 18 19-50
-40
-30
-20
-10
0
10
20
AprS&P 600
Net Earnings Revisions Index*NERI (6.5)
04 05 06 07 08 09 10 11 12 13 14 15 16 17 18 19-45
-30
-15
0
15
30
Apr
INDUSTRIALS
(12.7)
04 05 06 07 08 09 10 11 12 13 14 15 16 17 18 19-40
-30
-20
-10
0
10
20
30
Apr
CONSUMER DISCRETIONARY
(6.1)
04 05 06 07 08 09 10 11 12 13 14 15 16 17 18 19-40
-30
-20
-10
0
10
20
Apr
INFORMATION TECHNOLOGY
(5.4)
04 05 06 07 08 09 10 11 12 13 14 15 16 17 18 19-30
-20
-10
0
10
20
30
Apr
CONSUMER STAPLES
(8.5)
04 05 06 07 08 09 10 11 12 13 14 15 16 17 18 19-45
-30
-15
0
15
30
Apr
MATERIALS
(8.4)
04 05 06 07 08 09 10 11 12 13 14 15 16 17 18 19-60
-45
-30
-15
0
15
30
45
Apr
ENERGY
(2.0)
04 05 06 07 08 09 10 11 12 13 14 15 16 17 18 19-40
-30
-20
-10
0
10
20
30
Apr
REAL ESTATE
(-10.6)
04 05 06 07 08 09 10 11 12 13 14 15 16 17 18 19-45
-30
-15
0
15
30
Apr
FINANCIALS
(5.3)
04 05 06 07 08 09 10 11 12 13 14 15 16 17 18 19-60
-45
-30
-15
0
15
30
Apr
TELECOMMUNICATION SERVICES
(-4.9)
04 05 06 07 08 09 10 11 12 13 14 15 16 17 18 19-20
-15
-10
-5
0
5
10
15
AprHEALTH CARE
* Three-month moving average of the number of estimates up less number of estimates down, expressed as a percentage of the total number of estimates. Source: Thomson Reuters I/B/E/S.
(9.4)
04 05 06 07 08 09 10 11 12 13 14 15 16 17 18 19-20-15-10-505101520
Apr
UTILITIES
(-4.1)
S&P 600 Sectors Net Earnings Revisions Index
Page 42 / May 16, 2018 / S&P 500/400/600 Weekly Forward Earnings & Valuation www.yardeni.com
Yardeni Research, Inc.
Page 44
Figure 49.
04 05 06 07 08 09 10 11 12 13 14 15 16 17 18 19-30
-20
-10
0
10
20
30
Apr
S&P 600
Net Revenue Revisions Index*NERI (5.5)
04 05 06 07 08 09 10 11 12 13 14 15 16 17 18 19-45
-30
-15
0
15
30
AprINDUSTRIALS
(13.4)
04 05 06 07 08 09 10 11 12 13 14 15 16 17 18 19-40
-30
-20
-10
0
10
20
30
Apr
CONSUMER DISCRETIONARY
(3.6)
04 05 06 07 08 09 10 11 12 13 14 15 16 17 18 19-45
-30
-15
0
15
30
Apr
INFORMATION TECHNOLOGY
(6.8)
04 05 06 07 08 09 10 11 12 13 14 15 16 17 18 19-20
-10
0
10
20
30
Apr
CONSUMER STAPLES
(-1.5)
04 05 06 07 08 09 10 11 12 13 14 15 16 17 18 19-45
-30
-15
0
15
30
45
Apr
MATERIALS
(21.0)
04 05 06 07 08 09 10 11 12 13 14 15 16 17 18 19-60
-40
-20
0
20
40
60
Apr
ENERGY
(5.9)
04 05 06 07 08 09 10 11 12 13 14 15 16 17 18 19-40
-30
-20
-10
0
10
20
30
Apr
REAL ESTATE
(-2.2)
04 05 06 07 08 09 10 11 12 13 14 15 16 17 18 19-20
-10
0
10
20
Apr
FINANCIALS
(1.9)
04 05 06 07 08 09 10 11 12 13 14 15 16 17 18 19-60
-40
-20
0
20
40
60
Apr
TELECOMMUNICATION SERVICES
(-14.7)
04 05 06 07 08 09 10 11 12 13 14 15 16 17 18 19-15
-10
-5
0
5
10
15
20
Apr
HEALTH CARE
* Three-month moving average of the number of estimates up less number of estimates down, expressed as a percentage of the total number of estimates. Source: Thomson Reuters I/B/E/S.
(4.5)
04 05 06 07 08 09 10 11 12 13 14 15 16 17 18 19-30
-20
-10
0
10
20
30
Apr
UTILITIES
(-13.1)
S&P 600 Sectors Net Revenue Revisions Index
Page 43 / May 16, 2018 / S&P 500/400/600 Weekly Forward Earnings & Valuation www.yardeni.com
Yardeni Research, Inc.
Page 45
Figure 50.
06 07 08 09 10 11 12 13 14 15 16 17 18 190
2
4
6
8
10
12
14
5/10S&P 500/400/600(profit margin)
S&P 500 LargeCap (12.2)S&P 400 MidCap (7.5)S&P 600 SmallCap (5.4)
06 07 08 09 10 11 12 13 14 15 16 17 18 191
3
5
7
9
115/10INDUSTRIALS
(10.2)(6.6)(4.8)
06 07 08 09 10 11 12 13 14 15 16 17 18 191
3
5
7
95/10CONSUMER DISCRETIONARY
(8.3)(6.1)(3.6)
06 07 08 09 10 11 12 13 14 15 16 17 18 190
5
10
15
20
255/10INFORMATION TECHNOLOGY
(22.7)(7.0)(7.2)
06 07 08 09 10 11 12 13 14 15 16 17 18 190
2
4
6
8
10
12
5/10
CONSUMER STAPLES (7.7)(5.2)(2.1)
06 07 08 09 10 11 12 13 14 15 16 17 18 190
2
4
6
8
10
125/10MATERIALS
(11.4)(7.7)(4.8)
06 07 08 09 10 11 12 13 14 15 16 17 18 19-10
-5
0
5
10
15
20
25
5/10
ENERGY(6.8)(2.1)(4.9)
06 07 08 09 10 11 12 13 14 15 16 17 18 190
5
10
15
20
25
30
5/10
REAL ESTATE
(15.9)(13.6)(11.0)
06 07 08 09 10 11 12 13 14 15 16 17 18 195
10
15
20
25
5/10
FINANCIALS(18.7)(17.2)(17.9)
06 07 08 09 10 11 12 13 14 15 16 17 18 19-5
0
5
10
15
20
5/10
TELECOMMUNICATION SERVICES(13.4)(1.0)(-0.6)
06 07 08 09 10 11 12 13 14 15 16 17 18 193
6
9
12
15
5/10
HEALTH CARE (10.5)(7.1)(3.9)
* Time-weighted average of the consensus estimates for current and next year. Source: Thomson Reuters I/B/E/S.
06 07 08 09 10 11 12 13 14 15 16 17 18 194
6
8
10
12
14
5/10UTILITIES
(12.3)(10.8)(10.0) yardeni.com
S&P 500/400/600 Sectors Forward Profit Margin
Page 44 / May 16, 2018 / S&P 500/400/600 Weekly Forward Earnings & Valuation www.yardeni.com
Yardeni Research, Inc.
Page 46
Figure 51.
06 07 08 09 10 11 12 13 14 15 16 17 18 195
10
15
20
25
5/10
S&P 500/400/600(forward P/Es)
S&P 500 LargeCap (16.4)S&P 400 MidCap (17.2)S&P 600 SmallCap (18.3)
06 07 08 09 10 11 12 13 14 15 16 17 18 195
10
15
20
25
5/10
INDUSTRIALS
(16.3)(17.0)(17.8)
06 07 08 09 10 11 12 13 14 15 16 17 18 1910
15
20
25
30
5/10
CONSUMER DISCRETIONARY
(19.4)(14.0)(15.3)
06 07 08 09 10 11 12 13 14 15 16 17 18 195
10
15
20
25
30
5/10
INFORMATION TECHNOLOGY
(18.3)(18.2)(17.0)
06 07 08 09 10 11 12 13 14 15 16 17 18 1910
15
20
25
5/10
CONSUMER STAPLES(16.3)(17.2)(18.5)
06 07 08 09 10 11 12 13 14 15 16 17 18 195
10
15
20
25
5/10
MATERIALS
(15.9)(12.8)(15.3)
06 07 08 09 10 11 12 13 14 15 16 17 18 190
10
20
30
40
50
5/10
ENERGY(19.5)(35.3)(20.8)
06 07 08 09 10 11 12 13 14 15 16 17 18 1910
20
30
40
50
60
70
5/10
REAL ESTATE
(37.7)(30.3)(36.1)
06 07 08 09 10 11 12 13 14 15 16 17 18 195
10
15
20
25
30
35
5/10
FINANCIALS(12.9)(14.2)(14.5)
06 07 08 09 10 11 12 13 14 15 16 17 18 190
10
20
30
40
50
60
5/10
TELECOMMUNICATION SERVICES(9.8)(40.0)(NA)
06 07 08 09 10 11 12 13 14 15 16 17 18 190
10
20
30
40
50
5/10
HEALTH CARE(14.6)(19.3)(31.7)
Source: Thomson Reuters I/B/E/S.
06 07 08 09 10 11 12 13 14 15 16 17 18 195
10
15
20
25
5/10
UTILITIES
(15.7)(19.3)(22.7) yardeni.com
S&P 500/400/600 Sectors Forward P/Es
Page 45 / May 16, 2018 / S&P 500/400/600 Weekly Forward Earnings & Valuation www.yardeni.com
Yardeni Research, Inc.
Page 47
Figure 52.
06 07 08 09 10 11 12 13 14 15 16 17 18 19.0
.5
1.0
1.5
2.0
2.5
5/10S&P 500/400/600(forward P/Sales)
S&P 500 LargeCap (2.00)S&P 400 MidCap (1.29)S&P 600 SmallCap (0.99)
06 07 08 09 10 11 12 13 14 15 16 17 18 19.00.25.50.751.001.251.501.752.00
5/10INDUSTRIALS
(1.66)(1.13)(0.85)
06 07 08 09 10 11 12 13 14 15 16 17 18 19.0
.4
.8
1.2
1.6
2.0
5/10CONSUMER DISCRETIONARY
(1.60)(0.86)(0.55)
06 07 08 09 10 11 12 13 14 15 16 17 18 19.00
.75
1.50
2.25
3.00
3.75
4.505/10INFORMATION TECHNOLOGY
(4.15)(1.27)(1.24)
06 07 08 09 10 11 12 13 14 15 16 17 18 19.00
.25
.50
.75
1.00
1.25
1.50
1.75
5/10
CONSUMER STAPLES
(1.25)(0.89)(0.38)
06 07 08 09 10 11 12 13 14 15 16 17 18 19.25.50.751.001.251.501.752.002.25
5/10MATERIALS
(1.82)(0.98)(0.73)
06 07 08 09 10 11 12 13 14 15 16 17 18 19.0
.5
1.0
1.5
2.0
2.5
3.0
5/10
ENERGY (1.33)(0.74)(1.01)
06 07 08 09 10 11 12 13 14 15 16 17 18 191
2
3
4
5
6
7
8
5/10
REAL ESTATE
(6.0)(4.1)(4.0)
06 07 08 09 10 11 12 13 14 15 16 17 18 19.5
1.0
1.5
2.0
2.5
3.0
3.5
4.0
5/10
FINANCIALS (2.41)(2.44)(2.60)
06 07 08 09 10 11 12 13 14 15 16 17 18 19.0
.5
1.0
1.5
2.0
2.5
5/10
TELECOMMUNICATION SERVICES(1.31)(0.53)(0.62)
06 07 08 09 10 11 12 13 14 15 16 17 18 19.5
1.0
1.5
2.0
2.5
5/10
HEALTH CARE
(1.54)(1.36)(1.23)
Source: Thomson Reuters I/B/E/S.
06 07 08 09 10 11 12 13 14 15 16 17 18 19.5
1.0
1.5
2.0
2.5
3.0
3.5
5/10
UTILITIES(1.93)(2.09)(2.28)
yardeni.com
S&P 500/400/600 Sectors Forward P/Sales
Page 46 / May 16, 2018 / S&P 500/400/600 Weekly Forward Earnings & Valuation www.yardeni.com
Yardeni Research, Inc.
Page 48
http://blog.yardeni.com
http://blog.yardeni.com
[email protected]
Copyright (c) Yardeni Research, Inc. 2018. All rights reserved. The informationcontained herein has been obtained from sources believed to be reliable, but is notnecessarily complete and its accuracy cannot be guaranteed. No representation orwarranty, express or implied, is made as to the fairness, accuracy, completeness, orcorrectness of the information and opinions contained herein. The views and the otherinformation provided are subject to change without notice. All reports posted onwww.yardeni.com, blog.yardeni.com, and YRI’s Apps for iPads and iPhones are issuedwithout regard to the specific investment objectives, financial situation, or particular needsof any specific recipient and are not to be construed as a solicitation or an offer to buy or sellany securities or related financial instruments. Past performance is not necessarily a guideto future results. Company fundamentals and earnings may be mentioned occasionally, butshould not be construed as a recommendation to buy, sell, or hold the company’s stock.Predictions, forecasts, and estimates for any and all markets should not be construed asrecommendations to buy, sell, or hold any security--including mutual funds, futurescontracts, and exchange traded funds, or any similar instruments.
The text, images, and other materials contained or displayed on any Yardeni Research, Inc.product, service, report, email or website are proprietary to Yardeni Research, Inc. andconstitute valuable intellectual property. No material from any part of www.yardeni.com, blog.yardeni.com, and YRI’s Apps for iPads and iPhones may be downloaded, transmitted,broadcast, transferred, assigned, reproduced or in any other way used or otherwisedisseminated in any form to any person or entity, without the explicit written consent ofYardeni Research, Inc. All unauthorized reproduction or other use of material from YardeniResearch, Inc. shall be deemed willful infringement(s) of this copyright and other proprietaryand intellectual property rights, including but not limited to, rights of privacy. YardeniResearch, Inc. expressly reserves all rights in connection with its intellectual property,including without limitation the right to block the transfer of its products and services and/orto track usage thereof, through electronic tracking technology, and all other lawful means,now known or hereafter devised. Yardeni Research, Inc. reserves the right, without furthernotice, to pursue to the fullest extent allowed by the law any and all criminal and civilremedies for the violation of its rights.
The recipient should check any email and any attachments for the presence of viruses.Yardeni Research, Inc. accepts no liability for any damage caused by any virus transmittedby this company’s emails, website, blog and Apps. Additional information available onrequest.