S&P BSE Bharat 22 Index: A benchmark for “Bharat 22” disinvestment program of Government of India Private & Confidential Download this Research Paper from the resources section on your screen.
Transcript
No content below the line No content below the line
S&P BSE Bharat 22 Index: A benchmark for “Bharat 22” disinvestment program of Government of India
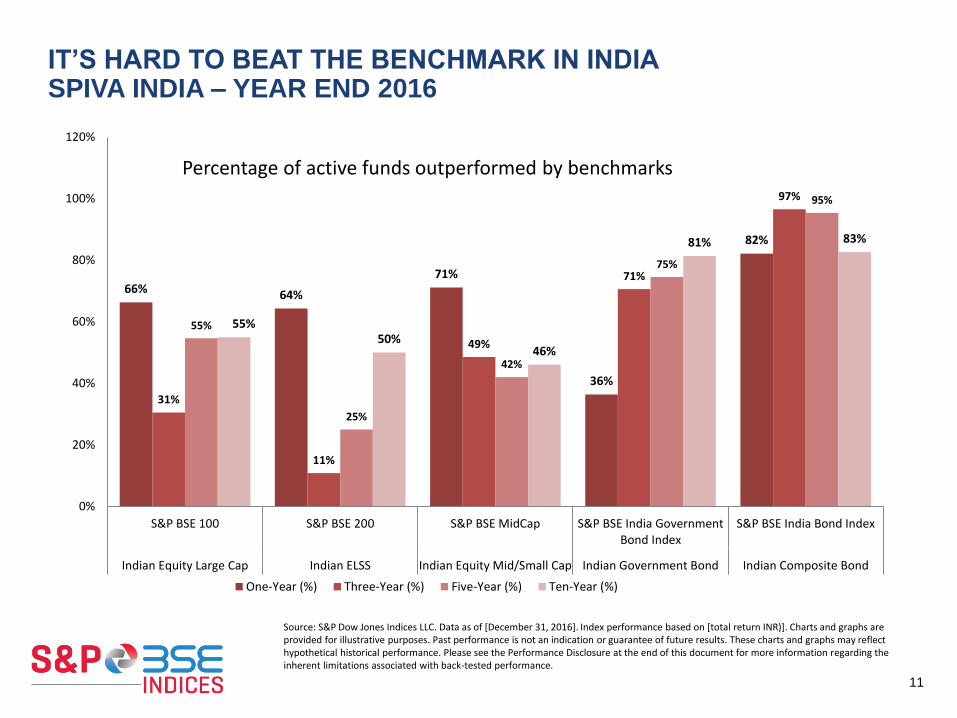
Percentage of active funds outperformed by benchmarks
Source: S&P Dow Jones Indices LLC. Data as of [December 31, 2016]. Index performance based on [total return INR)]. Charts and graphs are provided for illustrative purposes. Past performance is not an indication or guarantee of future results. These charts and graphs may reflect hypothetical historical performance. Please see the Performance Disclosure at the end of this document for more information regarding the inherent limitations associated with back-tested performance.
No content below the line No content below the line
12
No content below the line No content below the line
13
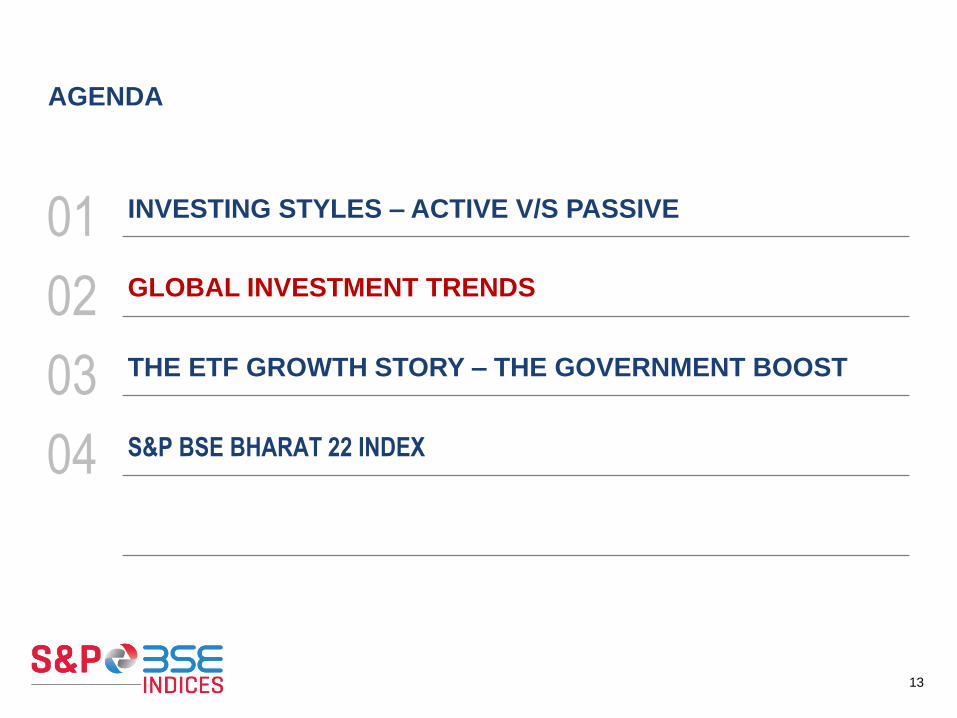
INVESTING STYLES – ACTIVE V/S PASSIVE 01
02
03
04
AGENDA
THE ETF GROWTH STORY – THE GOVERNMENT BOOST
S&P BSE BHARAT 22 INDEX
GLOBAL INVESTMENT TRENDS
No content below the line No content below the line
14
• Increasing focus on passive investing as active investment results are disappointing
• Managing the consequences of low yielding environment and aging populations
• Liabilities growing faster than assets
• Search for returns => more use of alternatives
• More use of ESG strategies in selected countries (especially Nordics)
INVESTMENT TRENDS GLOBALLY
No content below the line No content below the line
15
Source: ETFGI
PASSIVE ADOPTION INCREASING OVER RECENT YEARS…
Since 2007, outflows from actively-managed mutual funds have hit a cumulative $1.2tn since while overall inflows into
index-trackers and ETFs have topped $1.4tn.
PwC Study: global passive assets as a share of total AUM will double from 11% in 2012 to 22% in 2020 (a total of
nearly $23 trillion in 2020).
In 2016 ETF assets overtook hedge fund assets – i.e. the definition of beta eclipsing the definition of alpha.
No content below the line No content below the line
16
ASSET ALLOCATION SHIFT TO ALTERNATIVES
Evolution of aggregate asset allocation from 1997 to 2016 for Australia, Canada, Japan, Netherlands,
Switzerland, UK and US (92% of global pension assets) 1
Source :1 Willis Towers Watson Global Pension Asset Study 2017
• Asset allocation continues to see alternatives added at the expense of equity
• Shift in allocation driven by search for return outside of low yielding bonds and volatile equities
Cash
Alternatives
Bonds
Equities
No content below the line No content below the line
17
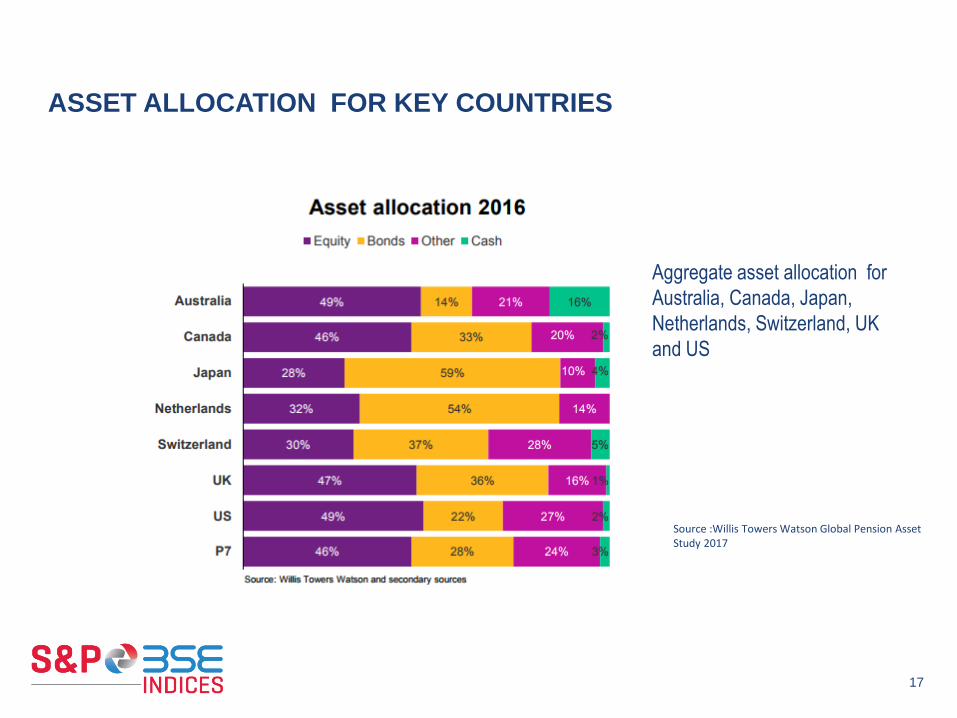
ASSET ALLOCATION FOR KEY COUNTRIES
Source :Willis Towers Watson Global Pension Asset Study 2017
Aggregate asset allocation for
Australia, Canada, Japan,
Netherlands, Switzerland, UK
and US
No content below the line No content below the line
18
GLOBAL ETP ASSET GROWTH AUG’17
No content below the line No content below the line
INDIA – ETF ASSET GROWTH AUG’17
19
No content below the line No content below the line
20
INVESTING STYLES – ACTIVE V/S PASSIVE 01
02
03
04
AGENDA
THE ETF GROWTH STORY – THE GOVERNMENT BOOST
S&P BSE BHARAT 22 INDEX
GLOBAL INVESTMENT TRENDS
No content below the line No content below the line
THE ETF GROWTH STORY IN INDIA –THE GOVERNMENT BOOST
21
• Department of Disinvestment (DOD)in 2012 announced the proposal of a CPSE ETF
for the disinvestment programme
• The first CPSE ETF launched in March 2014 by Goldman Sachs Asset Management
• Notification by Ministry of Labour and Development dated 29th May 2015
• ETF/Index Funds regulated by SEBI that replicate S&P BSE SENSEX and Nifty
• ETFs issued by SEBI regulated mutual funds constructed specifically for
disinvestment of the Government of India in body corporates
• EPFO initiated the investments in the SENSEX and Nifty to invest 5% of their
incremental inflows into the ETFs
• The allocation increased to 10% with current allocations at 15%
• Encouragement to other retirement funds to also follow suit and hence provide a
boost to this growing market
No content below the line No content below the line
22
Source : http://dipam.gov.in
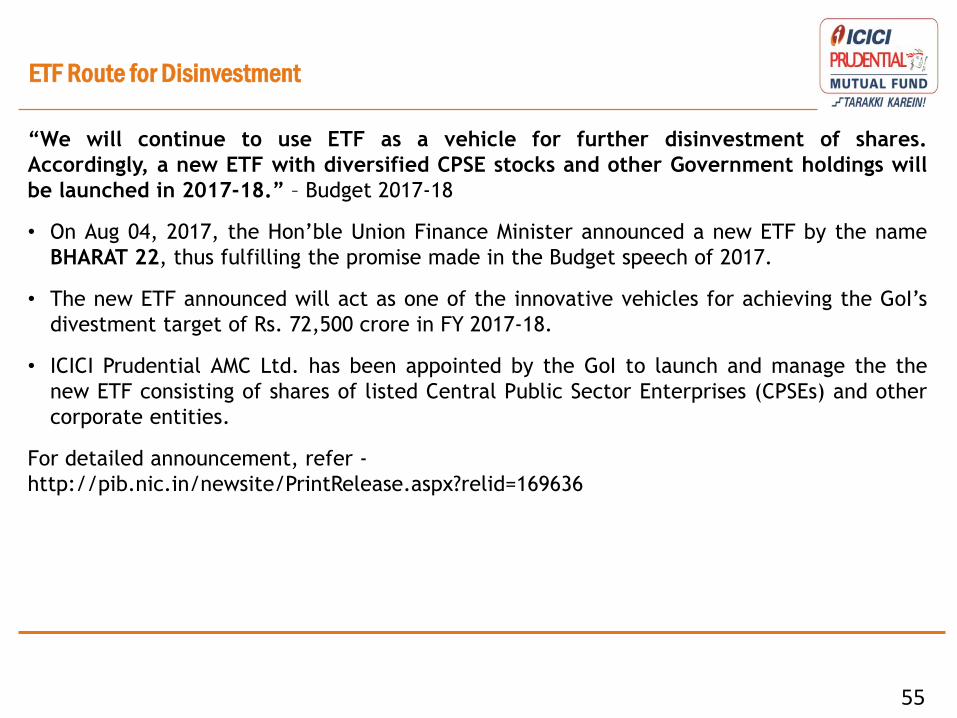
• DOD renamed Department of Investment and Public Asset Management or
'DIPAM' (in Mr Arun Jaitley’s budget speech for 2016-17) proposed a new second
ETF in September 2016
• The government has set a record disinvestment target of INR 72,500 crore (11bn
USD) for Financial Year April 2017- March 2018.
THE ETF GROWTH STORY IN INDIA –THE GOVERNMENT BOOST
No content below the line No content below the line
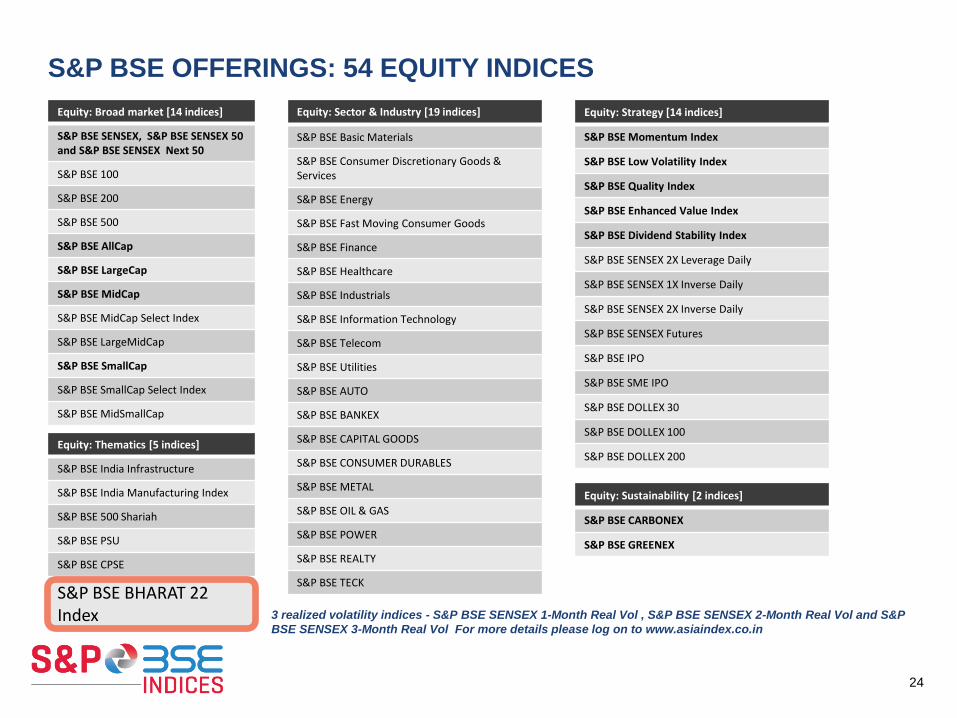
S&P BSE OFFERINGS: 54 EQUITY INDICES
24
3 realized volatility indices - S&P BSE SENSEX 1-Month Real Vol , S&P BSE SENSEX 2-Month Real Vol and S&P
BSE SENSEX 3-Month Real Vol For more details please log on to www.asiaindex.co.in
Equity: Broad market [14 indices]
S&P BSE SENSEX, S&P BSE SENSEX 50 and S&P BSE SENSEX Next 50
S&P BSE 100
S&P BSE 200
S&P BSE 500
S&P BSE AllCap
S&P BSE LargeCap
S&P BSE MidCap
S&P BSE MidCap Select Index
S&P BSE LargeMidCap
S&P BSE SmallCap
S&P BSE SmallCap Select Index
S&P BSE MidSmallCap
Equity: Sector & Industry [19 indices]
S&P BSE Basic Materials
S&P BSE Consumer Discretionary Goods & Services
S&P BSE Energy
S&P BSE Fast Moving Consumer Goods
S&P BSE Finance
S&P BSE Healthcare
S&P BSE Industrials
S&P BSE Information Technology
S&P BSE Telecom
S&P BSE Utilities
S&P BSE AUTO
S&P BSE BANKEX
S&P BSE CAPITAL GOODS
S&P BSE CONSUMER DURABLES
S&P BSE METAL
S&P BSE OIL & GAS
S&P BSE POWER
S&P BSE REALTY
S&P BSE TECK
Equity: Strategy [14 indices]
S&P BSE Momentum Index
S&P BSE Low Volatility Index
S&P BSE Quality Index
S&P BSE Enhanced Value Index
S&P BSE Dividend Stability Index
S&P BSE SENSEX 2X Leverage Daily
S&P BSE SENSEX 1X Inverse Daily
S&P BSE SENSEX 2X Inverse Daily
S&P BSE SENSEX Futures
S&P BSE IPO
S&P BSE SME IPO
S&P BSE DOLLEX 30
S&P BSE DOLLEX 100
S&P BSE DOLLEX 200 Equity: Thematics [5 indices]
S&P BSE India Infrastructure
S&P BSE India Manufacturing Index
S&P BSE 500 Shariah
S&P BSE PSU
S&P BSE CPSE
S&P BSE BHARAT 22 Index
Equity: Sustainability [2 indices]
S&P BSE CARBONEX
S&P BSE GREENEX
No content below the line No content below the line
25
INVESTING STYLES – ACTIVE V/S PASSIVE 01
02
03
04
AGENDA
THE ETF GROWTH STORY – THE GOVERNMENT BOOST
S&P BSE BHARAT 22 INDEX
GLOBAL INVESTMENT TRENDS
No content below the line No content below the line
ABOUT: S&P BSE BHARAT 22 INDEX
26
For detailed index methodology log on www.asiaindex.co.in; 1 – CPSE: Central Public Sector Enterprise, 2 - SUUTI :
Special Undertaking of Unit Trust of India, and 3 - PSBs: Public Sector Banks
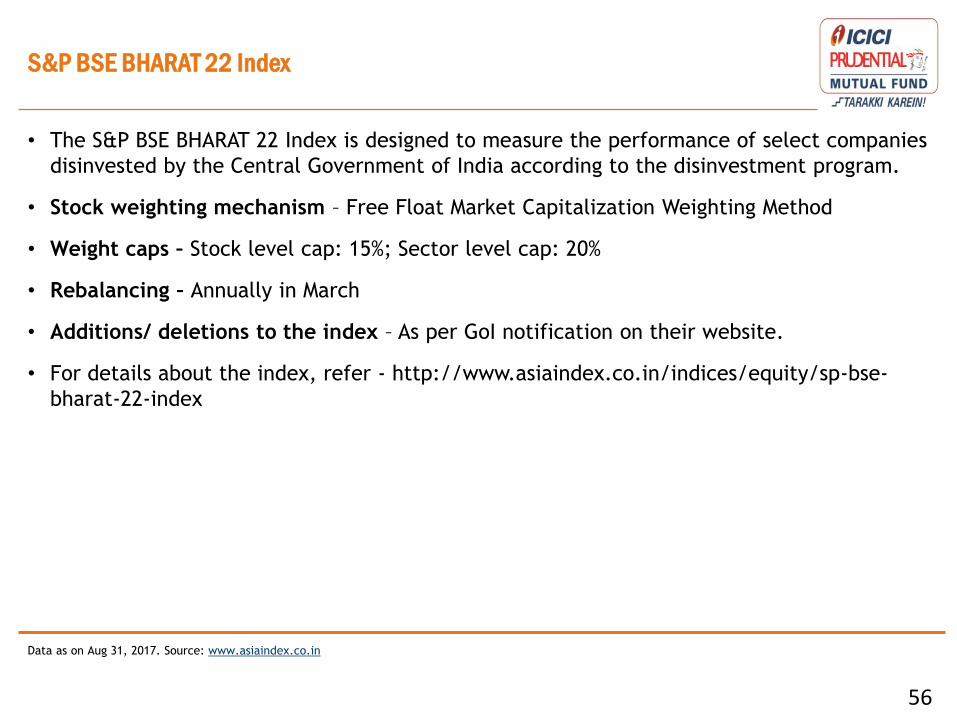
Objective –
The S&P BSE Bharat 22 index is designed to measure the performance of select companies
disinvested by the Central Government of India via Bharat 22 program.
• Universe. Companies are selected from CPSEs1, SUUTI2 companies and PSBs3. - CPSE - are those companies in which the direct holding of the Central Government or other CPSEs is
51% or more.
- SUUTI – Special Undertaking of Unit Trust of India-UTI-I investments managed by the Government
- PSBs - Public Sector Banks (PSBs) are banks where a majority stake (i.e. more than 50%) is held by a
government
• Constituent Selection. List published under (Bharat 22) disinvestment program by
Government of India
• Rebalancing. Annually, in March
• Weighing. Maximum BSE sector weight and individual stock weight capped at 20% and 15%
respectively
• The index diversified by BSE sectors - represent each sector covered by underlying universe,
includes energy, finance, fast moving consumer goods, industrials, basic materials, and utilities
No content below the line No content below the line
Maharatna 5
Miniratna - I 2
Navaratna 9
INDEX COMPOSITION (1)
27
Source: Asia Index Pvt. Ltd. And www.dpe.gov.in; Data of as July 31, 2017. Past performance is no guarantee of future results. Table is provided for illustrative
purposes and reflects hypothetical historical data. Please see the Performance Disclosure at the end of this document for more information regarding the inherent
limitations associated with back-tested performance
No content below the line No content below the line
INDEX COMPOSITION (2)
28
Source: Asia Index Pvt. Ltd. Data of as July 31, 2017. Past performance is no guarantee of future results. Table is provided for illustrative purposes and reflects
hypothetical historical data. Please see the Performance Disclosure at the end of this document for more information regarding the inherent limitations associated with
back-tested performance
BSE Sectors S&P BSE Bharat 22
Underlying Universe
Industrials 22.6% 18.1%
Finance 20.3% 27.2%
Utilities 20.0% 11.6%
Energy 17.5% 17.8%
FMCG 15.2% 22.9%
Basic Materials 4.4% 2.2%
Telecom - 0.1%
Total 100.0% 100.0%
BSE Size S&P BSE Bharat 22
Underlying Universe
LargeCap 89.3% 88.1%
MidCap 8.5% 8.4%
SmallCap 2.1% 3.5%
NA 0.0% 0.1%
Total 100.0% 100.0%
No content below the line No content below the line
BACK TEST INDEX PERFORMANCE
29
Source: Asia Index Private Limited; Data as of July 31, 2017, Data from March 17, 2006 up to July 31, 2017. Index performance based on total return [INR]. All data prior to
launch date are back-tested. It is not possible to invest directly in an index. Past performance is no guarantee of future results. Please see the Performance Disclosure at
the end of this document for more information regarding the inherent limitations associated with back-tested performance
0
500
1,000
1,500
2,000
2,500
3,000
3,500
4,000
4,500
5,000
Re
bas
ed
Ind
ex
Leve
ls
S&P BSE Bharat 22 Index TR S&P BSE SENSEX (TR)
No content below the line No content below the line
RISK-RETURN PROFILE
30
Source: Asia Index Private Limited; Data as of July 31, 2017, Data from March 17, 2006 up to July 31, 2017. Index performance based on total return [INR]. All data prior to
launch date are back-tested. It is not possible to invest directly in an index. Past performance is no guarantee of future results. Please see the Performance Disclosure at
the end of this document for more information regarding the inherent limitations associated with back-tested performance
Since inception S&P BSE Bharat 22 has outperformed S&P BSE SENSEX amid marginal volatility
Stats Data Label S&P BSE Bharat 22 S&P BSE SENSEX
CAGR (%)
1 year 20.0 17.4
3 year 10.6 9.4
5 year 14.4 15.2
10 year 12.9 9.2
Since Inception 14.3 11.7
Annualized Volatility (%)
1 year 13.2 10.5
3 year 16.5 14.0
5 year 17.5 14.4
10 year 23.1 23.5
Since Inception 23.3 23.7
Risk Adjusted Returns
1 year 1.5 1.7
3 year 0.6 0.7
5 year 0.8 1.1
10 year 0.6 0.4
Since Inception 0.6 0.5
No content below the line No content below the line
ASIA INDEX – CREATING S&P BSE INDICES
Asia Index Pvt. Ltd –A 50-50 partnership between S&P Dow Jones Indices LLC, the world’s largest provider of
financial market indices, and BSE Ltd, Asia’s first exchange and home to the iconic SENSEX index - a leading
indicator of Indian equity market performance
Building a local index “culture”
• Experience: Both BSE and S&P Dow Jones Indices have over 115 years of experience in the financial markets and
global experience with pension funds.
• Domain Expertise:
– Across asset classes/themes – Equities, Fixed Income, Commodities, Real Estate and ESG (sustainability) etc.
– Regions - Developed, Emerging and Frontier markets
• Compliance: Stringent internal compliance followed
• Systematic and Standard processes and procedures
• Quality Data and reliable data
• Global Technology and systems: Systems that work round the clock
• 24x6 client servicing, from 4 different locations globally
• Location Flexibility: In case of disaster, ability to calculate indices from various regions across the world
31
No content below the line No content below the line
BACK-TESTED PERFORMANCE DISCLOSURE
32
S&P BSE SENSEX Index , S&P BSE Auto Index, S&P BSE 100 Index, S&P BSE 200 Index, S&P BSE Midcap Index, S&P BSE Government Bond Index, S&P BSE India Bond
Index Charts and graphs are provided for illustrative purposes. Past performance is no guarantee of future results. These charts and graphs may reflect hypothetical historical
performance. All information presented prior to the launch date is back-tested. Back-tested performance is not actual performance, but is hypothetical. The back-test calculations
are based on the same methodology that was in effect when the index was officially launched. However, it should be noted that the historic calculations of an Economic Index may
change from month to month based on revisions to the underlying economic data used in the calculation of the index.
AIPL defines various dates to assist our clients in providing transparency on their products. The First Value Date is the first day for which there is a calculated value (either live or
back-tested) for a given index. The Base Date is the date at which the Index is set at a fixed value for calculation purposes. The Launch Date designates the date upon which the
values of an index are first considered live: index values provided for any date or time period prior to the index’s Launch Date are considered back-tested. AIPL defines the Launch
Date as the date by which the values of an index are known to have been released to the public, for example via the company’s public website or its data feed to external parties.
Past performance of the Index is not an indication of future results. Prospective application of the methodology used to construct the Index may not result in performance
commensurate with the back-test returns shown. The back-test period does not necessarily correspond to the entire available history of the Index. Please refer to the methodology
paper for the Index, available at www.spdji.com and www.asiaindex.co.in for more details about the index, including the manner in which it is rebalanced, the timing of such
rebalancing, criteria for additions and deletions, as well as all index calculations.
Another limitation of using back-tested information is that the back-tested calculation is generally prepared with the benefit of hindsight. Back-tested information reflects the
application of the index methodology and selection of index constituents in hindsight. No hypothetical record can completely account for the impact of financial risk in actual trading.
For example, there are numerous factors related to the equities, fixed income, or commodities markets in general which cannot be, and have not been accounted for in the
preparation of the index information set forth, all of which can affect actual performance.
Index returns shown do not represent the results of actual trading of investable assets/securities. It is not possible to invest directly in an index. AIPL or its agent maintains the S&P
BSE Indices and calculates the Index levels and performance shown or discussed, but does not manage actual assets. Index returns do not reflect payment of any sales charges or
fees an investor may pay to purchase the securities underlying the Index or investment funds that are intended to track the performance of the Index. The imposition of these fees
and charges would cause actual and back-tested performance of the securities/fund to be lower than the Index performance shown. As a simple example, if an index returned 10%
on a US $100,000 investment for a 12-month period (or US $10,000) and an actual asset-based fee of 1.5% was imposed at the end of the period on the investment plus accrued
interest (or US $1,650), the net return would be 8.35% (or US $8,350) for the year. Over a three year period, an annual 1.5% fee taken at year end with an assumed 10% return per
year would result in a cumulative gross return of 33.10%, a total fee of US $5,375, and a cumulative net return of 27.2% (or US $27,200).
The S&P BSE Indices (the “Indices”) are published by Asia Index Private Limited (“AIPL”), which is a joint venture among affiliates of S&P Dow Jones Indices LLC (“SPDJI”) and
BSE Limited (“BSE”). Standard & Poor’s® and S&P® are registered trademarks of Standard & Poor’s Financial Services LLC (“S&P”) and Dow Jones® is a registered trademark
of Dow Jones Trademark Holdings LLC (“Dow Jones”). BSE® and SENSEX® are registered trademarks of BSE. These trademarks have been licensed to AIPL.
Redistribution, reproduction and/or photocopying in whole or in part are prohibited without written permission. This document does not constitute an offer of services in
jurisdictions where AIPL, BSE, S&P Dow Jones Indices LLC or their respective affiliates (collectively “AIPL Companies”) do not have the necessary licenses. All information
provided by AIPL Companies is impersonal and not tailored to the needs of any person, entity or group of persons. AIPL Companies receive compensation in connection with
licensing its indices to third parties. Past performance of an index is not a guarantee of future results.
It is not possible to invest directly in an index. Exposure to an asset class represented by an index is available through investable instruments based on that index. AIPL
Companies do not sponsor, endorse, sell, promote or manage any investment fund or other investment vehicle that is offered by third parties and that seeks to provide an
investment return based on the performance of any index. AIPL Companies make no assurance that investment products based on the index will accurately track index
performance or provide positive investment returns. AIPL and S&P Dow Jones Indices LLC are not investment advisors, and the AIPL Companies make no representation
regarding the advisability of investing in any such investment fund or other investment vehicle. A decision to invest in any such investment fund or other investment vehicle
should not be made in reliance on any of the statements set forth in this document. Prospective investors are advised to make an investment in any such fund or other vehicle
only after carefully considering the risks associated with investing in such funds, as detailed in an offering memorandum or similar document that is prepared by or on behalf of
the issuer of the investment fund or other vehicle. Inclusion of a security within an index is not a recommendation by the AIPL Companies to buy, sell, or hold such security, nor
is it considered to be investment advice. Closing prices for S&P BSE Indices are calculated by AIPL or its agent based on the closing price of the individual constituents of the
index as set by their primary exchange. Closing prices are received by AIPL or its agent from one of its third party vendors and verified by comparing them with prices from an
alternative vendor. The vendors receive the closing price from the primary exchanges. Real-time intraday prices are calculated similarly without a second verification.
These materials have been prepared solely for informational purposes based upon information generally available to the public from sources believed to be reliable. No content
contained in these materials (including index data, ratings, credit-related analyses and data, model, software or other application or output therefrom) or any part thereof
(Content) may be modified, reverse-engineered, reproduced or distributed in any form by any means, or stored in a database or retrieval system, without the prior written
permission of AIPL. The Content shall not be used for any unlawful or unauthorized purposes. AIPL and its third-party data providers and licensors and the other AIPL
Companies (collectively “AIPL Parties”) do not guarantee the accuracy, completeness, timeliness or availability of the Content. The AIPL Parties are not responsible for any
errors or omissions, regardless of the cause, for the results obtained from the use of the Content. THE CONTENT IS PROVIDED ON AN “AS IS” BASIS. THE AIPL PARTIES
DISCLAIM ANY AND ALL EXPRESS OR IMPLIED WARRANTIES, INCLUDING, BUT NOT LIMITED TO, ANY WARRANTIES OF MERCHANTABILITY OR FITNESS FOR A
PARTICULAR PURPOSE OR USE. In no event shall the AIPL Parties be liable to any party for any direct, indirect, incidental, exemplary, compensatory, punitive, special or
consequential damages, costs, expenses, legal fees, or losses (including, without limitation, lost income or lost profits and opportunity costs) in connection with any use of the
Content even if advised of the possibility of such damages.
No content below the line No content below the line
Increase in allocation into financial savings compared to physical savings .
45
Sensex close to 32,000. What Next?
Markets at all time high
47
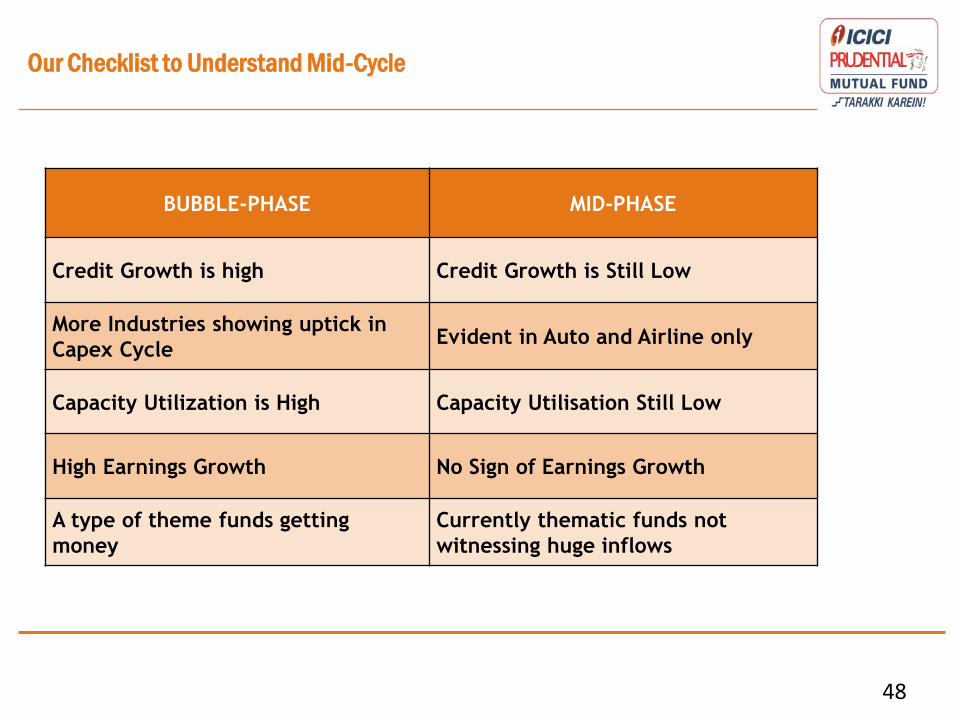
Our Checklist to Understand Mid-Cycle
BUBBLE-PHASE MID-PHASE
Credit Growth is high Credit Growth is Still Low
More Industries showing uptick in
Capex Cycle Evident in Auto and Airline only
Capacity Utilization is High Capacity Utilisation Still Low
High Earnings Growth No Sign of Earnings Growth
A type of theme funds getting
money
Currently thematic funds not
witnessing huge inflows
48
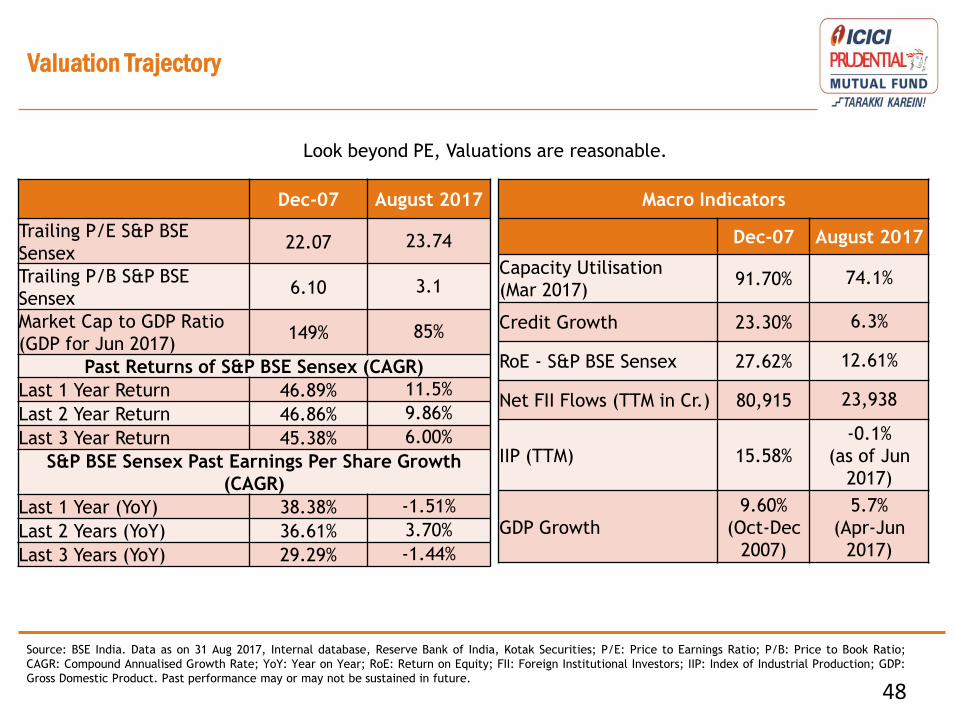
Valuation Trajectory
Look beyond PE, Valuations are reasonable.
EPS growth has been nearly flat in the last 3
years. PE is high more due to denominator issue.
48
Source: BSE India. Data as on 31 Aug 2017, Internal database, Reserve Bank of India, Kotak Securities; P/E: Price to Earnings Ratio; P/B: Price to Book Ratio;
CAGR: Compound Annualised Growth Rate; YoY: Year on Year; RoE: Return on Equity; FII: Foreign Institutional Investors; IIP: Index of Industrial Production; GDP:
Gross Domestic Product. Past performance may or may not be sustained in future.
Dec-07 August 2017
Trailing P/E S&P BSE
Sensex 22.07 23.74
Trailing P/B S&P BSE
Sensex 6.10 3.1
Market Cap to GDP Ratio
(GDP for Jun 2017) 149% 85%
Past Returns of S&P BSE Sensex (CAGR)
Last 1 Year Return 46.89% 11.5%
Last 2 Year Return 46.86% 9.86%
Last 3 Year Return 45.38% 6.00%
S&P BSE Sensex Past Earnings Per Share Growth
(CAGR)
Last 1 Year (YoY) 38.38% -1.51%
Last 2 Years (YoY) 36.61% 3.70%
Last 3 Years (YoY) 29.29% -1.44%
Macro Indicators
Dec-07 August 2017
Capacity Utilisation
(Mar 2017) 91.70% 74.1%
Credit Growth 23.30% 6.3%
RoE - S&P BSE Sensex 27.62% 12.61%
Net FII Flows (TTM in Cr.) 80,915 23,938
IIP (TTM) 15.58%
-0.1%
(as of Jun
2017)
GDP Growth
9.60%
(Oct-Dec
2007)
5.7%
(Apr-Jun
2017)
Investing in Exchange Traded Funds (ETFs)
49
What is an ETF?
50
ETFs are passively managed mutual fund schemes tracking a benchmark index and reflect the
performance of that index. The types of ETFs are as under:
• Equity ETFs • Debt ETFs • Commodity ETFs
Like an index fund… 1. Tracks an index
2. Open ended mutual fund scheme
3. Lower expense ratio compared to
actively managed schemes
4. Lower turnover
5. More transparent
Like a stock… 1. Intraday trading on the exchange
2. Real time prices
3. Put limit orders
4. Minimum trading lot - 1 unit
5. Delivery into your Demat account
Why invest in ETFs?
51
Low cost as compared to actively managed mutual fund schemes
Diversification
Trading at real time NAV Index is based on research and back
tested data
Transparency in holdings and price
Periodic portfolio rebalancing
Adequate liquidity with AMC and on stock exchange
Benefits offered by ETFs:
Growth of Global ETFs
52
• Over the past 10 years, Assets under Management (AUM) of ETFs across the globe has grown
exponentially with assets of US$ 4.1 trillion as on July 2017.
• AUM of Global ETFs is expected to touch US$ 7 trillion by 2021.
In the above chart, bars represent AUM and the line represents number of ETFs.
Data Source: www.etfgi.com. Data as on Aug 31, 2017.
• Mix of leaders from different sectors representing balance between stability and growth. Bluechip companies
• Stock level cap of 15% and sector level cap of 20% applied annually at rebalancing. Stock and Sector cap
• Reduces concentration of few heavy weight companies by considering shares available for trading in the market.
Free Float Market Capitalization Method
S&P BSE BHARAT 22 Index Reasons to invest
59
*Data as on Aug 31, 2017. P/E: Price to Earnings Ratio, P/B: Price to Book Ratio. NFO: New Fund Offer.
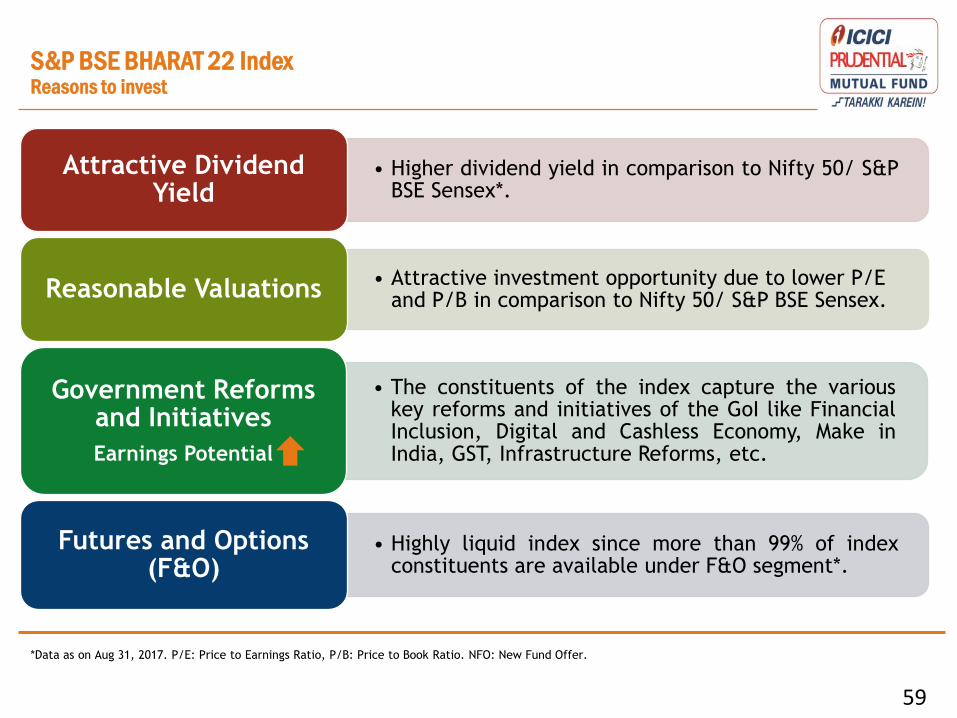
• Higher dividend yield in comparison to Nifty 50/ S&P BSE Sensex*.
Attractive Dividend Yield
• Attractive investment opportunity due to lower P/E and P/B in comparison to Nifty 50/ S&P BSE Sensex. Reasonable Valuations
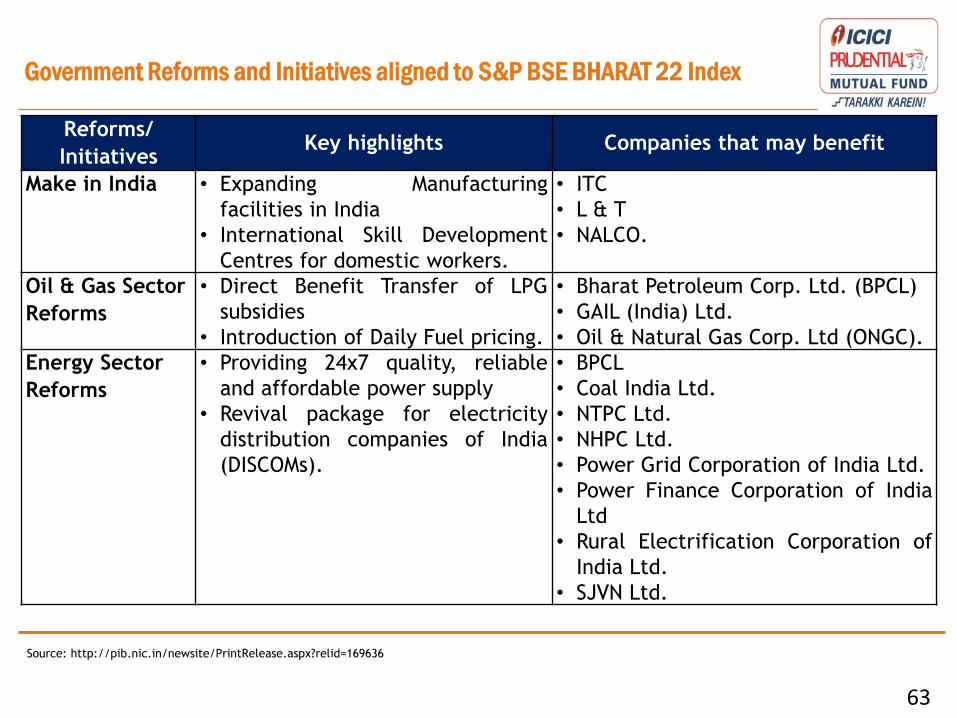
• The constituents of the index capture the various key reforms and initiatives of the GoI like Financial Inclusion, Digital and Cashless Economy, Make in India, GST, Infrastructure Reforms, etc.
Government Reforms and Initiatives
Earnings Potential
• Highly liquid index since more than 99% of index constituents are available under F&O segment*.
Futures and Options (F&O)
S&P BSE BHARAT 22 Index Reasons to invest
60
Data as on Aug 31, 2017. Data Source: AIPL, NSE, Edelweiss Research. Returns and Earnings Growth in CAGR terms. Past Performance may or may not sustain in
future.
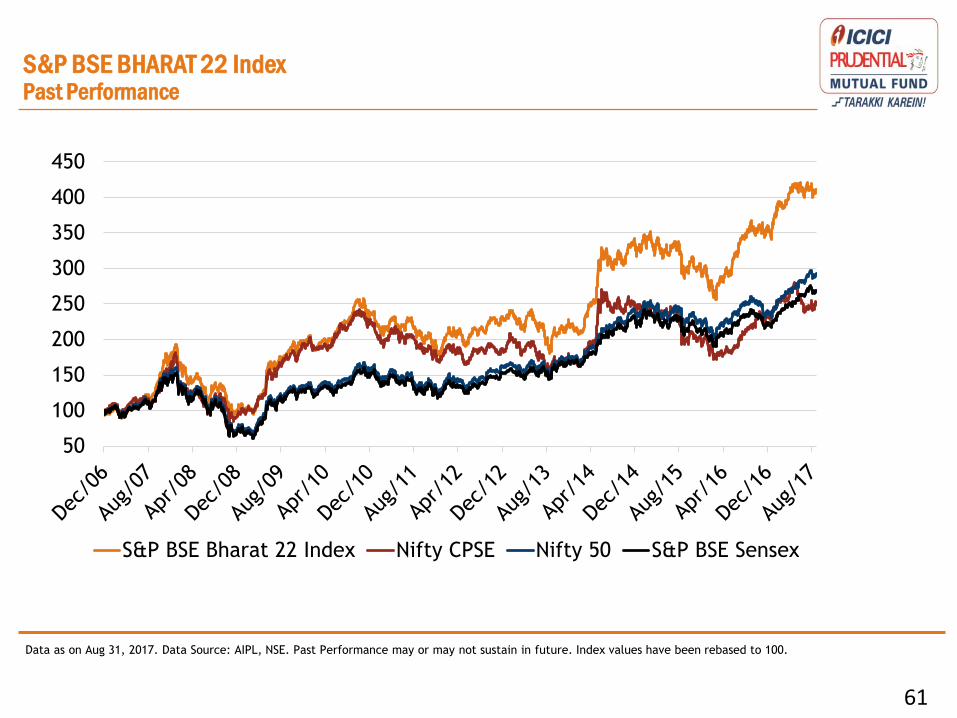
S&P BSE BHARAT 22 Index Past Performance & Statistics
Name of the index Total Returns (CAGR %)
1 year 2 years 3 years 5 years 7 years 10 years
S&P BSE BHARAT 22
Index 14.5 16.3 9.7 14.4 8.5 13.0
Nifty CPSE 15.8 10.3 0.4 6.9 1.6 8.5
S&P BSE SENSEX 13.0 11.4 7.5 14.4 10.1 9.1
NIFTY 50 14.3 13.1 9.1 15.2 10.7 9.9
Name of the
index
Earnings
Growth
(FY17 to
FY19E)
P/E P/BV Dividend
Yield
Aug-17 Mar-19E Aug-17 Mar-19E Aug-17
S&P BSE BHARAT
22 Index 16% 19 13 2.0 1.8 2.4
Nifty CPSE 12% 12 11 2.1 1.6 3.9
S&P BSE SENSEX 14% 23 16 3.0 2.6 1.2
NIFTY 50 13% 26 16 3.5 2.6 0.9
61
Data as on Aug 31, 2017. Data Source: AIPL, NSE. Past Performance may or may not sustain in future. Index values have been rebased to 100.
Government Reforms and Initiatives aligned to S&P BSE BHARAT 22 Index
Thank You
64
An Irrational
Market
Sentiment
Mutual Fund investments are subject to market risks, read all scheme related
documents carefully.
Disclaimer: All figures and data given in the document are dated unless stated otherwise. In the preparation of the material contained in this
document, the information used is publicly available, including information developed in-house. Some of the material used in the document may have
been obtained from members/persons other than the entity and/or its affiliates and which may have been made available to the entity and/or to its
affiliates. Information gathered and material used in this document is believed to be from reliable sources. The entity however does not warrant the
accuracy, reasonableness and / or completeness of any information. We have included statements / opinions / recommendations in this document,
which contain words, or phrases such as “will”, “expect”, “should”, “believe” and similar expressions or variations of such expressions, that are
“forward looking statements”. Actual results may differ materially from those suggested by the forward looking statements due to risk or uncertainties
associated with our expectations with respect to, but not limited to, exposure to market risks, general economic and political conditions in India and
other countries globally, which have an impact on our services and / or investments, the monetary and interest policies of India, inflation, deflation,
unanticipated turbulence in interest rates, foreign exchange rates, equity prices or other rates or prices etc.
The entity (including its affiliates) and any of its officers, directors, personnel and employees, shall not liable for any loss, damage of any nature,
including but not limited to direct, indirect, punitive, special, exemplary, consequential, as also any loss of profit in any way arising from the use of
this material in any manner. The recipient alone shall be fully responsible/are liable for any decision taken on this material. Investors are advised to
consult their own legal, tax and financial advisors to determine possible tax, legal and other financial implication or consequence of subscribing to any
investment.
The Information contained herein should not be construed as a forecast or promise nor should it be considered as an investment advice. The
stock(s)/sector(s) mentioned in this communication do not constitute any recommendation and ICICI Prudential Mutual Fund may or may not have any
future position in these stock(s). Past performance may or may not be sustained in future.
65
No content below the line No content below the line