54
SP1. USING REPRESENTATIONS AND MODELS A Tour Of The Science Practices
| Date post: | 26-Dec-2015 |
| Category: |
Documents |
| Upload: | bernard-mccarthy |
| View: | 216 times |
| Download: | 2 times |
SP1. USING REPRESENTATIONS AND MODELS
A Tour Of The Science Practices
What’s a Model?Models are representations of thoughts. Models can be physical, computational, mathematical, or literally any other way that a thought can be represented (though in science, they tend to be one of the first three, or maybe verbal). You are expected to be able to create, describe, refine, use, and re-express representations and models in the work that you do in this course.
Be Careful!Do not make the mistake of confusing a model for the reality that it represents.
Models are always simplifications of reality.
3 Ways to Work On SP11. When you are shown models or
representations, take a moment and acknowledge that is what is happening.
2. Create alternate models and representations of the concepts that you are investigating from the ones that you are being shown by your teacher.
3. Take models and representations that you are using in class, and identify the simplifications in them. Refine the model to show this additional complexity.
ActivityWorking in groups of three or four, analyze a model:• Graphically represent the model.• Explain what it being modeled.• Describe the simplifications in the
model.
SP2. USING APPROPRIATE MATHEMATICS
A Tour Of The Science Practices
Math!Math is the most objective way we have to describe and model scientific phenomena.
You are expected to be able to justify the selection of a mathematical routine, apply a mathematical routine, and estimate numerical quantities. Biologists have an unfair reputation for not liking math. This is not acceptable. Math must be embraced, and loved.
3 Ways to Work On SP21. Practice, practice, practice. 2. Try to come up with estimates of
ridiculously big numbers.3. When you see math being used in
class, try to justify why the math is appropriate for the task it is being used for.
ActivityEstimate each of the following:• The number of students in the
school.• The number of people in deer park.• The number of hairs on your arm.How is the process that you use similar for each of these activities?
How is it different?
SP2. USING APPROPRIATE MATHEMATICS MATH SKILLS- METRIC SYSTEM
A Tour Of The Science Practices
What You Have To DoThe metric system is the measurement system of science. It is based on powers of 10, which modify a base quantity of the major dimensions of matter, energy, and time in the universe.
Prefixes are used to denote every power of 10 from 10-3 through 103, and then every three powers of ten larger and smaller.
Biology ranges all over the metric system. Selected prefixes and their quantities are provided on the formula sheet that you will have during the AP exam.
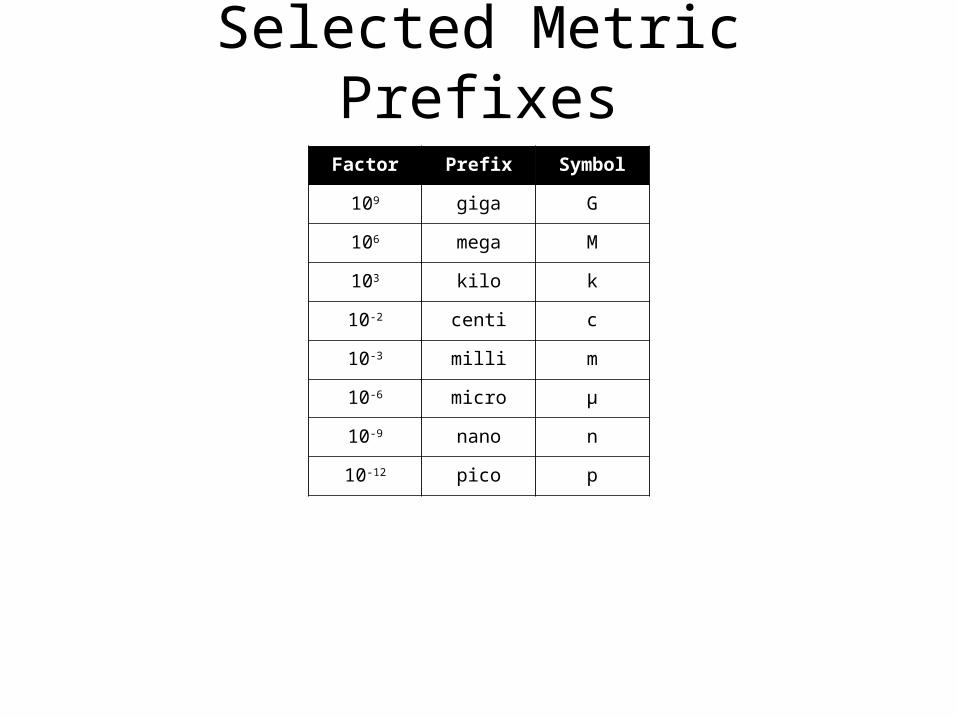
Selected Metric Prefixes
Factor Prefix Symbol
109 giga G
106 mega M
103 kilo k
10-2 centi c
10-3 milli m
10-6 micro μ
10-9 nano n
10-12 pico p
The Metric System Rules!There are a lot of benefits to using the metric system.1. The common powers of 10 structure
makes arithmetic with widely different numbers very easy.
2. It is universal among all scientists on the planet. A kilometer always signifies the same distance in all cultures.
You need to use the metric system in all data recording and data calculations that you engage in during this course.
SP2. USING APPROPRIATE MATHEMATICS MATH SKILLS- DILUTIONS
A Tour Of The Science Practices
What You Have To DoThe dilution equation is provided on the formula sheet that you will have during the AP exam. It is useful in lab. You may use it or not, but you need to be able to use it (for the exam, and in your life as a competent laboratory scientist
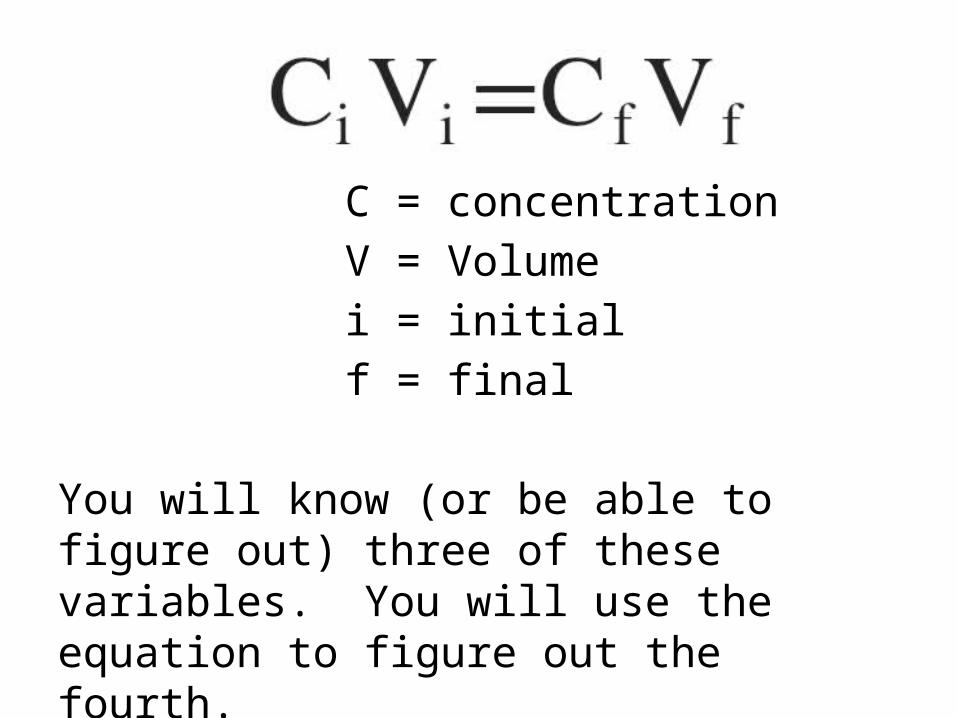
C = concentration
V = Volumei = initialf = final
You will know (or be able to figure out) three of these variables. You will use the equation to figure out the fourth.
Sample ProblemHow much of a solution of 2M sucrose must be diluted to make 3L of a 1M sucrose solution?
SP3. SCIENTIFIC QUESTIONING
A Tour Of The Science Practices
What makes a question scientific?Not all questions can be addressed
scientifically. There are limitations on the kinds of questions that science can answer. Example: What happens to us when we die? Inherently limited in what science can tell us Scientific answer: Our bodies are decomposed back in to simpler compounds, which are reincorporated by the ecosystems of the planet. You need to be able to pose, refine, and evaluate scientific questions.
3 Ways to Work On SP31. Question how the knowledge that
you are learning in this course was determined.
2. Work on asking scientifically useful/interesting questions…and then refining them into even better questions.
3. Try to recognize when a question is not going to be appropriate for scientific investigation.

ActivityWorking in groups of three or four, ask some questions:• Pick an area of biology that interests
you.• Write two examples of scientifically valid
questions.• Write two examples of scientifically
invalid questionsWhat makes a particular question more or less valid for scientific inquiry?Revise your scientifically invalid questions to make them valid.
SP4. DATA COLLECTION
A Tour Of The Science Practices
Data is ImportantScience relies on data to answer questions.
Data is generated in many different circumstances, including field investigations and experimentation.
The circumstances in which data is collected will influence how useful that data is for answering questions.
You need to be able to justify the selection of data, design a plan to collect data, collect data, and evaluate sources of data.
3 Ways to Work On SP41. Identify which data sources will be
most useful for answering particular scientific questions.
2. Determine what sorts of equipment and procedures are used to collect specific types of data.
3. Use the data sets generated by other scientists to develop your answers to scientific questions.

ActivityYou are interested in investigating the feeding preferences of slugs.• Determine how you are going to
collect data.• Determine what data you will collect.• Explain how your data will help you
address your question.
SP5. DATA ANALYSIS
A Tour Of The Science Practices
Once You Have It, Analyze ItThe analysis of data is how science develops explanations. Analysis and evaluation of data include statistical, graphical, and computational manipulation of a data source. You need to be able to analyze data, refine observations and measurements based on the analysis of data, and evaluate the evidence provided by a data set.
3 Ways to Work On SP51. When investigating a particular
scientific explanation, evaluate the data that supports (and refutes) the explanation.
2. In experimental settings, use the data that is being generated to determine if the data is appropriate for the experiment.
3. Determine the statistical aspects of a particular data set, and consider how they support or refute a particular explanation for the data set.
SP5. DATA ANALYSISMATH SKILLS- DESCRIPTIVE STATISTICS
A Tour Of The Science Practices
How do we describe data?Descriptive statistics are used to tell us about the characteristics of a particular data set. Each descriptive statistic tells us something different, and may be more or less useful depending on the data set, and the concepts it is supporting or refuting. Mean, median, mode, range
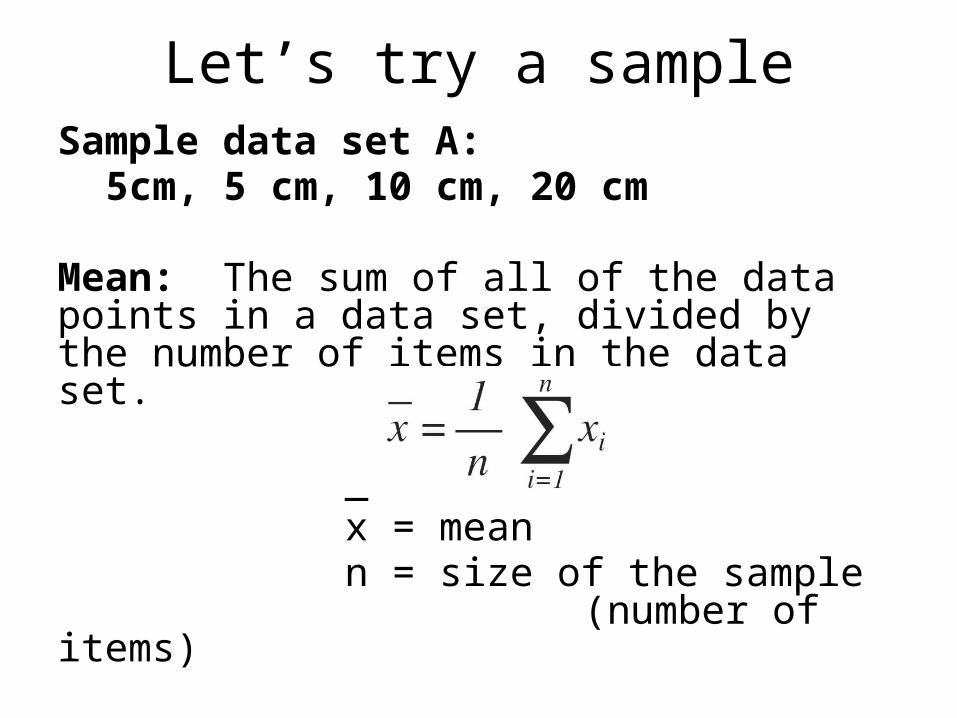
Let’s try a sampleSample data set A:
5cm, 5 cm, 10 cm, 20 cm
Mean: The sum of all of the data points in a data set, divided by the number of items in the data set.
_x = meann = size of
the sample (number of items)
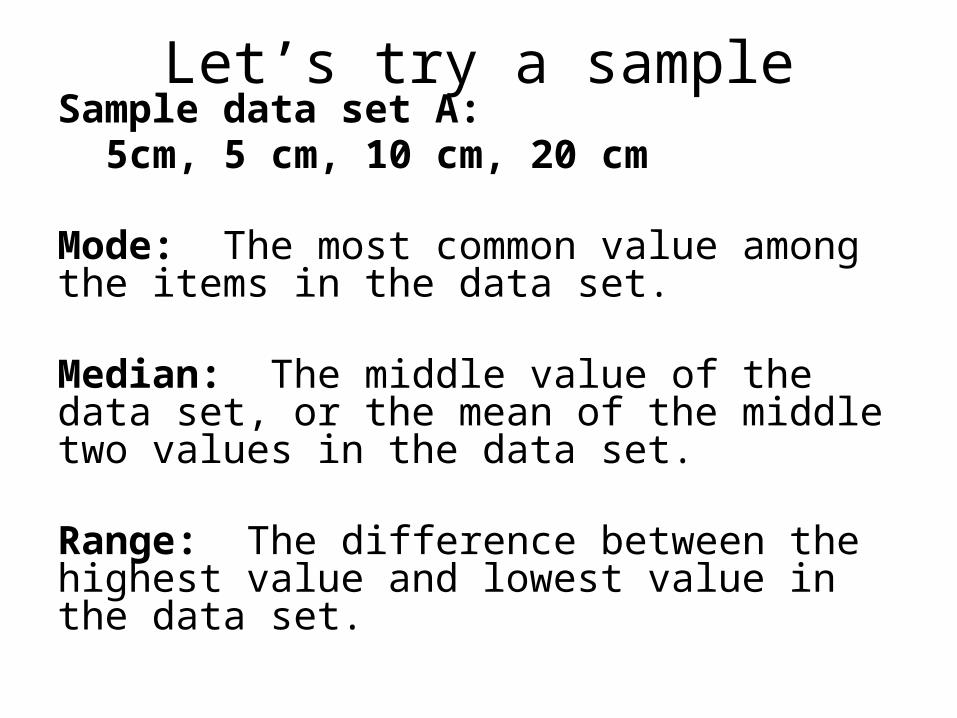
Let’s try a sampleSample data set A:
5cm, 5 cm, 10 cm, 20 cm
Mode: The most common value among the items in the data set.
Median: The middle value of the data set, or the mean of the middle two values in the data set.
Range: The difference between the highest value and lowest value in the data set.
SP5. DATA ANALYSISMATH SKILLS- STANDARD DEVIATION
A Tour Of The Science Practices

Standard DeviationA measurement of the variance of the items in the data set The higher the standard deviation, the further away most data points are from the mean of the data set. The equation is on the formula sheet in sigma notation.
s = standard deviation
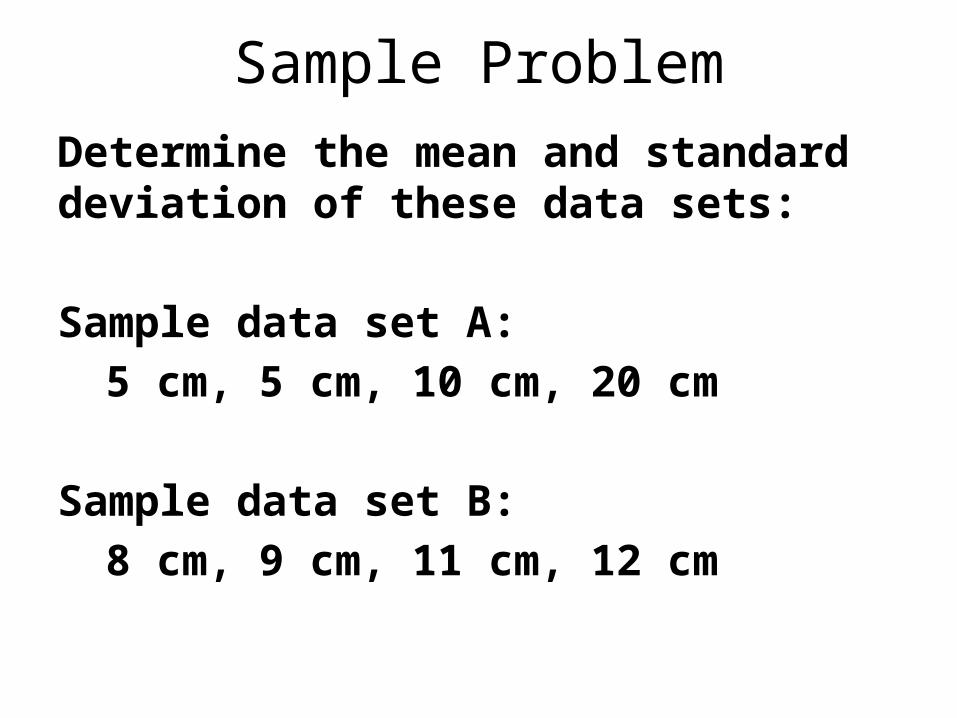
Sample ProblemDetermine the mean and standard deviation of these data sets:
Sample data set A: 5 cm, 5 cm, 10 cm, 20 cm
Sample data set B: 8 cm, 9 cm, 11 cm, 12 cm
SP5. DATA ANALYSISMATH SKILLS- STANDARD ERROR
A Tour Of The Science Practices
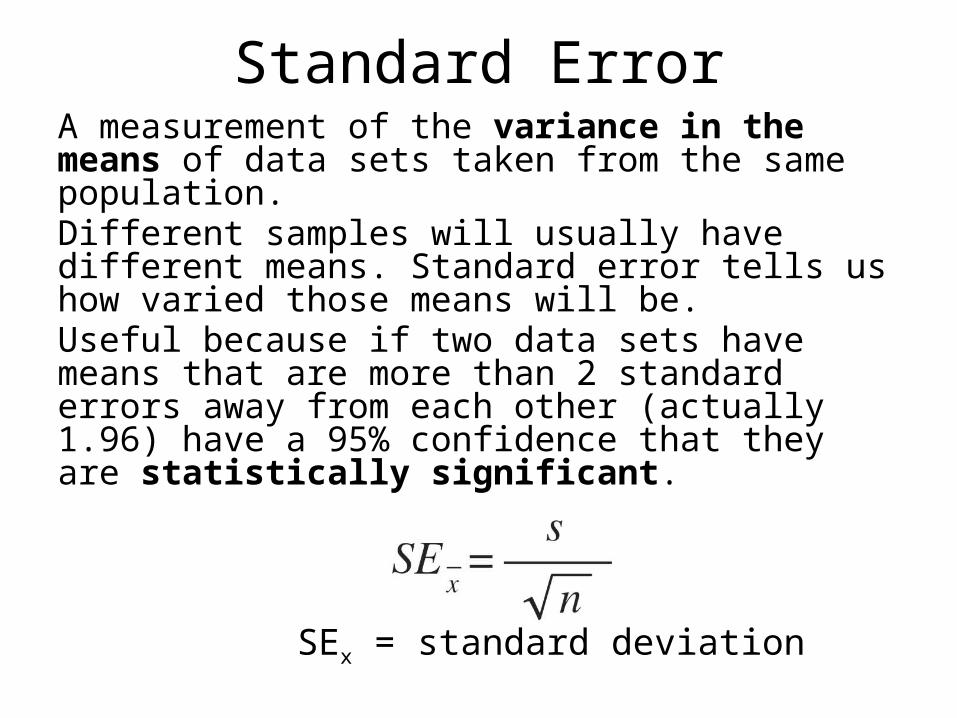
Standard ErrorA measurement of the variance in the means of data sets taken from the same population. Different samples will usually have different means. Standard error tells us how varied those means will be. Useful because if two data sets have means that are more than 2 standard errors away from each other (actually 1.96) have a 95% confidence that they are statistically significant.
SEx = standard deviation
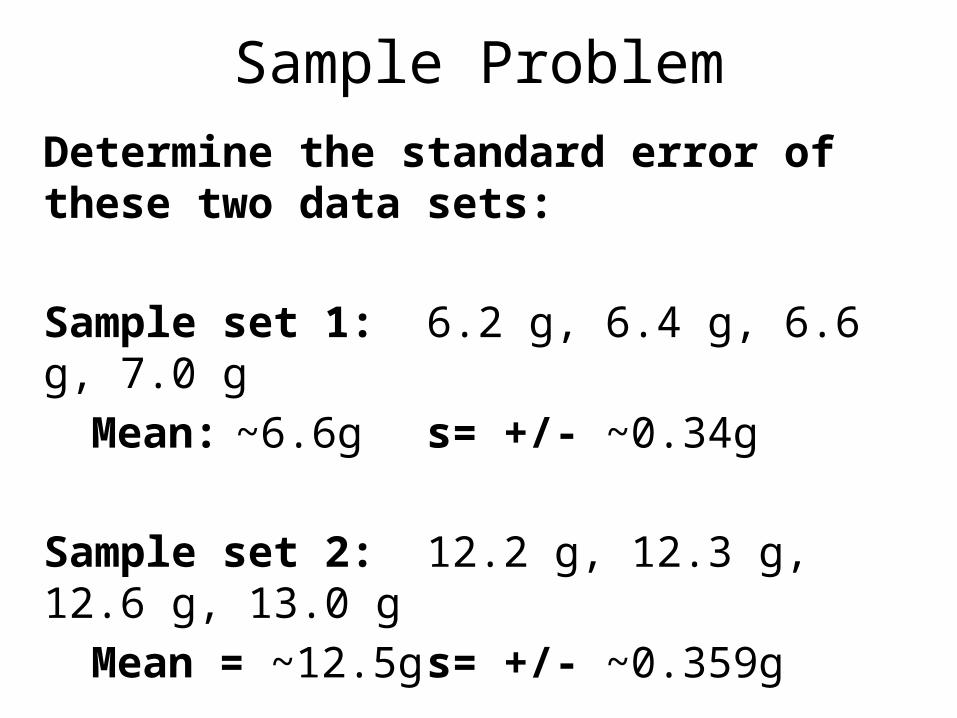
Sample ProblemDetermine the standard error of these two data sets:
Sample set 1: 6.2 g, 6.4 g, 6.6 g, 7.0 g
Mean: ~6.6g s= +/- ~0.34g
Sample set 2: 12.2 g, 12.3 g, 12.6 g, 13.0 g
Mean = ~12.5g s= +/- ~0.359g
SP5. DATA ANALYSISMATH SKILLS- HYPOTHESIS TESTING
A Tour Of The Science Practices
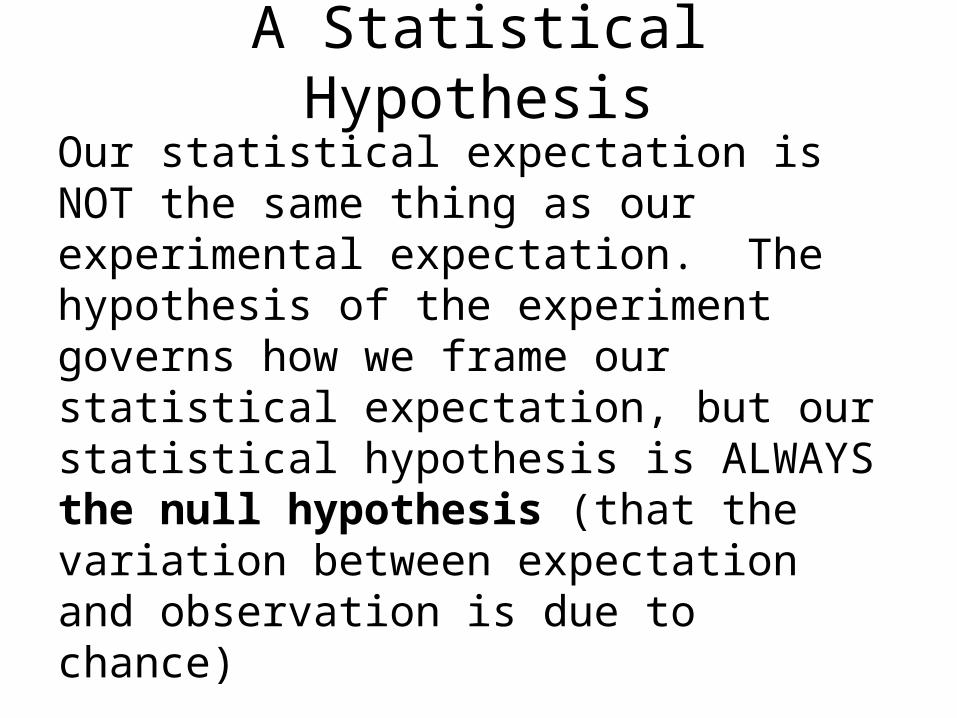
A Statistical HypothesisOur statistical expectation is NOT the same thing as our experimental expectation. The hypothesis of the experiment governs how we frame our statistical expectation, but our statistical hypothesis is ALWAYS the null hypothesis (that the variation between expectation and observation is due to chance)
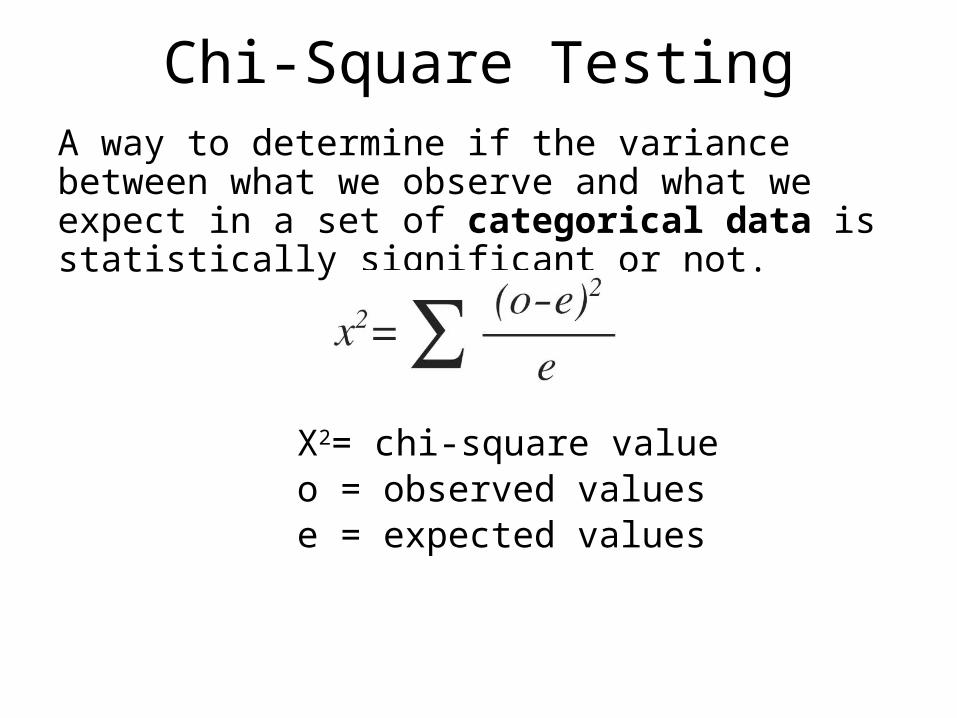
Chi-Square TestingA way to determine if the variance between what we observe and what we expect in a set of categorical data is statistically significant or not.
X2= chi-square value
o = observed values
e = expected values
When do we use this?The major areas where categorical data will be encountered in this course will be in ecology (ex. distribution of organisms in an environment) and mendelian genetics (ex. Number of progeny that have certain inherited characteristics).
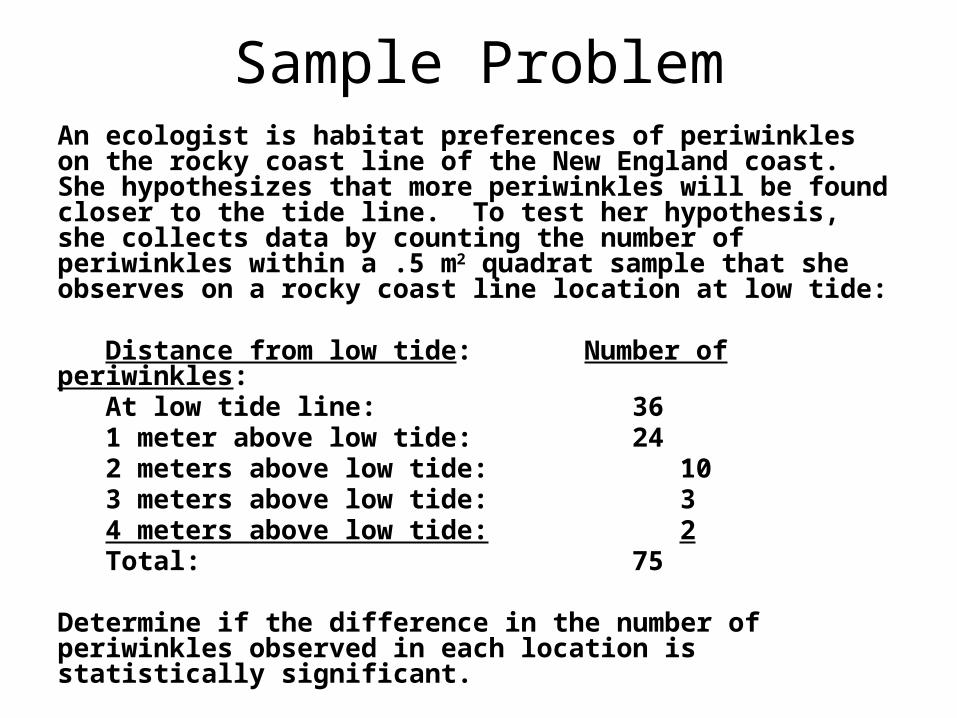
Sample ProblemAn ecologist is habitat preferences of periwinkles on the rocky coast line of the New England coast. She hypothesizes that more periwinkles will be found closer to the tide line. To test her hypothesis, she collects data by counting the number of periwinkles within a .5 m2 quadrat sample that she observes on a rocky coast line location at low tide:
Distance from low tide: Number of periwinkles:
At low tide line:361 meter above low tide: 24
2 meters above low tide: 103 meters above low tide: 34 meters above low tide: 2Total:
75 Determine if the difference in the number of periwinkles observed in each location is statistically significant.
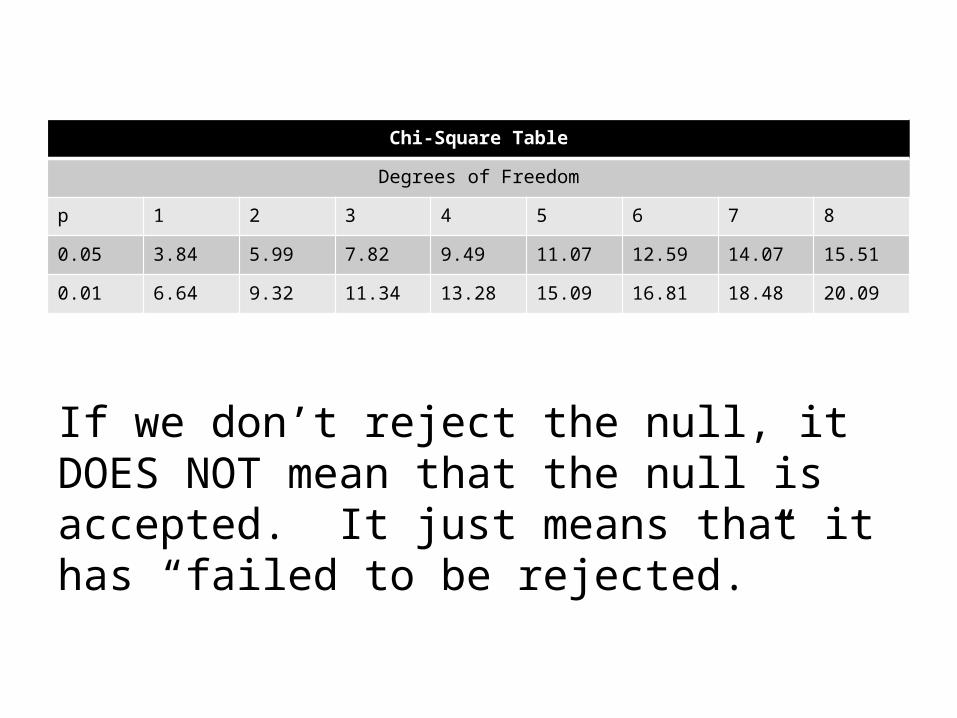
Chi-Square Table
Degrees of Freedom
p 1 2 3 4 5 6 7 8
0.05 3.84 5.99 7.82 9.49 11.07 12.59 14.07 15.51
0.01 6.64 9.32 11.34 13.28 15.09 16.81 18.48 20.09
If we don’t reject the null, it DOES NOT mean that the null is accepted. It just means that it has “failed to be rejected.”
SP6. SCIENTIFIC EXPLANATIONS
A Tour Of The Science Practices
What is a “scientific” explanation?
Scientific explanations are always tentative, and supported by evidence. A scientific explanation must be testable. If an explanation cannot be tested, science can not support or refute it.
Scientific explanations that support a broad range of observable phenomena are called “theories”. You need to be able to justify claims with evidence, construct explanations based on evidence, articulate the reasons an explanation or theory is refined or replaced, and evaluate alternative scientific explanations.
3 Ways to Work On SP61. Never make a claim without evidence
to support it.2. Consider the evidence that supports
the explanations and theories that you will be exposed to in this course. Explain how and why they have had to be revised over time.
3. Consider alternative explanations for the phenomena that you investigate in this course. Analyze how the available evidence supports or refutes these alternatives.
ActivityBriefly compose a response as to what you feel the parts of a scientific explanation are.
Describe the function of each part.
ActivityIntroducing the Explanation Tool (Yay!)

SP7. MAKING CONNECTIONS
A Tour Of The Science Practices
Everything is ConnectedScience connects concepts that span several scales of space and time. Science depends on many different kinds of information from a variety of domains to make explanations. Biological explanations use physical, chemical, and mathematical information.
You need to be able to connect phenomena and models across spatial and temporal scales, and connect concepts across domains to generalize and extrapolate ideas.
3 Ways to Work On SP71. Actively consider how the concepts
of this course rely on knowledge from a variety of domains.
2. Spend time relating temporal scales and spatial scales to the ones that you are most familiar with.
3. Consider how biological explanations agree or conflict with explanations from other sciences.
ActivityChoose one of the following statements of biological knowledge:• Living systems must acquire energy
from the environment.• The cell is the fundamental unit of
organization in living systems.• All living systems share a common
ancestor billions of years ago.List the knowledge from other scientific fields that will inform and support your chosen statement
Image CreditsAll images taken from AP Biology materials published by the College Board.


