Space and time related determinants of public transport use in trip chains Stefaan Vande Walle * , Therese Steenberghen Spatial Applications Division, R & D, K.U., B-3000 Leuven, Belgium Abstract This research aims at gaining a better understanding about time and space related determinants, which are generally acknowledged to be important factors in the choice of transport mode. The effect of trip chaining is taken into account to improve the insight in the relation between the choice of transport mode and time factors. The data source is the first large scale Belgian mobility survey, carried out in 1998–1999, complemented with a newly created database, containing for each trip a calculated public transport trip. This allows comparing for each trip the actual travel time with the calculated travel time by public trans- port. Using elasticities and regression techniques the relation between travel time components and public transport use is quantified. On trip level, a clear relation is found between waiting and walking time and public transport use. On trip chain level, travel time variables for the whole trip chain such as the maximum and the range in the travel time ratio provide a significant improvement to the explanatory power of the regression model. The results contain parameters for model input and recommendations to public transport companies on information provision, intermodality and supply. Ó 2005 Elsevier Ltd. All rights reserved. Keywords: Travel time; Elasticities; Trip chains; Travel time ratio; Public transport; Mode choice 0965-8564/$ - see front matter Ó 2005 Elsevier Ltd. All rights reserved. doi:10.1016/j.tra.2005.05.001 * Corresponding author. Fax: +32 16 32 97 32. E-mail addresses: [email protected](S. Vande Walle), [email protected](T. Steenberghen). www.elsevier.com/locate/tra Transportation Research Part A 40 (2006) 151–162
Transcript
www.elsevier.com/locate/tra
Transportation Research Part A 40 (2006) 151–162
Space and time related determinants of publictransport use in trip chains
Stefaan Vande Walle *, Therese Steenberghen
Spatial Applications Division, R & D, K.U., B-3000 Leuven, Belgium
Abstract
This research aims at gaining a better understanding about time and space related determinants, whichare generally acknowledged to be important factors in the choice of transport mode. The effect of tripchaining is taken into account to improve the insight in the relation between the choice of transport modeand time factors. The data source is the first large scale Belgian mobility survey, carried out in 1998–1999,complemented with a newly created database, containing for each trip a calculated public transport trip.This allows comparing for each trip the actual travel time with the calculated travel time by public trans-port. Using elasticities and regression techniques the relation between travel time components and publictransport use is quantified. On trip level, a clear relation is found between waiting and walking time andpublic transport use. On trip chain level, travel time variables for the whole trip chain such as the maximumand the range in the travel time ratio provide a significant improvement to the explanatory power of theregression model. The results contain parameters for model input and recommendations to public transportcompanies on information provision, intermodality and supply.� 2005 Elsevier Ltd. All rights reserved.
Keywords: Travel time; Elasticities; Trip chains; Travel time ratio; Public transport; Mode choice
0965-8564/$ - see front matter � 2005 Elsevier Ltd. All rights reserved.doi:10.1016/j.tra.2005.05.001
152 S. Vande Walle, T. Steenberghen / Transportation Research Part A 40 (2006) 151–162
1. Introduction
Unlike price and other factors, time is an absolute constraint, since people cannot increase thetime spent on travelling infinitely (Golob, 2000; Bhat and Koppelman, 1999). Notwithstandingthe fact that numerous relevant factors have been identified, travel time remains a crucial aspectto explain mode choice decisions. However, travel time is not uniform, but consists of a number ofcomponents, with their own characteristics and specific influence on mode choice. There is thepreparation time, which is the time spent preparing a journey, the walking time, the waiting time,the transfer time and the in-vehicle time, which are each perceived differently by the individualtraveller. In mode choice model estimations choice of mode is typically found to be more sensitiveto out-of-vehicle times overall than in-vehicle time. Transfers are generally perceived negatively,although quantification by weights or penalties varies widely. Most penalty values vary between 5and 20 in-vehicle time minutes (Wilson and Ghuo, 2004; Hine et al., 2001; Pratt, 1999). Penaltiesfor having a transfer usually get progressively worse the less repetitive and more discretionary thetrip purpose becomes (Pratt, 1999). A wide range of trip related factors and person characteristicsalso have an impact on these values. Waiting and walking time are generally perceived negativelyas well, except on very long journeys. A majority of estimations indicate a sensitivity to out-of-vehicle time overall that is in the range of 1.5–2.3 times the sensitivity to in-vehicle time. However,most recent estimations tend to exhibit even higher out-of-vehicle time sensitivities (Pratt, 1999).Only a very limited number of study efforts have quantified time values for these travel time com-ponents. An empirical study in the UK pointed out that the subjective waiting factor for a busconnection was estimated at 3–4 min. For train connections, the waiting penalty was 5.4 min,additional to the waiting time, that was already weighted twice the value of the in-vehicle time(Hine et al., 2001). In the Dutch ‘‘Lange Afstandenmodel’’ (Long Distance Transport Model),the walking and waiting times were weighted 1.9 times the in-vehicle time (MuConsult, 1993).In the Flemish multimodal transport model, each minute of waiting time is weighted 165%, eachminute of walking time 150% and for each transfer an extra factor is added between 2 and 15 min-utes, depending on the characteristics of the transfer. Besides these mainly model based studies, anumber of behavioral studies have revealed some detailed insights in the perception of travel time.A Dutch study revealed that people tend to weight the walking or transport time before the mainconnection higher than the time after the main connection (Brok et al., 2001). Research ofLondon Transport (Hine et al., 2001) puts forward that bus-to-train connections are perceivedas the most negative transfers. Also the reliability of the travel time is relevant. Many transit usersprefer a longer route to an unreliable one. Dutch research showed that travelers prefer 10 minadditional travel time to a shorter route with 50% probability on 15 min delay. One minute delaywas weighted 2.3 times a minute in-vehicle time (Brok et al., 2001).
Triggered by socio-economic changes in the past few decades, travel behaviour has changedconsiderably and more particularly, the chaining of trips has grown in importance. In this re-search a trip chain is defined as a combination of successive trips by an individual, starting ata place of reference (the home or workplace) and ending at the same place. Each trip chains com-prises a number of stops where the individual participates at activities (Hubert and Toint, 2002).The tendency of households to optimize their activity pattern in such a way that trips for differentmotives can be combined to chains has been a phenomenon of growing interest since the 1970s.Households organise their journeys in order to maximize their global utility. This is illustrated by
S. Vande Walle, T. Steenberghen / Transportation Research Part A 40 (2006) 151–162 153
Levinson and Kumar (1995), who investigated trip patterns of a number of households in Wash-ington in 1968 and compared them with those of 1988. Whereas in 1968, only 1.5% of the work-to-home trips were not for work purposes, by 1988 this number had increased to 15%. Two majorshifts, both related to an increasing complexity of the activity pattern, were found. The first is anincrease of the combination of work and non-work related trips and the second is a shift of thenon-work related trips peak to coincide with the afternoon peak of work trips. The main reasonsfor the increasing combination of trips to chains are the increasing participation of women at thelabour market, and also, the increased household income (Raad voor Verkeer en Waterstaat,2001; Levinson and Kumar, 1995). This means that the available time decreases and availablefinancial resources increase. A number of non-work related activities, such as eating, child careand recreation, increasingly take place outside the home. Households can save up to 15% of theirtotal travel time by trip chaining (MuConsult, 1993). There is also an increased flexibility in time,making people less dependent on time constraints for the organisation of their activity patterns.Examples are the possibility to tele-work and the extension of the opening hours of shops andservices. These developments enable the avoidance of peak traffic hours and the adoption of moreflexible activity patterns (Ministerie van Verkeer en Waterstaat, 2001).
The study of trip chains fits into a wider research field that focuses on the study of householdactivities. The central basis of the activity-based approach to travel demand modelling is that indi-viduals� activity-travel patterns are a result of their time-use decisions within a continuous timedomain. The approach enables one to comprehend the complexity and variability in the activitiesand travel patterns an individual makes during any given period (Bhat and Koppelman, 1999;Axhausen and Garling, 1992). Such decisions about the timing of activities, the location choiceand the mode choice are interrelated and are often made between members of a household.The trip chain, and not the individual trip, is the study unit in the activity based approach (Bhatand Koppelman, 1999; Toint and Cirillo, 2001). An important concept in this approach is theprincipal activity. This is the most important activity in terms of motive (work, for example) orin terms of time constraints. This activity will limit the location choices for the other activities,but also the timing and the mode choice.
Quantitative evidence on the effect of trip chaining is scarce. In many multimodal models, tripsare studied separately, without taking into account the effect of trip chaining (for example theFlemish multimodal model). In the national Dutch transport model (Landelijk Model System),it is assumed that the number of trip chains is independent of the characteristics of the transportsystem (MuConsult, 1993). When studying trip chains to and from work, Hanson and Schwab(1986) found that mode choice is determined by all the trips in the trip chain, except if the firsttrip in the chain is a trip to work. Then, this trip determines which mode will be used for the wholechain. Henscher and Reyes (2000) found, based on discrete choice models, a negative correlationbetween the complexity of trip chains and the likelihood to use public transport. This is confirmedby Toint and Cirillo (2001) who find, based on a large scale mobility survey and frequency tables,that complex trip patterns are preferably executed by car. The distinction between workers andnon-workers is important. Unlike for workers, there is only a slight correlation for non-workersbetween the number of stops during the principal and evening activities and mode choice (Hubertand Toint, 2002). Additional factors having an impact on public transport use in trip chains arethe household income, the household composition (Yalamanchili et al., 1999; Lawson, 1999) andespecially the presence of children (Strathman et al., 1994). Kenyon and Lyons (2005) found that
154 S. Vande Walle, T. Steenberghen / Transportation Research Part A 40 (2006) 151–162
multitasking, or the performance of different activities simultaneously, is an important, but oftenneglected element in time-use research. Multitasking could also be applied on travel time, espe-cially public transport travel time. The possibility to perform secondary activities while travellingcould influence the estimation of travel time and thus mode choice.
2. Data and methodology
2.1. Data source
The study area is Belgium, a federal state, comprising three regions: the Flemish region(Flanders), the Walloon region (Walloon) and the Brussels Metropolitan Region (Brussels).The latter is the highly urbanized Belgian and European capital with about 1.1 million inhabitantsand with a very dense bus, train en metro network. The Flemish Region is a more spread outurbanized region of approximately 6 million inhabitants, with lots of small cities and suburbanvillages. The region has a dense bus and train network. The Walloon region is mainly a rural areawith a few medium sized cities, a less dense transit network and about 4 million inhabitants. Themain data source for the study is the MOBEL database from 1998 to 1999, a Belgian nation-widemobility survey in which about 7000 individuals were asked to keep track of all their trips duringtwo days. This resulted in a database of over 21,000 trips. Also, a large number of socio-economicand mobility variables were collected. The MOBEL website (www.mobel.be) contains a detailedEnglish description of this database.
2.2. Database with public transport trips
Within the research framework the MOBEL database was supplemented with a newly cre-ated database containing for each trip the corresponding public transport trip, if available.For each trip a public transport trip (modes, line number, travel times, waiting and walkingtimes) was calculated. It was assumed that the routes used by car or public transport were iden-tical, so not taking into account possible shortcuts by car compared to the public transportroute, or possible advantages of public transport in three stage journeys with the middle partnecessarily not done by car. For these trips, the traveler could go straight home by publictransport, but if he uses a car he must return to the parking place, thus an extra stage inthe chain.
Two of the three regional public transport authorities (De Lijn in Flanders and MIVB/STIB inBrussels) use HASTINFO, a module of the widely used HASTUS software, which automaticallygenerates travel advice. Also the timetables of the national railway company (NMBS/SNCB) weretaken into account. The Walloon public transport (TEC) company does not use HASTUS or asimilar software, so public transport trips were calculated by shortest path analysis and printedtimetables. Using the shortest path algorithms all the public transport stops within a defined rangefrom origin and destination points were calculated. The line numbers, passing the public transportstop, were compared to find direct connections. For more complex routes with transfers, timeta-bles were used. For each public transport trip, characteristics were stored in a database. This data-base offers a representative sample of public transport potential in Belgium.
S. Vande Walle, T. Steenberghen / Transportation Research Part A 40 (2006) 151–162 155
For one-third of the trips in the questionnaire a public transport trip could be calculated, withpercentages up to about 55% for metropolitan Brussels and down to 25% for the more ruralWalloon region. For 30% of the trips, walking was found to be optimal (instead of public trans-port). For one-third of the trips no public transport trip was found, partly because of insufficientsupply, partly because of insufficient data about origin and destination. For each trip the fastestpublic transport trip was withheld and no a priori selection based on the quality of the trip wasmade. Quality control on the newly created database comprised the analysis of the differencesbetween public transport trips from the questionnaire and those calculated with the search enginesand the comparison between the two methods used for the calculation of public transport trips,i.e. automatic calculation with HASTINFO and shortest path analysis combined with timetables.
2.3. Techniques
Regression (linear, log-linear and logistic) techniques and frequency tables were used to analyzethe effect of time related factors, such as walking time, waiting time and the number of transferson public transport use. Elasticities were used to quantify these relationships. Elasticities are de-rived from demand functions and describe the relation between a mobility indicator (mode choice,number of trips) and demand related factors, of which price and time are the most common. Elas-ticities have several advantages: they have no dimension, are easy to interpret and relatively easyto calculate. They can be calculated in various ways. In this study, linear, log-linear and logitmodels were used, because of the ease of calculation and the relatively reliable results, comparedto more complex translog models (Oum, 1989). Most elasticity values in the literature deal withprice as the independent variable, some examples of travel time are provided by De Jong et al.(1998) and Nijkamp and Pepping (1998).
2.4. Analysis at trip chain level
In the MOBEL database, trip chains are defined based on the activity pattern of households.All trips between home as origin and destination are considered one trip chain. Also, trips be-tween work as origin and destination are considered one trip chain. For each trip chain in thedatabase, information is stored about the structure, the principal activity and global quality ofthe calculated public transport trip.
3. Results
Analysis of time related factors was first done on trip level, deriving quantitative parameters forthe relation between travel time components and public transport use. The results of this analysiswere presented in a previous paper (Vande Walle and Steenberghen, 2004). A short summary ofthese results is given, to the extent considered necessary to understand the results on trip chain level.
3.1. Results of analysis on trip level
Whereas for 33% of the trips a public transport trip could be calculated, for less than 10% ofthe trips public transport has actually been used by the traveller, indicating a large theoretical
156 S. Vande Walle, T. Steenberghen / Transportation Research Part A 40 (2006) 151–162
potential for public transport. Starting from this gap a number of possible explanations were ana-lyzed. One important explanation for this gap is the negative perception by travellers of walkingtimes, waiting times and transfers. Variables assigning a reasonable high weight to these compo-nents explain better the choice for public transport (Vande Walle and Steenberghen, 2004). On theother side it has been found that travellers behave more creatively than expected based on thepublic transport search engines. Especially in suburban and rural areas, car and bike are usedin combination with a public transport trip, whereas the search engines are exclusively basedon the public transport supply and walking.
Using stepwise logistic regression, the travel time ratio, defined as the ratio between the traveltime by public transport divided by the travel time by car for the same trip, turns out to be the bestexplanatory variable of the variance in mode choice. Elasticity values vary between �0.8 and�1.3, depending on the functional model that was used, indicating a negative elasticity. Elasticityestimations varied according to the type of public transport mode (stronger negative elasticitiesfor bus and tram than for metro), car availability (stronger negative elasticities), travel motive(stronger negative elasticities for work related trips and trips for personal motives, whereas schooltrips and trips for recreational purposes are less elastic), the degree of urbanisation of the region(stronger negative elasticities inside urban regions) and the trip distance (short trips, to 5 km, arefar more travel time elastic than longer trips).
In the stepwise logistic regression model, waiting time and walking time turned out to be lesssignificant than the travel time ratio. However, this does not mean that the walking and waitingtime are not relevant in deciding about mode choice. Up to a share of about 25% in the total traveltime, walking and waiting time have very little effect on public transport use. However, withincreasing share, the negative relation with transit use is more pronounced. There is a clear max-imum accepted waiting and walking time, dependent on the total travel time. For waiting time, themaximum accepted time is lower than for walking time and the negative relation is stronger (elas-ticities for waiting time are between �1.8 and �2.3, whereas between �1 and �1.2 for walkingtimes), implying a more negative appreciation of high waiting times.
3.2. Results of analysis on trip chain level
Each trip chain was evaluated on the availability of public transport for each trip of the chain.First of all, the quality of the public transport and the modes that were actually used to make thetrip chain were not taken into account. The percentage of trip chains that can be done by publictransport is a bit more than 50% for chains of two trips. Up to five trips, the percentage remainsfairly constant at about 40%, for longer trip chains, it drops to 25%. Trip chains where both carand public transport are use are rare (6%). Walking and car (passenger) are the most frequentcomplementary modes, whereas bike and public transport are hardly used as complementarymodes. The group of trip chains that can completely be done by public transport is the basic data-set for the analysis.
3.3. The role of travel time
On trip level, the travel time ratio was found to be the time related variable best explainingmode choice. On trip chain level, various assessments of this ratio can be made. The simplest
S. Vande Walle, T. Steenberghen / Transportation Research Part A 40 (2006) 151–162 157
way is to make the average of all available travel time ratios in the chain. Other time related vari-ables that were derived on trip chain level are the range of travel time ratios in the chain, the max-imum value and the travel time ratio of the most important trip in the chain, the trip to theprincipal activity. The principal activity can be defined as working or going to school, if present,or the activity with the longest duration, if not present.
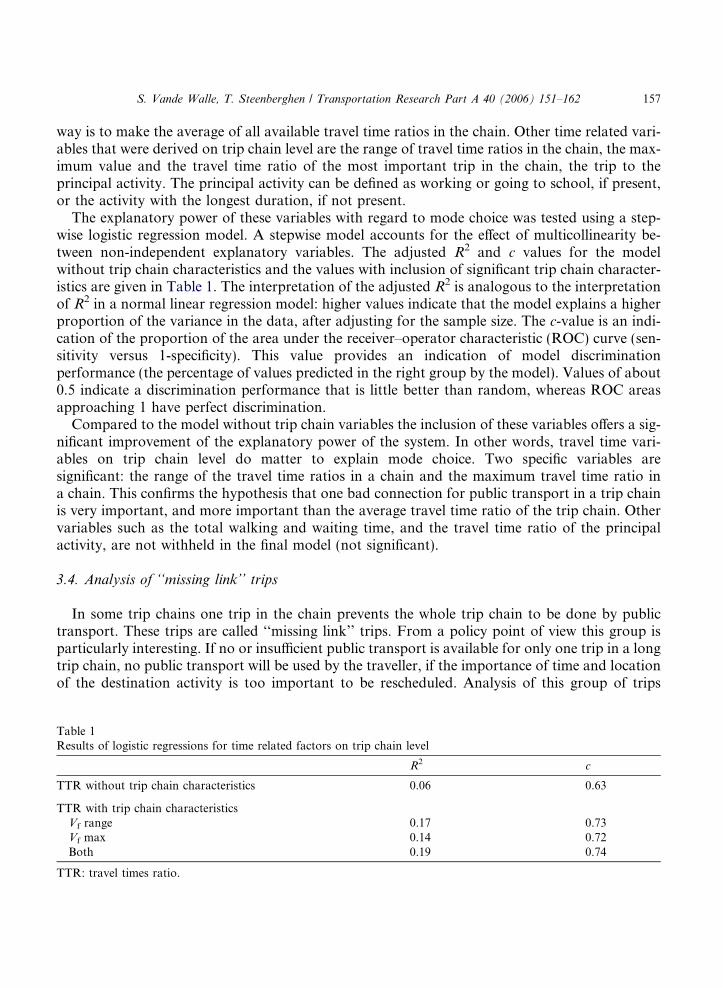
The explanatory power of these variables with regard to mode choice was tested using a step-wise logistic regression model. A stepwise model accounts for the effect of multicollinearity be-tween non-independent explanatory variables. The adjusted R2 and c values for the modelwithout trip chain characteristics and the values with inclusion of significant trip chain character-istics are given in Table 1. The interpretation of the adjusted R2 is analogous to the interpretationof R2 in a normal linear regression model: higher values indicate that the model explains a higherproportion of the variance in the data, after adjusting for the sample size. The c-value is an indi-cation of the proportion of the area under the receiver–operator characteristic (ROC) curve (sen-sitivity versus 1-specificity). This value provides an indication of model discriminationperformance (the percentage of values predicted in the right group by the model). Values of about0.5 indicate a discrimination performance that is little better than random, whereas ROC areasapproaching 1 have perfect discrimination.
Compared to the model without trip chain variables the inclusion of these variables offers a sig-nificant improvement of the explanatory power of the system. In other words, travel time vari-ables on trip chain level do matter to explain mode choice. Two specific variables aresignificant: the range of the travel time ratios in a chain and the maximum travel time ratio ina chain. This confirms the hypothesis that one bad connection for public transport in a trip chainis very important, and more important than the average travel time ratio of the trip chain. Othervariables such as the total walking and waiting time, and the travel time ratio of the principalactivity, are not withheld in the final model (not significant).
3.4. Analysis of ‘‘missing link’’ trips
In some trip chains one trip in the chain prevents the whole trip chain to be done by publictransport. These trips are called ‘‘missing link’’ trips. From a policy point of view this group isparticularly interesting. If no or insufficient public transport is available for only one trip in a longtrip chain, no public transport will be used by the traveller, if the importance of time and locationof the destination activity is too important to be rescheduled. Analysis of this group of trips
Table 1Results of logistic regressions for time related factors on trip chain level
R2 c
TTR without trip chain characteristics 0.06 0.63
TTR with trip chain characteristicsVf range 0.17 0.73Vf max 0.14 0.72Both 0.19 0.74
TTR: travel times ratio.
158 S. Vande Walle, T. Steenberghen / Transportation Research Part A 40 (2006) 151–162
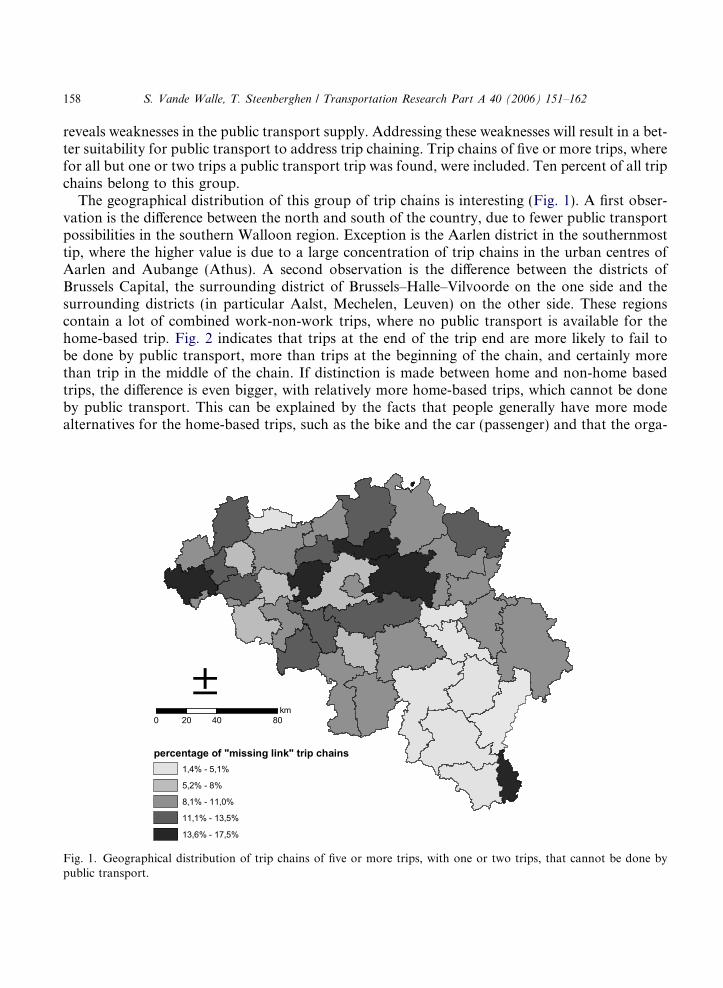
reveals weaknesses in the public transport supply. Addressing these weaknesses will result in a bet-ter suitability for public transport to address trip chaining. Trip chains of five or more trips, wherefor all but one or two trips a public transport trip was found, were included. Ten percent of all tripchains belong to this group.
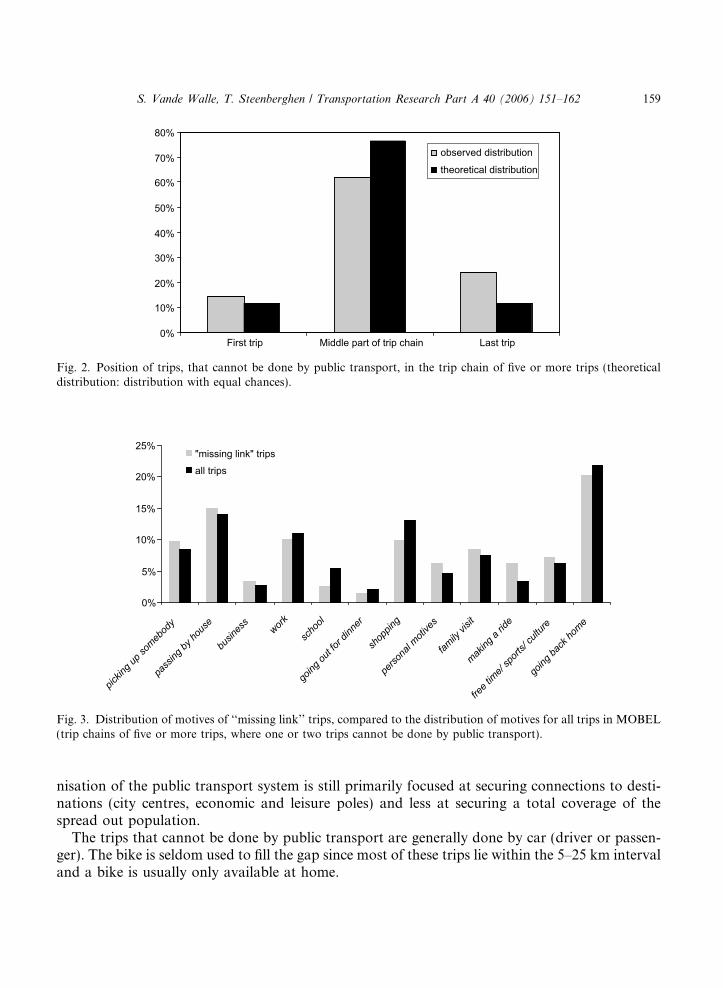
The geographical distribution of this group of trip chains is interesting (Fig. 1). A first obser-vation is the difference between the north and south of the country, due to fewer public transportpossibilities in the southern Walloon region. Exception is the Aarlen district in the southernmosttip, where the higher value is due to a large concentration of trip chains in the urban centres ofAarlen and Aubange (Athus). A second observation is the difference between the districts ofBrussels Capital, the surrounding district of Brussels–Halle–Vilvoorde on the one side and thesurrounding districts (in particular Aalst, Mechelen, Leuven) on the other side. These regionscontain a lot of combined work-non-work trips, where no public transport is available for thehome-based trip. Fig. 2 indicates that trips at the end of the trip end are more likely to fail tobe done by public transport, more than trips at the beginning of the chain, and certainly morethan trip in the middle of the chain. If distinction is made between home and non-home basedtrips, the difference is even bigger, with relatively more home-based trips, which cannot be doneby public transport. This can be explained by the facts that people generally have more modealternatives for the home-based trips, such as the bike and the car (passenger) and that the orga-
0 40 8020km
percentage of "missing link" trip chains 1,4% - 5,1%
5,2% - 8%
8,1% - 11,0%
11,1% - 13,5%
13,6% - 17,5%
Fig. 1. Geographical distribution of trip chains of five or more trips, with one or two trips, that cannot be done bypublic transport.
0%
10%
20%
30%
40%
50%
60%
70%
80%
First trip Middle part of trip chain Last trip
observed distribution
theoretical distribution
Fig. 2. Position of trips, that cannot be done by public transport, in the trip chain of five or more trips (theoreticaldistribution: distribution with equal chances).
0%
5%
10%
15%
20%
25%
pickin
g up
som
ebod
y
pass
ing b
y hou
se
busin
ess
work
scho
ol
going
out
for d
inner
shop
ping
pers
onal
mot
ives
fam
ily vi
sit
mak
ing a
ride
free
time/
spor
ts/ cu
lture
going
bac
k hom
e
"missing link" tripsall trips
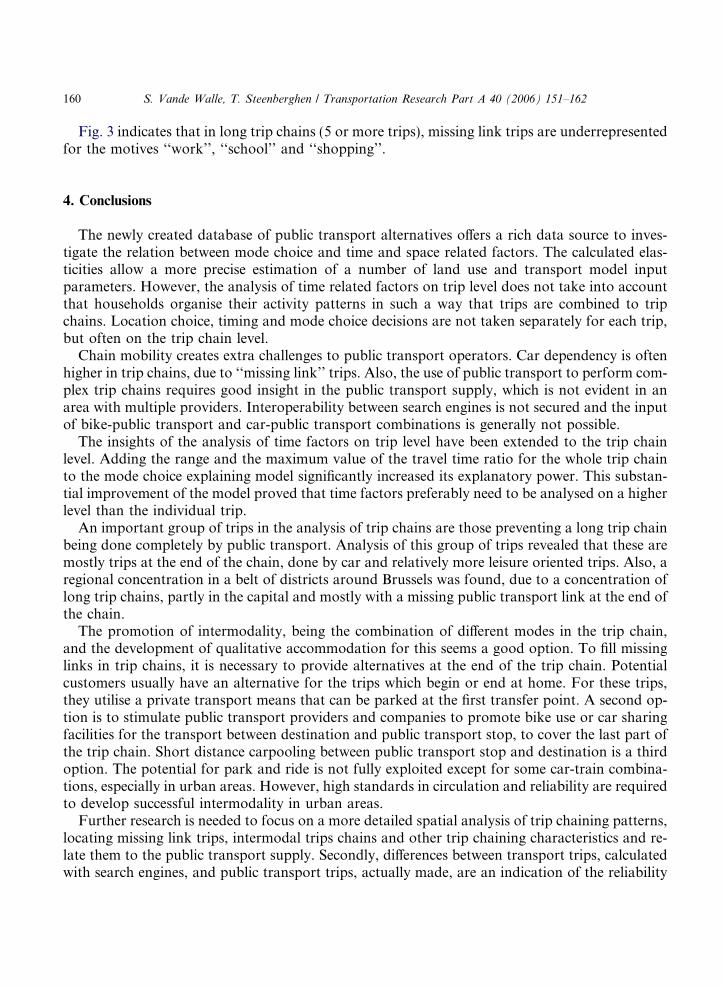
Fig. 3. Distribution of motives of ‘‘missing link’’ trips, compared to the distribution of motives for all trips in MOBEL(trip chains of five or more trips, where one or two trips cannot be done by public transport).
S. Vande Walle, T. Steenberghen / Transportation Research Part A 40 (2006) 151–162 159
nisation of the public transport system is still primarily focused at securing connections to desti-nations (city centres, economic and leisure poles) and less at securing a total coverage of thespread out population.
The trips that cannot be done by public transport are generally done by car (driver or passen-ger). The bike is seldom used to fill the gap since most of these trips lie within the 5–25 km intervaland a bike is usually only available at home.
160 S. Vande Walle, T. Steenberghen / Transportation Research Part A 40 (2006) 151–162
Fig. 3 indicates that in long trip chains (5 or more trips), missing link trips are underrepresentedfor the motives ‘‘work’’, ‘‘school’’ and ‘‘shopping’’.
4. Conclusions
The newly created database of public transport alternatives offers a rich data source to inves-tigate the relation between mode choice and time and space related factors. The calculated elas-ticities allow a more precise estimation of a number of land use and transport model inputparameters. However, the analysis of time related factors on trip level does not take into accountthat households organise their activity patterns in such a way that trips are combined to tripchains. Location choice, timing and mode choice decisions are not taken separately for each trip,but often on the trip chain level.
Chain mobility creates extra challenges to public transport operators. Car dependency is oftenhigher in trip chains, due to ‘‘missing link’’ trips. Also, the use of public transport to perform com-plex trip chains requires good insight in the public transport supply, which is not evident in anarea with multiple providers. Interoperability between search engines is not secured and the inputof bike-public transport and car-public transport combinations is generally not possible.
The insights of the analysis of time factors on trip level have been extended to the trip chainlevel. Adding the range and the maximum value of the travel time ratio for the whole trip chainto the mode choice explaining model significantly increased its explanatory power. This substan-tial improvement of the model proved that time factors preferably need to be analysed on a higherlevel than the individual trip.
An important group of trips in the analysis of trip chains are those preventing a long trip chainbeing done completely by public transport. Analysis of this group of trips revealed that these aremostly trips at the end of the chain, done by car and relatively more leisure oriented trips. Also, aregional concentration in a belt of districts around Brussels was found, due to a concentration oflong trip chains, partly in the capital and mostly with a missing public transport link at the end ofthe chain.
The promotion of intermodality, being the combination of different modes in the trip chain,and the development of qualitative accommodation for this seems a good option. To fill missinglinks in trip chains, it is necessary to provide alternatives at the end of the trip chain. Potentialcustomers usually have an alternative for the trips which begin or end at home. For these trips,they utilise a private transport means that can be parked at the first transfer point. A second op-tion is to stimulate public transport providers and companies to promote bike use or car sharingfacilities for the transport between destination and public transport stop, to cover the last part ofthe trip chain. Short distance carpooling between public transport stop and destination is a thirdoption. The potential for park and ride is not fully exploited except for some car-train combina-tions, especially in urban areas. However, high standards in circulation and reliability are requiredto develop successful intermodality in urban areas.
Further research is needed to focus on a more detailed spatial analysis of trip chaining patterns,locating missing link trips, intermodal trips chains and other trip chaining characteristics and re-late them to the public transport supply. Secondly, differences between transport trips, calculatedwith search engines, and public transport trips, actually made, are an indication of the reliability
S. Vande Walle, T. Steenberghen / Transportation Research Part A 40 (2006) 151–162 161
of the system. However, in order to obtain a clear picture of this, other objective and subjectivereasons for differences need to be taken into account.
Acknowledgements
The paper reports the results of research funded by the Belgian Federal Science Policy, underthe research program for Sustainable Development II. The findings from this paper were pre-sented on the World Conference on Transport, Istanbul, 4–7 July 2004.
References
Axhausen, K., Garling, T., 1992. Activity-based approaches to travel analysis: conceptual frameworks, models andresearch problems. Transport Reviews 12, 324–341.
Bhat, C., Koppelman, F.S., 1999. A retrospective and prospective survey of time-use research. Transportation 26, 119–139.
Brok, M et al., 2001. De Keten in De Knoop. Een Zoektocht Naar Mogelijkheden Om Ketenmobiliteit Te StimulerenVanuit Een Ruimtelijk Perspectief. Katholieke Universiteit Nijmegen, Nijmegen, The Netherlands, 78p.
De Jong, G.C., Tegge, O., Dohmen, R., Ettema, D.F., Hamer, R.N., Massiani, J., Van Vuren, T., 1998. Review ofexisting evidence on time and cost elasticities of travel demand and on value of travel time (Deliverable 1). TRACECosts of private road travel and their effects on demand, including short and long term elasticities.
Golob, T.F., 2000. A simultaneous model of household activity participation and trip chain generation. TransportationResearch, B––Methodological 34 (5), 355–376.
Hanson, S., Schwab, M., 1986. Describing disaggregate flows: individual and household patterns. In: Hanson, S. (Ed.),The Geography of Urban Transportation. Guilford Press, New York, pp. 154–178.
Henscher, D.A., Reyes, A.J., 2000. Trip chaining as a barrier to the propensity to use public transport. Transportation27, 341–361.
Hine, J.P., Wardman, M., Stradling, S., 2001. Interchange and Travel Choice, vol. 2. Report for the Scottish Executiveby the Institute for Transport Studies at the University of Leeds and the Transport Research Institute at NapierUniversity.
Hubert, J.P., Toint, P., 2002. La Mobilite Quotidienne Des Belges. Presses Universitaires de Namur, Namur, Belgium,352p.
Kenyon, S., Lyons, G., 2005. Multitasking. Unpublished paper submitted to special issue of Transportation, awaitingeditorial comments.
Lawson, C.T., 1999. Household travel/activity decisions: who wants to travel? In: Proceedings of the 1999 AnnualMeeting of the Transportation Research Board. Center for Urban Studies, Portland State University, 27p.
Levinson, D., Kumar, A., 1995. Activity, travel and the allocation of time. Journal of the American PlanningAssociation 61 (4), 458–470.
Ministerie van Verkeer en Waterstaat, 2001. Perspectief op auto/OV: de keuze van reizigers. Den Haag, 36p.MuConsult i.o.v. Ministerie van Verkeer en Waterstaat, 1993. Elasticiteit, een rekbaar begrip, Utrecht, 123p.Nijkamp, P., Pepping, G., 1998. Meta-analysis for explaining the variance in public transport demand elasticities in
Europe. Journal of Transportation and Statistics, 1–14.Oum, T.H., 1989. Alternative models and their elasticity estimates. Journal of Transportation Economics and Policy,
163–187.Pratt, R.H., 1999. Traveller response to transportation system changes. Interim Handbook. TCRP Web Document 12,
DOT-FH-11-9579. Available from: <http://gulliver.trb.org/publications/tcrp/tcrp_webdoc_12.pdf>, accessed July22, 2003.
162 S. Vande Walle, T. Steenberghen / Transportation Research Part A 40 (2006) 151–162
Raad voor Verkeer en Waterstaat, Van Modal Split naar Modal Merge – Advice about the future of regionaltransport, 2001, 43p; available at http://www.minvenw.nl/extdomein/raadvenw/Publicaties/Adviezen/2001/Vanmodalsplitnaarmodalmerge.aspx.
Strathman, J.G., Dueker, K.J., Davis, J.S., 1994. Effects of household structure and selected travel characteristics ontrip chaining. Transportation 21, 23–45.
Toint, P., Cirillo, C., 2001An Activity-based Approach to the Belgian Travel Survey, vol. 7. FUNDP, Namur, Belgium,24p.
Vande Walle, S., Steenberghen, T., 2004. Using a large-scale mobility survey and public transport trip information toestimate the effect of time-related factors on transit use. Proceedings Annual Meeting of Transport Research Board(04-4333).
Wilson, N.H.M., Ghuo, Z., 2004. Assessment of transfer penalty for transit trips: GIS-based disaggregate modelingapproach, Massachusetts Institute of Technology. Proceedings Annual Meeting of Transport Research Board (04-3920).
Yalamanchili, L., Pendyala, R., Prabaharan, N., Chakravarthy, P., 1999. An analysis of activity chaining using theLexington Kentucky GPS data. Proceedings Annual Meeting of the Transportation Research Board, Washington,DC, January 10–14.