S S pace pace b b ased ased s s ystems ystems for for Forest Resources Management Forest Resources Management - Indian Experience Presentation by Indian Delegation 49 th Session of UN- COPUOS, June 2006
Transcript
SSpacepace bbased ased ssystemsystemsfor for
Forest Resources ManagementForest Resources Management- Indian Experience
Presentation by
Indian Delegation49th Session of UN- COPUOS, June 2006
ECOLOGICAL AND ECONOMIC IMPORTANCE
• 2.5 Mha Shifting cultivation affected areas• US $ 10 M loss due to annual fires • 16 % of the species - threatened category• 3100 Large open cast mines
ANTHROPOGENIC PRESSURES
Evergreen Forest canopy Fruit of Myristica dactyloides
Shifting cultivation Grazing
Indian Forests - Significance
• Forests cover 67.8 Mha (20.64 %)• Constitutes 47,000 plants• Non timber forest products of US $ 200 M• 1000 MT of timber products
• Meets 70 % green fodder requirements
AWiFS
LISS III
LISS IV MX
CARTOSAT
IRS series of SatellitesIRS series of Satellites• Provides multiresolution capability
• Effectively adopted in several National and Local initiatives
Enhanced spatial resolution enables delineation of species formations and individual trees
56 m
23.5 m
5.6 m
2.5 m
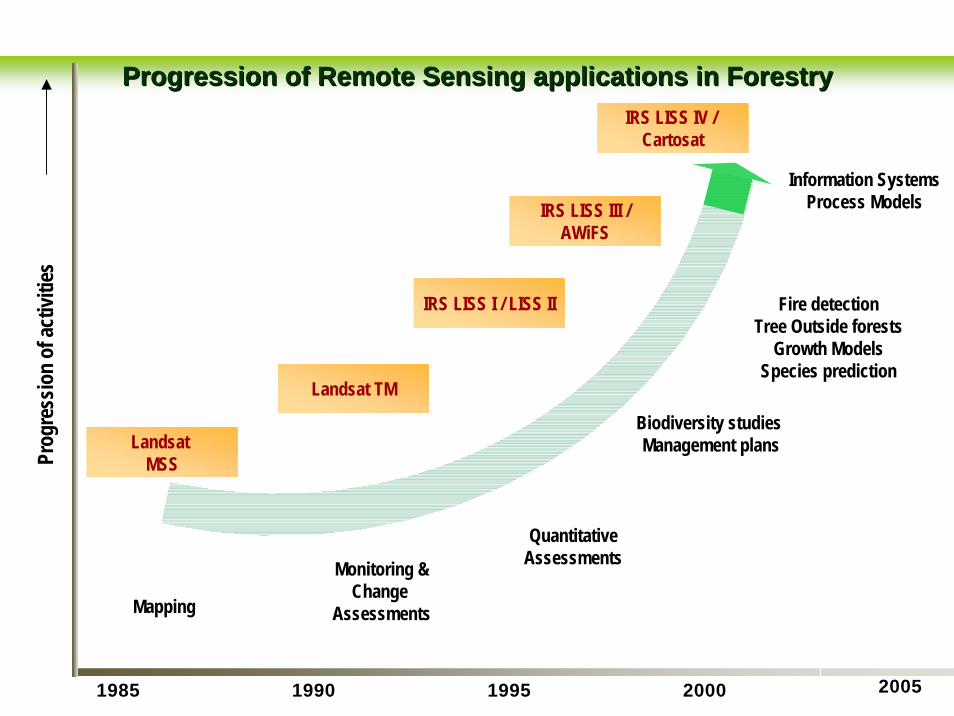
Progression of Remote Sensing applications in ForestryProgression of Remote Sensing applications in Forestry
20052000199519901985
Mapping
QuantitativeAssessmentsMonitoring &
Change Assessments
Biodiversity studies Management plans
Fire detectionTree Outside forests
Growth ModelsSpecies prediction
Information SystemsProcess Models
Landsat MSS
Landsat TM
IRS LISS I / LISS II
IRS LISS III /AWiFS
IRS LISS IV / Cartosat
Prog
ress
ion
of ac
tiviti
es
Department of Space
PC - NNRMS
Standing CommitteeBioresources
MoENF
State Forest DepartmentsState RS Centers
UniversityR&D Institutions
National InstitutesDepartment of Space
Academicia
National Institutes
Govt. of India Ministries
State Forest Departments
Sustainable Development
Smart Governance
Institutional mechanisms and implementationInstitutional mechanisms and implementation
PolicyPolicy
Operatio
ns
Operatio
nsR & DR & D
National Forest cover assessment done on biannual basis, since two decades
Forest cover assessed in terms of Very Dense (> 70%), Moderately Dense (40 -70 %) and Open (10-40%) crown density classes using digital approachesForest Survey of India carries out the task with the technical know-how transferred in 1986 by Dept.Of Space
State of Forest cover Report (SFR) placed in Indian Parliament
Year
14.12
21.6
10.88
19.52
11.51
19.47
11.71
19.44
11.72
19.47
11.73
19.45
11.17
19.27
11.48
19.39
12.68
20.55
0
5
10
15
20
25
1972-75*
1981-83*
1985-87**
1987-89**
1989-91**
1993-95**
1995-97**
1997-99**
2001-2004
Closed forest coverTotal forest cover
Fore
st a
rea
in p
erce
nt
Year
14.12
21.6
10.88
19.52
11.51
19.47
11.71
19.44
11.72
19.47
11.73
19.45
11.17
19.27
11.48
19.39
12.68
20.55
0
5
10
15
20
25
1972-75*
1981-83*
1985-87**
1987-89**
1989-91**
1993-95**
1995-97**
1997-99**
2001-2004
Closed forest coverTotal forest cover
Fore
st a
rea
in p
erce
nt
Forest Cover of India(State of the Forest Report , 2003)
Moderately dense forest(40 % - 70 %)
Very Dense Forest (>70 %)*
Open Forest(10 % - 40 %)ScrubNonforest
WaterbodiesState boundaries
Legend
Based on IRS LISS III data of 2002
*% Crown density in parenthesis
Source : Forest Survey of India
Since 1997-98 cycle mapping carried out on 1:50,000 scale
National Forest Cover AssessmentNational Forest Cover Assessment
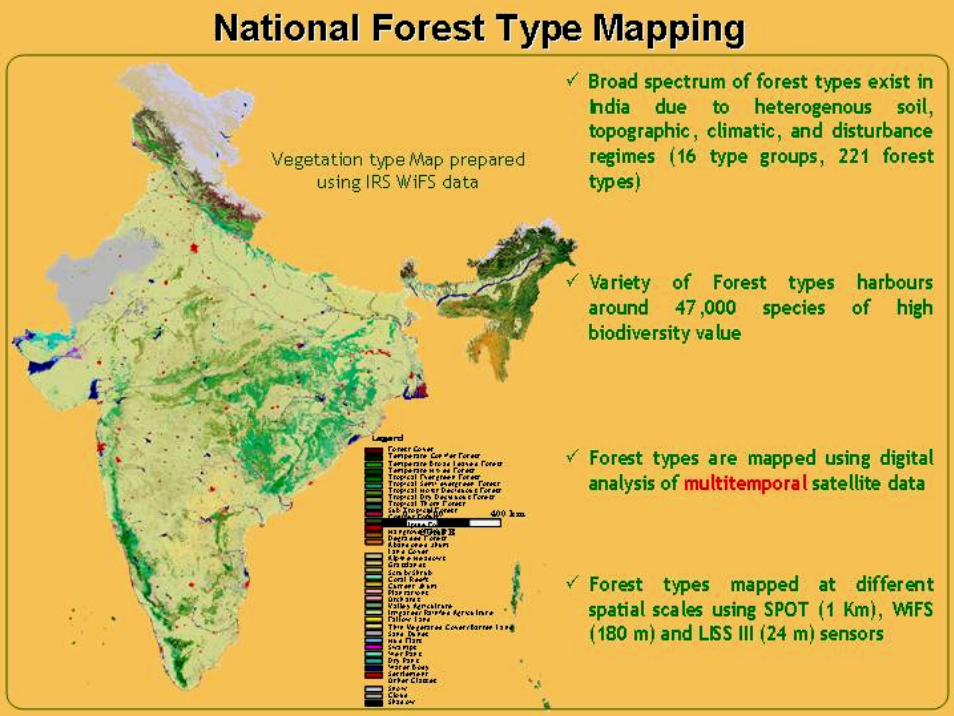
India is one of the 18 mega biodiversity zones of world
50 Mha (80 %) forests were characterized for intact and critical habitats of biodiversity
Vegetation type, fragmentation, speciesabundance, disturbance, ecosystem uniquenessdata integrated in geospatial domain to deriveindex of Biological Richness
10 spatial layers, 12,000 plots field data of 6000 species data organized in web based ‘Biodiversity Information System’ facilitating query and analysis
Biodiversity Characterization at Landscape Level
Forest micro plans prepared using high resolution satellite and ground data
Joint Forest Management activities are monitored and evaluated using Remote sensing data
Community Forest Management 226 million rural population depend on forests for food,fuel,fodder
Sustainable resources extraction has become critical and a new paradigm “Joint Forest Management” with rural participation has evolved covering 25 M ha forests.
Around 500 wildlife sanctuaries, 90 National Parks constitutes 15.6 Mha of the forests
These areas possess highly diverse flora, fauna and unique ecological habitats
National Mission to generate spatial databases on vegetation type (1:25,000) and large mammal densitydistribution launched for all protected areas
Inputs for wildlife management plans addressing vegetation type, habitat maps, water holes, managementzonation prepared
Vegetation type map ofKudremukh National Park
(3D view)Management Plan
Map
Protected Area ManagementProtected Area Management
55% of Indian Forests are prone to recurrent fires annually. Rs 440 crores is the reported economicloss due to fire.
As part of Disaster Support Center of NRSA, services on Fire management are provided usingmultiresolution, multitemporal satellite data
Active forest fire locations for the entire country on daily basis to facilitate fire control operationsusing MODIS and DMSP data
Damage assessment inputs in terms of burnt area on near real time basis for critically damagedareas.
Indian Forest Fire Response and Assessment System ( ) is operationally started toprovide these services through NRSA web site.
inffrasinffras
inffrasinffras
inffrasinffrasWebsite hosted by NRSA
Indian Forest Fire Response and Assessment System
Policy & regulatory frame works
National Forest policy (1988)
National Environment Protection Act (1986)
Wildlife Protection Act (1972)
National Forest Working Plan Code (2003)
Forest Protection and Development through rural participatory approaches
Reliable resources accounting, monitoring and evaluation practiced
Use of Remote Sensing and GIS is advocated and mandated by several policyguidelines for planning and operational initiatives
Use of Remote sensing and GIS is advocated and mandated Use of Remote sensing and GIS is advocated and mandated by several policy guidelines for planning and operational by several policy guidelines for planning and operational