15
Space Informatics Lab - University of Cincinnati TerraEx Content-Based Query for Terrain Type USER GUIDE TerraEx-PL V1.0 August 2013

Space Informatics Lab - University of Cincinnati
TerraExContent-Based Query for Terrain Type
USER GUIDETerraEx-PL V1.0
August 2013

2
1. IntroductionTerraEx-PL (Terrain Explorer Poland) is a GeoWeb-based tool for content-based querying of topography over the entire country of Poland. The topography is given by a DEM (digital elevation model) with 30 m/pixel resolution. Three different methods (geomorphons, slope classes, and Iwahashi-Pike) are used to classify this DEM into thematic maps of land-scape. All three thematic maps of landscapes are content searchable. Of particular interest is the geomorphons method that classifies topogra-phy into ten most common landform elements. In TerraEx a user selects a specific local region (in the form of 15 km x 15 km square) to serve as an example of a terrain of interest. The pattern of terrain classes over the selected region defines the landscape type the user is searching for. When query is executed the TerraEx compares the particular pattern of the query with all local patterns over the entire country of Poland. This comparison is performed by calculating a simi-larity value (a number between 0 - indicating complete lack of any simi-larity, and 1 - indicating perfect match) between a pattern of the query and a local pattern. The result of the query is a similarity map where dif-ferent colors indicate (from green - indication similarity value 0, to deep red - indicating similarity value 1) different levels of similarity of local landscape to the landscape in the query selected by the user.TerraEx user interface works in an internet browser environment and is based on JavaScript libraries: ExtJS with GeoExt and OpenLayers. Through this interface a user can access all functionalities expected from a modern GeoWeb web page. LandEx has been developed in the Space Informatics Lab (sil.uc.edu) at the University of Cincinnati and is available at http://sil.uc.edu/webapps/terraex_pl/ .

3
2. Openning Screen
2.1 - Map layers This panel shows all layers available in TerraEx-PL. The layers are divided into four categories: - Boundaries; these auxiliary layers help user to find proper location- Similarity layers are user generated, each is available for 20 minutes after gen-eration- Geomorphology layers include all the-matic maps of landscape- Base layers include shaded DEM (showed at opening screen), hillshade, and geographic map of Poland (outside link)

4
2. Openning Screen2.2 - Scale and navigation
Map navigation is provided by panning and zooming. In order to pan the map press the left mouse button and drag the map. Use mouse wheel to zoom in and out. Zooming into a selected rectangle is accomplished by pressing Shift button and using mouse to indicate an approximate area into which to zoom in. Navigation icon at the top-left part of the screen has a map scale slider (A), zoom-out to maximum extent button (B) and help but-ton (C) that brings up this document.
2.3 - Transparency
2.4- Similarity calculation
A B C
Transparency slider acts on the selected lay-er. By default geomorphology layers appears with 50% transparency over base layers. Transparency is mostly used for visual com-parison of local and reference patterns. It can also be used for comparison of geomorphol-ogy layers with a base layers.
Similarity button is initially located at upper-right part of the screen. It initiates a query. Clicking on this button brings up a region of interest (ROI) square and a selection menu.

5
2.5 - Base layers
2. Openning Screen
Shaded DEM. The original integer DEM with resolution of 1x2 arc sec-onds was adoptively smoothed and re-sampled into the 30 m/cell float-ing point raster. The “Shaded DEM “ layer is calculated using this raster. This layer is generated using color gradient to code the values of eleva-tion and gray scale gradient to code the values of slope. The synthesis of these two informations yields a effective visualization of topography.
Similarity selection menu: (A) start query button, (B) selection of geo-morphic map to be queried, (C) cancel button to cancel a query.
ABC
Region of interest (ROI) square appears in the middle of the map. User repositions ROI to a de-sired location. A user can zoom in and out and pan the map while repositioning the ROI.Once ROI is in the right position pressing “start calculation” button starts similarity calculation. When calculation is completed (few seconds) a layer containing a similarity map to a query ap-pears and remains available for viewing and downloading for 20 minutes.
ROI
hills
hade
shad
ed D
EM

6
Geographic map. This layer contains a geographic map of Poland for reference purposes. The layer is pulled from an external web page http://maps.geoportal.gov.pl. Because of this its loads slowly. We recommend using this map only for zoomed-in regions.
Hillshade. Hillshade layer is calculated from 30 m/cell DEM in order to provide a 3D visualization of topography. In most situations the “Shaded DEM” layer is a preferable visualization of topography, but in some cases “Hillshade” layer may be a better choice.
2.6 - Geomorphology layers
2. Openning Screen
Geomorphons. This layer has been generated from a DEM using the concept of geomorphons (Jasiewicz and Stepinski, Geomorphology 182, pp. 147-156, 2013). The method delineates most common landform ele-ments: flat, peak, ridge, shoulder, spur, slope, hollow, footslope, valley, and pit. A local landscape is encapsulated as a pattern of these ten ele-ments. TerraEx has two layers generated by the geomorphon method with different value of search radius parameter. The “Geomorphons (large radius)” layer is generated with the value of search radius equal to 50 cells. It delineates landform elements on the scale of 1500 meters (bird-view description of the landscape). The “Geomorphons (small radi-us)” layer is generated with the value of search radius equal to 5 cells. It delineates landform elements on the scale of 150 meters (ground-level view description of the landscape). “Geomorphons (large radius)” layer should be considered a default representation of terrain for a query as it returns similarity maps in the best agreement with human judgment.
shad
ed D
EM
geom
orph
ons
(larg
e ra
dius
)
geom
orph
ons
(sm
all r
adiu
s)
7
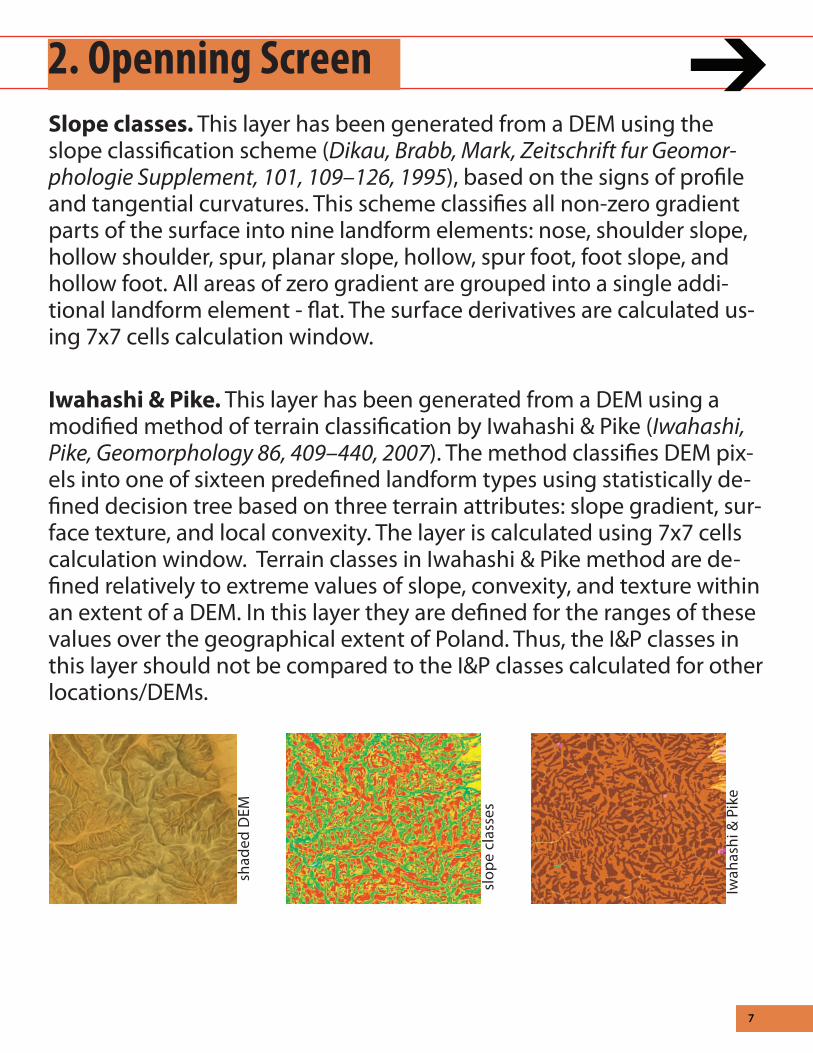
Slope classes. This layer has been generated from a DEM using the slope classification scheme (Dikau, Brabb, Mark, Zeitschrift fur Geomor-phologie Supplement, 101, 109–126, 1995), based on the signs of profile and tangential curvatures. This scheme classifies all non-zero gradient parts of the surface into nine landform elements: nose, shoulder slope, hollow shoulder, spur, planar slope, hollow, spur foot, foot slope, and hollow foot. All areas of zero gradient are grouped into a single addi-tional landform element - flat. The surface derivatives are calculated us-ing 7x7 cells calculation window.
2. Openning Screen
shad
ed D
EM
slop
e cl
asse
s
Iwah
ashi
& P
ike
Iwahashi & Pike. This layer has been generated from a DEM using a modified method of terrain classification by Iwahashi & Pike (Iwahashi, Pike, Geomorphology 86, 409–440, 2007). The method classifies DEM pix-els into one of sixteen predefined landform types using statistically de-fined decision tree based on three terrain attributes: slope gradient, sur-face texture, and local convexity. The layer is calculated using 7x7 cells calculation window. Terrain classes in Iwahashi & Pike method are de-fined relatively to extreme values of slope, convexity, and texture within an extent of a DEM. In this layer they are defined for the ranges of these values over the geographical extent of Poland. Thus, the I&P classes in this layer should not be compared to the I&P classes calculated for other locations/DEMs.

8
3.1 - Executing query
Query can be executed with any layer being an active layer. In the ex-ample above we started from the “shaded DEM layer” showing the en-tire Poland (A) and used use navigational tools to zoom into the south-eastern corner of Poland (B). Next, we pressed “Similarity” bottom to bring on a region of interest (ROI) square (C) which we repositioned into an area having topography that we want to query for. The ROI has the size of 500 x 500 pixels or 15 km x 15 km.
3. Similarity map
A B
C
Next, we selected “Geomorphons (large radius) as a layer we want to query. Other indicated layers can be also selected.
Last, we press the “Start calculations” bottom to execute the query or “Cancel” bottom to cancel the query. Once calculation ends the similar-ity layer appears (D). We can zoom out to full extent to see the result of the query over the entire Poland (E).
D E

9
3.2 - Query properties
Regions shown in red on the similarity map are characterized by land-scape type similar to that in the query location. This can be examined visually by comparing base/geomorphology map of the query with cor-responding maps in regions indicated as similar.
3. Similarity map
Once similarity calculations ends detailed properties of the query are shown in the left lower corner of TerraEx window.
Pattern of a queried geomorphology layer is shown. Press-ing on this pattern causes the main window of TerraEx to zoom in to the loca-tion of a query.
Press the “Legend” bottom (upper-right corner) to get a leg-end for similarity values.
3.3 - Examining similarity map
query similar dissimilarquery
similar
dissimilar
10
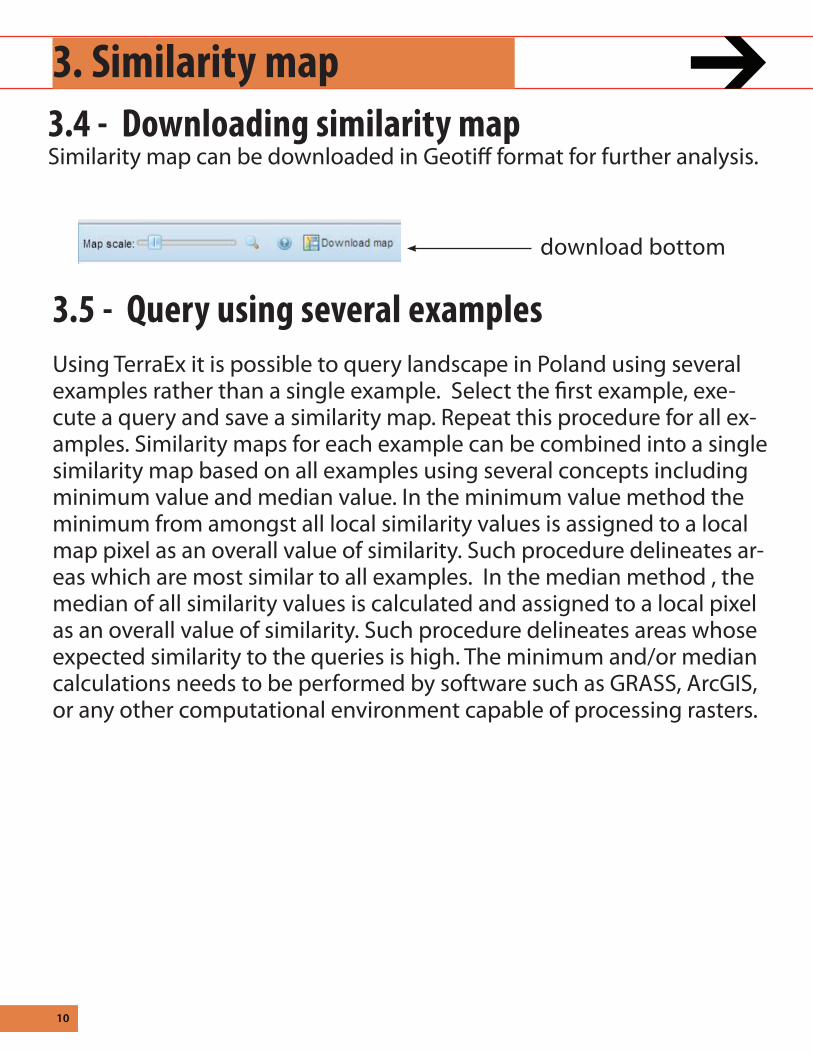
3. Similarity map3.4 - Downloading similarity map Similarity map can be downloaded in Geotiff format for further analysis.
download bottom
3.5 - Query using several examples Using TerraEx it is possible to query landscape in Poland using several examples rather than a single example. Select the first example, exe-cute a query and save a similarity map. Repeat this procedure for all ex-amples. Similarity maps for each example can be combined into a single similarity map based on all examples using several concepts including minimum value and median value. In the minimum value method the minimum from amongst all local similarity values is assigned to a local map pixel as an overall value of similarity. Such procedure delineates ar-eas which are most similar to all examples. In the median method , the median of all similarity values is calculated and assigned to a local pixel as an overall value of similarity. Such procedure delineates areas whose expected similarity to the queries is high. The minimum and/or median calculations needs to be performed by software such as GRASS, ArcGIS, or any other computational environment capable of processing rasters.

11
4.1 - Lattice of local landscapes
4. How TerraEx works?
TerraEx works using a lattice of local landscapes called “tiles.” A tile is a square subset of geomorphons map. In TerraEx the size of the tile has been fixed at 500 x 500 geomorphons map cells or 15 km x 15 km. The pattern of landform elements within a tile describes a local landscape. The entire territory of Poland is covered by overlapping local tiles. In Ter-raEx the overlap is 450 geomorphons map pixels. During the similarity calculation each local tile is compared to a query and the resultant simi-larity value is assigned to a 50 x 50 geomorphons map pixels cell located in the middle of the local tile. Thus the resolution of the resultant simi-larity map is 50 x 50 geomorphons map pixels or 1.5 x 1.5 km.
15km x 15km local site compared to the reference site
1.5 km x 1.5 km cell in the similarity map carrying a value of similarity between the local site and the refer-ence site
query
landscape similar to query at indicated level
A BFigure A above shows a fragment of similarity map. Each cell (for ex-ample, a cell indicated by a small black rectangle) stores a similarity val-ue between a local landscape (indicated by a dashed rectangle) and a query. Figure B above shows the same region but without the similarity map. Insert shows a query.

12
Similarity between two tiles (landscapes) is calculated from the histo-grams of their “primitive features.” Primitive features are elements of pattern that are counted to form a histogram. For example, landform elements themselves are the simplest possible features; histogram of such features is simply a count of cells having the same landform ele-ment labels. In TerraEx we use pairs of neighboring cells as primitive features (4-connected neighborhood is assumed). Figure A above shows a schematic picture of a tile with colors indicating different landform elements. Three pixels are chosen to illustrated (using arrows) the pairs their form with their neighbors. For example the pixel a1 (slope) gener-ates four features (two slope-slope and two slope-footslope). Figure B above shows all (55) possible pairs between ten landform elements.
4.2 - Landscape features4. How TerraEx works?
A B
a1

13
4. How TerraEx works?4.3 - Histogram of landscape features
Histograms of primitive features are widely used to compare patterns because of their rotational invariance. Figure above shows a histogram of our pairs-of-neighbors features constructed from a schematic tile shown on the previous page. It can be observed that this histogram is dominated by pairs that involves “flat” landform element (gray color). In particular there is a lot of flat-flat pairs indicating relatively extended ar-eas of flat terrain. Overall, the information in the histogram of pairs-of-neighbors features encapsulates well the pattern in the local landscape. However, different landscapes can have histograms that “looks” similar as illustrated below. Histograms A and B of different landscape types, “Highlands” and “Low mountains”, looks similar inasmuch as they have non-zero bins in the same positions. In order to differentiate between these two histograms an appropriate measure of histograms similarity is needed (see next).
A
B

14
4. How TerraEx works?4.4 - Similarity measure between histogramsIn TerraEx we use a variant of normalized Wave Hedges similarity mea-sure ( Cha, S.-H., International Journal of Mathematical Models and Meth-ods in Applied Sciences, 1(4), 300-307, 2007) which takes values from 1 (identical histograms) to 0 (histograms do not share bins). The formula for Wave Hedges similarity is:
In this formula Th indicates a histogram of local landscape and Qh in-dicates a histogram of the query. Bins of the histograms are labeled by index i, and the summation is performed over n bins (out of 55 possible bins) which are present in both histograms. This similarity measure compares corresponding bins of two histograms and compute a fraction equal to (smaller bin)/(larger bin). The bin com-parison values are summed and the sum is divided by the number of bins. An overall similarity is built from similarities between individual features. Note that with such similarity measure two histograms which “look” similar because they have the same bins may be quite different is the values in the corresponding bins are different. This is why two land-scape types shown on previous page are measured as different even so their histograms looks similar. Also note that this similarity measure is not sensitive to absolute composition of landform elements in a land-scape; for example, two landscapes dominated by the flat element may still be measured as different if other, minor elements are different.

15
6. TerraEx development teamDr. TOMASz STEPInSkISpace InformatIcS lab, unIverSIty of cIncInnatI215 Braunstein Hall Cincinnati, OH 45221, [email protected]
Dr. PAwEL nETzELDepartment of clImatology anD atmoSpherIc protectIon anD Space InformatIcS lab, unIverSIty of cIncInnatIUniversity of WroclawKosiby 6/8, 51-621, Wroclaw, Poland [email protected]
Dr. jArOSLAw jASIEwICzInStItute of geoecology anD geoInformatIon aDam mIckIewIcz unIverSIty anD Space InformatIcS lab, unIverSIty of cIncInnatIDziegielowa 2760-680 Poznan, [email protected]


