86
| Date post: | 29-Jan-2017 |
| Category: |
Documents |
| Upload: | trinhnguyet |
| View: | 224 times |
| Download: | 2 times |

This collection of activities is based on a weekly series of space science problems distributed to thousands of teachers during 2006-2007 school year. They were intended as extra-credit problems for students looking for additional challenges in the math and physical science curriculum in grades 9 through 12. The problems were designed to be authentic glimpses of modern science and engineering issues that come up in designing satellites to work in space, and to provide insight into the basic phenomena of the Sun-Earth system, specifically ‘Space Weather’. The problems were designed to be ‘one-pagers’ with a Teacher’s Guide and Answer Key as a second page. This compact form was deemed very popular by participating teachers.
This booklet was created by the NASA, Hinode satellite program's Education and Public Outreach Project.
Writers and Reviewers:
Dr. Sten Odenwald (NASA - Hinode)
Ms. Christine James (Student, B-CC High School, Maryland)
The pictures show sunspot magnetic fields imaged by the Hinode satellite in November, 2006.
For more weekly classroom activities about the Sun-Earth system visit the NASA website, http://spacemath.gsfc.nasa.gov
Add your email address to our mailing list by contacting Dr. Sten Odenwald at [email protected]

Table of Contents
Acknowledgments …………………………………………...………… Table of Contents……………………………………………………….. Alignment with Standards …………………………………………….. Teacher Notes…………………………………………………………. An Introduction to Space Radiation….…………………………….. Unit Conversion Exercises………………………………………..…… Radiation Background and Lifestyles…………………………..…… A Perspective on Radiation Dosages…………………………...…… Having a Hot Time on Mars! ……………………………………..…… Calculating Total Radiation Dosages at Mars………………..……. Single Event Upsets in Aircraft Avionics……………………...….… The Deadly Van Allen Belts? …………………………………….…… Systems of Equations in Space Science……………………..…….. Monster Functions in Space Science…………………………...…… Parametric Functions and Substitution………………………..……. Radon Gas in the Basement……………………………………..……. Some Puzzling Thoughts about Space Radiation…………….…… Moving Magnetic Fields near Sunspots…………………….………. Correcting Bad Data using Parity Bits……………………….……… Data Corruption by High-Energy Particles………………….……… The Pressure of a Solar Storm…………………………………..……. Are U Nuts? ………………………………………………………..…….. Lunar Meteorite Impact Risk……………………………………...…… Beyond the Blue Horizon………………………………………….…… Measuring the Speed of a Solar Tsunami…………………….…….. Do Fast CMEs Produce Intense SPEs? ……………………….……. Atmospheric Shielding from Radiation Part I……………………... Atmospheric Shielding from Radiation Part II………………...…... Atmospheric Shielding from Radiation Part III.…………….……... Introduction to Radiation Shielding…………………………….……. Astronomy as a Career………………………………………….……… Solar Storms; Odds, Fractions and Percentages…………….…… A Study of Astronaut Radiation Dosages……………………..……. Hinode Satellite Power……………………………………………...….. Hinode - A Closeup of a Sunspot ……………………………...……. Compound Interest ………………………………………………..…… Solar Flare Reconstruction ……………………………………...……. A Lunar Transit of the Sun from Space …………………………….. The Hinode Satellite Views the Sun…………………………..……… The Sunspot Cycle - Endings and beginnings………………..…… Super-fast Solar Flares……………………………………………..….. A Note from the Author……………………………………………….. Useful web links for additional resources………………….……….
i ii iii iv 0 1 2 3 4 5 6 7 8 9 10 11 12 13 14 15 16 17 18 19 20 21 22 23 24 25 26 27 28 29 30 31 32 33 34 35 36 37 39

Topic Problem Number 5 6 7 8 9 1 1 1 1 1 1 1 1 1 1 2 2 2 2 2 2 2 2 2 2 3 3 3 3 3 3 3 3
0 1 2 3 4 5 6 7 8 9 0 1 2 3 4 5 6 7 8 9 0 1 2 3 4 5 6 7 x x x x x x x x x
x x x x
x x x x x x x x x x x x
x x x x x x x xx x
x x x x
x x x x x x x x
x x x x x x x x
x x x x x x x
x x
1 2 3 4
Logic Time, distance Area, and probability Venn Diagrams percentages Scale x x drawings
x x x x
x x
X x x x x x
Polygonal Areas
Geometry Sci. Notation Unit Conversions Graph Analysis x x x x x x x
x
x x x x
x
Systems of Equations Sin, Cos,
Tan Solving for X
Evaluating Fns Polynomials
Function Differentiation
Graphical x x x x x Integration
x x
x
Function Integration
Compound Interest
Alignment with Mathematics Standards The following table connects the activities in this booklet to topics commonly covered in geometry, algebra and calculus textbooks. The cells are shaded according to these three math content areas. The specific national math and science education standards (NSF ‘Project 2061’) targeted by this product are: Grade 9-10 - Algebra I Find answers to problems by substituting numerical values in simple algebraic formulas. Use tables, charts and graphs in making arguments and claims in oral and written presentations. Distances and angles inconvenient to measure directly can be found by using scale drawings. Perform unit conversions in multi-step problems. Grade 11-12 - Algebra II and Calculus Solve simple equations for ‘X’, and compound interest. Examine practical applications of matrix algebra. Work with trigonometric functions in simple applications. Use the Chain Rule for Differentiation. Find the areas under curves, both graphically and using simple integrals.

Teacher Notes. The order of the problems in this book reflects the order in which they were presented as Weekly Problems during the school year and do not represent a logical sequence of science study. Below are the general topic areas that are covered, and a suggested sequence of presentation by level of math difficulty if they are used as part of a course of study. Radiation Effects on Humans and Technology An Introduction to Space Radiation Unit Conversion Exercises
0 1
Correcting Bad Data using Parity Bits Radiation Background and Lifestyles A Perspective on Radiation Dosages Radon Gas in the Basement
14 2 3
11
Some Puzzling Thoughts about Space Radiation Data Corruption by High-Energy Particles Having a Hot Time on Mars! Calculating Total Radiation Dosages at Mars Single Event Upsets in Aircraft Avionics
The Deadly Van Allen Belts? A Study of Astronaut Radiation Dosages Introduction to Radiation Shielding
Atmospheric Shielding from Radiation Part I Atmospheric Shielding from Radiation Part II Atmospheric Shielding from Radiation Part III
12 15 4 5 6 7
28 25
22 23 24
Solar Science
Solar Storms; Odds, Fractions and Percentages Do Fast CMEs Produce Intense SPEs?
27 21
Hinode - A Closeup of a Sunspot The Hinode Satellite Views the Sun
30 34
Hinode Satellite Power 29
Moving Magnetic Fields near Sunspots Super-fast Solar Flares
Measuring the Speed of a Solar Tsunami A Lunar Transit of the Sun from Space The Sunspot Cycle - Endings and beginnings
Solar Flare Reconstruction
13 36
20 33 35
32 The Pressure of a Solar Storm 16 Miscellaneous Math Topics Are U Nuts? 17 Lunar Meteorite Impact Risk Compound Interest Astronomy as a Career Systems of Equations in Space Science Monster Functions in Space Science Parametric Functions and Substitution
18 31 26
8 9
10 Beyond the Blue Horizon 19

Teacher Notes. Here is the order in terms of the mathematics topics covered: Addition, Subtraction, Multiplication, Division, unit conversion, percentages An Introduction to Space Radiation 0 Unit Conversion Exercises 1
Radiation Background and Lifestyles A Perspective on Radiation Dosages
Correcting Bad Data using Parity Bits Moving Magnetic Fields near Sunspots Hinode - A Closeup of a Sunspot
Hinode Satellite Power
2 3
14 13 30
29 The Hinode Satellite Views the Sun 34
Super-fast Solar Flares A Lunar Transit of the Sun from Space Measuring the Speed of a Solar Tsunami Do Fast CMEs Produce Intense SPEs?
36 33 20 21
Solar Storms; Odds, Fractions and Percentages Astronomy as a Career Are U Nuts?
27 26
17 Data Corruption by High-Energy Particles Lunar Meteorite Impact Risk
15 18
Graph analysis
The Sunspot Cycle - Endings and beginnings Having a Hot Time on Mars! Calculating Total Radiation Dosages at Mars Single Event Upsets in Aircraft Avionics
The Deadly Van Allen Belts? Radon Gas in the Basement
35 4 5 6 7
11 A Study of Astronaut Radiation Dosages 28 Algebra Some Puzzling Thoughts about Space Radiation Solar Flare Reconstruction
12 32
The Pressure of a Solar Storm 16
Compound Interest Systems of Equations in Space Science Monster Functions in Space Science
Parametric Functions and Substitution
31 8 9
10 Trigonometry
Atmospheric Shielding from Radiation Part I Atmospheric Shielding from Radiation Part II
Introduction to Radiation Shielding
22 23
25 Calculus
Beyond the Blue Horizon Atmospheric Shielding from Radiation Part III
19 24
Cover Credits: Astronaut White (NASA/Gemini); Mars solar wind (NASA/JPL/ Mars Global Surveyor); International Space Station (NASA/ISS) Inside Figure Credits: 1) Radiation Pie chart (Lawrence Radiation Lab); 3) Astronaut White (NASA/Gemini); 4) Mars radiation (NASA/Mars Orbiter); 6) Altair UAV (NASA/Dreyden); 7)Van Allen belts (WWW unattributed) Radiation dosages (NASA/CRRES); 8) solar images (NASA/SOHO) Satellite (Boeing); 9) Alien monster (WWW unattributed); 10) Aurora photo (Dick Hutchinson); 11) Radon Map (EPA); 13) Sunspot (Hinode); 150 Solar images (NASA/ESA/SOHO); 16) Magnetosphere model (University of Michigan/SPARC); 17) Squirrel (www unattributed); 18) Lunar impacts (NASA); 19) Mars (NASA); 20) Tsunami waves (National Solar Observatory); 21, 27) solar images (NASA/ESA/SOHO); 22, 23, 24) Earth image (NASA / Apollo 17); 29) Hinode spacecraft (Hinode/RAL - B. E. Johnson); 30) Solar surface (NASA/Hinode); 33) mercury transit (NASA/STEREO); 34) solar corona (Hinode)

Different types of radiation can be shielded by different materials
Space Math http://spacemath.gsfc.nasa.gov

An Introduction to Space Radiation
Believe it or not, you are surrounded by radiation! As you are sitting here reading this article, electromagnetic radiation from sunlight, electric lights, power cables in the walls, and the local radio station are coursing through your body. Is it something to worry about? It all depends on how much you absorb, and in what forms. There are two main types of radiation: electromagnetic radiation, and particle radiation. Both forms carry energy, which means that if you accumulate too much over time, either in the tissues of your body, or in sensitive electronic equipment, they can potentially do damage. A small amount of ultraviolet radiation can give you a nice tan. Too much can increase your risk for skin cancer. A small amount of radio radiation is enough to pick up a distant station on your radio, but too much in a microwave oven will cook you in ten seconds flat! A small amount of particle radiation in, say, the radium dial of a watch, is enough to make it glow in the dark harmlessly, but too much can destroy the DNA in your cells and lead to mutations…even death. Scientists measure radiation dosages and exposure in terms of units called Rads and Rems (Grays and Seiverts are used in Europe). Rad means 'Radiation Equivalent Dose' and REM means 'Roentgen Equivalent Man'. One Rad is equal to 100 ergs of energy delivered to one gram of matter. The Rem compares the amount of absorbed energy to the amount of tissue damage it produces in a human. Rad = Rem x Q Electromagnetic radiation, such as x-rays and gamma-rays, produce 'one unit' or tissue damage, so for this kind of radiation Q = 1, and so 1 Rad = 1 Rem. Most low-intensity forms of 'EM' radiation can be shielded by using clothing or skin creams. In high dosages, X-rays and gamma-rays require shielding to reduce their health effects, otherwise they can be lethal, or can even incinerate tissue. There are three different kinds of particle radiation, each produces its own level of tissue damage. Alpha-particles are given-off by radioactive atoms. They are nuclei containing two protons and two neutrons: essentially helium nuclei. These particles, at high energy, can be very destructive to tissue as they leave tracks of ionization in cytoplasm and other cellular tissues. For these Q = 15-20. Beta-particles are also given off by radioactive atoms. They consist of energetic electrons traveling at high-speed, and require several millimeters of aluminum or other shielding to stop most of them. For these, Q = 1. Neutron particles are produced in nuclear reactions including fission and fusion. Because they carry no charge, they easily penetrate many substances. Q = 10.
6 Because of the differences in Q, different forms of radiation produce different levels of tissue damage. Beyond this, radiation also has different effects depending on how much you absorb over different amounts of time. Let's consider two extreme examples where your entire body is 'irradiated': A small dose over a long time, and a big does over a short time. Weak and Long! On the ground, you receive about 0.4 Rem (e.g. 400 milliRem) of natural backround radiation and radiation from all forms of medical testing, what you eat, and where you live. Over the course of your lifetime, say 80 years, this adds up to 80 x 0.4 = 32 Rem of radiation. By far, the biggest contribution comes from radioactive radon gas in your home, which can amount to as much as 0.1 Rem, which yields a lifetime dose of 8 Rem. Some portion of this radiation exposure invariably contributes to the average cancer risk that each and every one of us experiences. Medical Diagnostic Radiation: 0.002 Rems Dental x-ray 0.010 Rems Diagnostic chest X-ray 0.065 Rems Pelvis/Hip x-ray 0.150 Rems Barium enema for colonoscopy 0.300 Rems Mammogram 0.440 Rems Bone scan 2 to 10 Rem CT scan of whole body Strong and Intense! In cancer therapy, small parts of your body are irradiated to kill cancerous cells. This works because radiation transports energy into cellular tissue where it is absorbed, and cancerous cells are very sensitive to heat. Although patients report nausea and loss of hair, the benefits to destroying cancerous cells far outweighs the collateral effects. Typical dosages are about 200 Rems over a few square centimeters, or even 5,000 Rem over a single tumor area! For whole-body dosages, the effects are far worse! 50 - 100 Rems No significant illness 100 - 200 Rems Nausia ,vomiting. 10% fatal in 30 days. 200 - 300 Rems Vomiting. 35% fatal in 30 days. 300 - 400 Rems Vomiting, diarrhea. 50% fatal in 30 days. 400 - 500 Rems Hair loss, fever, hemorrhaging in 3wks. 500 - 600 Rems Internal bleeding. 60% die in 30 days. 600- 1,000 Rems Intestinal damage. 100% lethal in 14 days. 5,000 Rems Delerium, Coma: 100% fatal in 7 days. 8,000 Rems Coma in seconds. Death in an hour. 10,000 Rems Instant death. Would you like to check your annual exposure? Visit the American Nuclear Society webpage and take their test at http://www.ans.org/pi/resources/dosechart/ or use the one at the US Environmental Protection Agency http://www.epa.gov/radiation/students/calculate.html or the one at the Livermore National Radiation Laboratory http://newnet.lanl.gov/main.htm
Space Math http://spacemath.gsfc.nasa.gov

Questions to ponder, based on the text. 1- During an accident, a 70 kg person absorbed 1,000 Rem of x-ray radiation. A) How much energy, in ergs, did the person gain? B) If 41,600,000 ergs is needed to raise the temperature of 1 gram of water by 1 degree C, how many degrees did the radiation raise the person's body temperature if the human body is mostly water? 2 - Your probability of contracting cancer from the natural background radiation (0.3 Rem/year) depends on your lifetime exposure. From detailed statistics, a sudden 1 Rem increase in dosage causes an 0.08% increase in deaths during your lifetime, but the same dosage spread over a lifetime causes about 1/2 this cancer increase. By comparison, cancer studies show that a typical person has an 20% lifetime mortality rate from all sources of cancer. (see "Radiation and Risk", Ohio State University, http://www.physics.isu.edu/radinf/risk.htm). A) Consider 10,000 people exposed to radiation. How many natural cancer deaths would you expect to find in such a sample? B) How much does the natural background radiation contribute to this cancer death rate? C) Whenever you take a survey of people, there is a built-in statistical uncertainty in how precisely you can make the measurement, which is found by comparing the sample size to the square-root of the number of samples. In polls, this is referred to as the 'margin of error'. For your answer to Problem 2a, what is the range of people that may die from cancer in this population? D) Compared to your answer to Problem 2B, do you think you would be able to measure the lifetime deaths from natural background radiation exposure compared to the variation in cancer mortality in this population?
Space Math http://spacemath.gsfc.nasa.gov

Answer Key 1- During an accident, a 70 kg person absorbed 1,000 Rem of x-ray radiation. A) How much energy, in ergs, did the person gain? Answer: For X-rays, which are electromagnetic radiation, Q = 1 so 1 Rem = 1 Rad. Then, 1000 Rem x 100 ergs/gram x 170 kg x 1000 gm/kg = 170,000,000,000 ergs. B) If 41,600,000 ergs is needed to raise the temperature of 1 gram of water by 1 degree C, how many degrees did the radiation raise the person's body if the human body is mostly water? Answer: 1000 Rem x 100 ergs/Rem = 100,000 ergs So, 100,000 ergs/ (41,600,000 ergs/degree C) = 0.002 degrees C. 2 - Your probability of contracting cancer from the natural background radiation (0.3 Rem/year) depends on your lifetime exposure. From detailed statistics, a sudden 1 Rem increase in dosage causes an 0.08% increase in deaths during your lifetime, but the same dosage spread over a lifetime causes about 1/2 this cancer increase. By comparison, cancer studies show that a typical person has an 20% lifetime mortality rate from all sources of cancer. (see "Radiation and Risk", Ohio State University, http://www.physics.isu.edu/radinf/risk.htm). A) Consider 10,000 people exposed to radiation. How many natural cancer deaths would you expect to find in such a sample? Answer: 10,000 x 0.2 = 2,000 deaths over a lifetime. B) How much does the natural background radiation contribute to this cancer death rate? Answer: 0.3 Rem/yr x 75 years x 0.04% = 0.9% x 10,000 people = 90 people. C) Whenever you take a survey of people, there is a built-in statistical uncertainty in how precisely you can make the measurement, which is found by comparing the sample size to the square-root of the number of samples. In polls, this is referred to as the 'margin of error'. For your answer to Problem 2a, what is the range of people that may die from cancer in this population? Answer: (10000)1/2 = 100 so the range is from (2000 - 100) to (2000 + 100) or 1900 to 2100 people. D) Compared to your answer to Problem 2B, do you think you would be able to measure the lifetime deaths from natural background radiation exposure compared to the variation in cancer mortality in this population? Answer: Comparing the 90 deaths to the statistical uncertainty of 100 deaths in a sample of 10,000 people, you would not be able to detect the 90 deaths assigned to the natural background, against the variation of deaths you statistically expect from all other causes of cancer.
Space Math http://spacemath.gsfc.nasa.gov

1 Unit Conversion Exercises To understand the effect that radiation has on biological systems, a number of different systems for measurement have arisen over the last 50 years. European scientists prefer to use Grays and Seiverts while American scientists still use Rads and Rems! The chart to the left shows your typical radiation dosage on the ground and the factors that contribute to it.
Basic Unit Conversions: 1 Curie = 37 billion disintegrations/sec 1 Gray = 100 Rads 0.001 milli 1 Rad = 0.01 Joules/kg 0.000001 micro 1 Seivert = 100 Rems 1 lifetime = 70 years 1 Roentgen = 0.000258 Charges/kg 1 year = 8760 hours 1 microCoulomb/kg = 46 milliRem 1 Coulomb = 6.24 billion billion charges
Convert: 1 . 360 milliRem per year to ………………………….microSeiverts per hour 2. 7.8 milliRem per day to ………………………….Rem per year 3. 1 Rad per day to ……………………………………Grays per year 4. 360 milliRem per year to ……………………………Rems per lifetime 5. 3.0 Roentgens to ………………………………… charges per gram 6. 5.6 Seiverts per year to …………………………….milliRem per day 7. 537.0 milliGrays per year to ………………..……...milliRads per hour
Space Math http://spacemath.gsfc.nasa.gov

1 Unit Conversion Exercises
Answer Key 1 . 360 milliRem per year to ………………………….…0.41 microSeiverts per hour 360 milliRem/yr x 1Rem/1000 milliRem x 1 year/8760 hours = 0.000041 Rem/hour 0.000041 Rem/hour x 1.0 Seiverts/100 Rem = 0.00000041 Seiverts/hour 0.00000041 Seiverts/hour x 1 microSeivert/0.000001Seivert = 0.41 microSeiverts/hour 2. 7.8 milliRem per day to ………………………..……2.8 Rem per year 7.8 milliRem/day x 365 days/year = 2847.0 milliRem/year 2847.0 milliRem/year x 1.0 Rem/1000milliRem = 2.8 Rem/year 3. 1 Rad per day to ……………………………………..…3.65 Grays per year 1 Rad/day x 365 days/year x 1 Gray/100 Rads = 3.65 Grays/year 4. 360 milliRem per year to ………………………………25.2 Rems per lifetime 360 milliRem/year x 70 years/lifetime x 1 Rem/1000 milliRem = 25.2 Rems/lifetime 5. 3.0 Roentgens to ………………………..…0.000000774 charges per gram 3.0 Roentgens x 0.000258 charges/kg per Roentgen = 0.000774 charges/kg 0.000774 charges/kilogram x 1.0 kg/1000 gram = 0.000000774 charges/gram 6. 5.6 Seiverts per year to ………………………………1530 milliRem per day 5.6 Seiverts/year x 1.0 Year/365 days x 100 Rem/1.0 Seivert = 1.53 Rem/day 1.53 Rem/day x 1000 milliRem/Rem = 1530 milliRem/day 7. 537.0 milliGrays per year to ………………………….6.13 milliRads per hour 537.0 milliGrays/year x 1.0 years/8760 hours x 100 Rads/1.0 Gray = 6.13 milliRads/hour Note: There are many different conversion 'chains' that the students can offer. The challenge is to set up each ratio correctly with the right number in the numerator and denominator!
Space Math http://spacemath.gsfc.nasa.gov

2 Background Radiation and Lifestyles
Space Math http://spacemath.gsfc.nasa.gov
As we go about our daily lives, we are constantly surrounded by naturally-occurring sources of radiation. The accumulation of this radiation dosage every day throughout our lives leads to our total lifetime dosage. Depending on where we live, and our lifestyles, this lifetime dosage can make us susceptible to various forms of cancers. Generally, the lower your lifetime dose, the lower your risk for cancer. In the following activity, you will calculate the total lifetime dosages (in Rems) for a person living in several different geographic locations with a variety of lifestyles.
1. Nancy was born in Denver where the cosmic rays (GCR) produce 120 milliRem/year and an additional 105 milliRem/year comes from the ground (Terr.). After 30 years, she moves to Baton Rouge, Louisiana where GCR = 35 milliRem/year and Terr. = 40 milliRem/year. At both locations, she buys the same kind of house and she receives 100 milliRem/year from radon gas in the basement. Assuming all other lifestyle sources contribute 50 milliRem/year during her entire life, and that she is now 65 years old, what has been her total radiation dosage to date in Rem? 2. Suppose that Nancy was also a cigarette smoker since she was 16 years old, but that she gave up smoking when she turned 52. How much additional lifetime radiation dosage in Rems did she receive from this habit during the time she lived in Denver and Baton Rouge if her one-pack-a-day habit exposed her to 15 milliRem/year? 3. Suppose that Nancy was also an airline pilot since she was 27 years old. She has been smoking since age 16. She flys 900 hours each year, with 90% of this time spent at cruising altitudes ( 35,000 feet) where the cosmic radiation dosage is 5 microSeiverts per hour. If 1 Seivert = 100 Rems, how much additional radiation has she received than in your answer to Question 2? 4. Suppose that after 30 years, instead of moving to Baton Rouge, Nancy moved from Denver to Kerala, India where the terrestrial radiation dosage (Terr.) is 380 milliRem/year, but gives up smoking. What will be her total dosage by age 65? 5. Instead of being an airline pilot, at age 35 she decides to become a non-smoking astronaut. From Denver, she moved to Baton Rouge for 5 years, and then finds a home in Houston near the NASA Johnson Spaceflight Center, which is the hub of manned spaceflight activities. At this location, GCR = 45 milliRem/year and Terr. = 30 milliRem/year. At age 39 she becomes the co-pilot for the Space Shuttle Atlantis on a 13-day trip, during which time her radiation dosage is 19 milliRem/day. If she takes three of these trips before age 65, what is her total dosage?
Space Math http://spacemath.gsfc.nasa.gov
Answer Key: 1. Nancy was born in Denver where the cosmic rays (GCR) produce 120 milliRem/year and an additional 105 milliRem/year comes from the ground (Terr.). After 30 years, she moves to Baton Rouge, Louisiana where GCR = 35 milliRem/year and Terr. = 40 milliRem/year. At both locations, she buys the same kind of house and she receives 100 milliRem/year from radon gas in the basement. Assuming all other lifestyle sources contribute 50 milliRem/year during her entire life, and that she is now 65 years old, what has been her total radiation dosage to date in Rem? Denver; (120 + 105 + 100 + 50)millirem/year x 30 years x 1 Rem/1000 milliRems = 11.25 Rem Baton Rouge: (35 + 40 + 100 + 50) millirem/year x (65-30) years x 1 Rem/1000 milliRems = 7.88 Rem Total = 11.25 Rems + 7.88 Rems = 19.1 Rems. 2. Suppose that Nancy was a cigarette smoker since she was 16 years old, but that she gave up smoking when she turned 52. How much additional lifetime radiation dosage in Rems did she receive from this habit during the time she lived in Denver and Baton Rouge if her one-pack-a-day habit exposed her to 15 milliRem/year? Smoking = 15 milliRem/year x (52-16) years x 1.0 Rem / 1000 milliRems = 0.5 Rem Geographic = 19.1 Rem Total = 19.1 Rems + 0.5 Rems= 19.6 Rems 3. Suppose that Nancy was also an airline pilot since she was 27 years old, and retired at 45. She has been smoking since age 16. She flys 900 hours each year, with 90% of this time spent at cruising altitudes ( 35,000 feet) where the cosmic radiation dosage is 5 microSeiverts per hour. If 1 Seivert = 100 Rems, how much additional radiation has she received than in your answer to Question 2? 900 hours/year x (45-27) x 0.90 = 14,580 hours. 5 microSeiverts/hour x 100 Rems/1 Seivert = 500 microRems/hour 500 microRems/hour x 14,580 hours x 1 Rem/1000000microRem = 7.3 Rems Total = 19.6 Rems + 7.3 Rems = 26.9 Rems 4. Suppose that after 30 years, instead of moving to Baron Rouge, Nancy moved from Denver to Kerala, India where the terrestrial radiation dosage (Terr.) is 380 milliRem/year, but gives up smoking. What will be her total dosage by age 65? Denver = 11.3 Rems Kerala = 380 milliRems/year x (65-30) years x 1.0 Rem/1000 milliRems = 13.3 Rems Total = 11.3 Rems + 13.3 Rems = 24.6 Rems 5. Instead of being an airline pilot, at age 35 she decides to become a non-smoking astronaut. After 30 years in Denver, she moves to Baton Rouge for 5 years, then finds a home in Houston. At this location, GCR = 40 milliRem/year and Terr. = 30 milliRem/year. At age 39 she becomes the co-pilot for the Space Shuttle Atlantis on a 13-day trip, during which time her radiation dosage is 19 milliRem/day. If she takes three of these trips before age 65, what is her total dosage? Denver: 11.3 Rems Baton Rouge: 225 millirem/year x (35-30) years x 1 Rem/1000 milliRems = 1.1 Rem Houston: 220 millirem/year x (65-35) years x 1 Rem/1000 milliRems = 6.6 Rem Shuttle Flights: 3 x 13 days x 19 milliRem/day = 0.7 Rems Total = 11.3 Rems + 1.1 Rems + 6.6 Rems + 0.7 Rems = 19.7 Rems

3 A Perspective on Radiation Dosages
Space Math http://spacemath.gsfc.nasa.gov
Space travel is understandably a risky business. One of the most well-studied, and worrisome, hazards is the radiation environment. The sun produces streams of high-energy particles and flares, while the universe itself also rains particles down upon us from distant supernova explosions and other energetic phenomena. But how bad is space travel compared to just staying on Earth? For the following problems, plot how the radiation environment changes for a person living in Denver, on the Space Station, on the Moon, and on a journey to Mars and back. Calculate the total radiation dosage by computing the area under the respective curves.
1. Nancy was born and raised in Denver where her radiation dosage was 350 milliRems/year. At age 25, she moved to Houston where her dosage was 225 milliRems/year, then moved to South Dakota 10 years later where her dosage was 450 milliRems/year until she retired at age 65. Create a plot showing 'YEAR' on the horizontal axis and 'Dosage' on the vertical axis. Prove that the product of the vertical axis units times the horizontal axis units is the total dose in milliRems. Plot Nancy's annual dosages and calculate her total dosage by age 65. 2. An astronaut travels to the Moon on NASA's Orion Crew Vehicle, and spends two weeks on the lunar surface before returning to Earth. The radiation dosage is 19 milliRem/day in Earth orbit for each of two days. The 1/2 day trip through the van Allen belts is 300 milliRem/day. The journey to the Moon takes two days at 50 milliRem/day. The stay on the lunar surface under shielded conditions is 30 milliRem/day. The astronaut returns to Earth retracing the previous conditions, followed by a 2-day stay at the International Space Station, where the dosage is 1.5 milliRem/hour. Plot her dosage history and calculate the total dosage in Rems. 3. An astronaut journeys to Mars. The radiation dosage is 19 milliRem/day at the International Space Station for each of two days. The 1/2 day trip through the van Allen belts was 300 milliRem/day. The crew spends 225 days traveling to Mars, during which time the dosages are 100 milliRems/day. On Mars, for a planned stay of 540 days, the dosage will be about 50 milliRem/day. This is followed by a similar 225-day return to earth, 1/2-day trip through the van Allen Belts, and a 2-day stay at the Space Station. Plot her dosage history and calculate the dosages.

3 Answer Key:
Problem 1: Denver to Houston to South Dakota: (350 mRem/yr x 25 yrs) + (225 mRem/yr x 10 yrs) + (450 mRem/yr x 30 yrs) = 24.8 Rem Problem 2: Roundtrip: ( 19 mRem/day x 2 days) + (300 mRem/day x 0.5 days) + (50 mRem/day x 2 days) + (30 mRem/day x 14 days) + ( 50 mRem/day x 2 days) + (300 mRem/day x 0.5 days) + (19 mRem/day x 2 days) = 1.1 Rem Problem 3: Earth to Mars: (19 mRem/day x 2 days) + (300 mRem/day x 0.5 days) + (100 mRem/day x 225 days) + (50 mRem/day x 540 days) = 49.7 Rem Return Trip = 22.7 Rem Total Trip = 49.7 Rem + 22.7 Rem = 72.4 Rem
Space Math http://spacemath.gsfc.nasa.gov
Note to Teacher: The total lifetime radiation dosages for the trips in Problem 2 and 3 will be in ADDITION to the total dosages that the astronauts receive on the ground before and after the trip into space. For example, if an astronaut lives in Houston all his life (70 years) where the environmental and lifestyle dosage is 300 milliRems/year, the normal lifetime dosage will be 300 milliRems/year x 70 years = 21.0 Rems. In Problem 3, an astronaut travels to Mars and back, taking (2.5 + 225 + 540 + 225 + 2.5)= 995 days or 2.7 years their total Mars dosage will be 72.4 Rem added to (70-2.7)x 300 milliRems/year = 20.2 Rems on the ground for a total lifetime dosage of 92.6 Rems! Another way to look at this is to recognize that a trip to Mars will equal about 72.4 Rem/0.300 Rem = 241 years of normal background radiation living on Earth (in Houston)…but accumulated in only 2.7 years!
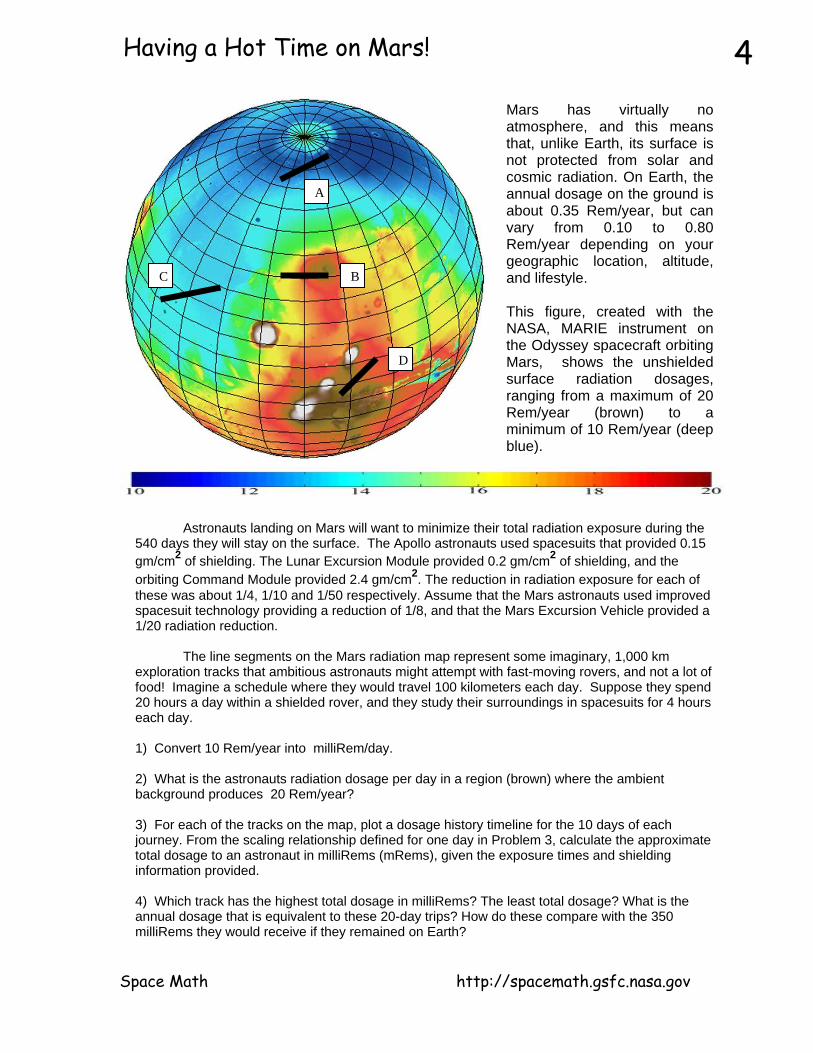
Having a Hot Time on Mars! 4
D
C B
A
Mars has virtually no atmosphere, and this means that, unlike Earth, its surface is not protected from solar and cosmic radiation. On Earth, the annual dosage on the ground is about 0.35 Rem/year, but can vary from 0.10 to 0.80 Rem/year depending on your geographic location, altitude, and lifestyle. This figure, created with the NASA, MARIE instrument on the Odyssey spacecraft orbiting Mars, shows the unshielded surface radiation dosages, ranging from a maximum of 20 Rem/year (brown) to a minimum of 10 Rem/year (deep blue).
Astronauts landing on Mars will want to minimize their total radiation exposure during the 540 days they will stay on the surface. The Apollo astronauts used spacesuits that provided 0.15 gm/cm2 of shielding. The Lunar Excursion Module provided 0.2 gm/cm2 of shielding, and the orbiting Command Module provided 2.4 gm/cm2. The reduction in radiation exposure for each of these was about 1/4, 1/10 and 1/50 respectively. Assume that the Mars astronauts used improved spacesuit technology providing a reduction of 1/8, and that the Mars Excursion Vehicle provided a 1/20 radiation reduction. The line segments on the Mars radiation map represent some imaginary, 1,000 km exploration tracks that ambitious astronauts might attempt with fast-moving rovers, and not a lot of food! Imagine a schedule where they would travel 100 kilometers each day. Suppose they spend 20 hours a day within a shielded rover, and they study their surroundings in spacesuits for 4 hours each day. 1) Convert 10 Rem/year into milliRem/day. 2) What is the astronauts radiation dosage per day in a region (brown) where the ambient background produces 20 Rem/year? 3) For each of the tracks on the map, plot a dosage history timeline for the 10 days of each journey. From the scaling relationship defined for one day in Problem 3, calculate the approximate total dosage to an astronaut in milliRems (mRems), given the exposure times and shielding information provided. 4) Which track has the highest total dosage in milliRems? The least total dosage? What is the annual dosage that is equivalent to these 20-day trips? How do these compare with the 350 milliRems they would receive if they remained on Earth?
Space Math http://spacemath.gsfc.nasa.gov
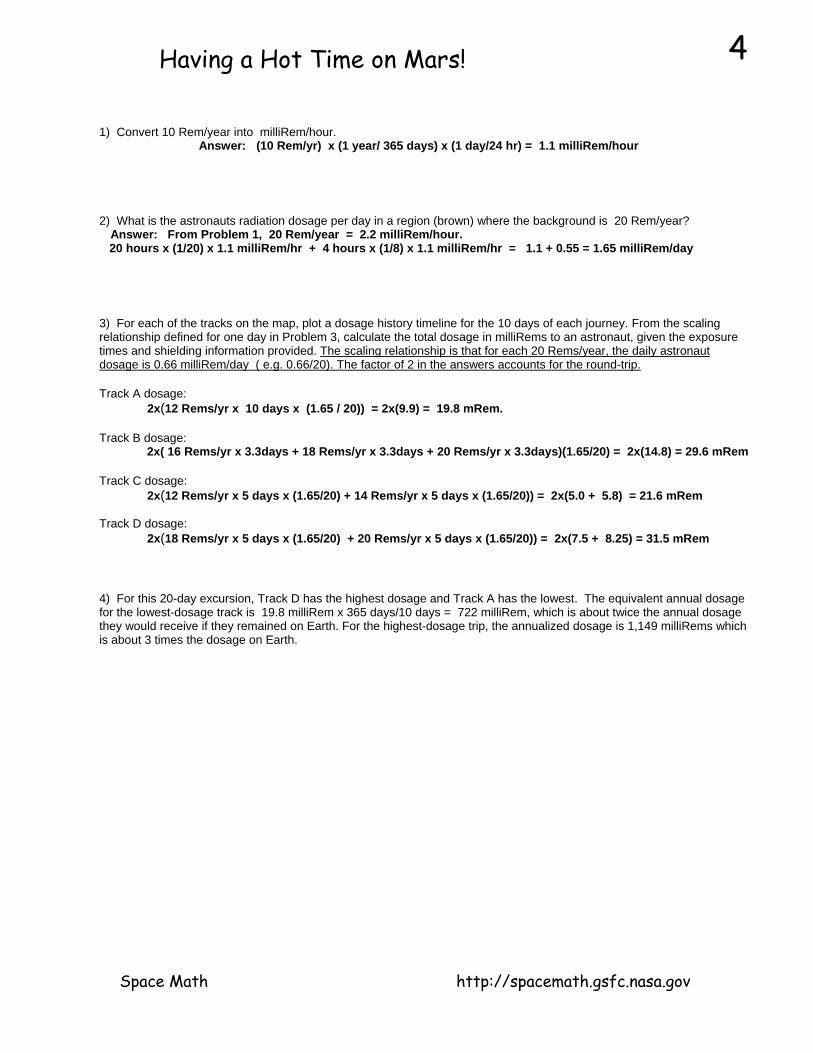
4 Having a Hot Time on Mars!
1) Convert 10 Rem/year into milliRem/hour. Answer: (10 Rem/yr) x (1 year/ 365 days) x (1 day/24 hr) = 1.1 milliRem/hour 2) What is the astronauts radiation dosage per day in a region (brown) where the background is 20 Rem/year? Answer: From Problem 1, 20 Rem/year = 2.2 milliRem/hour. 20 hours x (1/20) x 1.1 milliRem/hr + 4 hours x (1/8) x 1.1 milliRem/hr = 1.1 + 0.55 = 1.65 milliRem/day 3) For each of the tracks on the map, plot a dosage history timeline for the 10 days of each journey. From the scaling relationship defined for one day in Problem 3, calculate the total dosage in milliRems to an astronaut, given the exposure times and shielding information provided. The scaling relationship is that for each 20 Rems/year, the daily astronaut dosage is 0.66 milliRem/day ( e.g. 0.66/20). The factor of 2 in the answers accounts for the round-trip. Track A dosage: 2x(12 Rems/yr x 10 days x (1.65 / 20)) = 2x(9.9) = 19.8 mRem. Track B dosage: 2x( 16 Rems/yr x 3.3days + 18 Rems/yr x 3.3days + 20 Rems/yr x 3.3days)(1.65/20) = 2x(14.8) = 29.6 mRem Track C dosage: 2x(12 Rems/yr x 5 days x (1.65/20) + 14 Rems/yr x 5 days x (1.65/20)) = 2x(5.0 + 5.8) = 21.6 mRem Track D dosage: 2x(18 Rems/yr x 5 days x (1.65/20) + 20 Rems/yr x 5 days x (1.65/20)) = 2x(7.5 + 8.25) = 31.5 mRem 4) For this 20-day excursion, Track D has the highest dosage and Track A has the lowest. The equivalent annual dosage for the lowest-dosage track is 19.8 milliRem x 365 days/10 days = 722 milliRem, which is about twice the annual dosage they would receive if they remained on Earth. For the highest-dosage trip, the annualized dosage is 1,149 milliRems which is about 3 times the dosage on Earth.
Space Math http://spacemath.gsfc.nasa.gov

5 Calculating Total Radiation Dosages at Mars
The NASA, Mars Radiation Environment Experiment (MARIE) measured the daily radiation dosages from a satellite orbiting Mars between March 13, 2002 and September 30, 2003 as shown in the figure above. The dose rate is given in units of milliRads per day. (1 Rad = 2 Rems for cosmic radiation.) The six tall 'spikes' are Solar Proton Events (SPEs) which are related to solar flares, while the rest of the plotted data (the wiggly line!) is the dosage caused by galactic cosmic rays (GCRs). 1. By finding the approximate area under the plotted data, calculate the total radiation dosage in Rems for the GCRs during the observation period between 4/03/2002 and 8/20/2003. 2. Assuming that each SPE event lasted 3 days, and that its plotted profile is a simple rectangle, calculate the total radiation dosage in Rems for the SPEs during the observation period. 3. What would be the total radiation dosage for an unshielded astronaut orbiting Mars under these conditions? 4. Are SPEs more important than GCRs as a source of radiation? Explain why or why not in terms of estimation uncertainties that were used.
Space Math http://spacemath.gsfc.nasa.gov
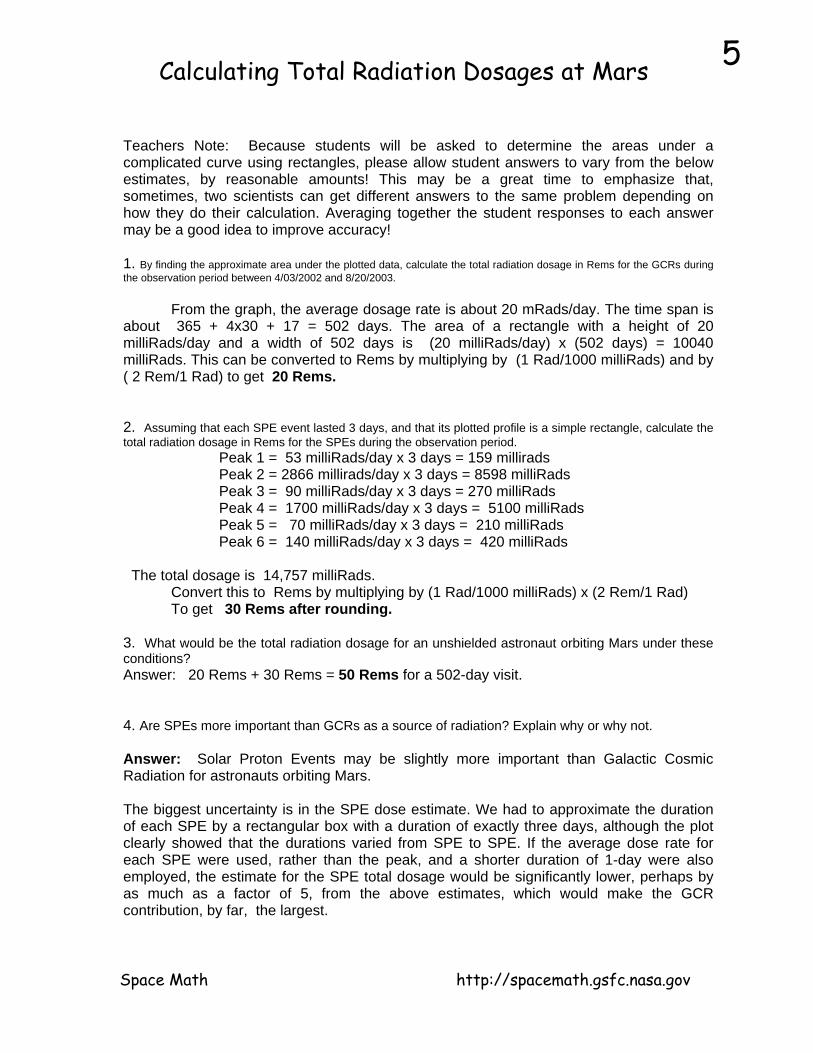
5 Calculating Total Radiation Dosages at Mars
Teachers Note: Because students will be asked to determine the areas under a complicated curve using rectangles, please allow student answers to vary from the below estimates, by reasonable amounts! This may be a great time to emphasize that, sometimes, two scientists can get different answers to the same problem depending on how they do their calculation. Averaging together the student responses to each answer may be a good idea to improve accuracy! 1. By finding the approximate area under the plotted data, calculate the total radiation dosage in Rems for the GCRs during the observation period between 4/03/2002 and 8/20/2003. From the graph, the average dosage rate is about 20 mRads/day. The time span is about 365 + 4x30 + 17 = 502 days. The area of a rectangle with a height of 20 milliRads/day and a width of 502 days is (20 milliRads/day) x (502 days) = 10040 milliRads. This can be converted to Rems by multiplying by (1 Rad/1000 milliRads) and by ( 2 Rem/1 Rad) to get 20 Rems. 2. Assuming that each SPE event lasted 3 days, and that its plotted profile is a simple rectangle, calculate the total radiation dosage in Rems for the SPEs during the observation period. Peak 1 = 53 milliRads/day x 3 days = 159 millirads Peak 2 = 2866 millirads/day x 3 days = 8598 milliRads Peak 3 = 90 milliRads/day x 3 days = 270 milliRads Peak 4 = 1700 milliRads/day x 3 days = 5100 milliRads Peak 5 = 70 milliRads/day x 3 days = 210 milliRads Peak 6 = 140 milliRads/day x 3 days = 420 milliRads The total dosage is 14,757 milliRads. Convert this to Rems by multiplying by (1 Rad/1000 milliRads) x (2 Rem/1 Rad) To get 30 Rems after rounding. 3. What would be the total radiation dosage for an unshielded astronaut orbiting Mars under these conditions? Answer: 20 Rems + 30 Rems = 50 Rems for a 502-day visit. 4. Are SPEs more important than GCRs as a source of radiation? Explain why or why not. Answer: Solar Proton Events may be slightly more important than Galactic Cosmic Radiation for astronauts orbiting Mars. The biggest uncertainty is in the SPE dose estimate. We had to approximate the duration of each SPE by a rectangular box with a duration of exactly three days, although the plot clearly showed that the durations varied from SPE to SPE. If the average dose rate for each SPE were used, rather than the peak, and a shorter duration of 1-day were also employed, the estimate for the SPE total dosage would be significantly lower, perhaps by as much as a factor of 5, from the above estimates, which would make the GCR contribution, by far, the largest.
Space Math http://spacemath.gsfc.nasa.gov
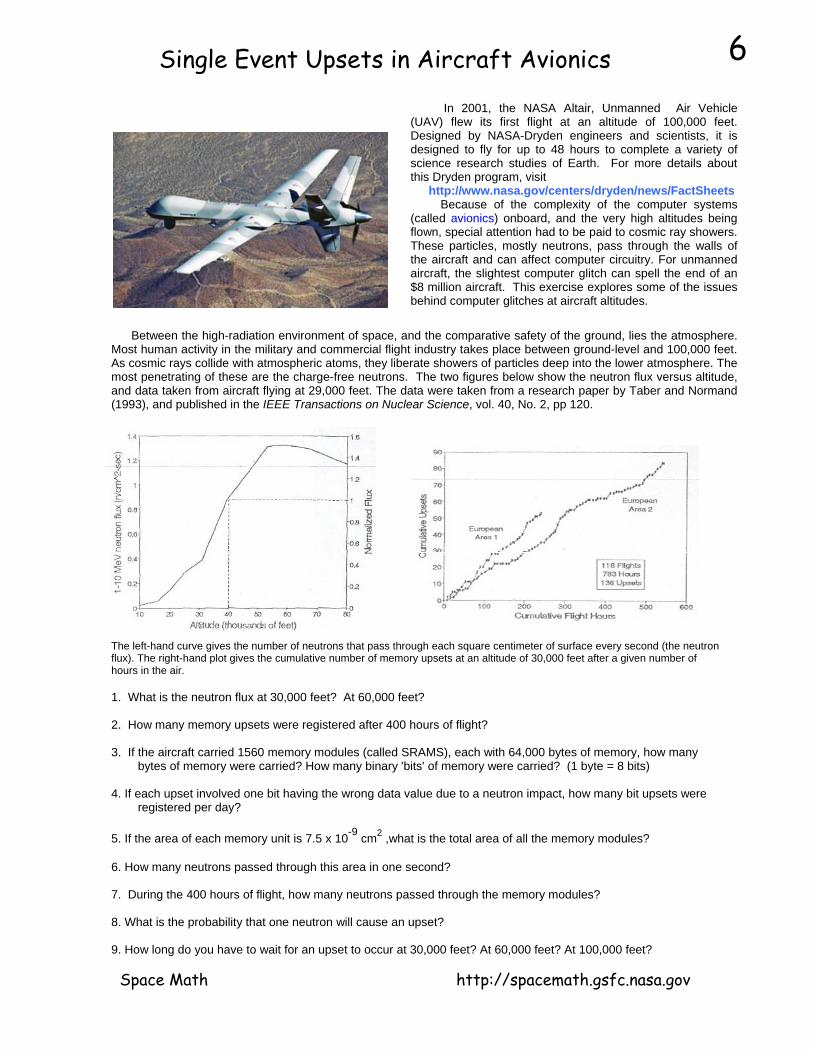
6 Single Event Upsets in Aircraft Avionics
In 2001, the NASA Altair, Unmanned Air Vehicle (UAV) flew its first flight at an altitude of 100,000 feet. Designed by NASA-Dryden engineers and scientists, it is designed to fly for up to 48 hours to complete a variety of science research studies of Earth. For more details about this Dryden program, visit http://www.nasa.gov/centers/dryden/news/FactSheets Because of the complexity of the computer systems (called avionics) onboard, and the very high altitudes being flown, special attention had to be paid to cosmic ray showers. These particles, mostly neutrons, pass through the walls of the aircraft and can affect computer circuitry. For unmanned aircraft, the slightest computer glitch can spell the end of an $8 million aircraft. This exercise explores some of the issues behind computer glitches at aircraft altitudes.
The left-hand curve gives the number of neutrons that pass through each square centimeter of surface every second (the neutron flux). The right-hand plot gives the cumulative number of memory upsets at an altitude of 30,000 feet after a given number of hours in the air. 1. What is the neutron flux at 30,000 feet? At 60,000 feet? 2. How many memory upsets were registered after 400 hours of flight? 3. If the aircraft carried 1560 memory modules (called SRAMS), each with 64,000 bytes of memory, how many
bytes of memory were carried? How many binary 'bits' of memory were carried? (1 byte = 8 bits) 4. If each upset involved one bit having the wrong data value due to a neutron impact, how many bit upsets were
registered per day? 5. If the area of each memory unit is 7.5 x 10⁻⁹ cm2 ,what is the total area of all the memory modules? 6. How many neutrons passed through this area in one second? 7. During the 400 hours of flight, how many neutrons passed through the memory modules? 8. What is the probability that one neutron will cause an upset? 9. How long do you have to wait for an upset to occur at 30,000 feet? At 60,000 feet? At 100,000 feet?
Between the high-radiation environment of space, and the comparative safety of the ground, lies the atmosphere. Most human activity in the military and commercial flight industry takes place between ground-level and 100,000 feet. As cosmic rays collide with atmospheric atoms, they liberate showers of particles deep into the lower atmosphere. The most penetrating of these are the charge-free neutrons. The two figures below show the neutron flux versus altitude, and data taken from aircraft flying at 29,000 feet. The data were taken from a research paper by Taber and Normand (1993), and published in the IEEE Transactions on Nuclear Science, vol. 40, No. 2, pp 120.
Space Math http://spacemath.gsfc.nasa.gov

6 Answer Key:
The left-hand curve gives the number of neutrons that pass through each square centimeter of surface every second (the neutron flux). The right-hand plot gives the cumulative number of memory upsets at an altitude of 30,000 feet after a given number of hours in the air. 1. What is the neutron flux at 30,000 feet? From the graph: 0.35 neutrons/cm2/sec 2. How many memory upsets were registered after 400 hours of flight? From the graph: 60 upsets 3. If the aircraft carried 1560 memory modules (called SRAMS), each with 64,000 bytes of memory, how many bytes of memory were carried? How many binary 'bits' of memory were carried? (1 byte=8 bits) 1560*64000 = 99.8 megabytes x 8 bits/byte = 798,000,000 bits 4. If each upset involved one bit having the wrong data value due to a neutron impact, how many bit upsets were registered per day? 60/(400/24) = 3.6 bits/day for a population of 798,000,000 bits 5. If the area of each memory unit is 7.5 x 10⁻⁹ cm2 ,what is the total area of the memory modules? 7.9 x 10-9 x 798,000,000 = 6.3 cm2. 6. How many neutrons passed through this total memory area in one second? From the answers to Problem 1 and 5: 0.35 neutrons/cm2/sec x 6.3 cm2 = 2.2 neutrons/second. 7. During the 400 hours of flight, how many neutrons passed through the memory modules? 2.2 neutrons/sec x 400 hours x 3600 seconds/hr = 3.2 million neutrons. 8. What is the probability that one neutron will cause an upset? From Problem 2 and 7: 60 upsets /3.2 million neutrons= 1 chance in 53,300. 9. How long do you have to wait for an upset to occur at 30,000 feet? The time it takes 53,300 neutrons to pass through the memory at 2.2 neutrons per second. 53,300/2.2 = 6.7 hours. Or you can get it by 400/60 = 6.7 hours. At 60,000 feet, the neutron flux is 1.3/0.35 = 3.7 times higher than at 30,000 feet, so you would have to wait 6.7/3.7 = 1.8 hours. At 100,000 feet, which is the cruising altitude of the Altair UAV, the graph suggests a neutron flux of about 1.0 neutrons/cm2/sec, so the flux is 1.0/0.35 = 2.9 times stronger at 100,000 feet than at 30,00 feet, and the time between upsets would be about 6.7/2.9 = 2.3 hours. If the UAV were equipped with this much memory (about 100 megabytes) and was airborne for 48 hours, it would experience 48/2.3 = 21 memory upsets! This is why the computer systems on the UAV have to be radiation-hardened and the software designed to fix radiation errors when they occur.
Space Math http://spacemath.gsfc.nasa.gov

7 The Deadly Van Allen Belts?
In 1958, Dr. James Van Allen discovered a collection of high-energy particle clouds within 40,000 km of Earth. Arranged like two nested donuts, the inner belt is mainly energetic protons, while the outer belts contain both protons and electrons. These belts have long been known as 'bad news' for satellites and astronauts, with potentially deadly consequences if you spend too much time within them. The figure below, produced by scientists from the NASA, CRRES satellite, shows the radiation dosages at various locations within the belts. Blue = 0.0001 Rads/sec Green= 0.001 Rads/sec Yellow= 0.005 Rads/sec Orange= 0.01 Rads/sec and Red= 0.05 Rads/sec.
The numbers along the horizontal axis give the distance from Earth in multiples of the Earth radius (1 Re=6378 km). The Inner van Allen Belt is located at about 1.6 Re. The Outer van Allen Belt is located at about 4.0 Re. At a distance of 2.2 Re, there is a 'gap' region in between these belts. Satellites such as the Global Positioning System (GPS) orbit in this gap region where radiation effects are minimum. The International Space Station and Space Shuttle, on this scale, orbit very near the edge of the blue 'Earth disk' in the figure, so are well below the Van Allen Belts.
Apollo astronauts, and astronauts in the upcoming visits to the Moon, will have to travel through some of these belt regions because the orbit of the Moon lies along the fastest line-of-travel from Earth. On the scale of the above figure, the distance to the Moon is 60 Re. 1. The speed of the spacecraft will be about 25,000 km/hour. If the spacecraft travels along the indicated path (black bar), how long, in minutes, will it spend in the Blue, Green, Yellow, Orange and Red regions? 2. Given the indicated radiation dosages in Rads/sec for each zone, what will be the dosages that the astronauts receive in each zone? 3. What will be the total radiation dosage in Rads for the transit through the belts? 4. Some people believe that the Apollo moon landings were a hoax because astronauts would have been instantly killed in the radiation belts. According to the US Occupation Safety and Health Agency (OSHA) a lethal radiation dosage is 300 Rads in one hour. What is your answer to the 'moon landing hoax' believers? Note: According to radiation dosimeters carried by Apollo astronauts, their total dosage for the entire trip to the moon and return was not more than 2 Rads over 6 days
Space Math http://spacemath.gsfc.nasa.gov

7 Answer Key:
Apollo astronauts, and astronauts in the upcoming visits to the Moon, will have to travel through some of these belt regions because the orbit of the Moon lies along the fastest line-of-travel from Earth. On the scale of the above figure, the distance to the Moon is 60 Re. 1. The speed of the spacecraft will be about 25,000 km/hour. If the spacecraft travels along the indicated path, how long, in minutes, will it spend in the Blue, Green, Yellow, Orange and Red regions? Note: transit estimates may vary depending on how accurately students measure figure. Blue: 1.8 Re x (6378 km/Re) x (1 hour/25,000 km) x (60 minutes/1 hour) = 27.6 minutes Yellow: (1.4 x 6378) /25,000 x 60 = 6.1 minutes Orange: (1.0 x 6378) / 25,000 x 60 = 15.3 minutes Green: (0.25 x 6378)/25,000 x 60 = 3.8 minutes Red: 0 minutes Total transit time……………………… 52.8 minutes 2. Given the indicated radiation dosages in Rads/sec for each zone, what will be the dosages that the astronauts receive in each zone? Blue: = 27.6 minutes x ( 60 sec/ 1 minute) x (0.0001 Rads/sec) = 0.17 Rads Yellow = 6.1 minutes x 60 sec/minute x 0.005 rads/sec = 1.83 Rads Orange = 15.3 minutes x (60 sec/minute) x 0.01 rads/sec = 9.18 Rads Green = 3.8 minutes x (60 sec/minute) x 0.001 rads/sec = 0.23 Rads 3. What will be the total radiation dosage in Rads for the transit through the belts? 0.17 + 1.83 + 9.18 + 0.23 = 11.4 Rads 4. Some people believe that the Apollo moon landings were a hoax because astronauts would have been instantly killed in the radiation belts. According to the US Occupation Safety and Health Agency (OSHA) a lethal radiation dosage is 300 Rads in one hour. What is your answer to the 'moon landing hoax' believers? Note: According to radiation dosimeters carried by Apollo astronauts, their total dosage for the entire trip to the moon and return was not more than 2 Rads over 6 days. The total dosage for the trip is only 11.4 Rads in 52.8 minutes. Because 52.8 minutes is equal to 0.88 hours, his is equal to a dosage of 11.4 Rads / 0.88 hours = 13 Rads in one hour, which is well below the 300 Rads in one hour that is considered to be lethal. Also, this radiation exposure would be for an astronaut outside the spacecraft during the transit through the belts. The radiation shielding inside the spacecraft cuts down the 13 Rads/hour exposure so that it is completely harmless.
Space Math http://spacemath.gsfc.nasa.gov

8 Systems of Equations in Space Science
Solving a system of three equations in three unknowns can commonly be found in several space science and astronomy applications. Solar flares are a frequent phenomenon on the sun, especially during the peaks of solar activity cycles. Over 21,000 can occur during an average solar cycle period of 11 years! In our first problem, you will determine the average intensity of three classes of flares ('C', 'M' and 'X') by using statistical information extracted from three solar activity (sunspot!) cycles. During February 4 - 6, 2000 the peak month of Cycle 23 solar scientists tallied 37 C-class, 1 M-class and 1 X-class flares, for a total x-ray intensity of 705 mFU ( 1 mFU = 10-6 watts/m2) . During March 4 - 6, 1991 scientists tallied 15 C-class, 14 M-class and 4 X-class flares for a total x-ray intensity of 2775 mFU During April 1 - 3, 2001 scientists tallied 5 C-class, 9 M-class and 4 X-class flares for a total x-ray intensity of 2475 mFU. Problem 1: Use the above data to create a system of equations, solve them, and determine the average intensity of flares, to the nearest tenth, in each category (C, M and X) in units of mFU. Communications satellites use electrical devices called transponders to relay TV and data transmissions from stations to satellite subscribers around the world. There are two basic types: K-band transponders operate at frequencies of 11-15 GHz and C-band transponders operate at 3-7 GHz. Satellites come in a variety of standard models, each having its own power requirements to operate its pointing and positioning systems. The following satellites use the same satellite model: Satellite 1 : Anik F1 Total power = 15,000 watts Number of K-band transponders = 48 Number of C-band transponders = 36 Satellite 2 : Galaxy IIIc Total power = 14,900 watts Number of K-band transponders = 53 Number of C-band transponders = 24 Satellite 3 : NSS-8 Total power = 16,760 watts Number of K-band transponders = 56 Number of C-band transponders = 36 Problem 2: Use the data to determine the average power, to the nearest integer, of a K-band and a C-band transponder, and the satellite operating power, F, in watts.
Space Math http://spacemath.gsfc.nasa.gov

8 Answer Key:
Space Math http://spacemath.gsfc.nasa.gov
After setting up the problems as a matrix, you might want to use the spiffy online matrix calculator at http://www.bluebit.gr/matrix-calculator/ Problem 1: The system of equations is 31 C + 1 M + 1 X = 705 15 C + 14 M + 4 X = 2775 5 C + 9 M + 4 X = 2475 Matrix: 31 1 1 15 14 4 5 9 4 Inverse: 0.031 0.008 -0.016 -0.062 0.184 -0.169 0.101 -0.425 0.650 Solution: C : 0.031 x 705 + 0.008 x 2775 -0.016 x 2475 = 4.5 mFU M: -0.062 x 705 + 0.185 x 2775 -0.169 x 2475 = 51.4 mFU X: 0.101 x 705 -0.425 x 2775 +0.650 x 2475 = 500.2 mFU Problem 2. Solving for satellite transponder power, K and C, and satellite operating power, F using 3 equations in three variables. From the satellite data 48 K + 36 C + F = 15,000 53 K + 24 C + F = 14,900 56 K + 36 C + F = 16,760 Matrix: 48 36 1 53 24 1 56 36 1 Inverse: -0.125 0.0 0.125 0.031 -0.083 0.052 5.875 3.00 -7.875 Solution = -0.125 x 15000 + 0.125 x 16,760 = K = 220 watts per K-band transponder 0.031 x 15000 - 0.083 x 14,900 + 0.052 x 16,760 = C = 100 watts per C-band transponder 5.875 x 15000 + 3 x 14,900 - 7.875 x 16,760 = F = 840 watts for the satellite operating power

9 Monster Functions in Space Science I Forget about the wimpy formulas you have played with before. Here is a reasonably complex formula that you will have to evaluate, and which will involve all the skills you have previously learned in algebra…and a mastery of scientific notation too! Be careful, but don't be shy! Keep track of your decimal points and exponents!! And, oh yes….Watch your back!!!
Space Math http://spacemath.gsfc.nasa.gov
From 'An Analytic Solar Magnetic Field Model" by Banaszkiewicz, Axford and McKenzie (Astronomy and Astrophysics, vol. 337, p. 940-944.
Ththwhun Pr(BapEa r2 M α1 wh
ese formulas give the two components of e solar magnetic field, in units of Gauss, ere B = BBρ ρ + BzB z where ρ and z are the it vectors along these two directions.
oblem 1: Evaluate to the nearest tenth ρ) and (Bz) for the following conditions propriate to a distance from the sun equal to rth's orbit using the following information:
= ρ2 + z2 K = 1.0
= 6.03 x 10+17 kilometers3 Q = 1.5
= 1.07 x 10+6 kilometers
ere z = -3.48 x 10⁷ kilometers ρ = 1.46 x 10⁸ kilometers.
Problem 2: Find the magnitude of the magnetic field strength using the values of the two computed components from Problem 1. Problem 3: Explain what effect |z| has on plotting the magnetic field.

9 Answer Key:
Space Math http://spacemath.gsfc.nasa.gov
For z = -3.48 x 10⁷ kilometers ρ = 1.46 x 10⁸ kilometers. Then r = 1.5 x 10⁸ kilometers………this equals the Earth-Sun orbital distance! 3 (1.46 x 10⁸)( -3.48 x 10⁷) 15 (1.5) (1.46 x 10⁸)( -3.48 x 10⁷) (4 (-3.48 x 10⁷)2 - 3 (1.46 x 10⁸)2) Bp/M = -------------------------------- + ---------- ---------------------------- ------------------------------------------ (1.5 x 10⁸)
5 8 (1.5 x 10⁸)
7 (1.5 x 10⁸)
2
1.0 1.46 x 10⁸
+ ------------ ----------------------------------------------------- 1.07 x 10+6 [ (3.48 x 10⁷+1.07 x 10+6 )
2 + (1.46 x 10⁸)
2 ]3/2
BBp = (6.03 x 10 ) ( - 2.0 x 10 + 2.3 x 10 + 4.0 x 10 ) = 2.4 x 10 Gauss +17 -25 -41 -23 -5
2(-3.48 x 10⁷)
2 - (1.46 x 10⁸)
2 3(1.5) [ 8(-3.48 x 10⁷)
4 + 3(1.5 x 10⁸)
4 - 24(1.46 x 10⁸)
2 (-3.48 x 10⁷)
2]
Bz/M = ------------------------------------------ + ------- ------------------------------------------------------------------------------------------
(1.5 x 10⁸)5
8 (1.5 x 10⁸)9
1.0 (3.48 x 10⁷ + 1.07 x 10⁶) + ----------------- ------------------------------------------------------------------------- (1.07 x 10+6 ) ( (3.48 x 10⁷ + 1.07 x 10⁶)
2 +(1.46 x 10⁸)
2 )3/2
Bz = (6.03 x 10+17) ( -2.5 x 10⁻²⁵
+ 1.1 x 10-41
+ 9.8 x 10⁻²⁴
) = 5.8 x 10⁻⁶ Gauss Problem 2: Use the Pythagorean Theorem to find B. B = 2.5 x 10⁻⁵ Gauss. Problem 3: If you plot the value of B on the z-r plane, it will be symmetric along the z axis, reflected through a line at z=0. This is demonstrated in the figure on the front page of this problem.

10 Parametric Functions and Substitution Error!
Our sun is an active star that ejects a constant stream of particles into space called the 'solar wind'. From time to time, magnetic activity on its surface also launches fast-moving clouds of plasma into space called 'coronal mass ejections' or CMEs. When some of these clouds directed at Earth arrive after traveling 93 million miles (150 million km), they cause intense disturbances in Earth's magnetic field. Since the 1800's, these disturbances have been called 'magnetic storms', because instruments on Earth can measure the strength of these disturbances, and they resemble storms in an otherwise very calm magnetic field. Scientists measure the strength of these magnetic storms in terms of the size of the change they make in the Earth's magnetic field. The strength of Earth's field at the ground is about 0.7 Gauss or 70,000 nanoTeslas. The most intense magnetic storms can change the ground-level field by several percent. Image courtesy Dick Hutchinson
According to research by V. Yurchyshyn, H. Wang and V. Abramenko, which was published in 2004 in the journal Space Weather (vol. 2) the relationship between the magnetic field disturbance, Dst and the Z-component of the interplanetary magnetic field, Bz, is given by:
(1) Dst = -2.846 + 6.54 Bz - 0.118Bz2 - 0.002Bz
3
where Dst and Bz are measured in nanoTeslas (nT). In 2004, W. D. Gonzales and his colleagues published a paper in the Journal of Atmospheric and Solar Terrestrial Physics, in which they determined a relation between the speed of a solar coronal mass ejection V, in km/sec, and the strength of Dst in nT according to
(2) Dst = 0.00052 x (0.22 V + 340)2
The relationship between the travel time to Earth from the sun and the speed of the CME was determined from catalogs of CME events by M. J. Owens and P. J. Cargill in research published in 2002 in the Journal of Geophysical Research (vol. 107, p. 1050) in terms of the transit time in days, T, for these coronal mass ejections and their speed, V, in km./sec by
(3) T = -0.0042 x V + 5.14 They also found that the maximum interplanetary magnetic field strength of the CME was given by
(4) BT = 0.047 V + 0.644
1) From the equation 2 and 3 above, find a function that gives Dst in terms of the transit time of the CME. Write the result in expanded form as a quadratic equation.
2) Assuming that Bz = BT / (2)1/2 use equations 1 and 4 to find a function that gives Dst in terms of V. 3) From equations 2 and 4, find a function that gives Dst in terms of BT.
Space Math http://spacemath.gsfc.nasa.gov

10 Answer Key:
(1) Dst = -2.846 + 6.54 Bz - 0.118Bz
2 - 0.002Bz3
(2) Dst = 0.00052 x (0.22 V + 340)2
(3) T = -0.0042 x V + 5.14
(4) BT = 0.047 V + 0.644
Problem 1: From the equation 2 and 3: Dst in terms of the transit time of the CME. Eqn 3: solve for V. V = (T - 5.14)/(-0.0042) = -238.1 T + 1223.8 Eqn 2: Substitute for V in terms of T: Dst = 0.00052 x (0.22 ( -238.1 T + 1223.8) + 340)2
= 0.00052 x ( 609.2 - 52.4 T )2
In expanded form: Dst = 1.4 T2 - 33.2 T + 193.0 in nT units
Problem 2: Assuming that Bz = BT / (2)1/2 use equations 1 and 4 and find Dst in terms of V. Eqn 4: Bz = BT / (2)1/2 = ( 0.047 V + 0.644 )/(2)1/2
= 0.033 V + 0.46 Substituting into Eq 1: Dst = -2.846 + 6.45 ( 0.033 V + 0.46 ) - 0.118 (0.033 V + 0.46 )2 - 0.002 (0.033 V + 0.46 )3
= ( -2.846 + 0.46*6.45 - 0.118*0.462 - 0.002* 0.463 ) + ( 6.45*0.033 -0.118*2*0.46*0.033 -0.002*3.0* 0.462*0.033) V + ( -0.002*3.0*0.46*0.0332 ) V2 -0.002 * 0.0333 V3
Dst = 0.096 + 0.21 V - 3.0 x 10⁻⁶ V2 - 7.2 x 10⁻⁸ V3
Problem 3: From equations 2 and 4, find a function that gives Dst in terms of BT. Eq 4: Solve for V V = (BBT - 0.644)/0.047 = 21.3 BT - 13.7 Substitute into Eqn 1 : Dst = 0.00052 x (0.22 (21.3 BT - 13.7 ) + 340)2
= 0.00052 ( 4.7 BBT + 337)2
Expanded: Dst = 0.011 BT2 + 1.65 BT + 59.1 in nT units
Space Math http://spacemath.gsfc.nasa.gov

11 Radon Gas in the Basement: A Radiation Hazard
Most family rooms (dens) are located in the basements of homes across the country. This is also the place where radon gas can collect over time. When inhaled over time, radon gas adds to your lifetime natural background radiation exposure, and is a significant risk factor for various forms of lung and respiratory cancer. This is why in many states, home buyers must have prospective homes tested before purchase. The typical, annual radiation exposure from all non-radon forms of natural exposure is about 200 milliRem per year. The above figure shows the four radon zones based on a study by the US Environmental Protection Agency (http://www.epa.gov/radon/zonemap.html). By the way, you can also find maps for individual states at this website. The four zones correspond to radiation dosages of Zone 1: 4 picoCuries/liter Zone 2: 3 picoCuries/liter Zone 3: 2 picoCuries/Liter. Note: 4 picoCuries/liter for a full-year exposure is equal to about 3 Rems. Problem 1: A typical family may only spend 4 hours a day in the basement room. What fraction of a full year does this represent? Problem 2: In Zone-1, a full years exposure equals 3 Rem. From your answer to Problem 1, what would you predict as the total annual dosage, in milliRems, for a member of this family if they were living in A) Zone-1? B) Zone-2? C) Zone-3? Problem 3: If a typical lifetime is 80 years, what would be the total lifetime radiation dosage from radon in Rem for the family members in Problem 1 if they lived in A) Zone-1; B) Zone-2; C) Zone-3?
Space Math http://spacemath.gsfc.nasa.gov

11 Answer Key: Problem 1: A typical family may only spend 4 hours a day in the basement room. What fraction of a full year does this represent? Answer: ( 4 / 24 ) = 1/6th of a year Problem 2: In Zone-1, a full years exposure equals 3 Rem. From your answer to Problem 1, what would you predict as the total annual dosage, in milliRems, for a member of this family if they were living in: A) Zone-1? Answer: 3 Rem/year x 1/6 year = 1/2 Rem = 500 millirem B) Zone-2? Answer: 3/4 x 3 Rem/year x 1/6 year = 3/8 Rem = 375 milliRem C) Zone-3? Answer: 2/4 x 3 Rem/yr x 1/6 year = 1/4 Rem = 250 milliRem Problem 3: If a typical lifetime is 80 years, what would be the total lifetime radiation dosdage from radon in Rem for the family members in Problem 1 if they lived in A) Zone-1; Answer = 80 x 1/2 Rem = 40 Rem B) Zone-2; Answer = 80 x 3/8 Rem = 30 Rem C) Zone-3? Answer = 80 x 1/4 Rem = 20 Rem.
Space Math http://spacemath.gsfc.nasa.gov
12 Some Puzzling Thoughts about Space Radiation
We have all heard, since grade school, that 1___________ affects living systems by causing cell mutations. The particles such as fast-moving ions or 2____________ strike particular locations in the 3_________ of a cell, causing the cell to malfunction, or 4______________ and pass-on a 5______________ to its progeny. Sometimes the mutations are not beneficial to an organism, or to the evolution of its species. When this happens you can get 6_______________. Cancer risks are generally related to the total amount of lifetime radiation exposure. The studies of 7________________ survivors, however, still show that there is much we have to learn about just how radiation delivers its harmful impact. Very large 8______________ over a short period of time seem not to have quite the deleterious affect that, say, a small dosage delivered steadily over many years does. The National Academy of Sciences has looked into this issue rather carefully over the years to find a relationship between 9________________ cancer risks and low-level radiation exposure. What they concluded was that you get up to 100 cancers per 100,000 people for every 1000 10_____________ of additional dosage per year above the natural 11_______________ rate. If a dosage of 1000 millirems extra radiation per year, adds 100 extra deaths per 100,000, then as little as one extra millirem per annum could cause cancer in one person per 12_______________. Although it's just a 13_________________ estimate, if you happen to be that 'one person' you will be understandably 14_________________. No scientific study, by the way, has shown that radiation has such a 15________________impact at all levels below 100 millirem, but that's what the 16________________ application of arithmetic shows. Government safety regulations now require that people who work with radiation, such as 17__________, nuclear medicine technologists, or nuclear power plant operators, are given a maximum permissible dose limit of 500 millirems per year above the prevailing 18_____________ background rate. For you and me doing ordinary work in the office, factory or store, the acceptable maximum dose is 1000 milliRems/year above the 350 milliRem you get each year from natural sources. As a comparison, if you lived within 20 miles of the 19__________ nuclear power 20_____________ at the time of its 21_________ meltdown, your annual dose would have been about 1500 milliRem/year during the first year, declining slowly as the radioactive 22_____________ in the environment decay (Excerpted from 'The 23rd Cycle", Sten Odenwald, Columbia University Press)
Space Math http://spacemath.gsfc.nasa.gov
Solve for X in each equation, and select the correct word from the pair of solutions for X, to fill-in the indicated blanks from 1 to 22 in the essay above. 1) x2 - 2x - 3 = 0 12) x2 - 3x - 88 = 0 2) x2 + 4x - 5 = 0 13) x2 - 4x - 21 = 0 3) x2 - 3x + 2 = 0 14) x2 - x - 30 = 0 4) x2 - x - 12 = 0 15) x2 - 9x - 36 = 0 5) 2x2 - 12x + 10 = 0 16) x2 - 16x + 63 = 0 6) x2 - 2x - 24 = 0 17) x2 + 16x + 63 = 0 7) x2 + 5x + 6 = 0 18) x2 + 14x + 48 = 0 8) x2 - 9 = 0 19) x2 + 19x + 90 = 0 9) 2x2 + 4x - 30 = 0 20) x2 + 8x - 33 = 0 10) 3x2 + 3x - 6 = 0 21) x2 - 100 = 0 11) x2 - 6x - 16 = 0 22) x2 - 8x = 0 Word bank - factor list -11 plant -4 cancer 3 lifetime 10 1986 -10 2005 -3 dosages 4 survive 11 hundred -9 Chernobyl -2 Hiroshima 5 mutation 12 linear -8 million -1 radiation 6 upset -7 dentists 0 isotopes 7 statistical -6 natural 1 milliRems 8 background -5 neutrons 2 DNA 9 blind

12
1) (x - 3) (x + 1) 3, -1 radiation 12) (x + 8) (x - 11) -8, 11 million 2) (x + 5 ) (x - 1) -5, 1 neutrons 13) (x - 7) (x+3) 7, -3 statistical 3) (x - 2 ) (x - 1) 2, 1 DNA 14) (x - 6) (x + 5) -5, 6 upset 4) (x - 4) (x + 3) 4 ,-3 survive 15) (x - 12 ) (x + 3) 12, -3 linear 5) (2x - 2) (x - 5) 1 , 5 mutation 16) (x - 7) (x - 9) 7, 9 blind 6) (x - 6) (x + 4) 6, -4 cancer 17) (x + 7) (x + 9) -7, -9 dentists 7) (x + 2) (x + 3) -2, -3 Hiroshima 18) (x + 6) (x + 8) -6, -8 natural 8) (x + 3) (x - 3) -3, 3 dosages 19) (x + 10) (x + 9) -10, -9 Chernobyl 9) (2x - 6) (x + 5) 3, -5 lifetime 20) (x + 11) (x - 3) -11, 3 plant 10) (3x + 6) (x - 1) 2, 1 milliRems 21) (x + 10) (x - 10) -10, 10 1986 11) (x - 8) (x + 2) 8, -2 background 22) x ( x - 8) 0, 8 isotopes Word bank - factor list -11 plant 12 linear -10 2005 11 hundred -9 Chernobyl 10 1986 -8 million 9 blind -7 dentists 8 background -6 natural 7 statistical -5 neutrons 6 upset -4 cancer 5 mutation -3 dosages 4 survive -2 Hiroshima 3 lifetime -1 radiation 2 DNA 0 isotopes 1 milliRems
Here are the correct words added: We have all heard, since grade school, that 1-radiation affects living systems by causing cell mutations. The particles such as fast-moving ions or 2-neutrons strike particular locations in the 3-DNA of a cell, causing the cell to malfunction, or 4-survive and pass-on a 5-mutation to its progeny. Sometimes the mutations are not beneficial to an organism, or to the evolution of its species. When this happens you can get 6-cancer. Cancer risks are generally related to the total amount of lifetime radiation exposure. The studies of 7-Hiroshima survivors, however, still show that there is much we have to learn about just how radiation delivers its harmful impact. Very large 8-dosages over a short period of time seem not to have quite the deleterious affect that, say, a small dosage delivered steadily over many years does. The National Academy of Sciences has looked into this issue rather carefully over the years to find a relationship between 9-lifetime cancer risks and low-level radiation exposure. What they concluded was that you get up to 100 cancers per 100,000 people for every 1000 10-millirems of additional dosage per year above the natural 11-background rate. If a dosage of 1000 millirems extra radiation per year, adds 100 extra deaths per 100,000, then as little as one extra millirem per annum could cause cancer in one person per 12-million. Although it's just a 13-statistical estimate, if you happen to be that 'one person' you will be understandably 14-upset. No scientific study, by the way, has shown that radiation has such a 15-linear impact at all levels below 100 millirem, but that's what the 16-blind application of arithmetic shows. Government safety regulations now require that people who work with radiation, such as 17-dentists, nuclear medicine technologists, or nuclear power plant operators, are given a maximum permissible dose limit of 500 millirems per year above the prevailing 18-natural background rate. For you and me doing ordinary work in the office, factory or store, the acceptable maximum dose is 1000 milliRems/year above the 350 milliRem you get each year from natural sources. As a comparison, if you lived within 20 miles of the 19-Chernobyl nuclear power 20-plant at the time of its 21-1986 meltdown, your annual dose would have been about 1500 milliRem/year during the first year, declining slowly as the radioactive 22-isotopes in the environment decay away. (Excerpted from 'The 23rd Cycle", Sten Odenwald, Columbia University Press)
Space Math http://spacemath.gsfc.nasa.gov

13 Moving Magnetic Filaments Near Sunspots
These two images were taken by the Hinode (Solar-B) solar observatory on October 30, 2006. The size of each image is 34,300 km on a side. The clock face shows the time when each image was taken, and represents the face of an ordinary 12-hour clock. 1) What is the scale of each image in kilometers per millimeter? 2) What is the elapsed time between each image in; A) hours and minutes? B) decimal hours? C) seconds? Carefully study each image and look for at least 5 features that have changed their location between the two images. (Hint, use the nearest edge of the image as a reference). 3) What direction are they moving relative to the sunspot? 4) How far, in millimeters have they traveled on the image? 5) From your answers to questions 1, 2 and 4, calculate their speed in kilometers per second, and kilometers per hour. 6) A fast passenger jet plane travels at 600 miles per hour. The Space Shuttle travels 28,000 miles per hour. If 1.0 kilometer = 0.64 miles, how fast do these two craft travel in kilometers per second? 7) Can the Space Shuttle out-race any of the features you identified in the sunspot image?
Space Math http://spacemath.gsfc.nasa.gov

13 Answer Key:
Space Math http://spacemath.gsfc.nasa.gov
These two images were taken by the Hinode (Solar-B) solar observatory on October 30, 2006. The size of each image is 34,300 km on a side. The clock face shows the time when each image was taken. 1) What is the scale of each image in kilometers per millimeter? Answer: The pictures are 75 mm on a side, so the scale is 34,300 km /75mm = 457 km/mm 2) What is the elapsed time between each image in; A) hours and minutes? About 1 hour and 20 minutes. B) decimal hours? About 1.3 hours C) seconds? About 1.3 hours x 3600 seconds/hour = 4700 seconds Carefully study each image and look for at least 5 features that have changed their location between the two images. (Hint, use the nearest edge of the image as a reference). Students may also use transparent paper or film, overlay the paper on each image, and mark the locations carefully. The above picture shows one feature as an example. 3) What direction are they moving relative to the sunspot? Answer: Most of the features seem to be moving away from the sunspot. 4) How far, in millimeters have they traveled on the image? Answer: The feature in the above image has moved about 2 millimeters. 5) From your answers to questions 1, 2 and 4, calculate their speed in kilometers per second, and kilometers per hour. Answer: 2 mm x 457 km/mm = 914 kilometers in 4700 seconds = 0.2 kilometers/sec or 703 kilometers/hour. 6) A fast passenger jet plane travels at 600 miles per hour. The Space Shuttle travels 28,000 miles per hour. If 1.0 kilometer = 0.64 miles, how fast do these two craft travel in kilometers per second? Jet speed = 600 miles/hr x ( 1 / 3600 sec/hr) x (1 km/0.64 miles) = 0.26 km/sec. Shuttle = 28,000 x (1/3600) x (1/0.64) = 12.2 km/sec. 7) Can the Space Shuttle out-race any of the features you identified in the sunspot image? Answer: Yes, in fact a passenger plane can probably keep up with the feature in the example above! 8) Are the features moving at increasing speed away from the sunspot, or traveling at a constant speed?

14 Correcting Bad Data Using Parity Bits
Data is sent as a string of ‘1’s and ‘0’s which are then converted into useful numbers by computer programs. A common application is in digital imaging. Each pixel is represented as a ‘data word’ and the image is recovered by relating the value of the data word to an intensity or a particular color. In the sample image to the left, red is represented by the data word ‘10110011’, green is represented by ‘11100101’ and yellow by the word ‘00111000’, so the first three pixels would be transmitted as the ‘three word’ string ‘101100111110010100111000’. But what if one of those 1-s or 0-s was accidentally reversed? You would get a garbled string and an error in the color used in a particular pixel. Since the beginning of the Computer Era, engineers have anticipated this problem by adding a ‘parity bit’ to each data word. The bit is ‘1’ if there are an even number of 1’s in the word, and’ 0’ if there is an odd number. In the data word for red ‘10110011’ the last ‘1’ to the right is the parity bit.
The first few pixels in a large image
Space Math http://spacemath.gsfc.nasa.gov
When data is produced in space, it is protected by parity bits, which alert the scientists that a particular data word may have been corrupted by a cosmic ray accidentally altering one of the data bits in the word. For example, Data Word A ‘11100011’ is valid but Data Word B ‘11110011’ is not. There are five ‘1’s but instead of the parity bit being ‘0’ (‘11100010’ ), it is ‘1’ which means Data Word B had one extra ‘1’ added somewhere. One way to recover the good data is to simply re-transmit data words several times and fill-in the bad data words with the good words from one of the other transmissions. For example: Corrupted data string: 10111100 1011010 10101011 00110011 10111010 Good data string: 10111100 1001010 10101011 10110011 10111010 The second and fourth words have been corrupted, but because the string was re-transmitted twice, we were able to ‘flag’ the bad word and replace it with a good word with the correct parity bit. Cosmic rays often cause bad data in hundreds of data words in each picture, but because pictures are re-transmitted two or three times, the bad data can be eliminated and a corrected image created. Problem: Below are two data strings that have been corrupted by cosmic ray glitches. Look through the data (a process called parsing) and use the right-most parity bit to identify all the bad data. Create a valid data string that has been ‘de-glitched’. String 1: 10111010 11110101 10111100 11001011 00101101 01010000 01111010 10001100 00110111 00100110 01111000 11001101 10110111 11011010 11100001 10001010 10001111 01110011 10010011 11001011 String 2: 10111010 01110101 10111100 11011011 10101101 01011010 01111010 10001000 10110111 00100110 11011000 11001101 10110101 11011010 11110001 10001010 10011111 01110011 10010001 11001011

14 Answer Key:
Problem: Below are two data strings that have been corrupted by cosmic ray glitches. Look through the data (a process called parsing) and use the right-most parity bit to identify all the bad data. Create a valid data string that has been ‘de-glitched’. The highlighted data words are the corrupted ones. String 1: 10111010 11110101 10111100 11001011 00101101 01010000 01111010 10001100 00110111 00100110 01111000 11001101 10110111 11011010 11100001 10001010 10001111 01110011 10010011 11001011 String 2: 10111010 01110101 10111100 11011011 10101101 01011010 01111010 10001000 10110111 10100110 11011000 11001101 10110101 11011010 11110001 10001010 10011111 01110011 10010001 01001011
In the first string, 11110101 has a parity bit of ‘1’ but it has an odd number of ‘1’ so its parity should have been ‘0’ if it were a valid word. Looking at the second string, we see that the word that appears at this location in the grid is ‘01110101’ which has the correct parity bit. We can see that a glitch has changed the first ‘1’ in String 2 to a ‘0’ in the incorrect String 1. By replacing the highlighted, corrupted data words with the uncorrupted values in the other string, we get the following de-glitched data words:
Corrected: 10111010 01110101 10111100 11001011 10101101 01011010 01111010 10001100 00110111 00100110 11011000 11001101 10110101 11011010 11110001 10001010 10001111 01110011 10010001 11001011 The odd word is the first word in the third row. The first transmission says that it is ‘01111000’ and the second transmission says it is ‘11011000’ Both wrong words have a parity of ‘1’ which means there is an even number of ‘1’ in the first seven places in the data word. But the received parity bit says ‘0’ which means there was supposed to be an odd number of ‘1’s in the correct word. Examining these two words, we see that the first three digits are ‘011’ and ‘110’ so it looks like the first and third digits have been altered. Unfortunately, we can’t tell what the correct string should have been. Because the rest of the word ‘11000’ has an even parity, all we can tell about the first three digits is that they had an odd number of ‘1’s so that the total parity of the complete word is ‘0’ . This means the correct digits could have been ‘100’, ‘010’, ‘111’, or ‘111’, but we can’t tell which of the three is the right one. That means that this data word remains damaged and can’t be de-glitched even after the second transmission of the data strings.
Space Math http://spacemath.gsfc.nasa.gov

15 Data Corruption by High-Energy Particles
Solar flares can severely affect sensitive instruments in space and corrupt the data that they produce. On July 14, 2000 the sun produced a powerful X-class flare, which was captured by instruments onboard the Solar and Heliospheric Observatory (SOHO). The EIT imager operating at a wavelength of 195 Angstroms, showed a brilliant flash of light (left image). When these particles arrived at the SOHO satellite some time later, they caused the imaging equipment to develop ‘snow’ as the individual particles streaked through the sensitive electronic equipment. The above images taken by the SOHO LASCO c2 and c3 imagers show what happened to that instrument when this shower of particles arrived. The date and time information (hr : min) is given in the lower left corner of each image, and give the approximate times of the events.
Problem 1: At about what time did the solar flare first erupt on the sun? Problem 2: At about what time did the LASCO imagers begin to show significant signs of the particles having
arrived? Problem 3: If the SOHO satellite was located 147 million kilometers from the sun, about what was the speed of
the arriving particles? Problem 4: If the speed of light is 300,000 km/sec, what percentage of light-speed were the particles traveling?
Weekly Math Problems http://spacemath.gsfc.nasa.gov

15 Answer Key:
Problem 1: At about what time did the solar flare first erupt on the sun? Answer: The EIT image time says 10:24 or 10 hours and 24 minutes Universal Time The reason this is not an exact time is because the images were taken at set times, and not at the exact times of the start or end of the events. To within the 24-minute interval between successive EIT images, we will assume that 10:24 UT is the closest time. Problem 2: At about what time did the LASCO imagers begin to show significant signs of the particles having arrived? Answer: The top sequence shows that the ‘snow began to fall’ at 10:54 UT. The second sequence suggests a later time near 11:18. However, the 11:18 time is later than the 10:54 time. The time interval between exposures is 24 minutes, but the top series started at 10:30 and ended at 10:54 UT, while the lower series started at 10:42 and ended at 11:18. That means, comparing the exposures between the two series, the snow arrived between 10:42 and 10:54 UT. We can split the difference and assume that the snow began around 10:48 UT. Problem 3: If the SOHO satellite was located 147 million kilometers from the sun, about what was the
speed of the arriving particles?
Answer: The elapsed time between the sighting of the flare by EIT (10:24 UT) and the beginning of the snow seen by LASCO (10:48 UT) is 10:48 UT – 10:24 UT = 24 minutes. The speed of the particles was about 147 million km/24 minutes or 6.1 million km/minute. Problem 4: If the speed of light is 300,000 km/sec, what percentage of light-speed were the particles traveling? Answer: Converting 6.1 million km/minute into km/sec we get 6,100,000 km/sec x (1 min /60 sec) or 102,000 kilometers/sec. Comparing this to the speed of light we see that the particles traveled at (102,000/300,000)x100% = 34% the speed of light! Note: Because these damaging high-speed particles can arrive only a half-hour after the x-ray flash is first seen on the sun, it can be very difficult to protect sensitive equipment from these storms of particles if you wait for the first sighting of the solar flare flash. In some cases, science research satellites have actually been permanently damaged by these particle storms.
Weekly Math Problems http://spacemath.gsfc.nasa.gov

16 The Pressure of a Solar Storm
The ACE satellite measures the density and speed of the solar wind as it approaches Earth, and also measures the strength of its magnetic field. Both the magnetic field, and the kinetic energy of the particles, cause a build-up of pressure acting upon Earth’s magnetic field. This forces Earth’s magnetic field closer to the planet’s surface, and can expose satellites orbiting Earth to the potentially harmful effects of cosmic rays and other high-energy particles. Based on actual data from the ACE satellite, in this problem you will calculate the particle and magnetic pressure and determine the distance from Earth of the pressure equilibrium region of the magnetic field, called the magnetopause. Image (left) courtesy: http://www.tecplot.com/showcase/studies/2001/michigan.htm
Magnetopause Distance:
Ram Pressure: Magnetic Pressure: 12 1.8 x 10
6 R = ---------------------
-8 2 Pr = 1.6 x 10 N V
-6 2 Pm = 4.0 x 10 B
2 N V
V – gas speed in km/sec, R – magnetopause distance in Re
N - gas density in particles/cc V - gas speed in km/sec
B – Cloud’s field strength in nanoTeslas (nT) Pm – magnetic pressure in microErgs/cc
N – gas density in particles/cc Pr – ram pressure in microErgs/cc
Problem 1: Use the formulae and the values cited in the table to complete the last three columns. A few cases have been computed as examples. Problem 2: A geosynchronous communications satellite is orbiting at a distance of 6.6 Re (1 Re = 1 Earth radius= 6,378 km). For which storms will the satellite be directly affected by the solar storm particles? Problem 3: Within each storm event, which pressure is the strongest, ram pressure or magnetic pressure?
Date Flare N (particle/cc)
V (km/s)
B (nT)
Pr Pm Distance (Re)
9-7-2005 X-17 50 2500 50 5.0 0.01 4.2 7-13-2005 X-14 30 2000 20 1-16-2005 X-2.8 70 3700 70 10-28-2003 X-17 100 2700 70 11-4-2003 X-28 80 2300 49 6.8 0.01 4.0 4-21-2002 X-1.5 20 2421 10 7-23-2002 X-4.8 40 1200 15 4-6-2001 X-5.6 20 1184 20 7-14-2000 X-5.7 30 2300 60 11-24-2000 X-1.8 50 2000 10 3.2 0.0004 4.6 8-24-1998 X-1 15 1500 10 Note: Density and magnetic field strength are estimates for purposes of this calculation only.
Space Math http://spacemath.gsfc.nasa.gov

16 Answer Key:
Date Flare N (particle/cc)
V (km/s)
B (nT)
Pr Pm Distance (Re)
9-7-2005 X-17 50 2500 50 5.0 0.01 4.2 7-13-2005 X-14 30 2000 20 1.9 0.002 5.0 1-16-2005 X-2.8 70 3700 70 15.3 0.02 3.5 10-28-2003 X-17 100 2700 70 11.7 0.02 3.7 11-4-2003 X-28 80 2300 49 6.8 0.01 4.0 4-21-2002 X-1.5 20 2421 10 1.9 0.0004 5.0 7-23-2002 X-4.8 40 1200 15 0.9 0.0009 5.6 4-6-2001 X-5.6 20 1184 20 0.4 0.002 6.3 7-14-2000 X-5.7 30 2300 60 2.5 0.01 4.7 11-24-2000 X-1.8 50 2000 10 3.2 0.0004 4.6 8-24-1998 X-1 15 1500 10 0.5 0.0004 6.1 Note: Density and magnetic field strength are estimates for purposes of this calculation only.
Problem 1: Use the formulae and the values cited in the table to complete the last three columns. Answer: See above shaded table entries. This is a good opportunity to use an Excel spreadsheet to set up the calculations. This also lets students change the entries to see how the relationships change, as an aid to answering the remaining questions. Problem 2: A geosynchronous communications satellite is orbiting at a distance of 6.6 Re. For which storms will the satellite be directly affected by the solar storm particles? Answer: All of the storms except for the ones on April 6, 2001 and August 24, 1998 Problem 3: Within each storm event, which pressure is the strongest, ram pressure or magnetic pressure? Answer: The values for the ram pressure (Pr) are all substantially larger than the values for the
magnetic pressure (Pm), so we conclude that ram pressure is stronger than the cloud’s magnetic pressure. This means that when the clouds impacts another object, such as Earth, it is mostly the ram pressure of the cloud that determines the outcome of the interaction.
Note to Teacher: Ram pressure is the pressure produced by a cloud of particles traveling at a particular speed with a particular density. We call this a ‘ram’ pressure because it is also the pressure that you feel as you ‘ram’ your way through the air when you are in motion. Because only the relative speed is important, you will feel the same pressure if you are ‘stationary’ and a gas is moving past you at a particular speed, or if the gas is ‘stationary’ and you are trying to move through it at the same speed. Technically, ram pressure is the product of the gas density and the square of this relative speed.
Space Math http://spacemath.gsfc.nasa.gov

17 Are U Nuts?
Converting from one set of units to another is something that scientists do every day. We have made this easier by adopting metric units wherever possible, and re-defining our standard units of measure so that they are compatible with the new metric units wherever possible. In the western world, certain older units have been replaced by the modern ones, which are now adopted the world over. (see Wikipedia under 'English Units' for more examples). In this exercise, you will convert from… Conversion Table: 4 Gallons = 1 Bucket 142.065 cubic cm = 1 Noggin 9 Gallons = 1 Firkin 1.296 grams = 1 Scruple 126 Gallons = 1 Butt 201.168 meters = 1 Furlong 34.07 Liters = 1 Firkin 14 days = 1 Fortnight 0.0685 Slugs = 1 Kilogram 0.2 grams = 1 Carat
1) A typical aquarium holds 25 gallons of water. Convert this to A) Firkins; B) Liters, and C) Buckets. 2) John weighs 7.2 Slugs, and Mary weighs 53 kilograms. Who weighs the most kilograms? 3) The passenger volume of a car is about 5.4 cubic meters. How many Noggins can fit inside the car? 4) Sven weighs 105 kilograms and finished a diet of pickled herring, losing 3.8 kilograms. A) How many Scruples did he lose? B) How many Scruples did he start out with? 5) The density of water is 1.0 grams/cm3. How many Scruples per Noggin is this? 6) Evelyn finished the Diamond Man Marathon by walking 400 kilometers in 18 days. What was her average speed in Furlongs per Fortnight? 7) A swimming pool holds 50,000 gallons of water. How many Butts were in the pool? 8) If a Fathom is 72 inches, and there are 2.5 centimeters per inch, how many kilometers are there in 3.6 Leagues if 1 League = 2640 Fathoms? 9) The original Cullinan Diamond was discovered in 1904 and weighs 3,106.75 Carats. A) How many grams is this? B) The polished Cullinan Diamond I (Great Star of Africa) weighs 530.2 Carats and is worth $386 million. What is the approximate worth of the original Cullinan Diamond? C) What is the going rate for diamonds in terms of dollars per Carat? D) Dollars per gram?
Space Math http://spacemath.gsfc.nasa.gov

17Answer Key: Conversion Table: 4 Gallons = 1 Bucket 142.065 cubic centimeters = 1 Noggin 9 Gallons = 1 Firkin 1.296 grams = 1 Scruple 126 Gallons = 1 Butt 201.168 meters = 1 Furlong 34.07 Liters = 1 Firkin 14 days = 1 Fortnight 0.0685 Slugs = 1 Kilogram 200 milligrams = 1 Carat
1) A typical aquarium holds 25 gallons of water. Convert this to A) Firkins; 25 Gallons x (1 Firkin/9 Gallons) = 2.8 Firkins B) Liters, and 2.8 Firkins x (34.07 Liters/ 1 Firkin) = 95.4 Liters C) Buckets. 25 Gallons x (1 Bucket/4 gallons) = 6.3 Buckets. 2) John weighs 7.2 Slugs, and Mary weighs 53 kilograms. Who weighs the most kilograms? John = = 7.2 Slugs x (1 kg/0.0685 Slugs) = 105 kg so John weighs the most kilograms. 3) The passenger volume of a car is about 5.4 cubic meters. How many Noggins can fit inside the car? 5.4 cubic meters x (1,000,000 cubic cm/1 cubic meter) x( 1 Noggin/142.065 cubic cm) = 38,028 Noggins! 4) Sven weighs 105 kilograms and finished a diet of pickled herring, losing 3.8 kilograms. A) How many Scruples did he lose? 3.8 kg x (1,000 gm/ 1kg) x (1 Scruple/1.296 grams) = 2,932 Scruples. B) How many Scruples did he start out with? 105 kg x( 1,000 gm/1 kg) x 1 Scruple/1.296 grams) = 81,018 Scruples 5) The density of water is 1.0 grams per cubic centimeter. How many Scruples per Noggin is this? 1 gram x (1 Scruple/1.296 grams) = 0.771 Scruples. 1 cubic centimeter x ( 1 Noggin/142.065 cubic cm) = 0.007 Noggins. Dividing the two you get 0.771 Scruples/0.007 Noggins = 110 Scruples/Noggin. 6) Evelyn finished the Diamond Man Marathon by walking 400 kilometers in 18 days. What was her average speed in Furlongs per Fortnight? 400 kilometers x (1,000 meters/ 1 km) x ( 1 Furlong/201 meters) = 1,990 Furlongs. 18 days x (1 Fortnight/14 days) = 1.28 Fortnights. Dividing the two you get 1,990 Furlongs/1.28 Fortnights = 1,555 Furlongs per fortnihght. 7) A swimming pool holds 50,000 gallons of water. How many Butts were in the pool? 50,000 gallons x ( 1 Butt / 126 gallons) = 397 Butts. 8) If a Fathom is 72 inches, and there are 2.5 centimeters per inch, how many kilometers are there in 3.6 Leagues if 1 League = 2640 Fathoms? 3.6 Leagues x ( 2640 Fathoms/ 1 League) x ( 72 Inches / 1 Fathom) = 684,288 inches. 684,288 inches x (2.5 cm/1 inch) x (1 meter/100 cm) x (1 kilometer/1000 meters) = 17.1 kilometers. 9) The original Cullinan Diamond was discovered in 1904 and weighs 3,106.75 Carats. A) How many grams is this? 3,106.75 carats x ( 0.2 grams / 1 carat) = 621.2 grams. B) The polished Cullinan Diamond I (Great Star of Africa) weighs 530.2 Carats and is worth $386 million. What is the approximate worth of the original Cullinan Diamond? 386 million dollars x ( 3106.75 carats / 530.2 carats ) = $2.26 billion. C) What is the going rate for diamonds in terms of dollars per Carat? 386 million dollars / 530.2 carats = $728,027 per carat. D) Dollars per gram? 728,027 dollars / carat x ( 1 carat / 0.2 grams) = $ 3.6 million / gram.
Space Math http://spacemath.gsfc.nasa.gov
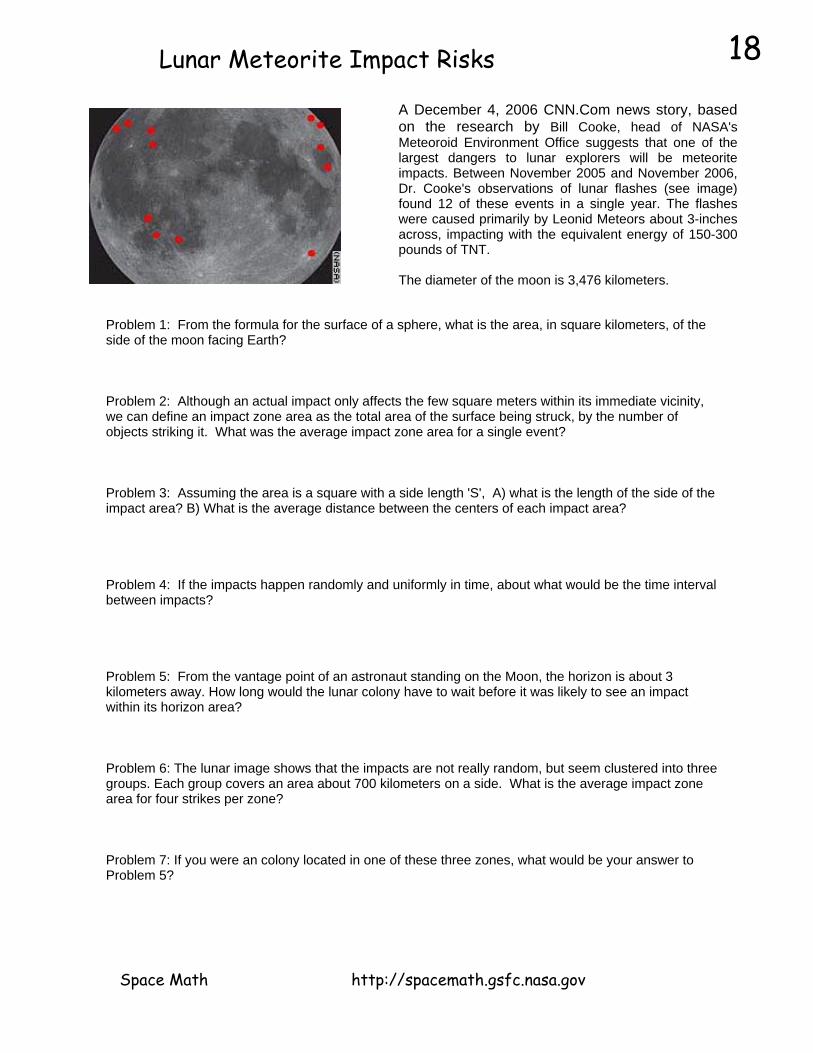
18 Lunar Meteorite Impact Risks
A December 4, 2006 CNN.Com news story, based on the research by Bill Cooke, head of NASA's Meteoroid Environment Office suggests that one of the largest dangers to lunar explorers will be meteorite impacts. Between November 2005 and November 2006, Dr. Cooke's observations of lunar flashes (see image) found 12 of these events in a single year. The flashes were caused primarily by Leonid Meteors about 3-inches across, impacting with the equivalent energy of 150-300 pounds of TNT. The diameter of the moon is 3,476 kilometers.
Problem 1: From the formula for the surface of a sphere, what is the area, in square kilometers, of the side of the moon facing Earth? Problem 2: Although an actual impact only affects the few square meters within its immediate vicinity, we can define an impact zone area as the total area of the surface being struck, by the number of objects striking it. What was the average impact zone area for a single event? Problem 3: Assuming the area is a square with a side length 'S', A) what is the length of the side of the impact area? B) What is the average distance between the centers of each impact area? Problem 4: If the impacts happen randomly and uniformly in time, about what would be the time interval between impacts? Problem 5: From the vantage point of an astronaut standing on the Moon, the horizon is about 3 kilometers away. How long would the lunar colony have to wait before it was likely to see an impact within its horizon area? Problem 6: The lunar image shows that the impacts are not really random, but seem clustered into three groups. Each group covers an area about 700 kilometers on a side. What is the average impact zone area for four strikes per zone? Problem 7: If you were an colony located in one of these three zones, what would be your answer to Problem 5?
Space Math http://spacemath.gsfc.nasa.gov

18 Answer Key:
Problem 1: From the formula for the surface of a sphere, A) what is the area, in square kilometers, of the side of the moon facing Earth? Answer: 2 x 3.141 x (1738 km)2 = 1.89 x 10⁷ km2 Problem 2: Answer: 1.89 x 10⁷ km2 /12 = 1.58 x 10⁶ km2 Problem 3: Assuming the area is a square with a side length 'S', A) what is the length of the side of the impact area? B) What is the average distance between the centers of each impact area? Answer: A) S = (1.58 x 10⁶ km2)1/2 about 1,257 kilometers B) 1,257 kilometers. Problem 4: If the impacts happen randomly and uniformly in time, about what would be the time interval between impacts? Answer: 1 year / 12 impacts = One month. Problem 5: From the vantage point of an astronaut standing on the Moon, the horizon is about 3 kilometers away. How long would the lunar colony have to wait before it was likely to see an impact within its horizon area? Answer: 1 impact per 1.58 x 10⁶ square kilometers per month. The area of the horizon region around the colony is about π x (3km)2 = 27 square kilometers. This area is 1.58 x 10⁶ km2 /27 km2 or about 60,000 times smaller that the average, monthly impact area. That suggests you will have to wait about 60,000 times longer than the time it takes for one impact or 60,000 months, which equals 5,000 years, assuming that the distribution of impacts is completely random, unbiased and has a uniform geographic distribution across the Moon's surface. Problem 6: Answer: (700 km) x (700 km) / 4 = 1 impact per 122,500 km2 zone area. Horizon area = 27 km2, so the impact zone area is 122,500 / 27 = 4,500 times larger. You would need to wait about 4,500 x 1 month or 375 years for an impact to happen within your horizon. Note to Teacher: This calculation assumes that the clustering of impacts is a real effect that persists over a long time. In fact, this is very unlikely, and it is more statistically probable that when thousands of impacts are plotted, a more uniform strike distribution will result. This is similar to the result of flipping a coin 12 times and getting a different outcome than half-Heads and half-Tails.
Space Math http://spacemath.gsfc.nasa.gov
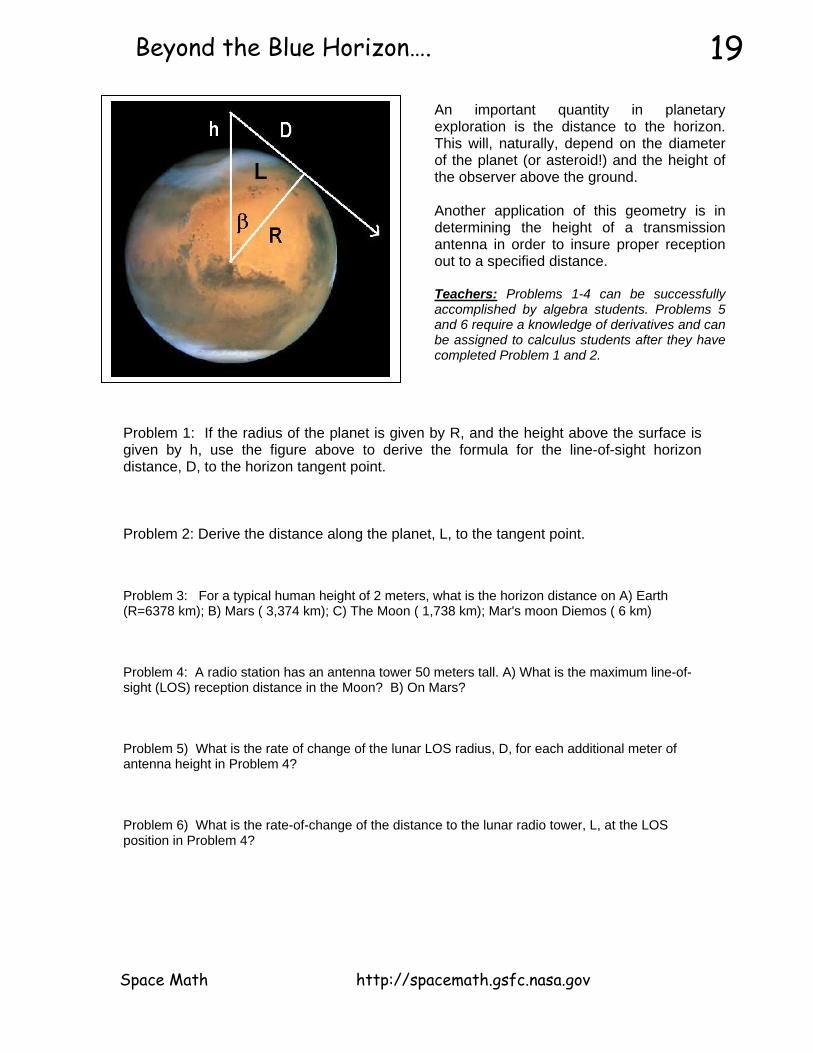
19 Beyond the Blue Horizon….
An important quantity in planetary exploration is the distance to the horizon. This will, naturally, depend on the diameter of the planet (or asteroid!) and the height of the observer above the ground. Another application of this geometry is in determining the height of a transmission antenna in order to insure proper reception out to a specified distance. Teachers: Problems 1-4 can be successfully accomplished by algebra students. Problems 5 and 6 require a knowledge of derivatives and can be assigned to calculus students after they have completed Problem 1 and 2.
Problem 1: If the radius of the planet is given by R, and the height above the surface is given by h, use the figure above to derive the formula for the line-of-sight horizon distance, D, to the horizon tangent point. Problem 2: Derive the distance along the planet, L, to the tangent point. Problem 3: For a typical human height of 2 meters, what is the horizon distance on A) Earth (R=6378 km); B) Mars ( 3,374 km); C) The Moon ( 1,738 km); Mar's moon Diemos ( 6 km) Problem 4: A radio station has an antenna tower 50 meters tall. A) What is the maximum line-of-sight (LOS) reception distance in the Moon? B) On Mars? Problem 5) What is the rate of change of the lunar LOS radius, D, for each additional meter of antenna height in Problem 4? Problem 6) What is the rate-of-change of the distance to the lunar radio tower, L, at the LOS position in Problem 4?
Space Math http://spacemath.gsfc.nasa.gov
19
Answer Key: Problem 1: If the radius of the planet is given by R, and the height above the surface is given by h, use the figure to the left to derive the formula for the line-of-sight horizon distance, D. Answer: By the Pythagorean Theorem D2 = (R+h)2 - R2
so D = ( R
2 + 2Rh + h
2 - R
2 )
1/2 and so the answer is D = ( h
2 + 2Rh )
1/2
Problem 2: Derive the distance along the planet, l, to the tangent point. Answer: From the diagram, Cos ( β ) = R/(R+h) and so L = R Arccos(R/(R+h)) Problem 3: For a typical human height of 2 meters, what is the horizon distance on A) Earth (R=6,378 km); B) Mars (3,374 km); C) The Moon (1,738 km); Asteroid Dactyl ( 1.4 km) Answer: Use the equation from Problem 1. A) R=6378 km and h=2 meters so D = ((2 meters)2 + 2 x 2 meters x 6.378 x 10⁶ meters) )1/2 = 5051 meters or 5.1 kilometers. B) For Mars, R=3374 km so D = 3,674 meters or 3.7 kilometers. C) For the Moon, R=1,738 km so D = 2.6 kilometers D) For Deimos, R = 6 km so D = 155 meters. Problem 4: A radio station has an antenna tower 50 meters tall. A) What is the maximum line-of-sight (LOS) reception distance on the Moon? B) On Mars? Answer: A) h = 50 meters, R=1,738 km so D = 13,183 meters or 13.2 kilometers. B) h = 50 meters, R=3,374 km so D = 18,368 meters or 18.4 kilometers. Problem 5: What is the rate of change of the lunar LOS radius, D, for each additional meter of antenna height in Problem 4? Answer: Use the chain rule to take the derivative with respect to h of the equation for d in Problem 1. Evaluate dD/dh at h=50 meters for R=1,738 km. Let U = h2 + 2Rh then D = U1/2 so dU/dh = (dD/dU) (dU/dh) Then dD/dh = +1/2 U -1/2 dU/dh = +1/2 (2h + 2R) (h2 + 2Rh)-1/2
For h=50 meters and R = 1,738 km, dD/dh = +0.5 x (100 + 3476000)(2500 + 2 x 50 x 1738000)-1/2
= +131.8 meters in LOS distance per meter of height. Problem 6: What is the rate-of-change of the distance, L, along the planet's surface to the lunar radio tower at the LOS position in Problem 4? Answer: Let U = R/(R+h), then L = R cos-1 (U). By the chain rule dL/dh = (dL/dU) x (dU/dh). Since dL/dU = R x (-1)(1 - u2)1/2 and dU/dh = R x (-1) x (R + h)-2 then dL/dh = R2 (R + h)-2 (R + h)1/2 /( (R+ h)2 - R2 )1/2 dL/dh = R2 (R+h)-1 (h2 + 2Rh)-1/2
Since R >> h, dL/dh = R/(2Rh) 1/2
Evaluating this for R = 1,738 km and h = 50 meters gives dL/dh = +131.8 meters per kilometer.
Space Math http://spacemath.gsfc.nasa.gov

20 Measuring the Speed of a Solar Tsunami!
Moments after a major class X-6 solar flare erupted at 18:43:59 Universal Time on December 6, 2006, the National Solar Observatory's new Optical Solar Patrol Camera captured a movie of a shock wave 'tsunami' emerging from Sunspot 930 and traveling across the solar surface. The three images to the left show the progress of this Morton Wave. The moving solar gasses can easily be seen. You can watch the entire movie and see it more clearly (http://image.gsfc.nasa.gov/poetry/weekly/MortonWave.mpeg). Note: because the event is seen near the solar limb, there is quite a bit of fore-shortening so the motion will appear slower than what the images suggest. Problem 1: From the portion of the sun's edge shown in the images, complete the solar 'circle'. What is the radius of the sun's disk in millimeters? Problem 2: Given that the physical radius of the sun is 696,000 kilometers, what is the scale of each image in kilometers/millimeter? Problem 3: Select a spot near the center of the sunspot (large white spot in the image), and a locatioWhat i
n on the leading edge of the shock wave. s the distance in kilometers from the center of
the sunspot, to the leading edge of the shock wave in each image? Problem 4: The images were taken at 18:43:05, 18:46:02 and 18:49:02 Universal Time. How much time has elapsed between these images? Problem 5: From your answers to Problem 3 and 4, what was the speed of the Morton Wave in kilometers per hour between the three images? B) did the wave accelerate or decelerate as it expanded? Problem 6: The speed of the Space Shuttle is 44,000 kilometers/hour. The speed of a passenger jet is 900 kilometers/hour. Would the Morton Wave have overtaken the passenger jet? The Space Shuttle?
Space Math http://spacemath.gsfc.nasa.gov

20Answer Key:
Problem 1: From the portion of the sun's edge shown in the images, complete the solar 'circle'. What is the radius of the sun's disk in millimeters? Answer: About 158 millimeters using a regular dessert plate as a guide. Problem 2: Given that the physical radius of the sun is 696,000 kilometers, what is the scale of each image in kilometers/millimeter? Answer: 696,000/158 = 4,405 kilometers/millimeter Problem 3: What is the distance in kilometers from the center of the sunspot, to the leading edge of the shock wave in each image? Answer: Image 2 = 27 mm = 27x4405 = 119,000 km Image 3 = 38 mm = 167,000 km Problem 4: The images were taken at 18:43:05, 18:46:02 and 18:49:02 Universal Time. How much time has elapsed between these images? Answer: Image 1 - Image 2 = 2 minutes 57 seconds Image 2 - Image 3 = 3 minutes Problem 5: From your answers to Problem 3 and 4, A) what was the speed of the Morton Wave in kilometers per hour between the three images? Answer: V12 = 119,000 km/2.9 min x (60 min/1 hr) = 2.5 million kilometers/hour V23 = 167,000/3.0 min x (60 min/1 hr) = 3.3 million kilometers/hour B) Did the speed of the wave accelerate or decelerate? Answer: Because V23 > V12 the wave accelerated. Problem 6: The speed of the Space Shuttle is 44,000 kilometers/hour. The speed of a passenger jet is 900 kilometers/hour. Would the Morton Wave have overtaken the passenger jet? The Space Shuttle? Answer: It would easily have overtaken the Space Shuttle! Because of fore-shortening, the actual speed of the wave was even higher than the estimates from the images, so the speed could have been well over 4 million km/hr.
Space Math http://spacemath.gsfc.nasa.gov

21 Do Fast CMEs produce intense SPEs?
The sun produces two basic kinds of storms; coronal mass ejections (SOHO satellite: top left) and solar flares (SOHO satellite: bottom left). These are spectacular events in which billions of tons of matter are launched into space (CMEs) and vast amounts of electromagnetic energy are emitted (Flares). A third type of 'space weather storm' can also occur. Solar Proton Events (SPEs) are invisible, but intense, showers of high-energy particles near Earth that can invade satellite electronics and cause serious problems, even malfunctions and failures. Some of the most powerful solar flares can emit these particles, which streak to Earth within an hour of the flare event. Other SPE events, however, do not seem to arrive at Earth until several days latter. Here is a complete list of Solar Proton Events between 1976-2005: http://umbra.nascom.nasa.gov/SEP/ Here is a complete list of coronal mass ejections 1996 - 2006: http://cdaw.gsfc.nasa.gov/CME_list/ Between January 1, 1996 and June 30, 2006 there were 11,031 CMEs reported by the SOHO satellite. Of these, 1186 were halo events. Only half of the halo events are actually directed towards Earth. The other half are produced on the far side of the sun and directed away from Earth. During this same period of time, 90 SPE events were recorded by GOES satellite sensors orbiting Earth. On the next page, is a list of all the SPE events and Halo CMEs that corresponded to the SPE events. There were 65 SPEs that coincided with Halo CMEs. Also included is the calculated speed of the CME event. From the information above, and the accompanying table, draw a Venn Diagram to represent the data, then answer the questions below.
Question 1: A) What percentage of CMEs detected by the SOHO satellite were identified as Halo Events? B) What are the odds of seeing a halo Event? C) How many of these Halo events are directed towards Earth? Question 2: A) What fraction of SPEs were identified as coinciding with Halo Events? B) What are the odds that an SPE occurred with a Halo CME? C) What fraction of all halo events directed towards earth coincided with SPEs? Question 3: A) What percentage of SPEs coinciding with Halo CMEs are more intense than 900 PFUs? B) What are the odds that, if you detect a 'Halo- SPE', it will be more intense than 900 PFUs? Question 4: A) What percentage of Halo-SPEs have speeds greater than 1000 km/sec? B) What are the odds that a Halo-SPE in this sample has a speed of > 1000 km/sec? Question 5: From what you have calculated as your answers above, what might you conclude about Solar Proton Events and CMEs? How would you use this information as a satellite owner and operator?
Space Math http://spacemath.gsfc.nasa.gov

21 Data Tables showing dates and properties of Halo CMEs and Solar Proton Events.
Date
CME Speed (km/s)
SPE (pfu)
January 8, 2002 1794 91
January 14, 2002 1492 15February 20, 2002 952 13
March 15, 2002 957 13March 18, 2002 989 19March 22, 2002 1750 16
April 17, 2002 1240 24April 21, 2002 2393 2520May 22, 2002 1557 820July 15, 2002 1151 234
August 14, 2002 1309 24August 22, 2002 998 36August 24, 2002 1913 317
September 5, 2002 1748 208November 9, 2002 1838 404
May 28, 2003 1366 121May 31, 2003 1835 27
June 17, 2003 1813 24October 26, 2003 1537 466
November 4, 2003 2657 353November 21, 2003 494 13
April 11, 2004 1645 35July 25, 2004 1333 2086
September 12, 2004 1328 273November 7, 2004 1759 495January 15, 2005 2861 5040
July 13, 2005 1423 134July 27, 2005 1787 41
August 22, 2005 2378 330 Note: Solar Proton Event strengths are measured in the number of particles that pass through a square centimeter every second, and is given in units called Particle Flux Units or PFUs.
Date
CME Speed (km/s)
SPE (pfu)
November 4, 1997 785 72November 6, 1997 1556 490
April 20, 1998 1863 1700May 2, 1998 938 150May 6, 1998 1099 210May 3, 1999 1584 14June 1, 1999 1772 48June 4, 1999 2230 64
February 18, 2000 890 13April 4, 2000 1188 55June 6, 2000 1119 84
June 10, 2000 1108 46July 14, 2000 1674 24000July 22, 2000 1230 17
September 12, 2000 1550 320October 16, 2000 1336 15October 25, 2000 770 15
November 8, 2000 1738 14800November 24, 2000 1289 940
January 28, 2001 916 49March 29, 2001 942 35
April 2, 2001 2505 1100April 10, 2001 2411 355April 15, 2001 1199 951April 18, 2001 2465 321April 26, 2001 1006 57
August 9, 2001 479 17September 15, 2001 478 11September 24, 2001 2402 12900
October 1, 2001 1405 2360October 19, 2001 901 11October 22, 2001 618 24
November 4, 2001 1810 31700November 17, 2001 1379 34November 22, 2001 1437 18900December 26, 2001 1446 779
Space Math http://spacemath.gsfc.nasa.gov

21
Question 1: A) What percentage of CMEs detected by the SOHO satellite were identified as Halo Events? 1186/11031 = 11% B) What are the odds of seeing a halo Event? 1 / 0.11 = 1 chance in 9 C) How many of these Halo events are directed towards Earth? From the text, only half are directed to Earth so 1186/2 = 593 Halos. Question 2: A) What fraction of SPEs were identified as coinciding with Halo Events? 65 table entries / 90 SPEs = 72% B) What are the odds that an SPE occurred with a Halo CME? 1 / 0.72 = 1 chance in 1.38 or about 2 chances in 3 C) What fraction of all halo events directed towards Earth coincided with SPEs? 65 in Table / (528+65) Halos = 11% Question 3: A) What percentage of SPEs coinciding with Halo CMEs are more intense than 900 PFUs? From the table, there are 12 SPEs out of 65 in this list or 12/65 = 18 % B) What are the odds that, if you detect a 'Halo- SPE', it will be more intense than 900 PFUs? 1 / 0.18 = 1 chance in 5. Question 4: A) What percentage of Halo-SPEs have speeds greater than 1000 km/sec? There are 50 out of 65 or 50/65 = 77% B) What are the odds that a Halo-SPE in this sample has a speed of > 1000 km/sec? 1 / 0.77 = 1 chance in 1.3 or 2 chances in 3. Question 5: From what you have calculated as your answers above, what might you conclude about Solar Proton Events and CMEs? How would you use this information as a satellite owner and operator? A reasonable student response is that Halo CMEs occur only 11% of the time, and of the ones directed towards Earth only 1 out of 9 coincide with SPEs. However, in terms of SPEs, virtually all of the SPEs coincide with Halo events ( 2 out of 3) and SPEs are especially common when the CME speed is above 1000 km/sec. As a satellite owner, I would be particularly concerned if scientists told me there was a halo CME headed towards Earth AND that it had a speed of over 1000 km/sec. Because the odds are now 2 chances out of 3 that an SPE might occur that could seriously affect my satellite. I would try to put my satellite in a safe condition to protect it from showers of high-energy particles that might damage it.
Space Math http://spacemath.gsfc.nasa.gov

The January 20, 2005 solar proton event (SPE) was by some measures the biggest since 1989. It was particularly rich in high-speed protons packing more than 100 million electron volts (100 MeV) of energy. Such protons can burrow through 11 centimeters of water. A thin-skinned spacesuit would have offered little resistance, and the astronaut would have been radiation poisoned, and perhaps even killed. The above image was taken by the SOHO satellite during this proton storm. The instrument, called LASCO, was taking an image of the sun in order for scientists to study the coronal mass ejection (CME) taking place. Each of the individual white spots in the image is a track left by a high-speed proton as it struck the imaging CCD (similar to the 'chip' in your digital camera). As you see, the proton tracks corrupted the data being taken. The high-speed particles from these proton storms also penetrate satellites and can cause data to be lost, or even false commands to be given by on-board computers, causing many problems for satellite operators.
Space Math http://spacemath.gsfc.nasa.gov

22 Atmospheric Shielding from Radiation I
The least expensive form of radiation shielding is a planetary atmosphere, but just how efficient is it? The walls of the International Space Station and the Space Shuttle provide substantial astronaut protection from space radiation, and have an equivalent thickness of 10 grams/cm2 of aluminum, which has a density of 2.7 grams/cm3. Compare this shielding to the spacesuits worn by Apollo astronauts of only 0.1 grams/cm2. The atmosphere of Earth is a column of air with density of 0.0012 grams/cm3, that is 100 kilometers tall. How much shielding does this provide at different altitudes above the ground? In this three-part problem, we will begin the first step in constructing a mathematical model of the shielding from a planetary atmosphere. A similar calculation was published by Drs. Lisa Simonsen and John Nealy in February, 1993 in the article "Mars Surface Radiation Exposure for Solar Maximum Conditions and 1989 Solar Proton Events", (NASA Technical Paper 3300) The figure below right gives the necessary geometry and variable definitions.
The figure shows a radiation sampling point located 'h' above Earth's surface, and radiation from a source at point P, which is located at a distance 'S' from the sampling point. The distance from Earth's surface to point P is given by 'z'. Also, as seen from the sampling point, the vertical arrowed ray points to a point straight overhead, and the horizontal arrowed ray points to the horizon. The angle 'θ' is the elevation angle of the radiation source from the sampling point. So, a scientist would place a radiation detector at the sampling point located above Earth's surface, point the instrument at the radiation source at point P, and make a measurement of the amount of radiation coming from that particular direction in the sky. Problem 1: From the information given in the figure, calculate the distance, S, in terms of h, R, z, and θ. Problem 2: What is the form of S(R, h, z, θ) when; A) If h is very much smaller than R? (h approaches zero ) B) θ = 90o ? C) If z is very much smaller than R? (z approaches zero)
Space Math http://spacemath.gsfc.nasa.gov
22 Problem 1: From the information given in the figure, calculate the distance, S, in terms of h, R, z, and θ. First, take three deep breaths, and play with the figure a bit. After some fascinating trial-and-error attempts, the simplest thing to realize is that the Law of Cosines can be used. There is only one of the three forms of this Law that do not involve the undesired angle, β , namely: (R + Z)2 = S2 + (R + h)2 - 2 (R + h) S cos(θ + 90o) Where we can use the angle addition theorem, cos (A + B) = Cos(A)cos(B) - sin(A)sin(B) to simplify it: (R + Z)2 = S2 + (R + h)2 + 2 (R + h) S sin(θ) At first, it doesn't look like this pile of junk is useful because S doesn't appear by itself on one side of the equals sign. But by re-arranging, you see that it is really an equation with an interesting form: S2 + [2(R+h) sin(θ)] + [ (R + h)2 - (R + Z)2 ] = 0 which is a quadratic equation in which the coefficients are A = 1 B = 2(R+h) sin(θ) and C = (R + h)2 - (R + Z)2
We use the quadratic equation to solve for the positive root, because the negative root has no physical meaning. With a 'little' algebra we get:
Answer --- > S(R,h,z,θ) = ( (R + h)2 sin2θ + 2 R (z - h) + z2 - h2 )1/2 - (R + h) sin θ
Problem 2: What is the form of S(R, h, z, θ) when; A) h << R ? Answer: Let h = 0
S(R,h,z,θ) = ( R2 sin2θ + 2 R z + z2 )1/2 - R sin θ
B) θ = 90o ? Answer:
S(R,h,z,θ) = ( (R + h)2 + 2 R (z - h) + z2 - h2 )1/2 - (R + h) We can simplify this as
S(R,h,z,θ) = ( (R + h)2 + 2 R (z - h) + z2 - h2 )1/2 - (R + h)
S(R,h,z,θ) = ( R2 + 2Rh + h2 + 2Rz - 2Rh + z2 - h2 )1/2 - (R + h)
S(R,h,z,θ) = ( R2+ 2Rz + z2)1/2 - R - h S(R,h,z,θ) = (R + z) - R - h Answer --- > S (R,h,z,θ) = z - h C) z << h ? Answer: Set z = 0 then
S(R,h,z,θ) = ( (R + h)2 sin2θ + 2 R h - h2 )1/2 - (R + h) sin θ
Space Math http://spacemath.gsfc.nasa.gov

23 Atmospheric Shielding from Radiation II
The least expensive form of radiation shielding is a planetary atmosphere, but just how efficient is it? The walls of the International Space Station and the Space Shuttle provide substantial astronaut protection from space radiation, and have an equivalent thickness of 10 grams/cm2 of aluminum, which has a density of 2.7 gm/cm3. Compare this shielding to the spacesuits worn by Apollo astronauts of only 0.1 gm/cm2. The atmosphere of Earth is a column of air with density of 0.0012 gm/cm3, that is 100 kilometers tall. How much shielding does this provide at different altitudes above the ground? In the previous problem 'Atmospheric Shielding from Radiation I' we defined a function that gives the length of the path from the radiation source to the measurement point located h above Earth's surface. To find the amount of shielding provided by the atmosphere, we have to multiply this length, by the density of the atmosphere along the path S. In this problem, we will assume that the atmosphere has a constant density of 0.0012 grams/cm3, and see what the total shielding is along several specific
directions defined by θ.
The formula for S is given by: S(R,h,z,θ) = ( (R + h)2 sin2
θ + 2 R (z - h) + z2 - h2 )1/2 - (R + h) sin θ Assume R = 6,378 kilometers. Problem 1: What is the form of the function that gives the shielding for a direction A) straight overhead (θ = 90o) and B) at the horizon (θ = 0o), for a station at sea-level (h=0 kilometers)? Problem 2: More than 90% of the atmosphere is present below an altitude of about 2 kilometers. If this is approximated as being uniform in height, what is the total shielding towards the zenith (overhead) and the horizon, if z = 2 kilometers? Problem 3: The atmosphere of Mars is about 100 times less dense, and mostly resides below 1 kilometer in altitude. Re-calculate the answers to Problem 2, and compare the radiation dosage difference at the surface of each planet.
Space Math http://spacemath.gsfc.nasa.gov

23 The formula for S is given by: S(R,h,z,θ) = ( (R + h)2 sin2
θ + 2 R (z - h) + z2 - h2 )1/2 - (R + h) sin θ Shielding D(R,h,z,θ) = 0.0012 x S(R,h,z,θ) in units of gm/cm2 for S given in cm. Problem 1: What is the form of the function that gives the shielding for A) a direction straight overhead ( θ = 90o), and B) at the horizon ( θ = 0o), for a station at sea-level ( h=0 kilometers)? Answer: A) D = 0.0012 x Z where Z is in centimeters.
B) D(R,h,z,θ) = 0.0012 ( z2 + 2 R z)1/2 where R and z are in centimeters. Problem 2: More than 90% of the atmosphere is present below an altitude of about 2 kilometers. If this is approximated as being uniform in height, what is the total shielding towards the zenith (overhead) and the horizon, if z = 2 kilometers? Answer: A) D = 0.0012 gm/cm3 x 200,000 cm = 240 gm/cm2 for radiation entering from straight overhead.
B) Because z << R, z2 <<< 2Rz so D = 0.0012 x ( 2 R z)1/2 = 0.0012 x ( 2 x (2 x 105) x (6.278 x 106))1/2 = 0.0012 x 1.59 x 106
= 1916 gm/cm2 for radiation entering from the horizon direction
Problem 3: The atmosphere of Mars is about 10 times less dense. Re-calculate the answers to Problem 2, and compare the radiation dosage difference at the surface of each planet. Answer: For mars, R = 3,374 km, density = 0.00012 gm/cm3 then from Problem 2: A) D = 0.00012 gm/cm3 x 100,000 cm = 12 gm/cm2
B) D = 0.00012 x ( 2 R z)1/2
= 0.00012 x ( 2 x (1 x 105) x (3.374 x 106))1/2 = 0.00012 gm/cm3 x 8.2 x 105 cm = 98 gm/cm2
The minimum radiation shielding comes from directions above your head that pass through the least amount of atmosphere. The amount of radiation shielding at the surface of Mars is (240 gm/cm2) /(12 gm/cm2)= 20 times less than on Earth. That means that radiation dosages at the surface of Mars would be about 20 times higher than on Earth's surface. Instead of 27 mRems/year, which is typical of the cosmic ray background on Earth's surface, you would receive about 27 x 20 = 560 mRems/year on Mars. Compare this with 370 mRems/year as the average human dosage on Earth from all sources. In the next problem 'Atmospheric Shielding from Radiation III' we will calculate this shielding more exactly.
Space Math http://spacemath.gsfc.nasa.gov

The least expensive form of radiation shielding is a planetary atmosphere, but just how efficient is it? The walls of the International Space Station and the Space Shuttle provide substantial astronaut protection from space radiation, and have an equivalent thickness of 10 grams/cm2 of aluminum, which has a density of 2.7 gm/cm3. Compare this shielding to the spacesuits worn by Apollo astronauts of only 0.1 gm/cm2. The atmosphere of Earth is a column of air with density of 0.0012 gm/cm3, that is 100 kilometers tall. How much shielding does this provide at different altitudes above the ground? In the previous problem 'Atmospheric Shielding from Radiation II' we estimated the atmospheric shielding of Earth and Mars and compared the potential radiation dosages on the planetary surface. In this problem, we will create a more accurate estimate by using a realistic model for the atmospheres of these planets. Assume R (Earth) = 6,378 kilometers, R (Mars = 3,374 km)
24 Atmospheric Shielding from Radiation III
Problem 2: A) Determine the form for S for the case of θ = 90 which gives the minimum planetary shielding at the surface for radiation entering from directly overhead. B) Evaluate the integral for Earth and for Mars. C) Assuming that the radiation environments of Mars and Earth are otherwise similar, about how many times more would your radiation dosage be on the surface of Mars compared to Earth? D) How does the atmospheric shielding of Earth compare to the shielding provided by the International Space Station or the Space Shuttle?
The formula for S is given by S(R,h,z,θ) = ( (R + h)2 sin2θ + 2 R (z - h) + z2 - h2 )1/2 - (R + h) sin θ Problem 1: What is the form of the function S for h=0 ? The density of a planetary atmosphere is defined by the exponential function N(z) = N(0) e (-Z/H) where H is the scale-height of the gas. For the composition of Earth's atmosphere, temperature, and surface gravity, H = 8.5 km. For Mars, H = 11.1 km. The sea-level density for Earth, N(0) = 0.0012 gm/cm3 , while for Mars, N(0) = 0.00020 g/cm3. The amount of surface shielding for radiation arriving from a direction, θ, is given by evaluating the integral below:
Space Math http://spacemath.gsfc.nasa.gov
24 The formula for S is given by S(R,h,z,θ) = ( (R + h)2 sin2θ + 2 R (z - h) + z2 - h2 )1/2 - (R + h) sin θ
Problem 1: What is the form of the function S for h=0 ?
S(R, z,θ) = ( R2 sin2θ + 2 R z + z2 )1/2 - R sin θ
Problem 2: The density of a planetary atmosphere is defined by the exponential function N(z) = N(0) e (-Z/H) where H is the scale-height of the gas. For the composition of Earth's atmosphere, temperature, and surface gravity, H = 8.5 km. For Mars, H = 11.1 km. The sea-level density for Earth, N(0) = 0.0012 gm/cm3 , while for Mars, N(0) = 0.00020 g/cm3. A) From the definition of S in Problem 1, determine the form for S for the case of θ = 90 which gives the minimum planetary shielding at the surface for radiation entering from directly overhead.
Answer: sin(90) = 1 so S = ( R2 + 2 R z + z2 )1/2 - R S = (R+z) - R so S = z !!! B) Evaluate the integral for Earth and for Mars.
From A) s = z so by substituting s for z, the integral becomes ……… Using the variable substitution x = z/H , you can put the integrand in a standard form……… Evaluating the integral…..
The answer is that D = N(0) H For Earth: D = 1.2 kg/m3 x 8.5 km = 1,020 gm/cm2 For Mars: D = 0.020 kg/m3 x 11.1 km = 22 gm/cm2
C) Assuming that the radiation environments of Mars and Earth are otherwise similar, about how many times more would your radiation dosage be on the surface of Mars compared to Earth? Answer: Note: This means that, because your maximum radiation dosage comes from radiation reaching you from the vertical direction (less shielding), on Mars, you will be receiving about 1,020 gm/cm2 / 22 gm/cm2 or 46 times as much radiation on the ground as you would get on Earth. On Earth, your annual cosmic ray dosage is about 27 mRem /year, so on Mars the dosage could be 46 x 0.027 Rem/year = 1.2 Rem/year.
D) How does the atmospheric shielding of Earth compare to the shielding provided by the International Space Station or the Space Shuttle? Answer: The ISS shielding is about 10 gm/cm2, but the atmospheric shielding on the ground for Earth is 1,020 gm/cm2 which is100 times greater!
Space Math http://spacemath.gsfc.nasa.gov

25 Introduction to Radiation Shielding
Space Math http://spacemath.gsfc.nasa.gov
Satellites are designed to withstand many forms of radiation in the harsh environment of space. The above graph shows how the total life time radiation dosage inside a spacecraft changes as the amount of aluminum shielding increases. The data comes from the former MIR space station and the research satellite ISO. The sensitive instruments and electronic systems operate inside the satellite shell and are protected from harmful dosages of radiation by the shielding provided by the spacecraft walls. Problem 1: You want to design a new satellite to replace the ISO satellite and to last 8 years in orbit, but it can only continue to work normally if it accumulates no more that 75,000 Rads of radiation during that time. Using the curve for ISO, how thick do the satellite walls have to be to insure this? Problem 2: The International Space Station has the same orbit as the MIR. An astronaut will spend about 100 hours in space to assemble the station. If the equivalent shielding of her spacesuit is 1.0 mm of aluminum, how large of a dosage will she receive during this time? How does it compare to the 0.4 Rads she would receive if she stayed on the ground? Problem 3: A cubical satellite has sides 1 meter across, and the density of the aluminum is 2.7 g/cc. How much mass, in kilograms, will the satellite have with 4 mm-thick walls? 12 mm-thick walls? If the launch cost is $15,000 per kilogram, how much extra will it cost to launch the heavier, and better-shielded, satellite?

25 Answer Key: Problem 1: You want to design a new satellite to replace the ISO satellite and to last 8 years in orbit, but it can only continue to work normally if it accumulates no more that 75,000 Rads of radiation during that time. Using the curve for ISO, how thick do the satellite walls have to be to insure this? Answer: The annual dosage would be 75,000 rads/8 years = 9,375 rads/year. From the ISO curve, this level of radiation would occur with about 5.5 millimeters of aluminum shielding. Problem 2: The International Space Station has the same orbit as the MIR. An astronaut will spend about 100 hours in space to assemble the station. If the equivalent shielding of her spacesuit is 0.5 mm of aluminum, how large of a dosage will she receive during this time? How does it compare to the 0.4 Rads she would receive if she stayed on the ground? Answer: The graph shows that for 0.5 millimeters equivalent spacesuit thickness and a MIR orbit, the annual dosage is 800 Rads. But she will only spend 100 hours in space. There are 8760 hours in a year, so her actual dosage would be about 800 Rads/yr x (100 hrs/8760 hrs/yr) = 9.1 Rads. This is about 9.1/0.4 = 23 times the dosage she would get on the ground in one year..or equal to 23 years worth of dosage on the ground. Problem 3: A cubical satellite has sides 1 meter across, and the density of the aluminum is 2.7 grame per cubic centimeter. How much mass, in kilograms, will the satellite have with 4 mm-thick walls? 12 mm-thick walls? If the launch cost is $15,000 per kilogram, how much extra will it cost to launch the heavier, and better-shielded, satellite? Answer: A) A cube consists of six sides. Each side has a volume of 1 meter x 1 meter x 4 millimeters, which in centimeters is = 100 x 100 x 0.4 = 4000 cubic centimeters. The density of aluminum is 2.7 grams/cubic centimeter, so the mass of one side of the cube will be 2.7 x 4000 = 10,800 grams or 10.8 kilograms. The entire satellite will have a mass of 6 x 10.8 kilograms or 64.8 kilograms. B) With 12-millimeter walls, the mass will be 100x100x1.2 x 2.7/1000 = 32.4 kilograms. C) The extra launch cost would be (32.4 - 10.8)x $15,000/kg = $324,000
Space Math http://spacemath.gsfc.nasa.gov
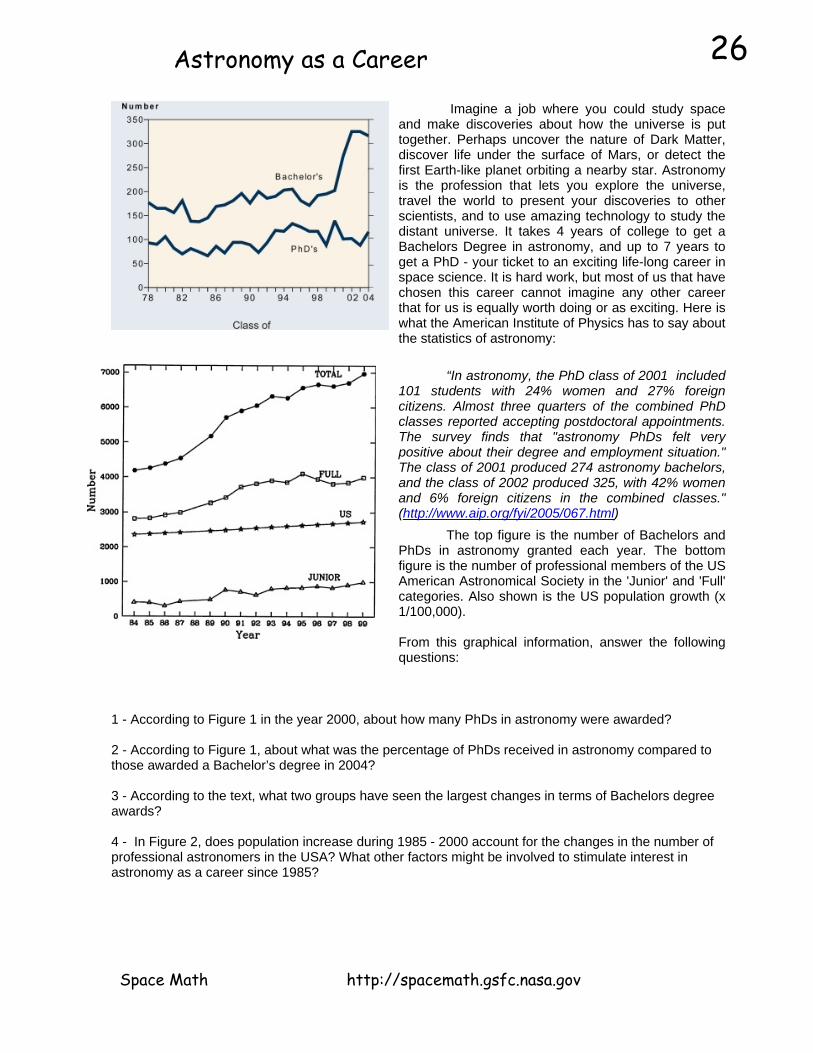
26 Astronomy as a Career
Answer Key:
Imagine a job where you could study space and make discoveries about how the universe is put together. Perhaps uncover the nature of Dark Matter, discover life under the surface of Mars, or detect the first Earth-like planet orbiting a nearby star. Astronomy is the profession that lets you explore the universe, travel the world to present your discoveries to other scientists, and to use amazing technology to study the distant universe. It takes 4 years of college to get a Bachelors Degree in astronomy, and up to 7 years to get a PhD - your ticket to an exciting life-long career in space science. It is hard work, but most of us that have chosen this career cannot imagine any other career that for us is equally worth doing or as exciting. Here is what the American Institute of Physics has to say about the statistics of astronomy: “In astronomy, the PhD class of 2001 included 101 students with 24% women and 27% foreign citizens. Almost three quarters of the combined PhD classes reported accepting postdoctoral appointments. The survey finds that "astronomy PhDs felt very positive about their degree and employment situation." The class of 2001 produced 274 astronomy bachelors, and the class of 2002 produced 325, with 42% women and 6% foreign citizens in the combined classes." (http://www.aip.org/fyi/2005/067.html) The top figure is the number of Bachelors and PhDs in astronomy granted each year. The bottom figure is the number of professional members of the US American Astronomical Society in the 'Junior' and 'Full' categories. Also shown is the US population growth (x 1/100,000). From this graphical information, answer the following questions:
1 - According to Figure 1 in the year 2000, about how many PhDs in astronomy were awarded? 2 - According to Figure 1, about what was the percentage of PhDs received in astronomy compared to those awarded a Bachelor’s degree in 2004? 3 - According to the text, what two groups have seen the largest changes in terms of Bachelors degree awards? 4 - In Figure 2, does population increase during 1985 - 2000 account for the changes in the number of professional astronomers in the USA? What other factors might be involved to stimulate interest in astronomy as a career since 1985?
Space Math http://spacemath.gsfc.nasa.gov

26 Answer Key:
1 - According to Figure 1 in the year 2000, about how many PhDs in astronomy were awarded? Answer: Estimates may vary but numbers near 145 are acceptable. The best way to determine this is to use a ruler and draw a line up from '2000' until it meets the 'PhD' curve, then draw a horizontal line to the left-hand vertical axis. Then interpolate between 100 and 150. 2 - According to Figure 1, about what was the percentage of PhD degree recipients in astronomy compared to Bachelor’s degree recipients in 2004? Answer: There were about 110 PhDs and 320 Bachelors degrees awarded, so about 1/3 or 33% were awarded the PhD. Some students may have decided not to complete an advanced degree, or to enter another PhD program in a non-astronomy field. The one-in-three does not mean that 2 of 3 Bachelors recipients failed to complete a PhD. 3 - According to the text, what two groups have seen the largest increase in terms of Bachelors degree awards? Answer: The percentage of women receiving Bachelors degrees in astronomy has grown from 24% in ca 2001 to 42% in 2002. During the same period, the number of foreign degrees conferred fell from 27% in 2001 to 65% in 2002. 4 - Does population increase during 1985 - 2000 account for the changes in the number of professional astronomers in the USA? What other factors might be involved to stimulate interest in astronomy as a career since 1985? Answer: The US population increase during this time was 230 million to 280 million which is 100% x (280-230)/230 = 21.7 %. The growth of astronomers was 100% x ( 7000-4200)/4200 = 66.7 %., so population growth doesn't explain why there are more astronomers in 2000. A major factor that influences the growth of astronomers is exciting new resources like the Hubble Space Telescope, Mars Rovers and exploration, and frequent news stories about 'astronomers discover planets orbiting distant stars'. This motivates students to consider astronomy as a career and eventually causes a surge in new PhDs after 5-8 years.
Space Math http://spacemath.gsfc.nasa.gov
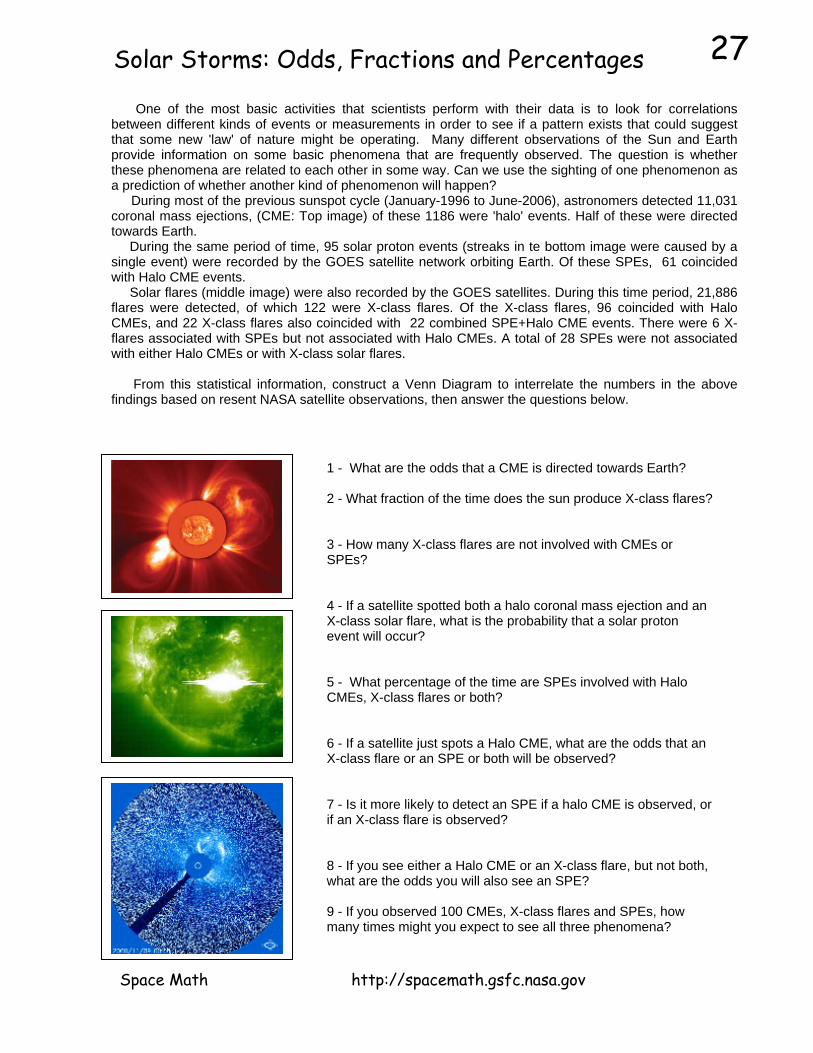
27 Solar Storms: Odds, Fractions and Percentages
One of the most basic activities that scientists perform with their data is to look for correlations between different kinds of events or measurements in order to see if a pattern exists that could suggest that some new 'law' of nature might be operating. Many different observations of the Sun and Earth provide information on some basic phenomena that are frequently observed. The question is whether these phenomena are related to each other in some way. Can we use the sighting of one phenomenon as a prediction of whether another kind of phenomenon will happen? During most of the previous sunspot cycle (January-1996 to June-2006), astronomers detected 11,031 coronal mass ejections, (CME: Top image) of these 1186 were 'halo' events. Half of these were directed towards Earth. During the same period of time, 95 solar proton events (streaks in te bottom image were caused by a single event) were recorded by the GOES satellite network orbiting Earth. Of these SPEs, 61 coincided with Halo CME events. Solar flares (middle image) were also recorded by the GOES satellites. During this time period, 21,886 flares were detected, of which 122 were X-class flares. Of the X-class flares, 96 coincided with Halo CMEs, and 22 X-class flares also coincided with 22 combined SPE+Halo CME events. There were 6 X-flares associated with SPEs but not associated with Halo CMEs. A total of 28 SPEs were not associated with either Halo CMEs or with X-class solar flares. From this statistical information, construct a Venn Diagram to interrelate the numbers in the above findings based on resent NASA satellite observations, then answer the questions below.
1 - What are the odds that a CME is directed towards Earth? 2 - What fraction of the time does the sun produce X-class flares? 3 - How many X-class flares are not involved with CMEs or SPEs? 4 - If a satellite spotted both a halo coronal mass ejection and an X-class solar flare, what is the probability that a solar proton event will occur? 5 - What percentage of the time are SPEs involved with Halo CMEs, X-class flares or both? 6 - If a satellite just spots a Halo CME, what are the odds that an X-class flare or an SPE or both will be observed? 7 - Is it more likely to detect an SPE if a halo CME is observed, or if an X-class flare is observed? 8 - If you see either a Halo CME or an X-class flare, but not both, what are the odds you will also see an SPE? 9 - If you observed 100 CMEs, X-class flares and SPEs, how many times might you expect to see all three phenomena?
Space Math http://spacemath.gsfc.nasa.gov

27Answer Key:
Venn Diagram Construction. 1. There are 593 Halo CMEs directed to Earth so 593 = 74 with flares + 39 with SPEs + 22 both SPEs and Flares + 458 with no SPEs or Flares.. 2. There are 95 SPEs. 95 = 39 with CMEs + 6 with flares + 22 with both flares and CMEs + 28 with no flares or CMEs 3. There are 122 X-class flares. 122 = 74 With CMEs only + 6 with SPEs only + 22 both CMEs and SPEs + 20 with no CMEs or SPEs.
1 - What are the odds that a CME is directed towards Earth? 593/11031 = 0.054 odds = 1 in 19 2 - What fraction of the time does the sun produce X-class flares? 122/21886 = 0.006 3 - How many X-class flares are not involved with CMEs or SPEs? 122 - 74 - 22 - 6 = 20. 4 - If a satellite spotted BOTH a halo coronal mass ejection and an X-class solar flare, what is the probability that a solar proton event will occur? 22/(74+22) = 0.23 5 - What percentage of the time are SPEs involved with Halo CMEs, X-class flares or both? 100% x (39+22+6 / 95) = 70.1 % 6 - If a satellite just spots a Halo CME, what are the odds that an X-class flare or an SPE or both will be observed? 39+22+74 / 593 = 0.227 so the odds are 1/0.227 or about 1 in 4. 7 - Is it more likely to detect an SPE if a halo CME is observed, or if an X-class flare is observed? (6+22)/95 = 0.295 or 1 out of 3 times for X-flares (39+22)/95 = 0.642 or 2 out of 3 for Halo CMEs It is more likely to detect an SPE if a Halo CME occurs by 2 to 1. 8 - If you see either a Halo CME or an X-class flare, but not both, what are the odds you will also see an SPE? 39+6 / 95 = 0.50 so the odds are 1/0.50 or 2 to 1 . 9 - If you observed 100 CMEs, X-class flares and SPEs, how many times might you expect to see all three phenomena? 100 x 22/(95+122+593) = 3 times
Space Math http://spacemath.gsfc.nasa.gov

28 A Study of Astronaut Radiation Dosages
The typical radiation dosage on the ground is about 1.0 milliRad/day or 360 milliRad/year. This dosage is considered safe, and it is an unavoidable part of the natural background that we live and work within. In space, however, this normal background dosage is significantly exceeded. The figure above shows the radiation dosages encountered by Space Shuttle astronauts during various missions indicated by the numbers near the bottom of the graph. For example, at the far right, astronauts onboard Shuttle Mission STS-31 at an orbital altitude of 335 Nautical Miles (NM), experienced dosages between 150 to 200 milliRads per day. Problem 1 - At about what altitude do most Space Shuttles orbit? Problem 2 - What is the average daily dose at this altitude in milliRads/day? Problem 3 - For a typical Shuttle mission of 10 days, what will be the astronaut's average dose? Problem 4 - If the astronaut remained on the ground during this mission, how much of a dosage would he have acquired? Problem 5 - How much radiation dosage did the STS-31 astronauts accumulate during their 118-hour mission to place the Hubble Space Telescope in orbit?
Space Math http://spacemath.gsfc.nasa.gov

28 Answer Key:
The typical radiation dosage on the ground is about 1.0 milliRad/day or 360 milliRad/year. These dosages are considered safe, and part of the natural background that we live and work within. In space, however, this normal background dosage is significantly exceeded. The figure above shows the radiation dosages encountered by Space Shuttle astronauts during various missions indicated by the numbers near the bottom of the graph. For example, at the far right, astronauts onboard Shuttle Mission STS-31 at an orbital altitude of 335 Nautical Miles (NM), experienced dosages between 150 to 200 milliRads per day. Problem 1 - At about what altitude do most Space Shuttles orbit? Answer - The average of the cluster of points is near about 170 Nautical Miles. Problem 2 - What is the average daily dose at this altitude in milliRads/day? Answer - At 170 NM, the average dosage is about 9 milliRad/day Problem 3 - For a typical Shuttle mission of 10 days, what will be the astronaut's average dose? Answer - 10 days x 9 milliRad/day = 90 milliRads. Problem 4 - If the astronaut remained on the ground during this mission, how much of a dosage would he have acquired? Answer - 9 days x 1 milliRad/day = 9 milliRads. Problem 5 - How much radiation dosage did the STS-31 astronauts accumulate during their 118-hour mission to place the Hubble Space Telescope in orbit? About how many years of ground dosage does this equal? Answer - The radiation dosage at the orbit of STS-31 was about 200 milliRads/day. The total dosage was 118 hours x (1 day / 24 hours ) x 200 milliRads/day = 983 milliRads. This equals about 983 milliRads/365 milliRads = 2.7 years of ground-level dosage
Space Math http://spacemath.gsfc.nasa.gov
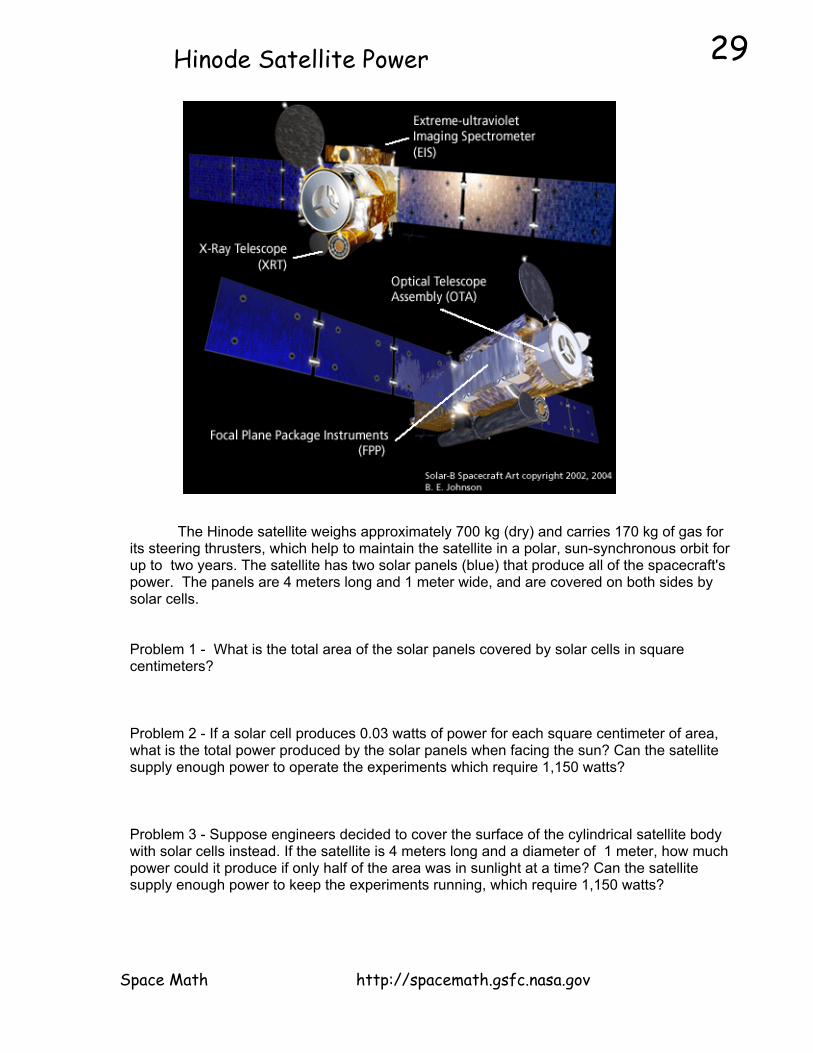
29 Hinode Satellite Power
The Hinode satellite weighs approximately 700 kg (dry) and carries 170 kg of gas for its steering thrusters, which help to maintain the satellite in a polar, sun-synchronous orbit for up to two years. The satellite has two solar panels (blue) that produce all of the spacecraft's power. The panels are 4 meters long and 1 meter wide, and are covered on both sides by solar cells. Problem 1 - What is the total area of the solar panels covered by solar cells in square centimeters? Problem 2 - If a solar cell produces 0.03 watts of power for each square centimeter of area, what is the total power produced by the solar panels when facing the sun? Can the satellite supply enough power to operate the experiments which require 1,150 watts? Problem 3 - Suppose engineers decided to cover the surface of the cylindrical satellite body with solar cells instead. If the satellite is 4 meters long and a diameter of 1 meter, how much power could it produce if only half of the area was in sunlight at a time? Can the satellite supply enough power to keep the experiments running, which require 1,150 watts?
Space Math http://spacemath.gsfc.nasa.gov

29 Answer Key:
Problem 1 - What is the total area of the solar panels covered by solar cells in square centimeters? Answer: The surface area of a single panel is 4 meters x 1 meter = 4 square meter per side. There are two sides, so the total area of one panel is 8 square meters. There are two solar panels, so the total surface area covered by solar cells is 16 square meters. Converting this to square centimeters: 16 square meters x (10,000 cm2/m2) = 160,000 cm2
Problem 2 - If a solar cell produces 0.03 watts of power for each square centimeter of area, what is the total power produced by the solar panels when facing the sun? Can the satellite supply enough power to operate the experiments which require 1,150 watts? Answer: Only half of the solar cells can be fully illuminated at a time, so the total exposed area is 80,000 cm
2. The power produced is then:
Power = 80,000 cm
2 X 0.03 watts/cm2 = 2,400 watts.
Yes, the satellite solar panels can keep the experiments running, with 2400-1150 = 1,250 watts to spare! Problem 3 - Suppose engineers decided to cover the surface of the cylindrical satellite body with solar cells instead. If the satellite is 4 meters long and a diameter of 1 meter, how much power could it produce if only half of the area was in sunlight at a time? Can the satellite supply enough power to keep the experiments running, which require 1,150 watts? Answer - Surface area of a cylinder = Area of 2 circular end caps + area of side of cylinder
= 2 π R2 + 2 π R
h
S = 2 x (3.14) (0.5 meters) 2 + 2 x (3.14) (0.5 meters) (4 meters) = 1.57 square meters + 12.56 square meters = 14.13 square meters. Only half of the solar cells can be illuminated, so the usable area is 7.06 square meters or 70,600 square centimeters. The power produced is 70600 x 0.03 = 2,100 watts. Yes..the satellite can keep the experiments running with this solar cell configuration.
Space Math http://spacemath.gsfc.nasa.gov

30 Hinode - Close-up of a Sunspot
After a successful launch on September 22, 2006 the Hinode solar observatory caught a glimpse of a large sunspot on November 4, 2006. An instrument called the Solar Optical Telescope (SOT) captured this image, showing sunspot details on the solar surface. Problem 1 - From the clues in this image, what is the scale of the image on the right in units of kilometers per millimeter? Problem 2 - What is the size of the smallest detail you can see in the image? Problem 3 - Compared to familiar things on the surface of Earth, how big would the smallest feature in the solar image be? Problem 4 - The gold-colored textured surface is the photosphere of the sun. The texturing is produced by heated gas that is convecting from the hot interior to the cooler outer layers of the sun. The convecting gases form cells, called granulations, at the surface, with upwelling gas flowing from the center of each cell, outwards to the cell boundary, where it cools and flows back down to deeper layers. What is the average size of a granulation cell within the square? Problem 5 - Measure several granulation cells at different distances from the sunspot, and plot the average size you get versus distance from the spot center. Do granulation cells have about the same size near the sunspot, or do they tend to become larger or smaller as you approach the sunspot?
Space Math http://spacemath.gsfc.nasa.gov

30Answer Key:
Answer 1 - From the 40 millimeter length of the 50,000 km arrow marker, the scale of the image is 50,000 km/40 mm = 1250 kilometers per millimeter Answer 2 - The smallest detail is about 0.5 millimeters or 0.5 x 1250 = 625 kilometers across. Answer 3 - Similar features on Earth would be continents like Greenland (1,800 km) or England (700 km). Answer 4 - Measure about 5 cells to get: 1.5 mm, 1.0 mm, 0.8mm, 1.2mm and 1.4 mm. The average is about 1.2 mm, so the average size is (1.2) x 1250km = 1,500 km. Answer 5 - Students should measure about 5 granulation cells in three groups; Group 1 should be far from the center of the spot. Group 3 should be as close to the outer, tan-colored, 'penumbra' of the spot as possible, and Group 2 should be about half-way in between Group 1 and 3. The average granulation sizes do not change significantly.
Space Math http://spacemath.gsfc.nasa.gov
31 Compound Interest
How it works: Suppose this year I put $100.00 in the bank. The bank invests this money and at the end of the year gives me $4.00 back in addition to what I gave them. I now have $104.00. My initial $100.00 increased in value by 100% x ($104.00 - $100.00)/ $100.00) = 4%. Suppose I gave all of this back to the bank and they reinvested in again. At the end of the second year they have me another 4% increase. How much money do I now have? I get back an additional 4%, but this time it is 4% of $104.00 which is $104.00 x 0.04 = $4.16. Another way to write this after the second year is: $100.00 x (1.04) x (1.04) = $108.16. After 6 years, at a gain of 4% each year, my original $100.00 is now worth: $100.00 x (1.04) x (1.04) x (1.04) x (1.04) x (1.04) x (1.04) = $126.53 Do you see the pattern? The basic formula that lets you calculate this 'compound interest' easily is:
F = B x (1 + P/100)T
where : B = the starting amount, P= the annual percentage increase, T = number of investment years. Question: In the formula, why did we divide the interest percentage by 100 and then add it to 1? Problem 1: The US Space program invested $26 billion to build the Apollo Program to send 7 missions to land on the Moon. A) What was the average cost for each Apollo mission? B) You have probably heard your parents complain that 'prices have sure gone up this year!'. This is because, each year, the price for food, gasoline, and other things you buy as a family have been increasing each year by about 3% .This is called Inflation. It means that this year you have to pay $1.03 for something you bought for $1.00 last year. Since the last moon landing in 1972, inflation has averaged about 4% each year. From you answer to A), how much would it cost to do the same Apollo moon landing in 2007? Problem 2: A NASA satellite program was originally supposed to cost $250 million when it started in 2000. Because of delays in approvals by Congress and NASA, the program didn't get started until 2005. If the inflation rate was 5% per year, A) how much more did the mission cost in 2005 because of the delays? B) Was it a good idea to delay the mission to save money in 2000? Problem 3: A scientist began his career with a salary of $40,000 in 1980, and by 2000 this had grown to $100,000. A) What was his annual salary gain each year? B) If the annual inflation rate was 3%, why do you think that his salary gain was faster than inflation during this time?
Space Math http://spacemath.gsfc.nasa.gov

31 Do you see the pattern? Each year you invest the money, you multiply what you started with the year before by 1.04.
F = B x (1 + P/100)T
Question: In the formula, why did we divide the interest percentage by 100 and then add it to 1? Because if each year you are increasing what you started with by 4%, you will have 4% more at the end of the year, so you have to write this as 1 + 4/100 = 1.04 to multiply it by the amount you started with. Problem 1: The US Space program invested $26 billion to build the Apollo Program to send 7 missions to land on the Moon. A) What was the average cost for each Apollo mission? Answer : $26 billion/7 = $3.7 billion. B) Answer: The number of years is 2007-1972 = 35 years. Using the formula, and a calculator: F = $3.7 billion x (1 + 4/100)
35 = $3.7 billion x (1.04)
35 = $14.6 billion.
Problem 2: A) Answer: The delay was 5 years, so F = $250 million x (1 + 5/100)
5 = $250 million x (1.28) = $319 million
The mission cost $69 million more because of the 5-year delay. B) No, because you can't save money starting an expensive mission at a later time. Because of inflation, missions always cost more when they take longer to start, or when they take longer to finish. Problem 3: A scientist began his career with a salary of $40,000 in 1980, and by 2000 this had grown to $100,000. A) What was his annual salary gain each year? Answer A) The salary grew for 20 years, so using the formula and a calculator, solve for X the annual growth: $100,000 = $40,000 x ( X )
20 X = (100,000/40,000) 1/20 X = 1.047 So his salary grew by about 4.7% each year, which is a bit faster than inflation. B) If the inflation rate was 3%, why do you think that his salary gain was faster than inflation during this time? Answer: His salary grew faster than inflation because his employers valued his scientific research and gave him average raises of 1.5% over inflation each year!
Space Math http://spacemath.gsfc.nasa.gov

32 Solar Flare Reconstruction
During the November 4, 2003 solar flare, the GOES satellite measured the intensity of the flare as its light increased to a maximum and then decreased. The problem is that the solar flare was so bright that it could not record the most intense phase of the brightness evolution - what astronomers call its light curve. The figure above shows the light curve for two different x-ray energies, and you can see how its most intense phase near 19:50 UT has been clipped. This is a common problem with satellite detectors and is called 'saturation'. To work around this problem to recover at least some information about the flare's peak intensity, scientists resorted to mathematically fitting the pieces of the light curve that they were able to measure, and interpolated the data using their mathematical model, to estimate the peak intensity of the flare.
X-ray Flare Data.
Universal Time (UT)
Intensity (Watts/m2/sec)
19:40 0.00010 19:41 0.00060 19:42 0.00180 19:45 saturated 19:50 saturated 19:55 0.00180 20:00 0.00140 20:05 0.00090 20:10 0.00060 20:15 0.00040 20:20 0.00030 20:25 0.00025 20:30 0.00020 20:35 0.00019 20:40 0.00017 20:45 0.00016 20:50 0.00015 20:55 0.00014 21:00 0.00012 21:05 0.00010
Problem 1 (Pre-Algebra): Re-plot the data in the table and from the trend on either side of the saturated region, estimate the peak intensity. Problem 2 (Algebra): Re-plot the data, and from the information on either side of the saturation region, create two exponential functions that fit the data. Use the elapsed time since 19:40 as the independent variable. Find the intersections of these two functions to estimate the peak intensity and time. Problem 3 (Calculus): Integrate the piecewise function in Problem 2 to determine the area under the light curve to 21:05. Note: 1 Watt equals 1 Joule of energy per second. Given that the sun is 147 million kilometers from the GOES satellite, calculate the surface area, in square meters, of a sphere of this radius. Calculate the total energy, in Joules, radiated by the flare that passed through the surface area of the sphere.
Space Math http://spacemath.gsfc.nasa.gov

32 Re-plotted data to left, allowing extra space for interpolation. Problem 1 (Pre-Algebra): Answer: The curves, drawn free-hand, intersect between 0.0035 to 0.004 Watts/m2/sec
0
0.0005
0.001
0.0015
0.002
0.0025
0.003
0.0035
0.004
19:40
19:42
19:50
20:00
20:10
20:20
20:30
20:40
20:50
21:00
Universal Time
Inte
nsity
(w/c
m2/
s)
Problem 2 (Algebra): Create two exponential functions that fit the data. Use the elapsed time
since 19:40 as the independent variable. Rising: From (0.0, 0.0001), (1.0, 0.0006) and (2.0, 0.00018) a best-fit exponential curve is R(T) = 0.0001 e(+1.44T)
Falling: From (20.0, 0.0018), (25.0, 0.0014), (30.0, 0.0009) and (35.0, 0.0006) a best-fit exponential curve is R(T) = 0.0074 e(-0.07T)
Find the intersections of these two functions to estimate the peak intensity and time. 0.0001 e 1.44T = 0.0074 e-0.07T
Taking loge of both sides : loge(0.0001) + 1.44 T = loge(0.0074) - 0.07T solve for T to get: T = (+9.21 - 4.91)/1.51 = 2.84 minutes So the peak UT is 19:40 + 2.84 = 19:42.84 or 19:42:50 The peak intensity is then 0.0001 e(1.44 x 2.84) = 0.006 Watts/m2
Problem 3 (Calculus): Integrate the piecewise function in Problem 2 to determine the area under the light curve. Note 1 watt x 1 second = 1 Joule. Rising-side: From 0 to 2.84 minutes: 0.0001 x (1/1.44) [ e (1.44 x 2.84) - 1 ] = 0.0041
Joules/m2
Falling side from 2.84 to 85 minutes:
0.0074 x (1/0.07) [ e (-0.070x2.84)
- e (-0.070*85.0)
] =0.106 [ 0.820-0.0026] = 0.0867 Joules/m2
Combining we get a total 'flux' of 0.091 Joules/m2
Given that the sun is 147 million kilometers from the GOES satellite, calculate the surface area of a sphere of this radius. Calculate the total energy radiated by the flare in ergs that passed through the surface area of the sphere. Area = 4 π (147 x 106 km)2 = 2.71 x 10¹⁷ km2 x 1.0x 106 meter2/km2 = 2.71 x 10²³ m2
Total energy = 0.091 Joules/m2 x 2.71 x 1023 m2 = 2.5 x 10²² Joules
Space Math http://spacemath.gsfc.nasa.gov

33 A Lunar Transit of the Sun from Space
The twin STEREO satellites captured this picture of our Moon passing across the sun's disk on February 25, 2007. The two satellites are located approximately in the orbit of Earth, but are moving away from Earth in opposite directions. From this image, you can figure out how far away from the Moon the STEREO-B satellite was when it took this picture! To do this, all you need to know is the following: 1) The diameter of the Moon is 3,476 km 2) The distance to the sun is 148 million km. 3) The diameter of the sun is 0.54 degrees Can you figure out how to do this using geometry?
Problem 1: Although the True Size of an object is measured in meters or kilometers, the Apparent Size of an object is measured in terms of the number of angular degrees it subtends. Although the True Size of an object remains the same no mater how far away it is from you, the Apparent Size gets smaller the further away it is. In the image above, the Apparent Size of the sun was 0.54 degrees across on February 25. By using a millimeter ruler and a calculator, what is the angular size of the Moon? Problem 2: As seen from the distance of Earth, the Moon has an Apparent Size of 0.53 degrees. If the Earth-Moon distance is 384,000 kilometers, how big would the Moon appear at twice this distance? Problem 3: From your answer to Problem 1, and Problem 2, what is the distance to the moon from where the above photo was taken by the STEREO-B satellite? Problem 4: On February 25, 2007 there was a Half Moon as viewed from Earth, can you draw a scaled model of the Earth, Moon, Stereo-B and Sun distances and positions (but not diameters to the same scale!) with a compass, ruler and protractor?
Space Math http://spacemath.gsfc.nasa.gov

33Answer Key:
Problem 1: Although the True Size of an object is measured in meters or kilometers, the Apparent Size of an object is measured in terms of the number of angular degrees it subtends. Although the True Size of an object remains the same no mater how far away it is from you, the Apparent Size gets smaller the further away it is. In the image above, the Apparent Size of the sun is 0.5 degrees across. By using a millimeter ruler and a calculator, what is the angular size of the Moon? Answer: The diameter of the sun is 57 millimeters. This represents 0.54 degrees, so the image scale is 0.54 degrees / 57 millimeters = 0.0095 degrees/mm The diameter of the Moon is 12 millimeters, so the angular size of the Moon is 12 mm x 0.0095 degrees/mm = 0.11 degrees. Problem 2: As seen from the distance of Earth, the Moon has an Apparent Size of 0.53 degrees. If the Earth-Moon distance is 384,000 kilometers, how big would the Moon appear at twice this distance? Answer: It would have an Apparent Size half as large, or 0.26 degrees.
Problem 3: From your answer to Problem 1, and Problem 2, what is the distance to the moon from where the above photo was taken by the STEREO-B satellite? Answer: The ratio of the solar diameter to the lunar diameter is 0.54 degrees/0.11 degrees = 4.9. This means that from the vantage point of STEREO, it is 4.9 times farther away than it would be at the Earth-Moon distance. This means it is 4.9 times farther away than 384,000 km, or 1.9 million kilometers. Problem 4: On February 25, 2007 there was a Half Moon as viewed from Earth, can you draw a scaled model of the Earth, Moon, Stereo-B and Sun distances and positions (but not diameters!) using a compass, ruler and protractor? Answer: The figure to the right shows the locations of the Earth, Moon and STEREO satellite. The line connecting the Moon and the Satellite is 4.9 times the Earth-Moon distance.
Space Math http://spacemath.gsfc.nasa.gov

34 The Hinode satellite views the sun
This image was taken by the X-Ray Telescope (XRT) on the Hinode solar observatory in December, 2006. It shows the complex magnetic structure over a large sunspot called Active Region AR930. You can also see large numbers of bright 'freckles' - each representing a small micro-flare. The large black 'holes' are places in the corona of the sun where high-temperature gas is free to escape from the sun, and so there is little gas to illuminate these regions of the solar corona. This is because in these 'coronal holes' magnetic field lines open out to interplanetary space. Closed field lines near the surface act like magnetic bottles and keep the heated plasma close to the sun, creating the bright areas (red and yellow colors). Using a black pen or pencil, try your hand at predicting what the magnetic field lines look like using the clues from Hinode picture! Below is an example of a field line model calculated from an image by the SOHO satellite.
Space Math http://spacemath.gsfc.nasa.gov

34Answer Key: Students may come up with several different versions. The main thing to look for is that in the regions where the Hinode picture shows orange or yellow, students should draw loops of magnetism…like a bar magnet field….that are close-in to the solar surface. In the black regions (north pole) of sun and the large spot to the left of the sunspot (yellow), they should draw magnetic lines that start in the dark region but end outside the picture because they are continuing on into interplanetary space. Below is a possible drawing! Students may notice that the gases are brightest in the lower-right quadrant so there are more closed magnetic field 'loops' there. There are also more dark areas in the top half of the image so there are probably a mixture of open and closed field lines, and not as many closed ones as in the lower-right quadrant. They should definitely realize that the two large dark areas at the top 'north' pole and to the left of the bright yellow sunspot region contain open field lines. The bright yellow active region should have a number of large loops and a higher density of them than elsewhere.
Space Math http://spacemath.gsfc.nasa.gov

35 The Sunspot Cycle - endings and beginnings
The above plot shows the current sunspot cycle (Number 23) based on the average monthly sunspot counts since January, 1994. Problem 1 - About when (month and year) did Sunspot Cycle 23 begin? Problem 2 - About when (month and year) did Sunspot Cycle 23 reach its maximum? Problem 3 - A) What was the average minimum sunspot count during the years of the
previous sunspot minimum? B) What do you think the average sunspot count will be during the current sunspot minimum?
Problem 4 - What is the number of years between sunspot minima to the nearest tenth of a
year? Problem 5 - How long did Cycle 23 take to reach sunspot maximum? Problem 6 - When (year, month) do you predict we will reach sunspot maximum during the
next cycle ( Cycle 24)? Problem 7 - When (year, month) do you think the next sunspot minimum will occur? Problem 8 - During which part of the sunspot cycle is there A) the greatest month-to-month
variation in the number of sunspots counted? B) The least variation in the number counted?
Space Math http://spacemath.gsfc.nasa.gov

35Answer Key:
Problem 1 - When (month and year) did Sunspot Cycle 23 begin? Answer: Around July, 1996 Problem 2 - When (month and year) did Sunspot Cycle 23 reach its maximum? Answer: Around July, 2000 and a second maximum near September, 2001 Problem 3 - A) What was the average minimum sunspot count during the previous sunspot minimum? Answer: From the graph the monthly numbers are 5,8,6,6,12,8,13,1,0,16,13,6 for
an average of 8 sunspots during 1996. B) What do you think the average sunspot count will be during the current
sunspot minimum? Answer: About 12. Problem 4 - What is the number of years between sunspot minima to the nearest tenth of a
year? Answer: The first minimum was on July, 1996 and the current minimum seems to
be around March ,2007 so the difference is 2007.25 - 1996.58 = 10.7 years. Problem 5 - How long did Cycle 23 take to reach sunspot maximum? Answer: The first maximum occurred on July 2000, the minimum was July 1996,
so it took 4 years. Problem 6 - When (year, month) do you predict we will reach sunspot maximum during the
next cycle ( Cycle 24)? Answer: If we add 4 years to the current minimum on March, 2007 we get March,
2011. Problem 7 - When (year, month) do you think the next sunspot minimum will occur? Answer: From our answer to Problem 4, if we add 10.7 years to March, 2007 we get
2007.25 + 10.7 = 2017.95 or December, 2017. Problem 8 - During which part of the sunspot cycle is there A) the greatest month-to-month
variation in the number of sunspots counted? B) The least variation in the number counted?
Answer: Looking at the graph, the largest variations from month to month occur near sunspot maximum, and the least variations occur near sunspot minimum.
Space Math http://spacemath.gsfc.nasa.gov
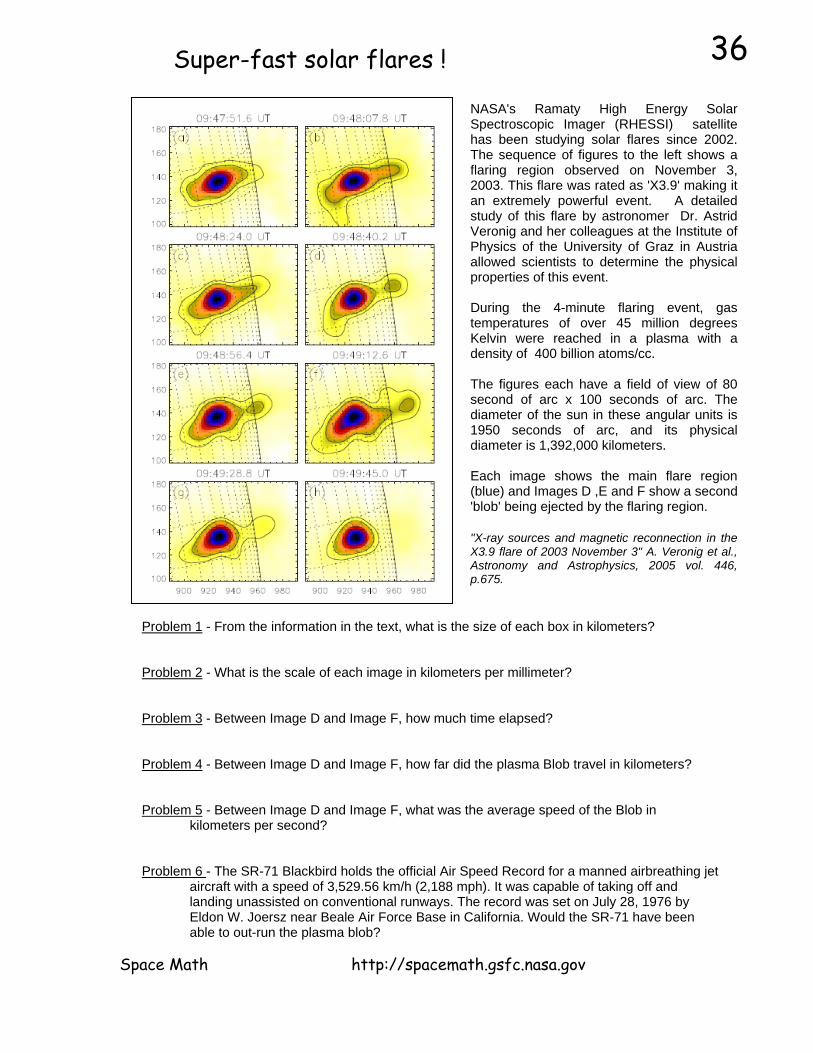
36 Super-fast solar flares !
NASA's Ramaty High Energy Solar Spectroscopic Imager (RHESSI) satellite has been studying solar flares since 2002. The sequence of figures to the left shows a flaring region observed on November 3, 2003. This flare was rated as 'X3.9' making it an extremely powerful event. A detailed study of this flare by astronomer Dr. Astrid Veronig and her colleagues at the Institute of Physics of the University of Graz in Austria allowed scientists to determine the physical properties of this event. During the 4-minute flaring event, gas temperatures of over 45 million degrees Kelvin were reached in a plasma with a density of 400 billion atoms/cc. The figures each have a field of view of 80 second of arc x 100 seconds of arc. The diameter of the sun in these angular units is 1950 seconds of arc, and its physical diameter is 1,392,000 kilometers. Each image shows the main flare region (blue) and Images D ,E and F show a second 'blob' being ejected by the flaring region. "X-ray sources and magnetic reconnection in the X3.9 flare of 2003 November 3" A. Veronig et al., Astronomy and Astrophysics, 2005 vol. 446, p.675.
Problem 1 - From the information in the text, what is the size of each box in kilometers? Problem 2 - What is the scale of each image in kilometers per millimeter? Problem 3 - Between Image D and Image F, how much time elapsed? Problem 4 - Between Image D and Image F, how far did the plasma Blob travel in kilometers? Problem 5 - Between Image D and Image F, what was the average speed of the Blob in
kilometers per second? Problem 6 - The SR-71 Blackbird holds the official Air Speed Record for a manned airbreathing jet
aircraft with a speed of 3,529.56 km/h (2,188 mph). It was capable of taking off and landing unassisted on conventional runways. The record was set on July 28, 1976 by Eldon W. Joersz near Beale Air Force Base in California. Would the SR-71 have been able to out-run the plasma blob?
Space Math http://spacemath.gsfc.nasa.gov
36Answer Key:
Problem 1 - From the information in the text, what is the size of each box in kilometers? Answer: (100 arc-sec/1950-arcsec) x 1,392,000 km = 71,400 km. (80 arcsec/1950 arcsec0 x 1,392,000 km = 57,100 km. The boxes are 71,400 x 57,100 km in size. Problem 2 - What is the scale of each image in kilometers per millimeter? Answer: The 100-arcsec edge of a box measures 34 millimeters, so the scale is (71,400 km/34 mm) = 2,100 km/mm Problem 3 - Between Image D and Image F, how much time elapsed? Answer: 09:49:12.6 UT - 09: 48: 40.2 UT = 72.6 - 40.2 = 30.4 seconds. Problem 4 - Between Image D and Image F, how far did the plasma Blob travel in kilometers? Answer: In Image D it was 12 millimeters from the flare center. In Image F it was 15 millimeters from the flare center, for a net change of 3 millimeters or 3 mm x 2,100 km/mm = 6,300 kilometers. Problem 5 - Between Image D and Image F ,what was the average speed of the Blob in kilometers per second? Answer: The speed was 6,300 kilometers/30.4 seconds or 207 kilometers/sec. Problem 6 - The SR-71 Blackbird holds the official Air Speed Record for a manned air-breathing jet aircraft with a speed of 3,529.56 km/h (2,188 mph). It was capable of taking off and landing unassisted on conventional runways. The record was set on July 28, 1976 by Eldon W. Joersz near Beale Air Force Base in California. Would the SR-71 have been able to out-run the plasma Blob? Answer: The SR-71 traveled at a speed of 3,530 km/hour. There are 3,600 seconds in an hour, so the speed was 3,530 km/hr x 1 hr/3600 sec = 0.98 kilometers/sec. The solar flare blob was traveling at 207 kilometers per second or nearly 210 times faster! The Blob Wins!!!
Space Math http://spacemath.gsfc.nasa.gov

A note from the Author: Hi again! I hope you and your students are enjoying this collection of unusual math problems! Through my middle school and high school years, I was constantly inspired and enthralled by space and astronomy. Not surprisingly, since it was the 1960's and these years in my life were bracketed by John Glen's famous orbit of Earth, and the Apollo-11 moon landing..and, oh yes, movies like '2001: A Space Odyssey' and TV programs like 'Outer Limits' and 'Star Trek'. (I never took 'Lost In Space' seriously!) Although I have been a professional astronomer since 1982, Mathematics was not especially easy for me in elementary school, and in grades 7-12. I would regularly get Bs and a few As. But in those days that was enough to guarantee you admission into virtually all colleges, since only about 15% of high school seniors went on to a 4-year college. I went to U.C. Berkeley because it was only a 40-minute bus ride from my parent's front door where I would live as an undergraduate. Luckily for me, UC had one of the best Astronomy and Mathematics Departments in the world! Despite my non-stellar grade-school abilities, I always enjoyed math and had a positive attitude about it. I was intrigued by algebra and trigonometry, but that was just a warm-up. When I got my first taste of calculus during the end of my Senior Year at Fremont High School in Oakland California, it was like some kind of epiphany. I was overpoweringly struck by how beautiful the various mathematical symbols were; the graceful integral signs, the elegantly loopy partial derivative sign, the mysterious capital-deltas and the choppy-looking sigmas. Each had a story to tell, and I was so excited that after 12 years of school, I could start to understand the beauty in this math. This inspiration and attitude paid off. When I started college, my grades in math soared to straight-As with the occasional B. I credit all of that to a positive and inquisitive attitude towards math, but also to the simple fact that I had perhaps out-grown older ways of thinking that had silently held me back, and I had somehow 'matured' into the subject. So, what does this long-ago experience have to do with today's student learning in mathematics? Perhaps it reflects on providing additional motivation to a struggling student, one of which would well have been me in today's educational system. Perhaps it means that, when a student has a sense of what they want to be, they can more easily see why math is going to be an important aspect of that future career dream. Perhaps it also means that students are still developing and unfolding at a time when they are asked to master mathematical concepts that may well be temporarily too advanced for where they are at that moment. Whatever the situation, I would personally like you to know that achieving a career in science is a marathon, not a 100-yard dash. Some of the brightest students that race out of the gate first, may well not have the stamina that a slightly less adept student has, who has a dream of someday walking on the moon, or peering into the deepest recesses of the atom. Sincerely, Dr. Sten Odenwald NASA Astronomer
National Aeronautics and Space Administration
Space Math @ NASAGoddard Spaceflight CenterGreenbelt, Maryland 20771http://spacemath.gsfc.nasa.gov
www.nasa.gov


