Anne Bagger ApS Gravertoften 13 Page 1 of 28 DK-2765 Smoerum +45 30 53 35 05 Spaceplates Greenhouse South Bristol Skills Academy Documentation for structural capacity Date: 2012-03-06 By: Anne Bagger, Anne Bagger ApS Daniel Sang-Hoon Lee, Royal Danish Academy of Fine Arts, School of Architecture 1. Introduction “Spaceplates Greenhouse” is to be built at the South Bristol Skills Academy. The structure is a so-called plate shell structure, as described in Anne Bagger’s Ph.D. thesis: Plate shell structures of glass – Studies leading to guidelines for structural design, Technical University of Denmark, 2010. The thesis can be downloaded here: http://www.annebagger.dk/Links.html. In the present document, the basis of design for the structure is presented, as well as the structural calculations with documentation for a sufficient structural capacity. A plate shell structure is a shell structure with a facetted geometry, where the tessellation is organized so that the plate elements (the facets) carry the load on the structure. This way, no additional structure is needed, other than the plates and the connections between their edges. The geometry of a plate shell structure is characterized by the number of plates meeting in each vertex on the surface: three plates meet in all vertices, and structurally this has the consequence that the vertices are principally not active in the overall load transfer of shell forces. 2. Codes of practice The following codes of practice have been used in the preparation of this report: • BS EN 1990:2002 Basis of structural design • British NA (National Annex) to BS EN 1990:2002 • BS EN 1991-1-1:2002, Eurocode 1: Actions on structures – Part 1-1: General actions – Densities, self-weight, imposed loads for buildings • British NA to BS EN 1991-1-1:2002 • BS EN 1991-1-3:2003, Eurocode 1: Actions on structures – Part 1-3: General actions – Snow loads
Transcript
Anne Bagger ApS Gravertoften 13 Page 1 of 28 DK-2765 Smoerum +45 30 53 35 05
Spaceplates Greenhouse
South Bristol Skills Academy
Documentation for structural capacity
Date: 2012-03-06
By: Anne Bagger, Anne Bagger ApS
Daniel Sang-Hoon Lee, Royal Danish Academy of Fine Arts, School of Architecture
1. Introduction
“Spaceplates Greenhouse” is to be built at the South Bristol Skills Academy. The structure is a so-called plate shell structure, as described in Anne Bagger’s Ph.D. thesis: Plate shell structures of glass – Studies leading to guidelines for structural design, Technical University of Denmark, 2010. The thesis can be downloaded here: http://www.annebagger.dk/Links.html. In the present document, the basis of design for the structure is presented, as well as the structural calculations with documentation for a sufficient structural capacity.
A plate shell structure is a shell structure with a facetted geometry, where the tessellation is organized so that the plate elements (the facets) carry the load on the structure. This way, no additional structure is needed, other than the plates and the connections between their edges. The geometry of a plate shell structure is characterized by the number of plates meeting in each vertex on the surface: three plates meet in all vertices, and structurally this has the consequence that the vertices are principally not active in the overall load transfer of shell forces.
2. Codes of practice
The following codes of practice have been used in the preparation of this report:
• BS EN 1990:2002 Basis of structural design • British NA (National Annex) to BS EN 1990:2002 • BS EN 1991-1-1:2002, Eurocode 1: Actions on structures – Part 1-1: General actions – Densities,
self-weight, imposed loads for buildings • British NA to BS EN 1991-1-1:2002 • BS EN 1991-1-3:2003, Eurocode 1: Actions on structures – Part 1-3: General actions – Snow
loads
Anne Bagger ApS Gravertoften 13 Page 2 of 28 DK-2765 Smoerum +45 30 53 35 05
• British NA to BS EN 1991-1-3:2003 • BS EN 1991-1-4:2005, Eurocode 1: Actions on structures – Part 1-4: General actions – Wind
actions • British NA to BS EN 1991-1-4:2005+A1:2010 • BS EN 1999-1-1:2007, Eurocode 9: Design of aluminium structures – Part 1-1: General structural
rules • British NA to BS EN 1999-1-1:2007+A1:2009
3. Materials
Aluminium:
Alloy AlMg3 (5754, H22)
Characteristic 0.2% yield stress: f0.2 = 130 MPa
Partial safety factors on yield stress: γM1 = 1.1 (resistance of cross section)
γM2 = 1.25 (resistance of connections – not weldings)
E-modulus: E = 70 GPa
Poisson’s ratio: ν = 0.33
G-modulus: G = E/2/(1+ ν) = 26 GPa
PMMA (acrylic sheets):
Characteristic tensile strength: f = 70 MPa (reduces to 20 MPa at 80 degrees)
Estimated design value: fd = 50 MPa
E-modulus: E = 3.2 GPa
Poisson’s ratio: ν = 0.37
G-modulus: G = E/2/(1+ ν) = 1.2 GPa
4. Loads
4.1 Self weight
Material densities:
Aluminium: ρ = 2.7 ton/m3 = 27 kN/m3
PMMA: ρ = 1.2 ton/m3 = 12 kN/m3
4.2 Snow
Maximum general snow load is sk = 0.4kN/m2 in Bristol according to BS EN 1991-1-3 and the NA. The exposure factor is set to Ce = 1.0, corresponding to no considerable snow accumulation due to sheltering effects. The thermal factor (which takes into account the melting of snow due to heat loss through the plates) is set to Ct = 1.0, since it is unlikely that the room will be heated constantly during the winter.
The form factor takes snow drifting due to the building shape into account. The illustration shown in Figure 1 below can be found in the national annex to BS EN 1991-1-3. The norm states the values µ1 = 0.8 and µ2 = 1.2. For the Greenhouse, the “cylindrical” roof goes all the way to the ground, so a form factor of 0 at the roof eaves is not sufficient. On the safe side, a form factor µ = 1,2 on the entire roof is
Anne Bagger ApS Gravertoften 13 Page 3 of 28 DK-2765 Smoerum +45 30 53 35 05
used. Since the roof is especially sensitive to non-uniform loads, a load case is analysed where any part of the roof can be loaded by snow with a form factor µ = 0.8 and the rest by µ = 0. The least favourable load distributions will be analysed.
This yields the following resulting snow loads:
s = 0.5 kN/m2 on the entire roof
s = 0.3 kN/m2 on any part of the roof
Figure 1: Snow form factor for cylindrical roofs
4.3 Wind
According to BS EN 1991-1-4 and the NA, the reference wind speed is 22 m/s. The terrain category is set to II, corresponding to areas with low vegetation and isolated obstacles. With a building height of 3.3 m, a building width of 14.4m and a building depth of 6.4m, this results in a peak velocity pressure of
qp = 0.51 kN/m2
Figure 2: Nomenclature for geometry and form factors
In Figure 2, taken from BS EN 1991-1-4, we have h = 0m, f = 3.3m, d = 6.4m and l = 14.4m. This yields the following form factors, according to the National Annex to BS EN 1991-1-4:
A = +0.8 / -0.5
B = -0.7
C = -0.5
These form factors are valid when areas of more than 10 m2 are considered. For local investigations of the plates, a form factor of cpe,1 = 2.0 is applied.
Anne Bagger ApS Gravertoften 13 Page 4 of 28 DK-2765 Smoerum +45 30 53 35 05
The internal form factors are taken as the least favourable of +0.2 and -0.3.
4.4 Live Load
A characteristic live load of 1.5 kN is considered. This load can be acting at any position on the structure.
4.5 Load combinations
According to BS EN 1990 and the NA the following load combinations apply to the structure, where G is the self-weight, S is snow load, W is wind load, P is live load and “+” denotes “combined with”:
LC1 = 1.25*G “+” 1.50*S “+” 0.75*Wpr “+” 1.05*P
LC2 = 1.25*G “+” 0.75*S “+” 1.50*Wpr “+” 1.05*P
LC3 = 1.00*G “+” 0.00*S “+” 1.50*Wsu “+” 0.00*P
LC4 = 1.25*G “+” 0.75*S “+” 0.75*Wsu “+” 1.50*P
The load combinations above apply to “normal” buildings, for industrial purposes, habitation, etc. The level of safety is considered too high for a light weight green house, and therefore the following reduced load combinations are chosen, and applied in the analysis of the Spaceplates Greenhouse:
LC1 = 1.10*G “+” 1.50*S “+” 0.50*W “+” 0.00*P
LC2 = 1.10*G “+” 0.50*S “+” 1.50*W “+” 0.00*P
LC3 = 1.00*G “+” 0.00*S “+” 1.50*W “+” 0.00*P
LC4 = 1.10*G “+” 0.50*S “+” 0.50*W “+” 1.50*P
If a load is favourable for the stress distribution, it is omitted from the load combination, unless it is the structure’s self-weight. In this case, the partial safety factor on G is set to 1.0.
Anne Bagger ApS Gravertoften 13 Page 5 of 28 DK-2765 Smoerum +45 30 53 35 05
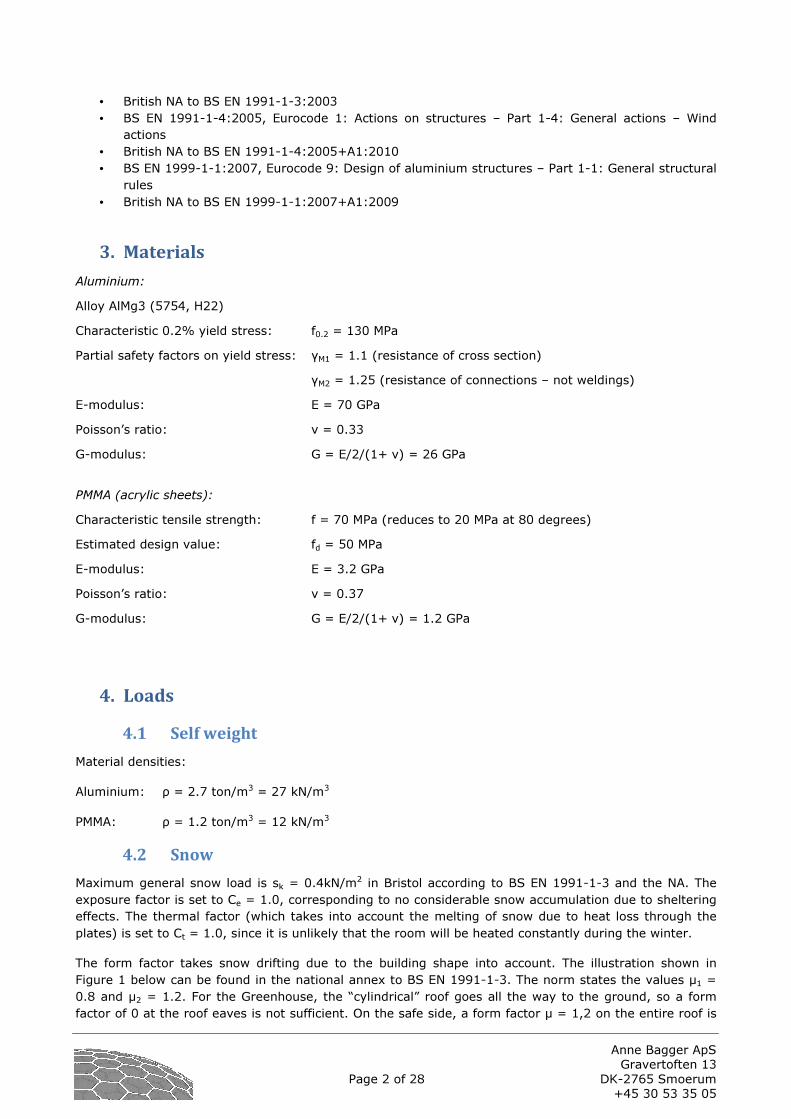
5. Geometry and statical system
The illustrations below are excerpts from the material prepared by N55. The shown tessellation has been slightly altered in the final version of the geometry.
Anne Bagger ApS Gravertoften 13 Page 6 of 28 DK-2765 Smoerum +45 30 53 35 05
–––
Figure 3: Structural drawings by N55
The structure is a plate shell, divided into 5 units of identical height and span. The two end units have one side that goes continuously down to the ground as it appears in section A-A. The two end units also have a door installed. This door, as well as the side that goes to the ground, is assumed to create a better support condition for those two shell sections. The structural analysis therefore mainly focuses on one of the middle sections.
As described in [1], the shell action in a plate shell resembles that of a smooth shell, with some alterations, due to the facetted surface and to the properties of the joints between the plates. In the Spaceplates Greenhouse, the plates are furthermore replaced by frames. Each frame is loaded by external load perpendicular to its surface (mainly from the loaded acrylic plate), and by in-plane loads from the shell-action. The in-plane load will result in in-plane frame action. Since the frames are
Anne Bagger ApS Gravertoften 13 Page 7 of 28 DK-2765 Smoerum +45 30 53 35 05
considerably more flexible than a similar plate without the hole in the middle, the deflections of the greenhouse will be bigger than those of a similar smooth shell or plate shell.
5.1 Overview of analysis
The following structural analysis will be performed for the Spaceplates Greenhouse:
Section 6.1 Linear finite element (FE) analysis of a continuously curved (“smooth”) shell, with the same overall shape as the plate shell. With this model, the general shell behaviour is assessed. Also, it will be shown that it is sufficient to analyse one of the middle sections of the five sections in total.
Section 6.2 Linear FE analysis of a model, where the aluminium frames are modelled. The frames are continuously connected along their edges. Based on this, the largest stresses in the aluminium are determined, and compared to the material’s design strength.
Section 6.3 Analysis of the largest acrylic plate to check local behaviour (bending stresses and deflections).
Section 6.4 Physical test of concentrated load on mock-up, to check local snap through failure.
Section 6.5 Estimation of the structure’s buckling capacity.
Section 6.6 Structural calculations for connections.
To keep the number of load cases down, some simplifications are made:
Uniform loads yield the largest axial in-plane forces in the aluminium, so a load case of maximum vertical load is applied. The maximum vertical load consists of self-weight, snow and negative internal wind pressure (LC1).
Non-uniform loads yield the largest deformations in the structure, the largest frame action in the aluminium frames, and the largest shear forces to be transferred between the frames along their edges. A load case with the largest “non-uniformity” is therefore found and applied; this is a load case with snow on one half of the structure, and external wind load with pressure on one side and suction on the other (LC2).
Finally, a load case with a live load plus some snow and wind load is applied to check the behaviour for a local load (LC4).
LC3, where a maximum uplifting (wind) load is applied, is not considered critical for the structure, and is therefore ignored. Naturally, the fixing of the structure to the ground must be able to resist the uplifting reaction forces – see Section 6.6.
Anne Bagger ApS Gravertoften 13 Page 8 of 28 DK-2765 Smoerum +45 30 53 35 05
6. Structural analysis
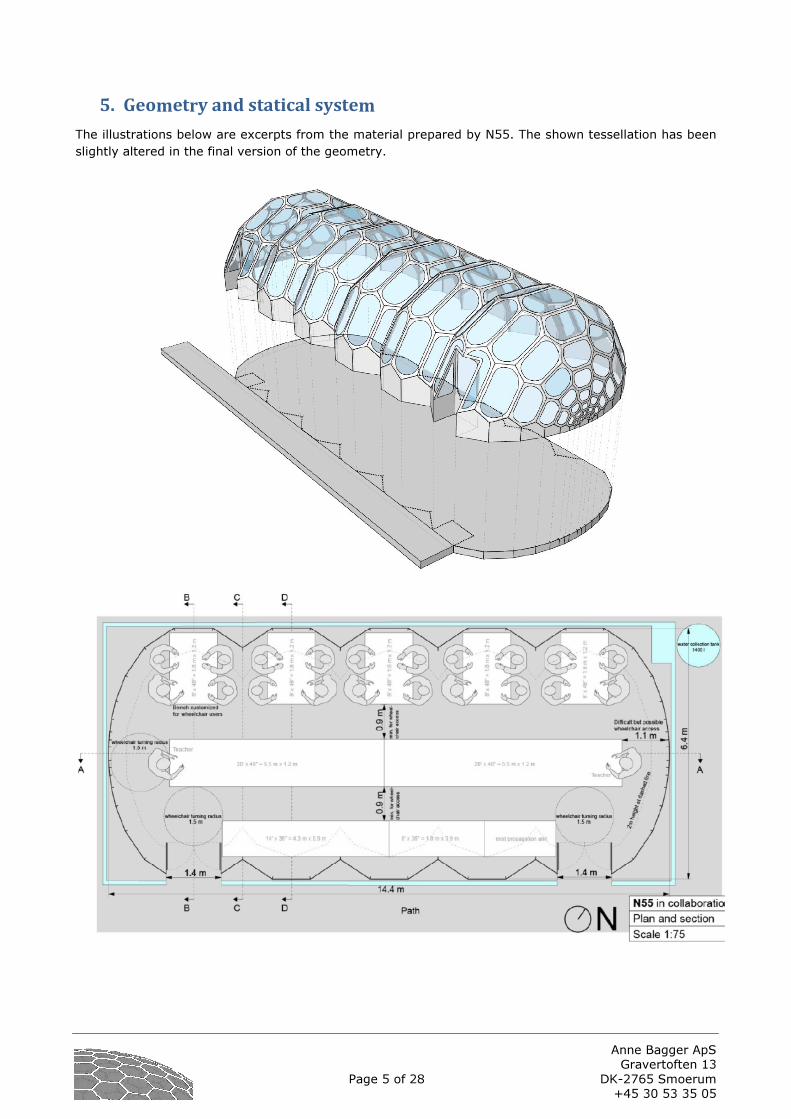
6.1 FE analysis of smooth shell
A “smooth” shell is analysed in the FE software Autodesk Robot Structural Analysis 2011 (Robot). This shell has the same overall shape as the greenhouse, but with a smooth curvature. This model is used for two things:
• To assess the general shell action of the structure. If the smooth shell works well as a shell structure (no significant membrane stress concentrations or bending moments, no large deformations), the plate shell structure will also be structurally sound, considering its general shell performance.
• To show that it is sufficient to analyse one of the middle sections of the five sections in total, given appropriate support conditions. This simplification is made to keep the number of degrees of freedom low, and thereby keep the computation time low.
Figure 4: "Smooth" shell structure
The smooth shell is illustrated in Figure 4. The thickness of the surface is 4 mm, and the material is aluminium. The load is a wind load of 0.41 kN/m2 (pressure) on one half of the structure, and -0.26 kN/m2 (suction) of the other half. Von Mises stresses in the middle of the structure’s surface for characteristic wind load are shown in Figure 5.
The largest stress occurs along the edges between the segments, and the value is 4.3 MPa. The largest stresses in the top of the surface for the same load are shown in Figure 6 – the largest value is 6.4 MPa. Only about 30% of this value comes from bending of the surface – the rest is from the in-plane action, illustrated in Figure 5. Based on these findings, it is concluded that the structure works well as a shell, even for loads that are not optimal for the given shell shape. (The most optimal load for the given shape would be a uniform pressure or suction load, perpendicular to the surface.)
Anne Bagger ApS Gravertoften 13 Page 9 of 28 DK-2765 Smoerum +45 30 53 35 05
Figure 5: Von Mises stresses in the middle of the surface for characteristic wind load.
Figure 6: Von Mises stresses in the top of the surface for characteristic wind load.
Anne Bagger ApS Gravertoften 13 Page 10 of 28 DK-2765 Smoerum +45 30 53 35 05
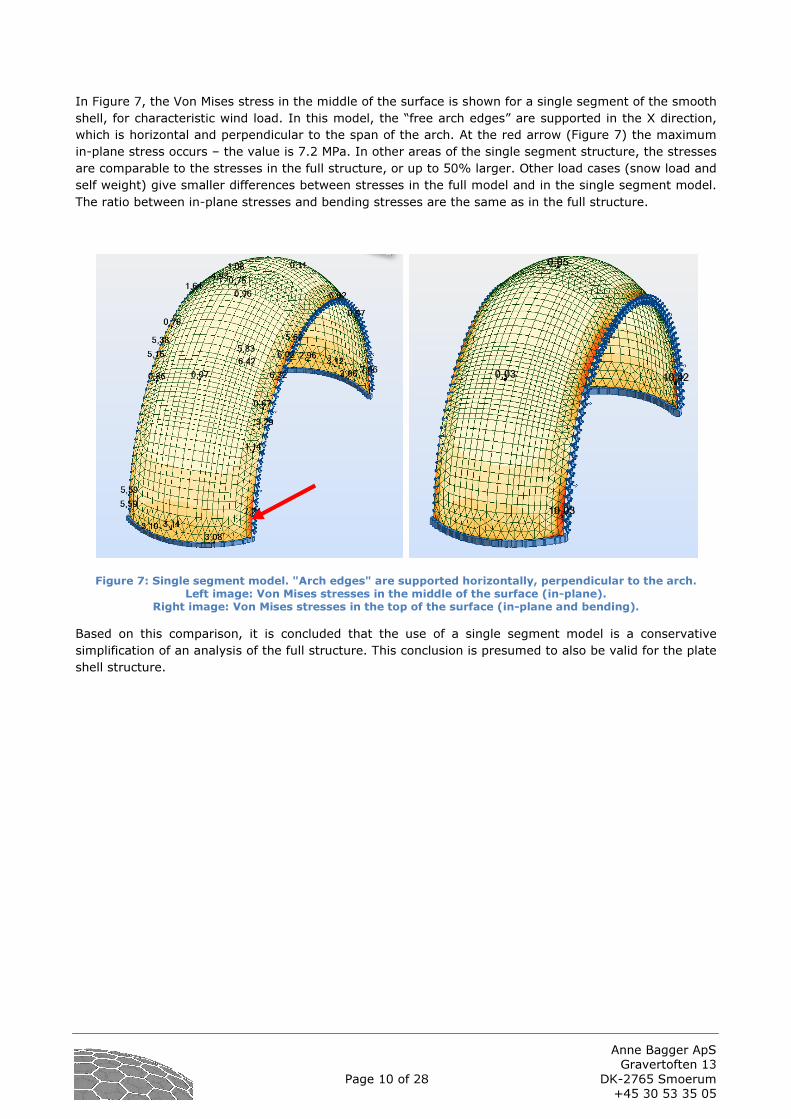
In Figure 7, the Von Mises stress in the middle of the surface is shown for a single segment of the smooth shell, for characteristic wind load. In this model, the “free arch edges” are supported in the X direction, which is horizontal and perpendicular to the span of the arch. At the red arrow (Figure 7) the maximum in-plane stress occurs – the value is 7.2 MPa. In other areas of the single segment structure, the stresses are comparable to the stresses in the full structure, or up to 50% larger. Other load cases (snow load and self weight) give smaller differences between stresses in the full model and in the single segment model. The ratio between in-plane stresses and bending stresses are the same as in the full structure.
Figure 7: Single segment model. "Arch edges" are supported horizontally, perpendicular to the arch.
Left image: Von Mises stresses in the middle of the surface (in-plane).
Right image: Von Mises stresses in the top of the surface (in-plane and bending).
Based on this comparison, it is concluded that the use of a single segment model is a conservative simplification of an analysis of the full structure. This conclusion is presumed to also be valid for the plate shell structure.
Anne Bagger ApS Gravertoften 13 Page 11 of 28 DK-2765 Smoerum +45 30 53 35 05
6.2 FE analysis of plate shell with frames
A single segment of the plate shell structure is modelled in Robot. The plates are modelled with holes where the polycarbonate plates will be located. Thereby, the overall structural system is assumed to consist only of the aluminium frames.
Figure 8: The modelled segment of the plate shell structure with mesh
Load application
In the FE analysis the load has been applied to the aluminium surfaces as a uniformly distributed load, scaled appropriately as explained in the following:
The ratio between the structure’s full surface area (aluminium + acrylic) and the aluminium area is 15.5m2/9.06m2 = 2.71. This implies a simple scaling of the load of 2.71. However, the “true” load distribution is a surface load on the aluminium frames plus a line load on the inner edge of the frames,
Anne Bagger ApS Gravertoften 13 Page 12 of 28 DK-2765 Smoerum +45 30 53 35 05
balancing the reactions from the polycarbonate plates. This load distribution differs from the distribution modelled in the FE analysis, where the aluminium is simply loaded by a scaled load. To investigate the difference, a test load case was modelled in two ways; as a distributed load on the aluminium frames, and as a surface load plus a line load on the inner edges. (The line load on a given edge was chosen so that the resultant was equal to the surface load times the area of the hole). The difference in reactions was a factor 2.71, as expected. The difference in the stresses varied between a factor 2.5 and 2.9. Based on this, all load cases are modelled as a surface load on the aluminium frames, scaled by a factor 3 relative to the “real” load value.
Results
The following images show the Von Mises stresses in the structure for the various characteristic loads; self weight, full snow load, snow load on half of the structure, wind load (where A / B / C = +0.8 / -0.7 / -0.5), and internal pressure (negative value).
The plots in Figure 9 to Figure 14 show the stresses in the centre of the surface, i.e. the in-plane stresses, and the deflections. This structural action is the overall stabilizing system.
The plots in Figure 15 to Figure 20 show the stresses in the upper or lower surface, i.e. the sum of in-plane stresses and bending stresses. The bending stresses are partly from local bending action in the frames (which takes the load on the frame to the frame’s connections with the surrounding frames), and partly bending stresses that occur because of the shape changes in the structure (comparable to the bending stresses in the smooth shell, investigated in Figure 7).
Anne Bagger ApS Gravertoften 13 Page 13 of 28 DK-2765 Smoerum +45 30 53 35 05
Figure 9: Self weight. Top: Von Mises stresses in middle of the surface. Bottom: Deflections.
Anne Bagger ApS Gravertoften 13 Page 14 of 28 DK-2765 Smoerum +45 30 53 35 05
Figure 10: Wind load. Top: Von Mises stresses in middle of the surface. Bottom: Deflections.
Anne Bagger ApS Gravertoften 13 Page 15 of 28 DK-2765 Smoerum +45 30 53 35 05
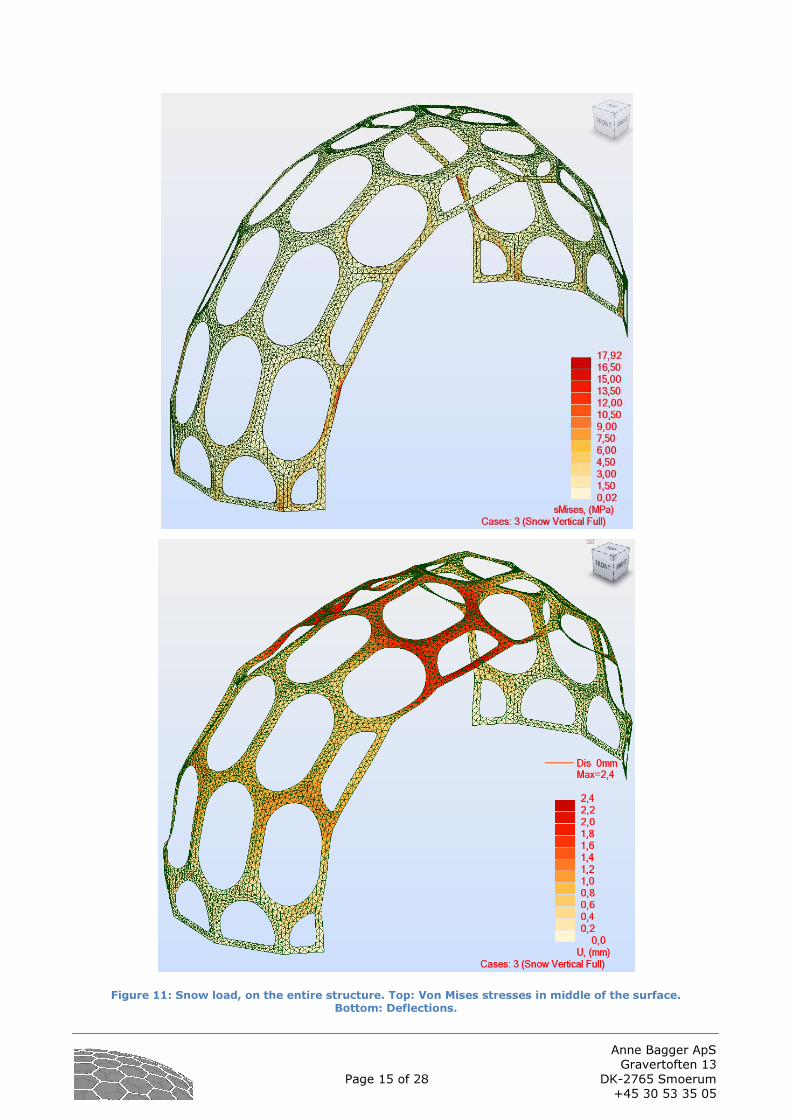
Figure 11: Snow load, on the entire structure. Top: Von Mises stresses in middle of the surface.
Bottom: Deflections.
Anne Bagger ApS Gravertoften 13 Page 16 of 28 DK-2765 Smoerum +45 30 53 35 05
Figure 12: Snow load, on half of the structure. Top: Von Mises stresses in middle of the surface.
Bottom: Deflections.
Anne Bagger ApS Gravertoften 13 Page 17 of 28 DK-2765 Smoerum +45 30 53 35 05
Figure 13: Live load, 1.5 kN concentrated load. Top: Von Mises stresses in middle of the surface.
Bottom: Deflections.
Anne Bagger ApS Gravertoften 13 Page 18 of 28 DK-2765 Smoerum +45 30 53 35 05
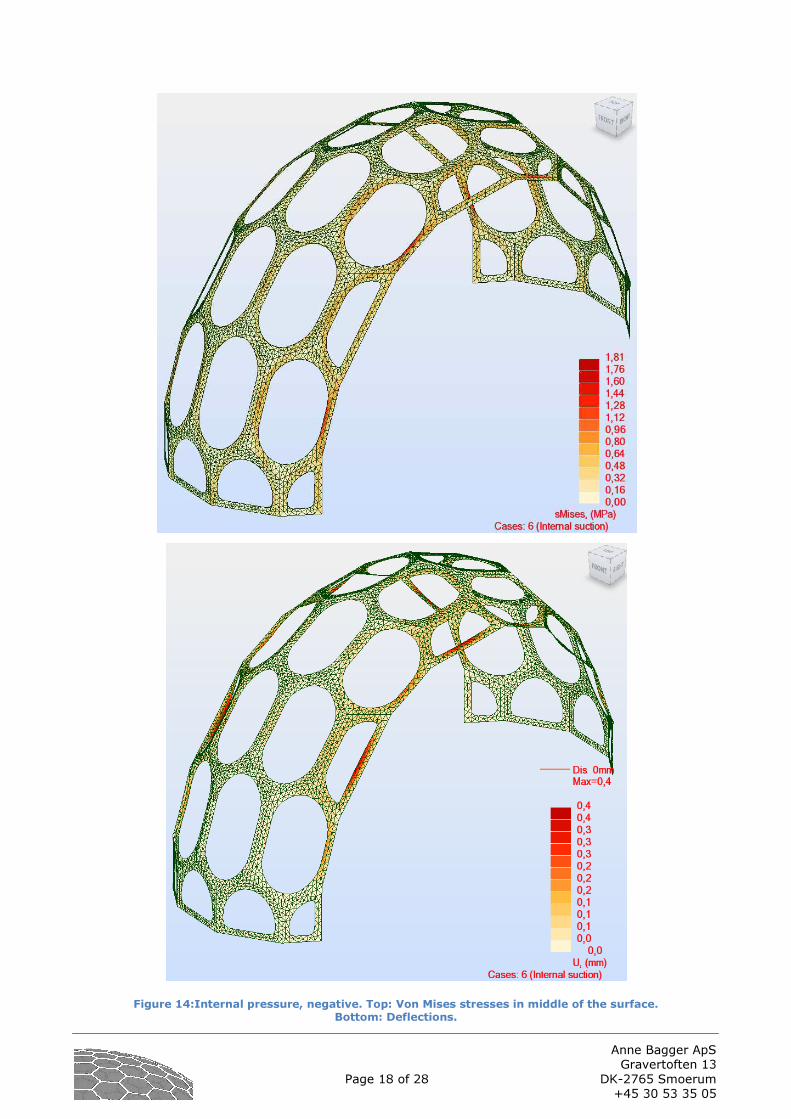
Figure 14:Internal pressure, negative. Top: Von Mises stresses in middle of the surface.
Bottom: Deflections.
Anne Bagger ApS Gravertoften 13 Page 19 of 28 DK-2765 Smoerum +45 30 53 35 05
The following plots show the stresses in the upper or lower surface or the frames, whichever has the largest value. These stresses include both in-plane action and bending action in the frames. A few elements have been excluded from the plots, because of false stress concentrations in these areas. See page 22 and Figure 21 for further explanation.
Figure 15: Self weight. Von Mises stresses in upper surface. Max value 4.4 MPa.
Figure 16: Wind load. Von Mises stresses in lower surface. Max value 37.4 MPa.
Anne Bagger ApS Gravertoften 13 Page 20 of 28 DK-2765 Smoerum +45 30 53 35 05
Figure 17: Snow load, on the entire structure. Von Mises stresses in upper surface. Max value 19.8 MPa.
Figure 18: Snow load, on half of the structure. Von Mises stresses in lower surface. Max value 13.8 MPa.
Anne Bagger ApS Gravertoften 13 Page 21 of 28 DK-2765 Smoerum +45 30 53 35 05
Figure 19: Live load, 1.5 kN. Von Mises stresses in lower surface. Max value 19.3 MPa.
Figure 20:Internal pressure, negative. Von Mises stresses in lower surface. Max value 4.0 MPa.
False bending stress concentrations
Some of the bending stresses found in the FE analysis stem from an imperfect geometric representation of the plane-based geometry in the FE model. In the original 3d model of the geometry (a Rhino-file), some surfaces did not meet perfectly in the vertices. To construct a coherent element mesh, some nodes had to be defined with a small offset relative to the frames’ surface. The resulting kinks in the surfaces
Anne Bagger ApS Gravertoften 13 Page 22 of 28 DK-2765 Smoerum +45 30 53 35 05
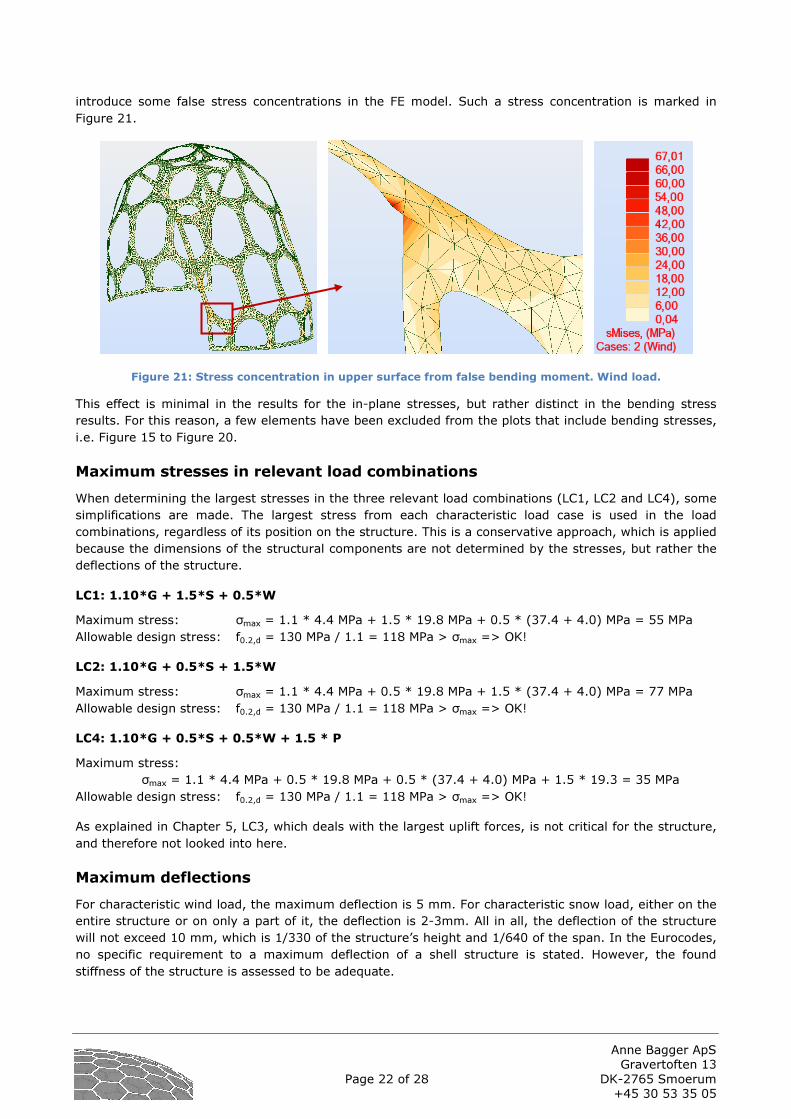
introduce some false stress concentrations in the FE model. Such a stress concentration is marked in Figure 21.
Figure 21: Stress concentration in upper surface from false bending moment. Wind load.
This effect is minimal in the results for the in-plane stresses, but rather distinct in the bending stress results. For this reason, a few elements have been excluded from the plots that include bending stresses, i.e. Figure 15 to Figure 20.
Maximum stresses in relevant load combinations
When determining the largest stresses in the three relevant load combinations (LC1, LC2 and LC4), some simplifications are made. The largest stress from each characteristic load case is used in the load combinations, regardless of its position on the structure. This is a conservative approach, which is applied because the dimensions of the structural components are not determined by the stresses, but rather the deflections of the structure.
As explained in Chapter 5, LC3, which deals with the largest uplift forces, is not critical for the structure, and therefore not looked into here.
Maximum deflections
For characteristic wind load, the maximum deflection is 5 mm. For characteristic snow load, either on the entire structure or on only a part of it, the deflection is 2-3mm. All in all, the deflection of the structure will not exceed 10 mm, which is 1/330 of the structure’s height and 1/640 of the span. In the Eurocodes, no specific requirement to a maximum deflection of a shell structure is stated. However, the found stiffness of the structure is assessed to be adequate.
Anne Bagger ApS Gravertoften 13 Page 23 of 28 DK-2765 Smoerum +45 30 53 35 05
6.3 Structural analysis of acrylic plate
The largest acrylic plate is shown in Figure 22 (blue area). The plate is 5 mm thick, and simply supported on the aluminium edge via an EPDM profile.
Using the expressions for plate deflections in the Danish “Teknisk StåBi” (1999), we get:
D = Et3 / (12*(1-ν2))
= 3200 * 53 / (12*(1-0.372))
= 38.6*103 Nmm
umax = α * qlx4 / D
= 0.008 * 1.1*10-3 * 6464 / (38.6*103)
= 40 mm
where the material parameters are taken from Chapter 2, the plate thickness is t = 5mm, and α is found in “Teknisk StåBi” for ly/lx = 1.6. The load is set to 1.1 kN/m2, corresponding to local wind action (form factor 2.0), plus self weight of the plate.
The calculation above assumes small deflections, but since umax >> t, geometric non-linearity will set in and reduce the deflection significantly. To assess the deflection when including non-linear behaviour, expressions in Timoshenko’s “Theory of Plates and Shells” (1959) are used (p. 422, Fig. 208):
This value falls outside the graph in Fig. 208, but it is clear that the deflection will be highly dependent on non-linear behaviour. The actual plate deflection will therefore be significantly lower than 40 mm. It will more likely be 15-20 mm, which is also a large deflection for a plate of this size (1/40 – 1/30 of the plate’s side length).
646 mm
1247 mm
Figure 22: Largest acrylic plate.
Anne Bagger ApS Gravertoften 13 Page 24 of 28 DK-2765 Smoerum +45 30 53 35 05
6.4 Physical load tests on mock-up
The critical issue is whether this deflection will cause the plate to fall out of the EPDM profile it is supported in. A physical test has been carried out to assess the risk of this. 75 kg was placed on the largest plate. If the load had been perfectly evenly distributed, this would correspond to 1kN/m2. However, the applied load was concentrated more at the centre of the plate than towards the edges, so the actual load induced greater deflections than a uniformly distributed load of 1kN/m2.
Figure 23: Physical load test of the largest plate.
The visible deflection of the plate was 1-2 cm. After about a minute with the maximum load applied, the plate fell out. This behaviour is considered acceptable for the following reasons:
• This type of failure is not critical for the structure’s load bearing capacity. • The acrylic plate is relatively light (less than 3 kg) and therefore unlikely to cause any significant
damage if falling out of the structure. • The highest load on the plate will be wind gusts, acting for a short period of time. The EPDM-
profile has a time dependent behaviour, resulting in some delay of the failure at the tested load level.
6.5 Estimation of buckling capacity
Global buckling
Generally, buckling is not expected to be a critical issue with the present plate shell structure, as it is not a shallow shell, but has a relatively sharp curvature.
It has not been possible to make useful non-linear calculations of the plate shell structure in Robot. Instead, an empirical formula in Timoshenko’s “Theory of elastic stability” (1963) is used to give a raw estimate of the buckling capacity of the structure. Said Timoshenko formula (page 518) is based on experiments with thin spherical shells subjected to uniform external pressure. The values found with this formula are much lower than the analytical expressions (see the same book), as small deviations in the geometry, loads and material properties reduces the buckling capacity significantly.
The empirical formula in “Theory of elastic stability” states:
Here, θ is the opening angle of the sphere segment, a is the sphere radius, h is the shell thickness and qcr is the buckling load. Of course, the present plate shell structure is geometrically quite far from the smooth spherical shell covered by the equation above, but it still gives an idea of the region the buckling load must be in. The spherical shape used in the above calculation has a radius of 4 meters and an opening angle of 49 deg., corresponding to a spherical cap with a cut plane radius of 3 meters, and a cap height of 2.6 meters. Assuming that the buckling shape of the plate shell will only affect one segment of the structure, and that the sharp change of curvature where the segments meet will stiffen this area, the analysed spherical shell shape yields conservative results. Also, the uniform external pressure load is more conservative than the worst load case on the plate shell, which will be dominated by vertical load from snow. On the other hand, the plate shell is not continuously 4 mm thick (because of the holes in the frames), and the geometry is not smoothly curved, but facetted.
All in all, the calculation above is assessed to provide a conservative value of the plate shell structure’s buckling load. The calculated capacity is about 15 times greater than the largest vertical load on the plate shell.
Based on the estimations above, the plate shell structure’s global buckling load capacity is considered adequate.
Local buckling
Two cases of local buckling are investigated. A case where the compressed aluminium frame parts buckle locally, and a case where a concentrated live load causes a vertex to snap-through.
The compressed aluminium part consists of two connected frame parts, and has a cross-section as shown in Figure 24.
Figure 24: Compressed aluminium part.
Anne Bagger ApS Gravertoften 13 Page 26 of 28 DK-2765 Smoerum +45 30 53 35 05
The cross sectional values are:
A = 1.1*103 mm2
Iy = 278*103 mm4
Wy = 6.71*103 mm3
iy = (Iy/A)½ = 16 mm
According to EN1999-1-1 we have
Nb,Rd = κ*χ*Aeff / γM1
where κ = 1 (effects from welding), Aeff = A (since local plate buckling does not occur in the cross section), and χ is as determined in the following:
λ � �����∗������
� ���� ∗ �
� �
���
� �� �� ∗ �
������
�
� 0.82
Buckling class B according to table 3.2a. From Figure 6.11, λ = 0.82, class B, we get χ = 0.63.
The bending moment in the profile is estimated as follows:
M = 1/8 * (0.8m * 1.6kN/m2) * (1,0m)2 = 0.16kNm
σbending = M/W = 24MPa
The load carrying capacity is sufficient if the following proposition is true:
���� ,��������
�∗��∗��� ��� �
�.�� ���� ,�������
��∗��� ��� �
�.�� 1
⇒ ��
�.��∗�∗��� �.�� ��.� � ���∗��� �.�� ��.� � 1
⇒0.63 1
The load carrying capacity of the aluminium profile with respect to buckling is sufficient.
Anne Bagger ApS Gravertoften 13 Page 27 of 28 DK-2765 Smoerum +45 30 53 35 05
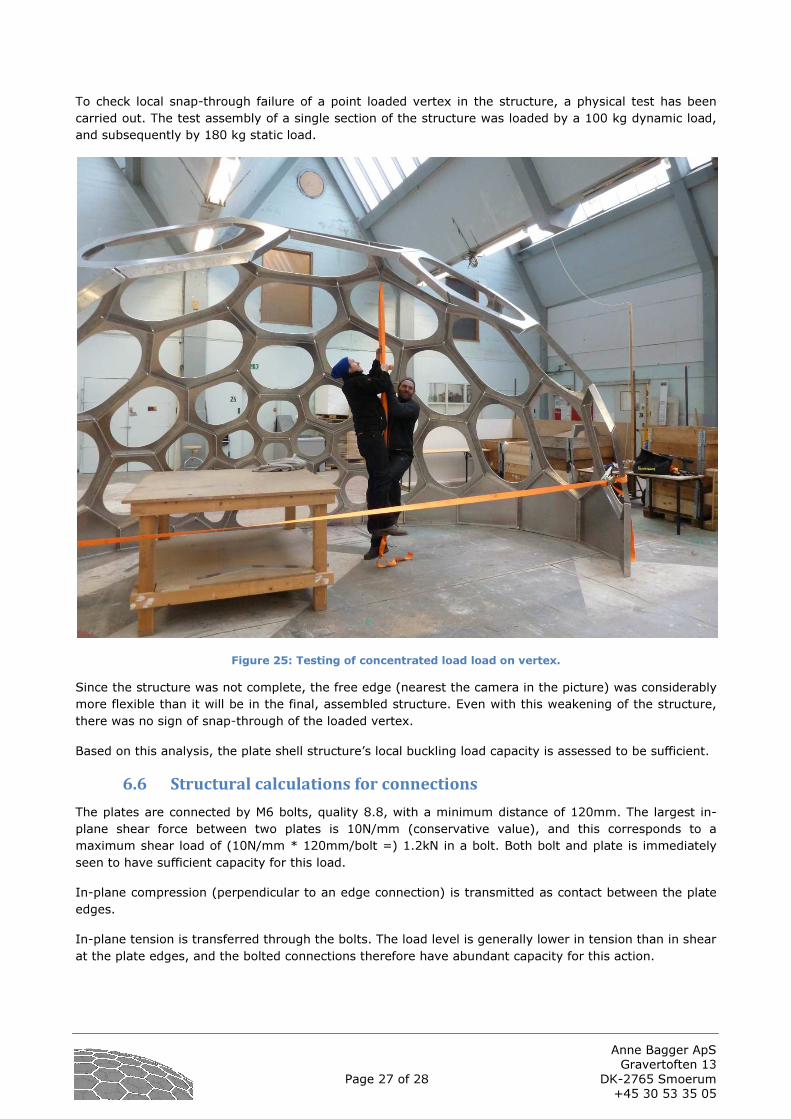
To check local snap-through failure of a point loaded vertex in the structure, a physical test has been carried out. The test assembly of a single section of the structure was loaded by a 100 kg dynamic load, and subsequently by 180 kg static load.
Figure 25: Testing of concentrated load load on vertex.
Since the structure was not complete, the free edge (nearest the camera in the picture) was considerably more flexible than it will be in the final, assembled structure. Even with this weakening of the structure, there was no sign of snap-through of the loaded vertex.
Based on this analysis, the plate shell structure’s local buckling load capacity is assessed to be sufficient.
6.6 Structural calculations for connections
The plates are connected by M6 bolts, quality 8.8, with a minimum distance of 120mm. The largest in-plane shear force between two plates is 10N/mm (conservative value), and this corresponds to a maximum shear load of (10N/mm * 120mm/bolt =) 1.2kN in a bolt. Both bolt and plate is immediately seen to have sufficient capacity for this load.
In-plane compression (perpendicular to an edge connection) is transmitted as contact between the plate edges.
In-plane tension is transferred through the bolts. The load level is generally lower in tension than in shear at the plate edges, and the bolted connections therefore have abundant capacity for this action.
Anne Bagger ApS Gravertoften 13 Page 28 of 28 DK-2765 Smoerum +45 30 53 35 05
The structure is connected to the underlying concrete slab by MEA/Apolo SFA 8 Schlaganker, size M10. Referring to MEA’s homepage, the characteristic pull-out strength of these anchors is set to 17kN, and the design value to 17kN/2.1 = 8kN. This information was found here: http://www.mea-group.com/fileadmin/MEA/Produkte/meaProdDB/output/download/256_3_DE.pdf
The anchors are placed with a minimum distance of 0,5m, which yields the following strength pr. m:
8kN/bolt / 0.5m/bolt = 16kN/m
The largest tension from the wind is conservatively (not including the structure’s selfweight)
1.5 * (0.7+0.2) * 0.51kN/m2 * 3.2m = 2.2kN/m
The anchors are thereby shown to have sufficient capacity.