+ All Categories
Home > Documents > Space product assurance -...

Space product assurance -...

Date post: 29-Mar-2020
Category:
Upload: others
View: 11 times
Download: 2 times
Share this document with a friend
101
ECSS-Q-HB-80-04A 30 March 2011 Space product assurance Software metrication programme definition and implementation ECSS Secretariat ESA-ESTEC Requirements & Standards Division Noordwijk, The Netherlands
Transcript

ECSS-Q-HB-80-04A 30 March 2011

Space product assurance Software metrication programme definition and implementation


ECSS Secretariat ESA-ESTEC

Requirements & Standards Division Noordwijk, The Netherlands

ECSS‐Q‐HB‐80‐04A  

30 March 2011 

Foreword 

This Handbook is one document of the series of ECSS Documents intended to be used as supporting 

material  for ECSS Standards  in  space projects  and applications. ECSS  is a  cooperative  effort of  the 

European Space Agency, national space agencies and European industry associations for the purpose 

of developing and maintaining common standards. 

The  material  in  this  Handbook  is  defined  in  terms  of  description  and  recommendation  how  to 

organize and perform the work of setting up and implementing a metrication programme that can be 

applied to space software projects. It does not provide, however, a detailed and exhaustive definition 

of all possible metrics that can be selected as part of the metrication programme.  


This Handbook has been prepared by the ECSS‐Q‐HB‐80‐04 Working Group, reviewed by the ECSS 

Executive Secretariat and approved by the ECSS Technical Authority. 


With permission from NEN (Dutch Standardization Institute – www.nen.nl) representing ISO  in the 

Netherlands,  this handbook  contains  extracts  from  ISO 15939:2007, adapted  for  the purpose of  this 

document.  

NOTE:   The extracts are highlighted with grey  shaded background and cross‐reference  to  the  ISO 

clause done in a footnote. 

Disclaimer 

ECSS does not provide any warranty whatsoever, whether expressed, implied, or statutory, including, 

but not limited to, any warranty of merchantability or fitness for a particular purpose or any warranty 

that  the  contents  of  the  item  are  error‐free.  In  no  respect  shall  ECSS  incur  any  liability  for  any 

damages, including, but not limited to, direct, indirect, special, or consequential damages arising out 

of, resulting from, or in any way connected to the use of this document, whether or not based upon 

warranty, business agreement, tort, or otherwise; whether or not injury was sustained by persons or 

property or otherwise; and whether or not loss was sustained from, or arose out of, the results of, the 

item, or any services that may be provided by ECSS. 

Published by:   ESA Requirements and Standards Division 

  ESTEC, P.O. Box 299, 

  2200 AG Noordwijk 

  The Netherlands 

Copyright:   2011© by the European Space Agency for the members of ECSS 

ECSS‐Q‐HB‐80‐04A  

30 March 2011 

Change log

ECSS‐Q‐HB‐80‐04A 

30 March 2011 

First issue 


ECSS‐Q‐HB‐80‐04A  

30 March 2011 

Table of contents

Change log .................................................................................................................3

Introduction................................................................................................................7

1 Scope.......................................................................................................................9

2 References ............................................................................................................10

3 Terms, definitions and abbreviated terms..........................................................13

3.1 Terms from other documents ...................................................................................13

3.2 Definitions in other clauses of the present HB .........................................................13

3.3 Terms specific to the present document ..................................................................13

3.4 Abbreviated terms ....................................................................................................14

4 Overview of the Handbook ..................................................................................15

4.1 Introduction...............................................................................................................15

4.2 Relation to other ECSS Standards...........................................................................16

4.2.1 General.......................................................................................................16

4.2.2 Software engineering..................................................................................16

4.2.3 Software product assurance.......................................................................16

4.2.4 Project management ..................................................................................17

5 A reference software quality model ....................................................................18

5.1 Introduction...............................................................................................................18

5.2 Reference software quality model ............................................................................19

5.3 Tailoring the metrication programme........................................................................24

5.4 Detailed tailoring guidelines .....................................................................................27

6 Measurement process..........................................................................................30

6.1 Introduction...............................................................................................................30

6.2 Planning of metrication in the development life cycle...............................................31

6.2.1 Characterize the project quality requirements and select the metrics to be collected ............................................................................................31

6.2.2 Define data collection and analysis procedures .........................................31

ECSS‐Q‐HB‐80‐04A  

30 March 2011 

6.2.3 Define criteria for validating the metrics and the measurement process .......................................................................................................32

6.2.4 Define resources and infrastructure for measurement tasks......................33

6.2.5 Define how reporting will be performed ......................................................33

6.2.6 Review and approve the measurement plan ..............................................33

6.2.7 Provide resources and infrastructure for measurement tasks ....................34

6.3 Data collection..........................................................................................................34

6.3.1 Integrate procedures ..................................................................................34

6.3.2 Collect data.................................................................................................35

6.4 Data validation..........................................................................................................35

6.5 Data analysis............................................................................................................35

6.6 Data archiving ..........................................................................................................36

6.7 Reporting..................................................................................................................36

6.8 Feedback to the measurement process ...................................................................37

6.8.1 Evaluate analysis results and the measurement process ..........................37

6.8.2 Identify potential improvements..................................................................39

Annex A Definition of the quality model................................................................40

A.1 General introduction .................................................................................................40

A.2 Characteristics and sub-characteristics definition ....................................................40

A.2.1 Functionality ...............................................................................................40

A.2.2 Reliability ....................................................................................................41

A.2.3 Maintainability.............................................................................................41

A.2.4 Reusability ..................................................................................................42

A.2.5 Suitability for safety ....................................................................................42

A.2.6 Security.......................................................................................................43

A.2.7 Usability ......................................................................................................43

A.2.8 Software development effectiveness..........................................................44

A.3 List of proposed metrics ...........................................................................................44

A.3.1 Introduction.................................................................................................44

A.3.2 Standard metric template ...........................................................................45

A.3.3 Detailed description of all metrics...............................................................47

A.4 List of proposed OO metrics.....................................................................................97

A.4.1 Introduction.................................................................................................97

A.4.2 Detail description of the proposed OO metrics...........................................97


ECSS‐Q‐HB‐80‐04A  

30 March 2011 

Figures

Figure 4-1:Organization of this document ..............................................................................15

Figure 5-1: Elements of the software quality model ...............................................................20

Figure 6-1: Metrication process activities ...............................................................................30

Figure A-1 : Example of report format for requirements allocation.........................................48

Figure A-2 : Example of SPR/NCR trend analysis .................................................................53

Figure A-3 : Example of cyclomatic complexity......................................................................61

Figure A-4 : Example of nesting level.....................................................................................63

Figure A-5 : Sample of requirements stability ........................................................................94

Figure A-6 : Sample of RID/action status ...............................................................................95

Figure A-7 : Sample of V&V progress ....................................................................................96


Tables

Table 5-1: Proposed reference quality model ........................................................................22

Table 5-2: Applicability of the metrics depending on the criticality category ..........................25

Table 5-3: Target value for metric depending on criticality category......................................26

Table A-1 : Example of V&V coverage reporting....................................................................51

Table A-2 : Example of summary of NCR-SPR recorded ......................................................52

Table A-3 : Sample checklist for Suitability of development documentation ..........................55

Table A-4 : Checklist for process reliability adequacy............................................................71

Table A-5 : Test coverage requirements ................................................................................74

Table A-6 : Sample checklist for reusability checklist.............................................................78

Table A-7 : Sample checklist for safety activities adequacy...................................................82

Table A-8 : Checklist for security checklist.............................................................................84

Table A-9 : Checklist for User manual suitability....................................................................88


ECSS‐Q‐HB‐80‐04A  

30 March 2011 

Introduction

This Handbook  describes  the  approach  to  be  taken  for  the  definition  and  implementation  of  an 

effective and efficient metrication programme for the development of software in a space project. 

This Handbook  provides  guidelines  and  examples  of  software metrics  that  can  be  used  in  space 

system developments,  in  line with the requirements defined by [ECSS‐E‐40] and [ECSS‐Q‐80], given 

guidelines and examples to provide a coherent view of the software metrication programme definition 

and implementation. 

This Handbook is intended to help customers in formulating their quality requirements and suppliers 

in preparing  their  response and  implementing  the work. This Handbook  is not  intended  to  replace 

textbook material on computer science or technology and software metrics, so repeating such material 

is avoided in this Handbook. The readers and users of this Handbook are assumed to posse’s general 

knowledge of computer science and software engineering. 

In space projects, the demand of high quality software to be developed within allocated budget and 

time is a priority objective, particularly in presence of dependability requirements. Also the size of the 

operational  software  has  increased  significantly  due  to  the  increase  in  functionality  to  allow  new 

challenging missions and to reply to increasingly sophisticated and demanding user requirements. 

The space software development is therefore characterized by: 

High dependability of the software products, in both space and ground segments; 

Stringent schedule and cost estimates  that are more and more accurate  to enable reliable cost 

estimates for the overall project; 

Demand of high quality software, and 

Increasing productivity requirements. 

To  improve,  suppliers  should know what  can be done better, and also what  to  look at  in order  to 

understand where lessons learnt can be applied to support the improvement. 

Measurements are the only way to quantitatively assess the quality of a process or a product. 

In presence of complex software projects reliable measures of both processes and products provide a 

powerful  tool  to  software management  for  keeping  the project  in  track  and preserve  the  intended 

quality of the software product. Improvement of both the space software product and its development 

processes depends upon improved ability to identify, measure, and control essential parameters that 

affect software product and  its development processes. This  is  the goal of any software metrication 

programme. 

The main reasons for measuring software processes and products are: 

To characterize the existing processes and the status of products under development or 

operations, in order to gain a better understanding and support the overall verification of 

the  software,  as well  as  to  acquire  data/information  for  future  assessments  of  similar 

processes/products. 

ECSS‐Q‐HB‐80‐04A  

30 March 2011 

To evaluate the status of the project to determine its status and possible deviation from 

the  established  plans,  and  to  support  identification  of  actions  to  bring  it  back  under 

control; the evaluation includes an assessment of an achievement of quality goals and an 

assessment  of  the  impacts  of  technology  and  process  improvements  on  products  and 

processes. 

To predict, with the aim to improve the ability to plan. Measuring for prediction involves 

gaining  understanding  of  relationships  among  processes  and  products  and  building 

models of these relationships, so that the observed values for some attributes can be used 

to predict others. The  reason  for  that  is  to establish achievable goals  for cost, schedule, 

and quality—so that appropriate resources can be applied. Predictive measures are also 

the basis for extrapolating trends, so estimates for cost, time, and quality can be updated 

based on current evidence. Projections and estimates based on historical data also help to 

analyse risks and make design/cost tradeoffs. 

To improve. Gathering quantitative information helps to identify roadblocks, root causes, 

inefficiencies,  and  other  opportunities  for  improving  product  quality  and  process 

performance. Measures also help to plan and track improvement efforts. 

Measures of current performance give baselines to compare against, so that it can be possible to judge 

whether or not  the  improvement actions are working as  intended and what  the side effects can be. 

Good measures also help to communicate goals and convey reasons for improving. This helps engage 

and focus the support of those who work within the processes to make them successful. 

ECSS‐Q‐HB‐80‐04A  

30 March 2011 

1 Scope

The scope of this Handbook is the software metrication as part of a space project, i.e. a space system, a 

subsystem  including  hardware  and  software,  or  ultimately  a  software  product.  It  is  intended  to 

complement  the  [ECSS‐Q‐80] with  specific  guidelines  related  to  use  of  different  software metrics 

including  their  collection,  analysis  and  reporting. Tailoring  guidelines  for  the  software metrication 

process are also provided to help to meet specific project requirements. 

This  Handbook  provides  recommendations,  methods  and  procedures  that  can  be  used  for  the 

selection  and  application  of  appropriate metrics,  but  it  does  not  include  new  requirements with 

respect to those provided by ECSS‐ST‐Q‐80C Standard. 

The scope of this Handbook covers the following topics: 

Specification of the goals and objectives for a metrication programme. 

Identification of criteria for selection of metrics in a specific project / environment (goal driven). 

Planning of metrication in the development life cycle. 

Interface of metrication with engineering processes. 

Data collection aspects (including use of tools). 

Approach to the analysis of the collected data. 

Feedback into the process and product based on the analysis results. 

Continuous improvement of measurement process. 

Use of metrics for process and product improvement. 

This Handbook is applicable to all types of software of all major parts of a space system, including the 

space segment, the launch service segment and the ground segment software. 


ECSS‐Q‐HB‐80‐04A  

30 March 2011 

2 References

For  each  document  or  Standard  listed,  a  mnemonic  (used  to  refer  to  that  source  throughout  this 

document) is proposed in the left side, and then the complete reference is provided in the right one. 


ECSS Standards 

[ECSS‐S‐ST‐00‐01]  ECSS‐S‐ST‐00‐01C, ECSS ‐ Glossary of terms 

[ECSS‐Q‐80]  ECSS‐Q‐ST‐80C, Space Product Assurance – Software Product Assurance   

[ECSS‐E‐40]  ECSS‐E‐ST‐40C, Space Engineering – Software 

ISO/IEC Standards 

ISO 9126  ISO/IEC 9126 Software engineering ‐ Product quality, Parts 1 to 4 (complete 

series) 

ISO 9126‐1  ISO/IEC 9126‐1:2001 Part 1: Quality model 

ISO 9126‐2  ISO/IEC TR 9126‐2:2003 Part 2: External metrics 

ISO 9126‐3  ISO/IEC TR 9126‐3:2003 Part 3: Internal metrics 

ISO 9126‐4  ISO/IEC TR 9126‐4:2004 Part 4: Quality in use metrics 

ISO 12207  ISO/IEC 12207:2008 Information Technology ‐ Software life cycle processes.  

ISO 14143   ISO/IEC 14143 Information technology ‐ Software measurement, Parts 1 to 6 

(complete series) 

ISO 14598  ISO/IEC 14598 Software engineering ‐ Product evaluation, Parts 1 to 6 (complete 

series) 

ISO 14598‐1  ISO/IEC 14598‐1:1999 Part 1: General overview 

ISO 24765  ISO/IEC 24765, Systems and Software Engineering Vocabulary  

ISO 15939   ISO/IEC 15939:2007 Software Engineering ‐ Software Measurement Process 

ISO 17799  ISO/IEC 17799:2005 Information technology ‐ Code of practice for information 

security management 

ISO 25000  ISO/IEC 25000:2005 Ed. 1 Software Engineering ‐ Software product Quality 

Requirements and Evaluation (SQuaRE) ‐ Guide to SQuaRE 

Other ESA documents 

SPEC  ESTEC Contract No. 12650/97/NL/NB(SC) ‐ SPEC – Software Product Evaluation 

and Certification (complete series) 

SPEC‐I  ESTEC Contract No. 20421/06/NL/PA ‐ SPEC Method Improvement 

SPEC‐I‐QM  SPEC/QM SPEC Method improvement ‐ Quality Model – Issue 1.F 

SPEC‐I‐TN1  SPEC‐I/TN1 SPEC Analysis results ‐ Issue 1.F 

10 

ECSS‐Q‐HB‐80‐04A  

30 March 2011 

SPEC‐I ‐TN2  SPEC‐I/TN2 Concept for Space Software Product Evaluation for Conformity 

WP4 ‐ part 2‐  Issue 3.B 

SPEC‐I –TN3  SPEC‐I/TN3 Concept for Space Software Product Evaluation for Conformity 

WP4 ‐ part 3‐  Issue 3.2 

SPEC‐TN3  SPEC/TN3 Space Domain Specific Software Product Quality Models, 

Requirements and Related Evaluation Methods ‐ Issue 3.4 

SPEC‐TN4.1   SPEC/TN4 part 1 Overview of existing software certification schemes ‐ Issue 2 

SPEC‐TN4.2  SPEC/TN4 part 2 Concept for Space Software Product Evaluation and 

Certification ‐ Issue 2 

SPEC‐TN4.3  SPEC/TN4  part 3 Concept for Space Software Product Evaluation and 

Certification ‐ Issue 2 

Reports and articles 

CHALMERS  Chalmers University of Technology Presentation ‐ Department of Computer 

Engineering ‐ Dependability and Security Modelling and Metrics 

EADS‐ST  Astrium‐ST‐ Astrium ST internal documents 

FENTON  “Software Metrics ‐ A Rigorous & Practical Approach” (second edition) 

Norman E. Fenton, Shari Lawrence Pfleeger 

NASA‐1740  NSS 1740.13 “NASA Software Safety Standard” February 1996 

NASA‐8719  NASA‐STD‐8719.13A Software Safety, 15 September 1997 

NIAC   Common Vulnerability Scoring System ‐ Final Report and Recommendations by 

the Council, 12 October 2004 

NIST‐1   NIST and Federal Computer Security Program Managers Forum IT 

Security Metrics Workshop ‐ A Practical Approach to Measuring Information 

Security: Measuring Security at the System Level, 21 May 2002 

NIST‐2   NIST Special Publication 800‐55 

Security Metrics Guide for Information Technology Systems, July 2003 

NIST‐3   NIST Special Publication 800‐35 

Guide to Information Technology Security Services, October 2003 

SANS‐1  SANS Institute ‐ A Guide to Security Metrics ‐ SANS Security Essentials GSEC 

Practical Assignment, Version 1.2, 11 July 2001 

SANS‐2  SANS Institute ‐ Systems Maintenance Programs ‐ The Forgotten Foundation 

and Support of the CIA Triad, GSEC v1.3, 10 January 2002 

SEC‐FIN   VTT Technical Research Centre of Finland Publications 544 

Process Approach to Information Security Metrics in Finnish Industry and State 

Institutions, 2004 

SUN‐JAVA  SUN Java Coding Conventions 

Websites 

ISECOM  The Institute for Security and Open Methodologies (security) 

http://www.isecom.org/securitymetrics.shtml 

EDUCAUSE  http://www.educause.edu  

SEC‐METRICS  Community website 

http://www.securitymetrics.org 

11 

ECSS‐Q‐HB‐80‐04A  

30 March 2011 

SW‐METRICS  International Software Metrics Organization 

http://www.swmetrics.org 

SEC‐DOCS  Security white papers and documents 

http://www.securitydocs.com 

IEEE  http://www.ieee.com 

IEEE‐CS  http://www.computer.org 

NIST  NIST Computer Security Resource Centre 

http://csrc.nist.gov/ispab/ 

COSMICON  The Common Software Measurement International Consortium 

http://www.cosmicon.com/ 

UKSMA  The UK Software Metrics Association 

http://www.uksma.co.uk/?action=0&what=90 

ARMY‐METRICS  Army Software Metrics Office 

http;//www.armysoftwaremetrics.org 

PSSM  Practical Software & Systems Measurement 

http://www.psmsc.com 


12 

ECSS‐Q‐HB‐80‐04A  

30 March 2011 

3 Terms, definitions and abbreviated terms

3.1 Terms from other documents For the purpose of this document, the terms and definitions from ECSS‐S‐ST‐00‐01 and ECSS‐Q‐ST‐80 

apply. 

3.2 Definitions in other clauses of the present HB Subclause A.2 of Annex A includes the definitions for all characteristics/sub‐characteristics contained 

in the quality model used in this Handbook 

3.3 Terms specific to the present document

3.3.1 base measure

measure defined in terms of an attribute and the method for quantifying it. 

[ISO 24765] 

3.3.2 measure (noun)

variable to which a value is assigned as the result of measurement.  

[ISO 24765] 

3.3.3 measure (verb)

Make a measurement.  

[ISO 24765] 

3.3.4 measurement

act or process of assigning a number or category to an entity to describe an attribute of that entity. 

NOTE  ʺCategoryʺ is used to denote qualitative measures of attributes. For 

example, some  important attributes of software products, e.g.  the 

language  of  a  source  program  (such  as  ADA,  C,  COBOL)  are 

qualitative.  

[ISO 24765] 

13 

ECSS‐Q‐HB‐80‐04A  

30 March 2011 

3.3.5 metric

a  quantitative measure  of  the degree  to which  a  system,  component,  or process possesses  a  given 

attribute.  

[ISO 24765] 

3.3.6 quality model

defined  set  of  characteristics,  and  of  relationships  between  them, which provides  a  framework  for 

specifying quality requirements and evaluating quality 

[ISO 24765] 

3.4 Abbreviated terms For  the purpose of  this document,  the abbreviated  terms  from  [ECSS‐S‐ST‐00‐01] and  the  following 

apply: 


Abbreviation  Meaning 

CBO  coupling between objects 

CM  configuration management 

DDR  detailed design review 

DIT  depth of inheritance tree 

IEC  International Electrotechnical Commission 

ISO  International Organization for Standardization 

HOOD  Hierarchical Object Oriented Design 

LOC  lines of code 

LCOM  lack of cohesion method 

MIPS  millions of instructions per second 

MMI  man‐machine interface 

NASA  National Aeronautics and Space Administration 

NOC  number of children 

PPF  parametric polymorphic factor 

RB  requirements baseline 

RFD  request for deviation 

RFW  request for waiver 

SW PA  software product assurance 

SPR  software problem report 

SRR  system requirements review 

UML  Unified Modelling Language 

V&V  verification and validation 

VG  cyclomatic complexity (McCabe) 

14 

ECSS‐Q‐HB‐80‐04A  

30 March 2011 

4 Overview of the Handbook

4.1 Introduction This subclause contains an introduction of the content of this Handbook, the intended audience and 

how to use it. 

It introduces the rationale of the need of a metrication programme for space software projects based 

on [ECSS‐E‐40] and [ECSS‐Q‐80] requirements (especially this one). 

The organization of this Handbook is reflected in detail in Figure 4‐1. This Handbook is organized in 

seven main parts: 

Clause 1. Scope 

Clause 2: Normative references 

Clause 3: Terms, definitions and abbreviated terms.  

Clause 4: Overview of the Handbook 

Clause 5: A reference software quality model  

Clause 6: Measurement process 

Annex A: Definition of the quality model 

The annex is provided for information only. 


Clause 1 

Scope 

Clause 3 

Terms, definitions 

and abbreviated 

terms 

Clause 2 

Normative references 

Clause 4 

Overview of the 

Handbook 

Clause 6 

Measurement 

process 

Clause 5 

A reference 

software quality 

model 

Annex A 

Definition of the 

quality model 


Figure 4‐1:Organization of this document 

15 

ECSS‐Q‐HB‐80‐04A  

30 March 2011 

4.2 Relation to other ECSS Standards

4.2.1 General This subclause discusses how  this Handbook  interfaces with other ECSS series, namely  the ECSS‐Q 

series  of  standards  (product  assurance), ECSS‐E  series  of  standards  (engineering)  and  the ECSS‐M 

series of standards (management). 

4.2.2 Software engineering The interface of this Handbook to the ECSS‐E branch is via [ECSS‐E‐40]; and in turn, the interface of 

[ECSS‐E‐40] to this Handbook is via the [ECSS‐Q‐80]. 

[ECSS‐E‐40]  covers  all  aspects  of  space  software  engineering  from  requirements  definition  to 

retirement.  It defines  the scope of  the space software engineering processes,  including details of  the 

verification and validation processes, and  their  interfaces with management and product assurance, 

which  are  addressed  in  the management  (‐M)  and  product  assurance  (‐Q)  branches  of  the  ECSS 

system. 

[ECSS‐E‐40]  also  defines  the  content  of  the  document  requirements  definitions  (DRDs)  referenced 

inside the Standard. 

[ECSS‐E‐40]  is  intended  to  help  the  customers  to  formulate  their  requirements  and  suppliers  to 

prepare  their  responses  and  to  implement  the work.  In  this  Standard  requirements  are defined  in 

terms  of what  is  to  be  accomplished,  rather  than  in  terms  of  how  to  organize  and  perform  the 

necessary work. This allows the tailoring process to match the requirements to a particular profile and 

circumstances  of  a  project.  The  goal  of  the  tailoring  is  to  select,  modify  or  add  adequately 

requirements in order to identify the quality ratio adequate to the actual project peculiarities. 

There  are no  specific  requirements  in  [ECSS‐E‐40]  related  to  software measurement  aspects,  except 

those related to technical budgets management (e.g. 5.3.8 and 5.8.3.12), and a few requirements related 

to test coverage (several clauses of subclause 5.8.3.5). In addition, there are some requirements related 

to  traceability  (especially  in subclause 5.8.3), which are connected  to some extent  to  the metrication 

aspects of the software life cycle. 

In  addition,  clause  5.4.2.1  of  ECCS‐E‐40  demands  that  quality  requirements  are  established  and 

documented,  as part  of  the  technical  specification. This  is  also  reinforced  in  clauses  7.1  and  7.2  of 

[ECSS‐Q‐80]. 

All other aspects of software quality modelling and metrication are specified in the [ECSS‐Q‐80]. 

4.2.3 Software product assurance This  subclause  contains  an  analysis  of  [ECSS‐Q‐80]  requirements  related  to  the  definition  and 

implementation of a metrication programme for space software projects. 

[ECSS‐Q‐80]  Standard  presents  software  product  assurance  requirements  to  be met  in  a particular 

space project  in order  to provide confidence  to  the customer and  to  the suppliers  that developed or 

reused software satisfies the requirements throughout the system lifetime.  In particular, [ECSS‐Q‐80] 

presents requirements  to ensure  the software  is developed  to perform as expected and safely  in  the 

operational environment meeting the quality objectives agreed for the project. 

[ECSS‐Q‐80] Standard is tailored in such a way that software product assurance requirements meet a 

particular space project and fulfil the specific objectives. In particular, clause 7 of [ECSS‐Q‐80] explains 

16 

ECSS‐Q‐HB‐80‐04A  

30 March 2011 

that  software quality  requirements  (including  safety  and dependability) derives  from  requirements 

defined at system level. 

Requirement 5.2.7.1 of [ECSS‐Q‐80] requires that quality models are used to specify software quality 

requirements  (in  quantitative  terms  as  required  in  7.1.2)  and  that  they  shall  be  derived  from 

requirements at system  level (as  in § 7.1.1). Requirements 5.2.7.2, 6.2.5.3, 6.2.5.4 and 7.1.5  list quality 

characteristics, and process and product metrics that shall be part of the quality model.  

Clause 7.1.4 requires that a metrication programme is defined and implemented in order to fulfil those 

quality requirements. Metrics are selected, collected and analysed against target values and reported 

corrective  actions  are  taken when  required  (in  [ECSS‐Q‐80]  requirements  6.2.5.2,  7.1.4,  6.2.5.5  and 

7.1.6).  

All aspects related to process metrics are included in clause 6.2.5.  

Clause 6.3.4  (coding)  is  special  since  it contains  some  requirements  related  to  the coding  standards 

and its relationship with the product quality requirements (not all related to process requirements). 

4.2.4 Project management The  ECSS‐M  branch  defines  the  requirements  to  be  applied  to  the management  of  space  projects. 

[ECSS‐E‐40] and [ECSS‐Q‐80] describe how the ECSS‐M series of standards apply to the management 

of software projects. In addition, requirements that cannot be found in the M‐branch because they are 

specific to software product assurance are defined in [ECSS‐Q‐80]. 

17 

ECSS‐Q‐HB‐80‐04A  

30 March 2011 

5 A reference software quality model

5.1 Introduction The  current  situation  in  space  system and  software development  is  characterized by  the  increasing 

complexity of  the end product and growing demands on  the cost and  time effectiveness as well as 

overall  quality  of  the  development  process.  In  order  to  facilitate  a  continuous monitoring  of  the 

progress  of  the  project  it  is  essential  to  collect  quantifiable  evidence  both  for  the  product  being 

developed and the process being performed. 

[ECSS‐Q‐80]  (ECSS Standard  for  software product assurance  in  space projects),  in  the  same  line  as 

other industry standards, includes some requirements for the collection and analysis of a number of 

measures with this objective.  

The main objective of the metrication framework as defined in this Handbook is to provide support in 

the selection of project specific quality model and metrics in order to facilitate a continuous feedback 

as a basis for the critical decisions to be taken throughout the project. In particular, metrication should 

enable the following goals: 

Communicate the project status throughout the project organization under the responsibility of 

quality assurance. 

Identify early and correct problems. 

Provide a basis  for key  tradeoffs  (from both  technical and management points of view) while 

taking into account the project constraints such as cost, schedule, quality, and functionality. 

Track specific project objectives. 

Defend and justify project decisions throughout the development life‐cycle. 

Provide the supplier and the customer with an  indication of the quality status of the software 

product 

Metrication should be seen as a supporting activity to achieve these goals that complement the other 

quality assurance activities. As a stand‐alone  technique  it does not provide suitable  feedback, but  it 

does it in the larger context of quality assurance. 

Although the main purpose of the metrication as described in this document is the support of projects 

throughout the development processes, metrication is also part of process improvement activities. In 

addition to the activities of defining metric programs, capturing and evaluation of metric data which 

provide  a  basis  for  project  monitoring,  a  systematic  approach  to  metrication‐based  process 

improvement  requires  the  selection  of  a  common  subset  of  metrics  and  their  normalization  at 

department or company level. The goal is the definition of a comparable set of data covering any type 

of software development projects. While this topic  is addressed briefly  in clause 6, full guidance for 

organizational metrication process improvements exceeds the scope of this Handbook. 

18 

ECSS‐Q‐HB‐80‐04A  

30 March 2011 

In the following sections, several aspects of the metrication programme as well as the introduction of 

the reference quality model for the space software are presented.  

As  the presented quality model  is  to be used as a  reference, and  is  required  to be  tailored  for each 

project, several metric tailoring tables are included in this Clause, with the aim of facilitating selection 

of metric sets  from  two different perspectives: relevant software quality requirements and criticality 

category (applicability and target values). 

5.2 Reference software quality model As  in  the  ISO  standards,  the  first  step  in  the  evaluation  of  software  is  to  select  relevant  quality 

characteristics,  using  a  quality model  that  breaks  software  quality  objectives  down  into  different 

characteristics. Quality models for software evaluation often represent the totality of software quality 

attributes classified in a hierarchical tree structure of characteristics and sub‐characteristics. A variety 

of quality models is available in the literature (see for example [ISO 9126], [SPEC], and [ISO 25000]). 

The quality model defined in this Handbook is derived from these references but focuses on a subset 

of  the  proposed models  that  cover  the  requirements  in  [ECSS‐Q‐80]  and  for which  a  quantitative 

evaluation is possible. 

This quality model  takes  into  account both process  and product  related  characteristics  relevant  for 

space projects. Main characteristics taken into account are presented in below table 5‐1. 

The quality model proposed below is to be used as reference. It is expected to be tailored according to 

projects needs. It  is recommended to select a subset of the metrics proposed below that support SW 

product quality characteristics representative for the project and beneficial for customer and supplier 

for analysis, design coding, testing, operation and maintenance. 

For each of the characteristics defined, one or more quantifiable sub‐characteristics are identified that 

together  provide  the  quality  characteristics  that  are  considered  for  space  projects. The  selection  of 

these  characteristics  is driven by  the objective  to provide a  streamlined and  cost‐effective  reference 

metrication approach for space software development. 

The  criteria used  for  the  selection of  characteristics/sub‐characteristics of  this quality model are  the 

following: 

All characteristics / sub‐characteristics that occur either in the [ECSS‐E‐40] or in the [ECSS‐Q‐80] 

are included. 

Many other characteristics  / sub‐characteristics proposed  in  [ISO 9126] are also considered, as 

authoritative references in the field of quality modelling. 

The quality model is then completed with a few additional characteristics / sub‐characteristics 

proposed  in other  sources  ([NASA‐1740],  [PSS‐01‐212],  [EADS‐ST],  literature on metrics), but 

not in the main input references. 

In order  to  reduce  the  size of  the  resulting quality model when  following  above  approach,  and  to 

augment its usability, few reduction rules were applied: 

When  a  given  sub‐characteristic was  found  not measurable  (i.e.  no  chance  to  find  suitable 

metrics), then it was discarded. 

When a given sub‐characteristic, even if measurable, was considered as providing very little or 

no added value to the project, then it was also discarded. 

In case that all sub‐characteristics associated to a given characteristic were discarded, then the 

characteristic itself was also removed from the quality model. 

19 

ECSS‐Q‐HB‐80‐04A  

30 March 2011 

In summary, the selection of the characteristics / sub‐characteristics of this reference quality model is 

driven by pragmatic criteria (i.e. only a few characteristics, measurable, providing a significant added 

value, and specific to the objectives of a metrication program). 

In Figure 5‐1 the elements composing the software quality model are shown. This quality model takes 

into  account  both  process  and  product  related  characteristics,  therefore,  in  turn,  it  includes  two 

categories  of metrics:  product metrics,  related  to measuring  the  products  of  the  development,  and 

process metrics, referring to measuring the processes themselves.  

NOTE  The ISO standards use detailed terminology for different types of 

measures:  base  measure  or  direct  measure  (measure  functionally 

independent of other measures), derived measure or indirect measure 

(a  function  of  two  or  more  values  of  base  measures),  that  are 

simplified within  this Handbook  corresponding  to  the  so‐called  

(product or process) metrics. 

The  ISO  standards  also  identify  the  terms  external  measures 

(product  properties  during  execution)  and  internal  measures 

(internal  attributes  that  capture  static  properties  of  the  product) 

also  specified  in  the  ISO  Standards  are  simplified  within  this 

Handbook corresponding to the so‐called product metrics. 

Each  process  or  product metric  is  calculated  by  the  use  of  a  formula  or  analysis  (measurement) 

deduced  from  combining different  base measures  from  attributes  of  expected  outputs  or  activities 

produced or performed at different stages in the project.    

Software quality requirements

Product quality sub-characteristic

Product quality sub-characteristic

Product quality characteristic

Product quality characteristic

composed of

composed of

Product metricProduct metric Product metricProduct metric

composed of

Product quality sub-characteristic

Product quality sub-characteristic

Measurement formula

Measurement formula

Basic dataBasic dataBasic dataBasic data

Life cycle expected

output

Life cycle expected

output

simple measurement

simple measurement

Life cycle expected

output

Life cycle expected

output

simple measurement

simple measurement

calculated by

composed of

calculated by

used by

E.g.. Requirement implementation

coverage

E.g. X= A/B

E.g.. A = number of correctly

implemented requirements

E.g. B = number of requirements

E.g.. Traceability matrices

E.g. Requirement Specification document

E.g.. count E.g. count

Process quality characteristic

Process quality characteristic


Figure 5‐1: Elements of the software quality model  

20 

ECSS‐Q‐HB‐80‐04A  

30 March 2011 

Table 5‐1 presents the proposed reference quality model.  

It  is  important  to  perform  the  software measurements  in  an  efficient way  and  that  the  resulting 

measures  are  practical. Many  software measurements  can  conveniently  be made with  the  help  of 

automatic tools and can be packaged as an evaluation module (see [ISO 14598‐6]). 

To achieve a continuous monitoring throughout the development life‐cycle, it is necessary to identify 

the relevant phases for data capture and metric evaluation for the specific metrics. While some metrics 

are independent of the development progress, other metrics are only available after certain milestones 

have been reached.  

In order to provide guidelines for this allocation of measurement activities to the project life cycle, this 

Handbook refers to the software processes as defined in [ECSS‐E‐40]. The following table presenting 

the proposed reference quality model indicates when each applicable metric should be collected and 

provided.  

Annex A provides  the  full definition of  the Quality Model and  further guidance with regard  to  the 

allocation  of  individual  quality  characteristics  and  the  related  measurements  to  the  individual 

processes. 

21 

ECSS‐Q‐HB‐80‐04A  

30 March 2011 

Table 5‐1: Proposed reference quality model  

(Main) 

characteristic 

Sub 

characteristic 

Metrics  First 

provided at 

Frequency 

PRODUCT RELATED CHARACTERISTICS 

Requirement allocation  SRR  Every Review 

Requirement implementation 

coverage PDR  Every Review 

Requirements completeness  PDR  Every Review 

Completeness 

V&V coverage  PDR  Every Review 

Correctness  SPR/NCR trend analysis CDR 

Every Review and 

Progress Meeting 

  Requirement clarity  PDR  Every Review 

  Suitability of development 

documentation SRR  Every Review 

  Adherence to coding standards  CDR  Every Review 

Efficiency  CPU margin  PDR  Every Review 

Functionality 

  Memory margin  PDR  Every Review 

Process reliability adequacy  SRR  Every Review 

SPR/NCR status (see NOTE 1) CDR 

Every Review and 

Progress Meeting 

Reliability 

Evidence 

Structural coverage  CDR  Every Review 

Correctness  (see above metrics for Functionality.Correctness subcharacteristic) 

Reliability 

Testability  Requirement testability  PDR  Every Review 

Complexity  Cyclomatic complexity (VG)  CDR  Every Review 

  Nesting level  CDR  Every Review 

  Lines of code (LOC)  CDR  Every Review 

  Comment frequency  CDR  Every Review 

Testability  (see above metrics for Reliability.Testability subcharacteristic) 

Modularity  Modular span of control  CDR  Every Review 

  Modular coupling  CDR  Every Review 

  Modular cohesion  CDR  Every Review 

Correctness  (see above metrics for Functionality.Correctness subcharacteristic) 

Portability  Environmental software 

independence DDR  Every Review 

  System hardware independence  DDR  Every Review 

User doc. quality  User documentation clarity  CDR  Every Review 

Maintainability 

  User documentation 

completeness CDR  Every Review 

    User manual adequacy  CDR  Every Review 

22 

ECSS‐Q‐HB‐80‐04A  

30 March 2011 

23 

(Main) 

characteristic 

Sub 

characteristic 

Metrics  First 

provided at 

Frequency 

Portability  See above Maintainability.Portability subcharacteristic 

Reusability 

documentation 

Reusability checklist SRR  Every Review 

Reusability 

Reuse 

Modification  

Reuse Modification rate SRR  Every Review 

Safety Evidence  Safety activities adequacy  SRR  Every Review Suitability for 

Safety  Correctness  (see above metrics for Functionality.Correctness subcharacteristic) 

Security  Security Evidence  Security checklist  SRR  Every Review 

User doc. quality  See above Maintainability.User doc .quality subcharacteristic Usability 

User interface 

quality 

Adherence to MMI standards CDR  Every Review 

PROCESS RELATED CHARACTERISTICS 

Project 

development 

process level 

Process assessment [ECSS‐HB‐

Q‐80‐02]  (1)  (2) 

Milestone tracking  1st Progress 

Meeting 

Every Progress 

Meeting 

Effort tracking  1st Progress 

Meeting 

Every Progress 

Meeting 

Code size stability  DDR 

Every Review and 

Progress Meeting 

Requirement stability  SRR  Every Review 

RID/action status  SRR 

Every Review and 

Progress Meeting 

Software 

Development 

Effectiveness 

Project 

management 

effectiveness 

V&V progress (see NOTE 2) PDR 

Every Review and 

Progress Meeting 

(1) Before the relevant processes start. 

(2) Process Assessment is done just once unless an improvement program is initiated and the correspondent reassessment 

is planned. 

NOTE 1  NOTE: SPR/NCR status is also regarded as both product metric (from the reliability point of view: number of 

bugs fixed on the product so far) and process metric (from the progress point of view: known problems to be 

corrected as an estimation of pending work). 

NOTE 2  Some metrics like V&V progress may be considered as both product metric (from the correctness point of view: 

number of V&V activities performed so far) and process metric (from the progress point of view: remaining time 

for the completion of all planned V&V activities). 


The definition of each characteristic, subcharacteristic is presented in Annex A. In addition, Annex A 

provides the details for each metric, when and how to calculate it. 

ECSS‐Q‐HB‐80‐04A  

30 March 2011 

5.3 Tailoring the metrication programme The metrication programme defined covers all aspects of the quality model and identifies metrics as 

well as the relevant basic data to be collected and the evaluation of these data. For individual projects 

several decisions  should be made, starting with  the  identification of  relevant quality objectives,  the 

selection of  individual metrics,  the decision on evaluation criteria  (thresholds of permissible values, 

configuration of metrics with regard to project‐specific circumstances).  

This Handbook does provide guidelines for the top‐level tailoring, i.e. the identification of a suitable 

subset  of measurements  on  the  basis  of  software  aspects  such  as  criticality.  It  does  not  provide 

detailed guidance on a concrete definition of the basic data. Such definitions are strongly dependent 

on the specific aspects of each project, such as the development environment and, in particular, on the 

specific programming  language  chosen  for  the project. Extensive guidance  for  these aspects  can be 

found in the  literature (e.g. [Fenton], [PSSM]). Similarly, literature provides  information with regard 

to commonly used permissible ranges (target values) for a variety of basic data (e.g. [ISO 9126], [SUN], 

[PSSM]). Some examples are also given below. These can provide a starting point  for a metrication 

programme.  

The reported experience shows that a tuning of a metrication programme also depends very much on 

the  application  area,  as well  as  on  the development  environment  and  even  on  cultural  aspects.  In 

general the detailed definition should be based on company experience and be refined in a continuous 

adaptation process. This aspect exceeds the scope of this guideline and is thus omitted. 

Different metric tailoring tables are included in this subclause, with the aim of facilitating the selection 

of the metric sets from one main perspective: criticality category (applicability and target values). 

Finally, next subclause develops some more detailed guidelines as an example to show how to tailor 

the  whole  metrication  programme  for  a  specific  project,  following  the  different  metrication 

programme definition steps.  

Tables 5‐2 and 5‐3 provide the tailoring of metrics depending on the criticality category (following the 

classification scheme proposed in [ECSS‐Q‐80]), which is done from two different perspectives: 

1. (Table 5‐2) Applicability of each metric depending on the criticality category: 

(a) MANDATORY: when this metric is derived from a requirement in [ECSS‐Q‐80] or 

[ECSS‐E‐40]. 

(b) RECOMMENDED: the metric is not required by [ECSS‐Q‐80] or [ECSS‐E‐40], but it 

can bring significant added value to the project. 

(c) OPTIONAL: the metric is for internal use only (i.e. delivery to the customer is not 

required). 

2.  (Table  5‐3) Proposed  target  value  for  each metric depending on  the  software  criticality 

category: 

In general,  these values should be  taken as  indicators  that have been collected  from  the 

practical experience in past space projects. They are not necessarily the best target values 

for all future projects and situations; they should be tuned up on a case‐by‐case basis. 

There are even  some metrics  for which no generic  target values are proposed, because 

they are strictly project‐dependant. 


24 

ECSS‐Q‐HB‐80‐04A  

30 March 2011 

Table 5‐2: Applicability of the metrics depending on the criticality category 

Criticality category Metric name 

A  B  C  D 

Requirement allocation  M  M  M  M 

Requirement implementation coverage  M  M  M  M 

Requirement completeness  R  R  R  O 

V&V coverage (RB/TS levels)  M M M M

V&V coverage (unit/integration levels)  M  M  M  O 

SPR/NCR trend analysis  M  M  M  M 

Requirement clarity  R  R  R  O 

Documentation suitability  M  M  M  M 

CPU margin  M  M  M  R 

Memory margin  M  M  M  R 

Cyclomatic complexity (VG)  M  M  M  M 

Nesting level  M  M  M  M 

Lines of code (LOC)  M  M  M  M 

Comment frequency  M  M  M  M 

Adherence to coding standards  M  M  M  M 

Requirement testability  M  M  M  R 

Modular span of control  M  R  R  O 

Modular coupling  M  R  R  O 

Modular cohesion  M  R  R  O 

Process reliability adequacy  M  M  M  O 

SPR/NCR status  M  M  M  M 

Structural coverage  M  M  M  M 

Environmental software independence  M  M  M  R 

System hardware independence  M  M  M  R 

Reusability checklist  M  M  M  M 

Reuse modification rate  M  M  M  M 

Safety activities adequacy  M  M  R  O 

Security checklist  M  M  M  M 

User documentation clarity  R  R  R  R 

User documentation completeness  R  R  R  R 

User manual suitability  M  M  M  M 

Adherence to MMI standards  M  M  M  M 

Process assessment [ECSS‐HB‐Q‐80‐02]  M  M  R  R 

Milestone tracking  M  M  M  M 

Effort tracking  M  M  M  M 

25 

ECSS‐Q‐HB‐80‐04A  

30 March 2011 

26 

Criticality category Metric name 

A  B  C  D 

Code size stability  M  M  M  M 

Requirement stability  M  M  M  R 

RID/action status  M  M  M  M 

V&V progress  M  M  M   M 


Table 5‐3: Target value for metric depending on criticality category 

Proposed target value/ 

criticality category Metric name 

A  B  C  D 

Requirement allocation  1  1  1  1 

Requirement implementation coverage  1  1  1  1 

Requirement completeness  0  0  0  0 

V&V coverage  1  1  1  1 

SPR/NCR trend analysis  P.D.  P.D.  P.D.  P.D. 

Requirement clarity  0  0  0  0 

Documentation suitability  1  1  1  1 

CPU margin  P.D.  P.D.  P.D.  P.D. 

Memory margin  P.D.  P.D.  P.D.  P.D. 

Cyclomatic complexity (VG)  10  10  15  20 

Nesting level  5  5  5  7 

Lines of code (LOC)  50  50  50  75 

Comment frequency  0.3  0.3  0.3  0.2 

Adherence to coding standards  1  1  1  1 

Requirement testability  0.8  0.8  0.8  0.8 

Modular span of control  2  5  7  9 

Modular coupling   3  3  4  4 

Modular cohesion  2  2  3  3 

Process reliability adequacy  1  1  1  1 

Statement Coverage (Source Code)  1  1  1   

Statement Coverage (Object Code)  1  P.D.  P.D.  P.D. 

Decision Coverage (Source Code)  1  1  1  P.D. 

Modified Condition & Decision 

Coverage (Source Code) 1  P.D.  P.D.  P.D. 

SPR/NCR status  (1)  (1)  (1)  (1) 

Environmental software independence  0.95  0.95  0.95  0.9 

ECSS‐Q‐HB‐80‐04A  

30 March 2011 

27 

Proposed target value/ 

criticality category 

System hardware independence  0.95  0.9  0.85  0.85 

Reusability checklist  1  1  1  1 

Reuse modification rate  P.D.  P.D.  P.D.  P.D. 

Safety activities adequacy  1  1  1  1 

Security checklist  1  1  1  1 

User documentation clarity  0  0  0  0 

User documentation completeness  0  0  0  0 

User manual suitability  1  1  1  1 

Adherence to MMI standards  1  1  1  1 

Process assessment [ECSS‐HB‐Q‐80‐02]  (2)  (2)  (2)  (2) 

Milestone tracking  P.D.  P.D.  P.D.  P.D. 

Effort tracking  P.D.  P.D.  P.D.  P.D. 

Code size stability  P.D.  P.D.  P.D.  P.D. 

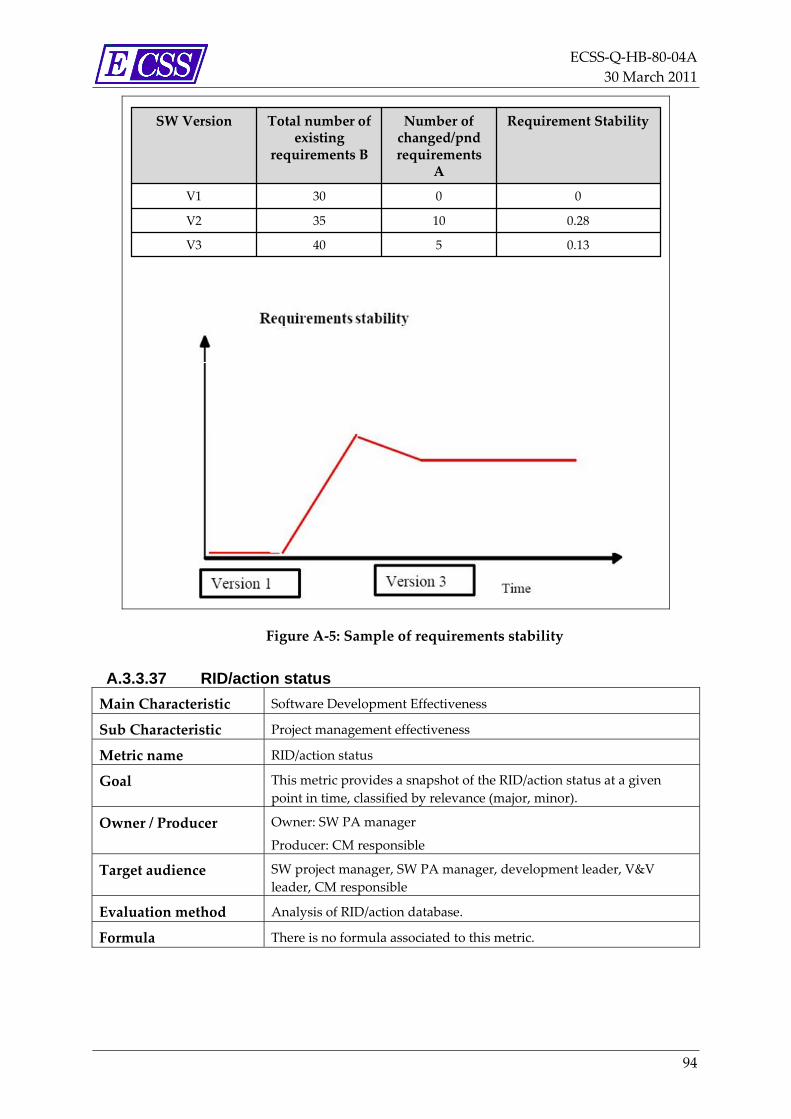
Requirement stability  P.D.  P.D.  P.D.  P.D. 

RID/action status  (3)  (3)  (3)  (3) 

V&V progress  1  1  1  1 

(1) SPR/NCR  status: Although no  specific  target values  are  identified  for 

this metric, some sample acceptance criteria can be proposed: 

‐ No major/critical SPR/NCR should remain open at SW‐AR. 

‐ All minor SPRs/NCRs still open at SW‐AR should be properly covered by 

temporary or permanent RFW. 

(2)  Process  assessment  [ECSS‐HB‐Q‐80‐02]:  Target  values  according  to  the 

table on subclause A.3.3.32 (Target Capability Levels). 

(3) RID/action  status:  Similarly  to  the  SPR/NCR  status metric, no  specific 

target values can be proposed. Some acceptance criteria  that can be used 

for this metric are: 

‐ No major  RID  from  previous milestones  should  remain  open  at  next 

milestone. 

‐ All RIDs/actions still open at SW‐AR should be declared as  ‘open work’ 

and  a  proper  action  plan  to  close  them  should  be  agreed  with  the 

customer. 

5.4 Detailed tailoring guidelines The tailoring of a metrication programme for an individual project requires several steps: 

1. Identification  of  relevant  project  characteristics  (main  characteristics  and  sub‐

characteristics, see Annex A). 

The  project  objectives  and  the  product  properties  determine  which  of  the  quality 

characteristics in the generic quality model are relevant.  

Examples: 

ECSS‐Q‐HB‐80‐04A  

30 March 2011 

o A software product developed to be a text editor is in general not safety 

critical and thus the ‘Suitability for Safety’ characteristic should not be 

considered. 

o A software project with no reuse of existing software and with no 

requirements to produce any software to be reused should not include the 

‘Reusability’ characteristic in its metrication program. 

o A software project with no security requirements should not include the 

‘Security’ characteristic as part of its metrication program. 

From  this  point  of  view,  none  of  the  characteristics  proposed  in  the  quality model  of 

Annex A can be considered as mandatory. They only become mandatory  if  the  related 

product property is relevant to the current project. 

2. Selection of related base/derived metrics. 

In general several metrics are available for each sub‐characteristic in the quality model. It 

is necessary to determine which ones should be captured within a project. Only some of 

them may be captured in the same project. 

Example: 

o Lines of code is a metric related to maintainability in the quality model 

proposed.  

3. Allocation of measurement activities to life cycle processes. 

After  having  selected  the  quality  characteristics  and  the  required  base  and  derived 

metrics it is necessary to identify to which life cycle processes is allocated the capture and 

evaluation of each metric.  

Examples: 

o Code size stability or comment frequency are clearly linked to code. They 

can not be captured during the architectural design phase, for example. 

o Failure rate measurement is often restricted to high‐level test phases (e.g. 

integration, system testing, acceptance), but excluded at unit testing level. 

4. Definition of evaluation / analysis criteria. 

In order to use the metrication results as a means of monitoring and steering the project it 

is necessary to define limits or thresholds that individual metrics should not exceed. 

Examples: 

o Some literature recommends that cyclomatic complexity of a single 

subprogram (function, procedure) does not exceed the limit 10, in case of 

mission‐critical software. 

o A reuse criteria used in many space projects is that, for a given reused 

product, no more than 20 % of the code should be changed. Otherwise the 

product should be treated as newly‐developed software. 

o Other space projects define that there should not be any open critical 

problem in the problem report list submitted for acceptance, and no more 

than 5 open urgent problems. 

5. Detailed definition of data to be captured.  

Once  the base metrics  required  for  the  selected measures have been  identified  (steps 1 

and 2 above), it is also necessary to detail several aspects of the data collection process: 

o The exact definition of the attributes to be measured. 

28 

ECSS‐Q‐HB‐80‐04A  

30 March 2011 

o The sources of these attributes. 

o The capture frequency. 

o The capturing mechanism. 

Examples: 

o The base measure LOC (lines of code) can be defined to include comment 

and blank lines or to exclude them. The source of these data can be the 

whole source code or excluding libraries. The capture can be defined to take 

place for each build or only for the final code before each milestone. The 

capturing can be done in an automatic way (either within the software 

development environment or using specific tools), or manually by reading 

the data from an editor (not recommended for large products, of course!). 

o Similarly, the failure rate measure can exclude certain types of faults (e.g. 

routine ones), and can be captured only before each milestone or on a 

continuous basis. 

o Test coverage can be defined as system test coverage (i.e. versus 

requirements), unit test coverage (i.e. versus statements/conditions), or both. 

It  is out of scope of  this Handbook  to detail above steps 4 and 5 on a global basis. However, 

further guidance to support these activities is provided in subclause A.3 of Annex A (detailed 

definition of metrics). 

29 

ECSS‐Q‐HB‐80‐04A  

30 March 2011 

6 Measurement process

6.1 Introduction The complete measurement process consists in the following activities, as depicted in Figure 6‐1: 

Parent: -

Inputs Software quality requirements

OutputsProducts metrics specification and justification, data, data capture infrastructure, data archiving infrastructure, report of the analysis and remedial actions

Activity: Metrication process

Planning the metrication in

the development life cycle

Data analysis

Data archiving

Reporting

Feedback to the measurement

process

Software quality requirements

Data collection

Data validation

Data

Products metrics

specification and

justification

Data capture infrastructure

Report of the analysis and

remedial actions

Data archiving infrastructure

Report of the analysis and

remedial actions

Validated data

Measurement Experience Base

Improvement Actions – from past projects

Figure 6‐1: Metrication process activities 

As defined  in  [ISO 12207],  the purpose of  this process  is  to collect and analyse data  relating  to  the 

products developed and processes  implemented,  to  support  effective management of  the processes 

and to objectively demonstrate the quality of the products. 

As a result of successful implementation of metrication process, the following is achieved: 

a. Commitment  is established and  sustained  to  implement  the measurement process within  the 

space project; 

b. The measurement information requirements are identified; 

c. An  appropriate  set  of measures,  driven  by  the  information  requirements  are  identified  and 

developed 

d. Measurement activities are identified and performed; 

30 

ECSS‐Q‐HB‐80‐04A  

30 March 2011 

e. The required data are collected, stored, validated, analysed, and the results interpreted; 

f. Information  products  are  used  to  support  decisions  and  provide  an  objective  basis  for 

communication; and 

g. The measurement process and measures are evaluated and  

h. Feedback produced for the improvement of this same measurement process.  

The  following subclauses detail each of  these activities. These clauses are heavily based on  the  [ISO 

15939]. 

6.2 Planning of metrication in the development life cycle Planning aspects of metrication should include: 

1. Characterize the project quality requirements and select the metrics to be collected. 

2. Define data collection, and analysis procedures. 

3. Define criteria for validating the metrics and the measurement process. 

4. Define resources and infrastructure for measurement tasks. 

5. Define how reporting will be performed 

6. Review and approve the measurement plan. 

7. Provide resources and infrastructure for measurement tasks 

6.2.1 Characterize the project quality requirements and select the metrics to be collected

The supplier should ensure  that general quality  requirements applicable  to  the software system are 

identified, and that they are documented in the technical specification (TS). They are derived from the 

reliability, safety, maintainability and quality requirements of the system. 

 In addition, relevant project characteristics should be identified as they will also support the selection 

and  interpretation of  the metrics  to be collected. They provide  the context of measurement and any 

constraints and assumptions to be considered within the measurement process. 

Each quality requirement  is  to be mapped  into one or several quality characteristics which,  in  turn, 

lead to the identification of the associated sub‐characteristics and the selection of a proper metric set 

(see above clause 5). This quality model is to be defined ad‐hoc for each project. The reference quality 

model provided in Clause 5 and in Annex A can be used to support this definition. For each metric, 

target  values  are  to  be  defined  intended  to  be  used  as  quantitative  representations  of  the  quality 

requirements (evaluation criteria). 

Annex A defines a format to define each metric. 

6.2.2 Define data collection and analysis procedures Procedures for data collection, including storage, validation and analysis should also be defined in the 

here called  ‘measurement plan’  that  is  to be  included  in  the software product assurance plan as  the 

‘product metrics specification and justification’.  

31 

ECSS‐Q‐HB‐80‐04A  

30 March 2011 

32 

The procedures  should  specify how data will be  collected,  (indicating  in which  life‐cycle processes 

and activities) and how and where they will be stored. 1) 

The  supplier  specifies data  collection  actions  (procedures)  needed  to  obtain  actual  values  for  each 

metric. This also  includes specification of  time schedules and  responsibilities  for  the data collection 

and  analysis. The data  collection  and  storage  is often performed with  the use  of  tools  and  special 

infrastructure, and this should also be planned for and scheduled accordingly.  

The measurement precision and metrics accuracy should be defined as part of the measurement plan, 

e.g. any statistical models to be applied, including input data requirements or sampling strategies. 

When  in  the  development  life  cycle  and  in  which  of  its  processes  (including  the  management, 

supporting, and also this measurement process), the metrics are to be calculated should be identified. 

The  set of measurements  can  imply a  change  in  the development process  (e.g.  added activities  for 

these metrics to be taken, added tools to be used for their collection, storage and analysis). 

The  procedures  should  also  specify  the  data  analysis  method(s),  and  format  and  methods  for 

reporting  the  information products. The  range of  tools  that would be  required  to perform  the data 

analysis should be identified. 2) 

If  measurement  results  are  out  of  boundaries  or  inconclusive,  the  supplier  should  also  define 

contingency actions like extra evaluations. 

All items used during this metrication activity such as the collected data, analysed data, information 

products,  tools  parameters  and  selected  information  needs  should  be  placed  under  configuration 

management. 3) 

This  can be  the  same  configuration management procedure used  in other parts of  the project  [ISO 

15939]. 

6.2.3 Define criteria for validating the metrics and the measurement process

Criteria for determining whether both the data collected and analysed and the measurement process 

itself were  having  the  required  quality  to  satisfy  the  project  requirements.  The  criteria  should  be 

defined at the beginning, and act as success criteria. 

Example criteria for the evaluation of the data collected are the accuracy of a measurement procedure 

and  the reliability of a measurement method. However,  it might be necessary to define new criteria 

and measures  for  evaluating  the metrics.  Examples  of  criteria  for  the  quality  of  the measurement 

process are timeliness and efficiency. 4) 

Each  project  should  define  its  own  criteria  to  validate  both  data  collected  and  analysed  and  the 

measurement process.  

In addition,  the validation activities  should be performed at different  stages  (as soon as  the data  is 

collected, after the analysis of the data, at the end of the measurement process). For each criteria, the 

time in which it is to be used and reported should be defined per process. 

                                                 1) [Adapted from ISO/IEC 15939 clause 4.2.4.1] 2) [Adapted from ISO/IEC 15939 clause 4.2.4.2] 3) [Adapted from ISO/IEC 15939 clause 4.2.4.3] 4) [Adapted from ISO/IEC 15939 clause 4.2.5.1] 

ECSS‐Q‐HB‐80‐04A  

30 March 2011 

33 

6.2.4 Define resources and infrastructure for measurement tasks It should be ensured  that, at a minimum, skilled  individuals are assigned  the  responsibility  for  the 

following typical roles: 

Measurement  sponsor,  that  should be  responsible  for  the measurement planning  and  ensuring 

that resources are provided (also referred here as measurement owner); 

Measurement provider, who calculates and collects the data (also referred here as producer ) 

Measurement user, who uses the analysed data (also referred here as target audience); 

Measurement analyst, who analyses the data using the analysis methods; 

Measurement librarian, who keeps the integrity of the captured and stored data. 

The number of roles shown above does not imply the specific number of people required to perform 

the  roles. The number of people  is dependent on  the  size and  structure of  the  space project. These 

roles can be performed by as few as one person for a small project. 5) 

In particular, only three of these five roles are used in the quality model that is presented in Annex A: 

owner, provider and target audience. The owner role is intended to cover also the analyst and librarian 

roles in the sense that he/she is responsible for ensuring them. 

The  required  infrastructure  for  the  performance  of  the  different measurement  process’  steps  and 

detailed metrics collection is also defined in the measurement plan.  The data collection, storage and 

analysis are often performed with the use of tools and special infrastructure, and this should also be 

planned for and scheduled accordingly. If special training of personnel is required, this should also be 

included in the plan. This training may be needed by quality assurance or quality control organization 

or  the entire development  team being  responsible of  the performance of  the different measurement 

process activities. 

Both  configuration management  and  security  procedures  (and  tools  if  necessary)  to  preserve  the 

integrity of the data captured, analysed and stored should be planned for. 

6.2.5 Define how reporting will be performed

As part of the measurement planning, procedures about the reporting mechanisms and reporting lines 

should also be defined. These reporting mechanisms include the procedures for deviation notifications 

and  investigation,  and  the  possible  corrective  actions  to  be  performed  accordingly.  The  reporting 

periodicity and  the  life  cycle milestones and  events when  these  reports  should be available  should 

also be documented in the measurement plan. 

6.2.6 Review and approve the measurement plan The results of measurement planning should be reviewed and approved by project responsibles. 

Measurement planning should be  fed back  from previous measurement cycles and should  take  into 

consideration improvements and updates proposed, if any. 6) 

These possible  improvements  should be analysed  regarding any  impact  (resources,  schedule,  tools, 

etc) in current measurement plan. 

                                                 5) [Adapted from ISO/IEC 15939 clause 4.1.2.1] 6) [Adapted from ISO/IEC 15939 clause 4.2.6.1] 

ECSS‐Q‐HB‐80‐04A  

30 March 2011 

34 

6.2.7 Provide resources and infrastructure for measurement tasks

After the measurement plan is approved, the roles identified in the measurement plan are assigned to 

individuals within the project, including the responsible of the planning process itself. The resources 

and tools defined in the plan should also be provided (often to be acquired and always to be deployed 

for that specific project) to those implementing all the activities defined in the measurement plan.  

Any training needs should also be provided in support to the performance of the metrication activities 

and the use of the methods and tools identified for this project.  

Tools for collecting data (so called in figure above ‘data capture infrastructure’) as for example static 

code analysers and test coverage monitors, are typical tools required.  

This can involve the modification or extension of existing tools, and the calibration and testing of the 

tools. 7) 

For  the  storage  of  the  data,  ‘data  archiving  infrastructure’  should  also  be  provided  (acquired  if 

necessary). This infrastructure can be different than the one used to capture the data, since it might be 

composed by e.g. databases or storage media including project context information.  

Both  configuration  management  and  security  procedures  to  preserve  the  integrity  of  the  data 

captured, analysed and stored should be implemented as planned. 

6.3 Data collection The data collection should include the following aspects: 

1. Integrate procedures 

2. Collect data 

6.3.1 Integrate procedures These  tasks  are  intended  to  be  performed  in  accordance with  the  planning  information  produced 

during the tasks described in subclause 6.2. 

The first action to be performed is the integration of the data generation, collection and storage tasks 

into the relevant processes. 

This may  imply  changing  current  engineering  and  development  processes  to  accommodate  data 

generation,  collection  and  storage  activities,  tools  and  any  other  resources  needed.  Integration 

involves a  trade‐off between  the extent of  impact on existing processes and  the requirements of  the 

measurement process. The required changes should be minimized.  

The extent of  integration varies depending on  the  type of measures and  the  information needs. The 

data collected can include extra measures defined specifically to evaluate the information products or 

performance measures to evaluate the measurement process. 8) 

The integrated data collection procedures should be communicated to the measurement providers.  

The objective of this communication is to ensure confidence that measurement providers understand 

exactly the type of data that are expected, the format that is required, the tools to use, when to provide 

data,  and  how  frequently.  For  example,  the  measurement  providers  can  be  trained  on  how  to 

                                                 7) [Adapted from ISO/IEC 15939 clause 4.2.7.1] 8) [Adapted from ISO/IEC 15939 clause 4.3.1.1] 

ECSS‐Q‐HB‐80‐04A  

30 March 2011 

35 

complete a defect data form, to ensure that they understand the defect classification scheme, and the 

meanings of different types of effort (such as isolation and correction effort). 9) 


The  data  analysis  and  reporting  should  also  be  integrated  into  the  relevant  project  processes  and 

performed on a regular basis. 10) 

6.3.2 Collect data After  integration, when collecting  the data,  the  selected metrics are measured using  the designated 

formula (so called measurement formula in Figure 5‐1).  

This can be accomplished by manual or automated means. Data can be collected, for example, with a 

static code analyser that calculates values for product metrics every time a module is checked into a 

configuration management  system. Data also  can be  collected,  for  example, by  completing a defect 

data form and sending it to the measurement librarian. 11) 

6.4 Data validation In addition,  the collected data should be validated. The measurement owner should  take necessary 

actions  to ensure  the quality of  the collected data. The actions should  include validating automated 

tools for data collection and checking data by human procedures.  

Data validation can be performed by inspecting against a checklist or by checking the data or metric 

value obtained against the defined valid range of values. The checklist can be constructed to validate 

that missing data are minimal, and that the values make sense. Examples of the latter include checking 

that a defect classification  is valid, or  that  the  size of a component  is not  ten  times greater  than all 

previously entered components. In case of anomalies, the measurement provider(s) is consulted and 

corrections to the raw data made where necessary. 12) 

The defined procedures for these anomaly corrections should be used [ISO 15939]. 

6.5 Data analysis The collected data is analysed.  

Data  can  be  aggregated,  transformed,  or  re‐coded  prior  to  analysis,  following  the  measurement 

function defined for each metric. During this analysis task, data are processed to produce the planned 

indicators. The amount of rigor in the analysis should be determined by the nature of the data and the 

information needs. 13) 

Afterwards, the data analysis, results are interpreted.  

The measurement analyst(s) should be able to draw some initial conclusions based on the results. 14) 

Actual values for the different metrics collected are analysed. In case of undesirable values, the cause 

is analysed, thereby allowing the target audience to understand and react to problems. 

                                                 9) [Adapted from ISO/IEC 15939 clause 4.3.1.2] 10) [Adapted from ISO/IEC 15939 clause 4.3.1.3] 11) [Adapted from ISO/IEC 15939 clause 4.3.2.1] 12) [Adapted from ISO/IEC 15939 clause 4.3.2.3] 13) [Adapted from ISO/IEC 15939 clause 4.3.3.1] 14) [Adapted from ISO/IEC 15939 clause 4.3.3.2] 

ECSS‐Q‐HB‐80‐04A  

30 March 2011 

36 

Actual  values  are  compared with  target  values when  they  are  assigned. Actual  values  should  be 

analysed in order to identify outlier values (i.e. values deviating from predefined thresholds). Outlier 

values often indicate problems or unusual conditions. Explanation of outlier values should always be 

justified:  sometimes  there  are  good  reasons  for  outlier  values  and  in  that  case,  there might  be  no 

reason  for  corrective  actions.  Contingency  actions  should  be  taken  when  required  following  the 

defined procedures in the measurement plan. 

All interpretations should take into account as defined for each of the metrics within its context. 

The data analysis results, indicators, interpretations, justifications and supporting information should 

be  all  documented  and  reported  including  the  relevant  analysis  performed,  the  corrective  actions 

undertaken and the status of these actions. 15) 

The  reports of  the analysis obtained  should be  reviewed  (with  the measurement providers and  the 

target  audience)  to  ensure  that  the  analysis  was  performed  and  interpreted  properly,  that  the 

information  needs  were  satisfied  and  that  potential  corrective  actions  are  feasible.  It  can  be  an 

informal “self‐review”, or a more formal inspection process depending on each project’s requirements.  

6.6 Data archiving The  collected data  should  always be  stored,  including  any  context  information necessary  to verify, 

understand, or evaluate the data. The data store may not be an automated tool. It is possible to have a 

paper‐based data store,  for example,  in  the situation where only a  few measures are collected  for a 

short period of time in a small organization. 16) 

This  storage  should  be  performed  both  for  the  project  under  development,  and  also  for  historical 

reasons, i.e. to enable the eventual use of this collected and analysed data by other. This measurement 

database  is  intended  to capture analysis  results  from past  iterations of  the cycle of  the metrics  that 

have been found to be useful by the organization, previous evaluations of information products, and 

evaluations of previous  iterations of  the measurement process. This database should be a persistent 

storage since its data (for example, analysis results, historical data, and lessons learned) are intended 

to be reused in future iterations of the measurement process. 

6.7 Reporting All  results  from  the different metrication  activities  should be documented  in  the  software product 

assurance report of the project (subclauses 6.2.5 and 7.1 of [ECSS‐Q‐80]). 

These analysis results are documented and communicated to the target audience, to the measurement 

providers, and other project responsibles, so the level of reporting can vary depending on recipients 

(e.g. internal to the project, external customer). The reporting intervals to which target audience and 

with  respect  to  life  cycle  events  (e.g. milestones,  reviews)  should  follow  what  is  defined  in  the 

measurement plan. 

NOTE  Activities described in sections 6.2 to 6.5 are often performed in an 

iterative manner, therefore reporting activities are iterative too. 

Example guidelines for reporting the analysis results are provided in [ISO 15939]  

                                                 15) [Adapted from ISO/IEC 15939 clause 4.3.3.2] 16) [Adapted from ISO/IEC 15939 clause 4.3.2.2] 

ECSS‐Q‐HB‐80‐04A  

30 March 2011 

37 

6.8 Feedback to the measurement process This subclause describes how to enhance the metrication programme based on lessons learnt from its 

practical  application.  This  activity  often  involves  both  customer  and  supplier  and  consists  of  the 

following tasks: 

1. Evaluate analysis results and the measurement process 

2. Identify potential improvements 

6.8.1 Evaluate analysis results and the measurement process

Both the metrics analysis results and the measurement process  itself are evaluated for measurement 

process improvement.  

The metrication process  analysis  results  are  evaluated  against  the  specified  evaluation  criteria  and 

conclusions  on  strengths  and  weaknesses  of  the  analysis  results  drawn.  This  evaluation may  be 

accomplished  through  an  internal  or  independent  audit.  The  inputs  to  this  evaluation  are  the 

performance measures, the analysis results, and the target audience feedback.  

The evaluation of the analysis results can conclude that some measures may be removed, for example, 

if they no longer meet a current information need. 17) 

The  effectiveness  of  each measurement  formula  used  by  the measurement  process  requires  being 

evaluated using pre‐defined  criteria. The  following are  examples of  such  criteria  (i.e.  this  is not an 

exhaustive list): 

Usefulness  of  analysis  results:  The  extent  to  which  the  analysis  results  produced  by  the 

measurement process  are  actually used  for decision making  in  the management or  technical 

processes supported by measurement. 

Confidence  in  the analysis  results: The  extent  to which  the  consumers of  the analysis  results 

(target  audience)  have  confidence  in  the  raw  data,  derived  metrics  and  interpretations 

incorporated in the analysis result. 

Evidence of fitness for purpose of the analysis results: The extent to which the analysis results 

can be demonstrated to be effective for the identified information need. 

Understandability  of  the  results: The  ease with which  the metrics  and  the  interpretations  of 

them can be understood by the intended target audience. 

Satisfaction of the assumptions of a quality model: The extent to which assumptions inherent in 

the model on which a metric is based have been satisfied (e.g. data distributions, measurement 

scales, units of measure, sample size). 

Accuracy of a formula: The extent to which the procedure implementing a formula conforms to 

the intended evaluation method. An accurate procedure produces results similar to the true (or 

intended) value of the base measure. 

Repeatability of an evaluation method: The degree to which the repeated use of the formula in 

the same organization  following  the same evaluation method under  the same conditions  (e.g. 

tools, individuals performing the measurement) produces results that can be accepted as being 

identical. Subjective evaluation methods  tend  to experience  lower  repeatability  than objective 

methods. Random measurement error reduces repeatability. 18) 

                                                 17) [Adapted from ISO/IEC 15939 clause 4.4.1.1] 18) [Adapted from ISO/IEC 15939 Annex D] 

ECSS‐Q‐HB‐80‐04A  

30 March 2011 

38 


The measurement process  is  evaluated  against  the  specified  evaluation  criteria  and  conclusions on 

strengths and weaknesses of the measurement process drawn. The evaluation of measurement process 

may be accomplished through an internal or independent audit or process assessment. 19) 

The expected benefits for supplier and customer of this evaluation and improvement process can be, 

by instance: 

For  the  Supplier:  Software  process  and  product  improvements  (company  wide  benefits, 

software engineering process group) 

For the Customer: Potential improvements in current developments, better process follow up at 

suppliers. 

The quality of the measurement process influences the quality of the information products. The inputs 

to  this evaluation are  the performance measures,  the  information products, and  the  target audience 

feedback. 20) 


The goodness of a process may be judged by assessing its capability or by measuring and evaluating 

its  performance.  This Handbook,  as  a whole,  can  be  used  as  a  reference model  for  assessing  the 

capability of a measurement process. 

The  following  criteria  can be  regarded  as potential  information needs of  the measurement process 

responsible. The measurement process described in this Handbook can be applied to produce results 

that address the information needs identified by the measurement process responsible. 

Timeliness: The measurement process should provide the analysis results in time to support the 

requirements  of  the  target  audience.  Appropriate  timing  depends  on  the  schedule  of  the 

management or technical process being supported. 

Efficiency: The measurement process  should not  cost more  to perform  than  the value of  the 

information that it provides. The more efficient the process, the lower its cost, and the greater 

the cost/benefit. 

Defect containment: The measurement process should avoid the introduction of erroneous data 

and results, while removing any that do get introduced as thoroughly and soon as possible. 

Customer satisfaction: The users of information products should be satisfied with the quality of 

the  analysis  results  and  the performance of  the measurement process  in  terms of  timeliness, 

efficiency, and defect containment. Satisfaction can be affected by the user’s expectation of the 

level of quality and performance to be provided. 

Process conformity: The execution of measurement activities should conform to any plans and 

procedures developed  to describe  the  intended measurement process. This may be  judged by 

quality management audits or process capability assessments. 21) 


Lessons learned from the evaluation can take the form of strengths and weaknesses of the information 

products,  of  the  measurement  process,  of  the  evaluation  criteria  themselves,  or  experiences  in 

measurement planning  (for  example,  “there was great  resistance by  the measurement providers  in 

collecting a specific measure at a specific frequency”). 22) 

                                                 19) [Adapted from ISO/IEC 15939 clause 4.4.1.2] 20) [Adapted from ISO/IEC 15939 clause 4.4.1.2] 21) [Adapted from ISO/IEC 15939 Annex E] 22) [Adapted from ISO/IEC 15939 clause 4.4.1.3] 

ECSS‐Q‐HB‐80‐04A  

30 March 2011 

6.8.2 Identify potential improvements Potential  improvements  from  above  evaluations are  identified  to both  the metrics  and  the  analysis 

results and the measurement process. 

The measurement  responsible  should  review  the  results  of  the  evaluation  and  the  validity  of  the 

evaluation process, indicators and metrics applied. Feedback from the review should be used in order 

to  improve  the  evaluation  process  and  evaluation modules. When  it  is  necessary  to  improve  the 

evaluation modules  the data collection  for extra  indicators  should be  included,  in order  to validate 

them for later use. 

Such “Improvement Actions” should be used  in  future  instances of  the  initial metrication planning 

activity. Cost/benefit  analyses when  selecting  the  “Improvement Actions”  to  implement  should  be 

considered. Some improvements might not be cost effective, so not to be performed for that project.  

Measurement process changes should be provided  to  the overall measurement process  responsible, 

and measurement product changes should be provided to the measurement analyst(s). If no potential 

improvements  are  identified,  then  that  should  also  be  communicated  to  the measurement  process 

responsible. 

In  [ISO  15939]  and  other  literature  sample  activities  to  improve  the  efficiency  of  the metrication 

programme can be found. 

39 

ECSS‐Q‐HB‐80‐04A  

30 March 2011 

Annex A Definition of the quality model

A.1 General introduction This  annex  presents  the  details  of  the  reference  quality model  proposed,  as  a  synthesis  result  of 

several quality models proposed in the main input sources and bibliography used for the preparation 

of this Handbook. 

This framework is proposed as an example of quality model that can be used for the selection of the 

relevant characteristics and sub‐characteristics specific to each project, as well as some metrics that can 

be used to measure them. 

Projects developed  by using OO  approach will  find  some OO metrics  in Annex A.4  to use where 

traditional metrics cannot be applied straightforward, e.g.  to measure  the complexity of  the design, 

They are proposed as an alternative to the classic metrics (i.e. modular span of control), which are not 

considered appropriate for an object‐oriented design approach. 

The annex includes a glossary of the definitions used for each characteristic / sub‐characteristic of the 

quality model, including detailed traces to the origin of each definition. 

After this, it is also detailing each proposed metric defined in previous table 5‐1 as contributing to the 

different sub‐characteristics. 

A.2 Characteristics and sub-characteristics definition As a complement  to  the previous Table 5‐1,  this subclause provides  the definitions  for  the different 

characteristics / sub‐characteristics included in the quality model, as well as an  indication where the 

definition is taken from. 

A.2.1 Functionality

The  capability  of  the  software product  to provide  functions which meet  stated  and  implied  needs 

when the software is used under specified conditions. 

Definition taken from: [ISO 9126], [SPEC] 

Mentioned in: [ECSS‐E‐40], [ECSS‐Q‐80] 

A.2.1.1 completeness

The capability of the software to provide full implementation of the functions required. 

Definition taken from: [SPEC] 

Mentioned in: [ECSS‐E‐40], [NASA‐1740] 

40 

ECSS‐Q‐HB‐80‐04A  

30 March 2011 

A.2.1.2 correctness

The  degree  to  which  a  system  or  component  is  free  of  faults  in  its  specification,  design  and 

implementation. 

Definition taken from: [SPEC] [ISO 24765] 

Mentioned in:  [NASA‐1740] 

A.2.1.3 efficiency

The capability of the software product to provide appropriate performance, relative to the amount of 

resources used, under stated conditions. 

Definition taken from: [ISO 9126], [SPEC] 

NOTE  In [ECSS‐S‐ST‐00‐01] it is defined differently but re‐defined in this 

Handbook as more related to software quality aspects. 

A.2.2 Reliability

The capability of the software product to maintain a specified level of performance when used under 

specified conditions. 

Definition taken from: [ISO 9126], [SPEC] 

NOTE  In  [ECSS‐S‐ST‐00‐01]  it  is  defined  very  similarly  but  here  it 

specifically refers to software. 

Mentioned in: [ECSS‐Q‐80] 

A.2.2.1 reliability evidence

The capability to show that software reliability analysis and assessment have been performed during 

the software development process. 

Definition taken from: [SPEC] 

A.2.3 Maintainability

Ability of an item under given conditions of use, to be retained in, or restored to, a state in which it 

can perform a required function, when maintenance  is performed under given conditions and using 

stated procedures and resources. 

Definition taken from: [ECSS‐S‐ST‐00‐01]  

NOTE  In  [ISO  9126],  [SPEC]  it  is  referring  to  The  capability  of  the 

software  product  to  be  modified.  Modifications  can  include 

corrections,  improvements  or  adaptation  of  the  software  to 

changes  in  environment,  and  in  requirements  and  functional 

specifications. 

Mentioned in: [ECSS‐Q‐80] 

A.2.3.1 modularity

The degree to which a system or computer program is composed of discrete components such that a 

change to one component has minimal impact on other components  

41 

ECSS‐Q‐HB‐80‐04A  

30 March 2011 

Definition taken from: [ISO 24765] 

Mentioned in: [ECSS‐Q‐80] 

A.2.3.2 testability

Extent to which an objective and feasible test can be designed to determine whether a requirement is 

met. 

Definition taken from: [ISO 24765] 

Mentioned in: [ECSS‐E‐40] 

A.2.3.3 complexity

the  degree  to  which  a  systemʹs  design  or  code  is  difficult  to  understand  because  of  numerous 

components or relationships among components 

Definition taken from: [ISO 24765] 

A.2.4 Reusability

Degree  to which a software module or other work product can be used  in more  than one computer 

program or software system. 

Definition taken from: [ECSS‐Q‐80] 

A.2.4.1 reusability documentation

The availability of specific documentation which provides information about reusing the software; e.g. 

in  which  context  and  applications  the  component  can  be  reused,  with  which  constraints,  which 

additional tests might be needed for the new operational environment. 

Definition taken from: [New definition proposed in this Handbook] 

A.2.4.2 portability

Capability of software to be transferred from one environment to another. 

Definition taken from: [ECSS‐E‐40], [ECSS‐Q‐80] 

A.2.4.3 reuse modification

Percentage of estimated modifications applied to every existing software component. 

Definition taken from: [New definition proposed in this Handbook] 

A.2.5 Suitability for safety

System state where an acceptable  level of risk with respect to fatality,  injury or occupational  illness, 

damage to launcher hardware or launch site facilities, damage to an element of an interfacing manned 

flight system, the main functions of a flight system itself, pollution of the environment, atmosphere or 

outer space, and damage to public or private property. 

Definition taken from: [ECSS‐S‐ST‐00‐01]  

42 

ECSS‐Q‐HB‐80‐04A  

30 March 2011 

NOTE  Similar definitions can be found in [ISO 9126](The capability of the 

software  product  to  achieve  acceptable  levels  of  risk  of  harm  to 

people,  business,  software,  property  or  the  environment  in  a 

specified context of use) and in [SPEC] (The capability of software 

to allow and contribute to the safe behaviour of the system). 

Mentioned in: [ECSS‐E‐40], [ECSS‐Q‐80] 

A.2.5.1 safety evidence

The capability to show that software safety analysis and assessment have been performed during the 

software development process. 

Definition taken from: [SPEC] 

A.2.6 Security

Protection from unauthorized access or uncontrolled losses or effect. 

Definition taken from: [ECSS‐S‐ST‐00‐01] 

NOTE  Similar definition  can be  found  in  [ISO  9126](The  capability  of  the 

software  product  to  protect  information  and  data  so  that  unauthorized 

persons or systems cannot read or modify them and authorized persons or 

systems are not denied access to them). A different composed definition is 

found  in  [ISO  17799]  (Preservation  of  confidentiality,  integrity  and 

availability of information: 

Confidentiality: Ensuring that  information  is accessible only to 

those authorized to have access. 

Integrity:  Safeguarding  the  accuracy  and  completeness  of 

information and processing methods. 

Availability:  Ensuring  that  authorized  users  have  access  to 

information and associated assets when required) 

Also mentioned in: [ECSS‐E‐40], [ECSS‐Q‐80] 

A.2.6.1 security evidence

The capability  to show  that software security analysis and assessment have been performed during 

the software development process. 

Definition taken from: [SPEC] 

A.2.7 Usability

Capability of  the software  to be understood,  learned, used and  liked by  the user, when used under 

specified conditions. 

Definition taken from: [ECSS‐Q‐80] 

A.2.7.1 user documentation quality

Those attributes of the software that determine the adequacy of the documentation related to software 

development, maintenance and operation. 

43 

ECSS‐Q‐HB‐80‐04A  

30 March 2011 

Definition taken from: [SPEC] 

A.2.7.2 user interface quality

The capability of the software product that allow the user to efficiently and reliably communicate with 

the software. 

Definition taken from: [New definition proposed in this Handbook] 

A.2.8 Software development effectiveness

Extent to which planned activities are realized and planned results achieved. 

Definition taken from: [ECSS‐S‐ST‐00‐01] 

NOTE  Other  definitions  are  found  in  [ISO  9126]  (The  capability  of  the 

software product  to  enable users  to  achieve  specified  goals with 

accuracy  and  completeness  in  a  specified  context  of  use)  and  in 

[SPEC] (The degree of success/quality of the development process 

to  which  the  software  was  subjected,  which  provide  valuable 

indications of the product quality). 

Mentioned in: [ECSS‐Q‐80] 

A.2.8.1 project development process level

The results of a software process assessment showing the achieved level of capability of the processes 

composing  the  software development  process  on  the  basis  of  the  analysis  of  the  current  practices 

within the organization producing the software. 

Definition taken from: [SPEC] 

A.2.8.2 project management effectiveness

The  capability of  the  software development process  to  asses  the quality  in  the management of  the 

process in a specified context of use. 

Definition taken from: [New definition proposed in this Handbook] 

A.3 List of proposed metrics

A.3.1 Introduction

This subclause provides a detailed description of all metrics proposed to measure the above presented 

characteristics and sub‐characteristics. 

The list of proposed metrics is not exhaustive. This Handbook is not intended to provide an extensive 

tutorial on metrics, something that is well covered by the existing literature on software metrics. What 

is proposed here is a realistic set of metrics that cover the needs of most space projects. The selection 

of  metrics  is  based  on  the  applicable  [ECSS‐Q‐80]  requirements  complemented  by  the  practical 

experience of the working group members accumulated in real projects. 

44 

ECSS‐Q‐HB‐80‐04A  

30 March 2011 

A.3.2 Standard metric template

The  following metric  template  is used  for all metrics described  in  this annex. For  each  field  in  the 

template, a brief description is provided together with one example. 


Main Characteristic  Related main characteristic(s) of the quality model proposed in this 

document. 

e.g. Functionality 

Sub Characteristic  Related sub characteristic(s) of the quality model proposed in this 

document. 

e.g. Completeness 

Metric title  Descriptive name for this metric. 

e.g. Functional requirements implementation coverage 

Goal  Purpose of this metric (i.e. what is it collected for). 

e.g. Check whether all functional requirements are validated by system tests 

with positive results 

Owner / Producer  Identification of owner and producer of this metric. 

e.g. owner: SW PA responsible; producer: development team 

Target audience  Identification of the target audience for this metric (i.e. users). 

e.g. developers, project manager 

Evaluation method  Measurement method used for the computation of this metric. 

e.g. Functional testing results analysis; Specification analysis 

Indicate also whether this metric can be collected by manual means, 

automatic means, or both. 

Manual means such as:  checklists, peer review, visual inspection. 

Automatic means:  results produced by SW tools 

Formula  Computation formula for this metric. 

e.g. X = A/B 

A = number of correctly implemented functional requirements confirmed by 

executed tests (System tests) 

B = number of functional requirements 

Any specific precision and accuracy requirements should be also defined in 

here  

Interpretation of 

measured value 

Target value(s) for this metric. 

e.g. 0 <= X <= 1, the closer to 1 the better 

An indication of different target values depending on the criticality 

can be also given here. 

45 

ECSS‐Q‐HB‐80‐04A  

30 March 2011 

Life cycle phase  Indication of when this metric should be collected and provided 

(according to [ECSS‐E‐40] terminology): 

Collected at (possible values):Software related system engineering / SW 

requirements & architecture engineering / SW design & implementation 

engineering / SW validation / SW delivery & acceptance / SW verification 

process / SW operation / SW maintenance 

Provided at: SRR, PDR, DDR, CDR, QR and SW‐AR 

Also possible: an indication of start phase + frequency: 

Example 1: As of PDR, to be provided at every review. 

Example 2: To be provided for each progress meeting. 

Applicability  Applicability of this metric depending on the criticality using the 

criticality categories provided in [ECSS‐Q‐80] subclause D.1. 

Possible values: 

MANDATORY (quality requirement) 

RECOMMENDED (some  added value to the project expected) 

OPTIONAL  (for internal use only) 

N/A (not applicable) 

Note: The applicability of the different questions of the checklists 

proposed for few metrics in this quality model are illustrative and 

therefore they shall be tailored and re‐defined according to the 

requirements for each project. 

Pre‐conditions  Any prerequisite that is to be satisfied before this metric can be 

collected and analysed. 

e.g. Functional Requirements data will be available and accessible 

Report format  How the results of this metric will be presented. 

e.g. bar chart, document, pie chart. 

Other remarks   


46 

ECSS‐Q‐HB‐80‐04A  

30 March 2011 

A.3.3 Detailed description of all metrics

A.3.3.1 Requirement allocation

Main Characteristic  Functionality 

Sub Characteristic  Completeness 

Metric name  Requirement allocation 

Goal  This metric identifies the relationship among: 

‐ Higher level requirements and software level requirements; 

‐ SW requirements and SW design. 

Owner / Producer  Owner: development leader 

Producer: development team 

Target audience  Development leader, SW PA manager, V&V leader 

Evaluation method  Traceability matrices contained in SW requirements and SW design 

documentation. 

Formula  X= A/B, where: 

A = number of system level requirements for software that have one or 

more trace to SW requirements or SW design components; 

B = number of system level requirements for software 

Interpretation of 

measured value 0 <= X <= 1, the closer to 1 the better 

Life cycle phase  Collected during software related system engineering, SW 

requirements & architecture engineering, SW design & 

implementation engineering processes. 

Provided at SRR, and updated afterwards (e.g. PDR) as required. 

Applicability  ‐ MANDATORY for all criticality categories. 

Pre‐conditions  Availability of traceability matrices. 

Report format  See example below. 

Other remarks   


47 

ECSS‐Q‐HB‐80‐04A  

30 March 2011 

48 

1) Requirements level n and n‐1    2) SW requirement design comp. 

Level n 

Requirements 

Level n‐1 

Requirements 

  Software 

Requirements 

SW components 

associated 

Req‐1  Req‐1, Req‐2    Req‐1  SC‐1, SC‐2 

Req‐2  Req‐3    Req‐2  SC‐3

Req‐3  ‐‐    Req‐3  SC‐4

Req‐4  Req‐4    Req‐4  ‐‐ 

Req‐5  Req‐5    Req‐5  SC‐5 

FORMULA = 4/5 = 80%    FORMULA =4/5 = 80% 

Legend:  Req means requirement  

           SC means Software Component    

Figure A‐1: Example of report format for requirements allocation 

A.3.3.2 Requirement implementation coverage

Main Characteristic  Functionality 

Sub Characteristic  Completeness 

Metric name  Requirement implementation coverage 

Goal  This metric provides the percentage of requirements that are 

implemented and properly verified in the product. 

Owner / Producer  Owner: V&V leader 

Producer: V&V team 

Target audience  SW PA manager, V&V leader, development leader 

Evaluation method  Analysis of traceability matrices (i.e. requirements versus verification 

method), eventually with the aid of some automatic tools (e.g. 

DOORS). 

Formula  X= A/B, where: 

A = number of correctly implemented requirements confirmed by 

verification (including test, inspection, review, and analysis, 

validation); 

B = number of requirements 

Interpretation of 

measured value 

0 <= X <= 1, the closer to 1 the better 

Those requirements that are not implemented or verified should be 

covered by the corresponding RFD/RFW. 

Life cycle phase  Collected during SW validation and verification processes. 

Provided at PDR, and updated afterwards as required. 

Applicability  ‐ MANDATORY for all criticality categories. 

Pre‐conditions  Availability of traceability matrices. 

Report format  Textual (just a figure). 

Other remarks   


ECSS‐Q‐HB‐80‐04A  

30 March 2011 

A.3.3.3 Requirement completeness

Main Characteristic  Functionality 

Sub Characteristic  Completeness 

Metric name  Requirement completeness 

Goal  This metric provides the number of remaining open points in the 

requirements. 

Owner / Producer  Owner: SW PA manager 

Producer: development team 

Target audience  SW PA manager, development leader 

Evaluation method  Analysis of requirements documents (e.g. SRD, ICDs), eventually 

with the aid of automatic tools (e.g. macros). 

Formula  X= A/B, where: 

A= number of requirements containing TBCs/TBDs; 

B= total number of requirements; 

Interpretation of 

measured value 0 <= X <= 1, the closer to 0 the better 

Life cycle phase  Collected during SW requirements & architecture engineering. 

Provided at PDR, and updated afterwards as required. 

Applicability  ‐ RECOMMENDED for criticality categories A, B and C. 

‐ OPTIONAL for criticality category D. 

Pre‐conditions  ‐ Availability of requirements documents. 

‐ Use of a supporting tool is highly recommended. 

Report format  TBC/TBD table as an annex to the relevant document (including 

summary figures). 

Other remarks  The metric does not take into consideration the relevance of each 

TBC/TBD (otherwise it would become too complicate to be collected). 

It just provides an indication of the number of open points. 


49 

ECSS‐Q‐HB‐80‐04A  

30 March 2011 

A.3.3.4 V&V coverage

Main Characteristic  Functionality 

Sub Characteristic  Completeness 

Metric name  V&V coverage 

Goal  This metric allows identifying whether the test and validation 

strategy (including inspection, review, and analysis) is complete. It is 

applicable to each element subject to V&V activities (e.g. 

requirement, SW design component, internal and external interface). 

Owner / Producer  Owner: V&V leader 

Producer: V&V team 

Target audience  SW PA manager, V&V leader, development leader 

Evaluation method  Analysis of traceability matrices included in the DJF. 

Formula  X = A/B, where: 

A = number of elements covered by at least one V&V activity (test, 

inspection, review or analysis); 

B = total number of element; 

Interpretation of 

measured value 

0 <= X <= 1, the closer to 1 the better 

No specific target value for each criticality level. 

Life cycle phase  Collected during SW validation and verification processes. 

Provided at PDR, and updated afterwards as required.. 

Applicability  At requirements level (RB/TS): 

‐ MANDATORY for all criticality levels. 

At unit/integration level: 

‐ MANDATORY for criticality levels A to C. 

‐ OPTIONAL for criticality levels D and E. 

Pre‐conditions  ‐ Completion of V&V planning activities for each phase. 

‐ Availability of relevant traceability matrices. 

Report format  See example below. 

Other remarks  This metric can be treated as a single metric for all verification levels 

(unit, integration, TS and RB), or can be decomposed into individual 

metrics for each level. 


50 

ECSS‐Q‐HB‐80‐04A  

30 March 2011 

Table A‐1: Example of V&V coverage reporting 

Requirements 

Specification 

Validation Test 

Procedure 

Status 

Req‐1  Proc‐1  Defined 

Req‐2    Not yet defined 

Req‐3  Proc‐2  Defined 

  Proc‐3  Defined 

  FORMULA = 2/3 = 66% 


51 

ECSS‐Q‐HB‐80‐04A  

30 March 2011 

A.3.3.5 SPR/NCR trend analysis

Main Characteristic  Functionality, Maintainability, Reliability, Suitability for safety 

Sub Characteristic  Correctness 

Metric name  SPR/NCR trend analysis 

Goal  This metric provides a graphical representation of the evolution of 

SPR/NCR correction over time, classified by SPR/NCR severity 

levels. 

Owner / Producer  Owner: SW PA manager  

Producer: CM responsible 

Target audience  SW PA manager, development leader, V&V leader, CM responsible 

Evaluation method  Analysis of SPR/NCR database. 

Formula  There is no formula associated to this metric. 

Interpretation of 

measured value 

‐ The graphic exhibit convergence between number of raised and 

fixed problems. The lower the gap between these numbers the better. 

‐ At a certain point during testing, the number of new discovered 

problems should remain stable. This can be used as test completion 

criteria. 

Life cycle phase  Collected during SW verification and validation, SW delivery and 

acceptance, SW operation and SW maintenance processes. 

Provided at CDR and updated afterwards for each milestone or 

progress meeting. 

Applicability  ‐ MANDATORY for all criticality categories. 

Pre‐conditions  ‐ SPR/NCR procedure defined and implemented. 

‐ A good policy to classify SPRs/NCRs by severity level (e.g. critical, 

major, minor) should be also in place. 

‐ SPR/NCR system that allows identifying those NCRs that are 

software‐related. 

‐ Availability of supporting tools to analyse the SPR/NCR database is 

strongly recommended. 

Report format  Graphical (cumulative chart) – See example below 

Other remarks  Only software‐related NCRs will be considered. 


Table A‐2: Example of summary of NCR‐SPR recorded 

SPR 

Identification 

Raised Date  Fixed Date  Severity Level 

SPR1  2/05/04  10/06/03  C 


SPRn  3/10/05  17/12/05  NC 


52 

ECSS‐Q‐HB‐80‐04A  

30 March 2011 

53 

Figure A‐2: Example of SPR/NCR trend analysis 

A.3.3.6 Requirement clarity

Main Characteristic  Functionality, Maintainability, Reliability, Suitability for safety 

Sub Characteristic  Correctness 

Metric name  Requirement clarity 

Goal  This metric provides an indication of the quality of the requirements. 

Owner / Producer  Owner: SW PA manager 

Producer: development team 

Target audience  SW PA manager, development leader 

Evaluation method  Analysis of requirements documents (SRD, ICDs), eventually with the 

aid of some automatic tools. 

Formula  X= A/B, where: 

A= number of ambiguous statements within the requirements 

documents; 

B= total number of statements within the requirements documents 

Interpretation of 

measured value 0 <= X <= 1, the closer to 0 the better 

Life cycle phase  Collected during SW requirements & architecture engineering. 

Provided at PDR, and updated afterwards as required. 

Applicability  ‐ RECOMMENDED for criticality categories A, B and C. 

‐ OPTIONAL for criticality category D. 

Pre‐conditions  ‐ Availability of requirements documents. 

‐ Use of supporting tools is strongly recommended. 

Report format  Tool dependant. 

ECSS‐Q‐HB‐80‐04A  

30 March 2011 

Other remarks  Ambiguous requirements are those that can have multiple meanings 

or those that seem to leave to the supplier the decision whether or not 

to implement a requirement. According to [SPEC]: 

Ambiguous phrases = Weak phrases + Optional phrases. 

Weak phrases contain at least one of the words: adequate, as 

appropriate, as applicable, but not limited to, normal, if practical, 

timely, as a minimum. 

Optional phrases contain at least one of the words: can, may, 

optionally. 


A.3.3.7 Suitability of development documentation

Main Characteristic  Functionality, Maintainability, Reliability, Suitability for safety 

Sub Characteristic  Correctness 

Metric name  Suitability development documentation 

Goal  This metric provides a subjective assessment of the adequacy of the 

development and V&V documentation. 

Owner / Producer  Owner: SW PA manager 

Producer: development team, V&V team 

Target audience  SW PA manager, development leader, V&V leader 

Evaluation method  Documentation suitability checklist (see sample checklist below) 

Formula  X = A/B, where: 

A = sum of Yes or N/A answers to the questions in the checklist 

B = total number of questions 

Interpretation of 

measured value 

The measured value will be 100% (i.e. all questions either positively 

answered or found not applicable). 

Life cycle phase  Collected during SW validation and verification processes. 

Provided at SRR, and updated afterwards as required. 

Applicability  ‐ MANDATORY for criticality categories A to D. 


Pre‐conditions  ‐ Availability of the relevant documentation. 

‐ Availability of team members to answer the checklist. 

Report format  Answered checklist. 

Other remarks  ‐ The proposed checklist covers both development and V&V 

documentation. 

‐ The proposed target values might seem quite strict, but this is not 

the case: For the lower criticality categories the answer to most 

questions is probably N/A. 


54 

ECSS‐Q‐HB‐80‐04A  

30 March 2011 

Table A‐3: Sample checklist for Suitability of development documentation  

No  Question  Supporting  Mark 

    Evidence  (Y,N,NA) 

1  The software interfaces are  completely and correctly 

specified 


2  The software requirement completely implements the system 

architecture and system requirements in terms of functional 

and performance specifications, software product quality 

requirements, security specifications, human factors 

engineering specifications, data definition and database 

requirements. 


3  The software requirements completely and consistently cover 

the HW/SW and SW/SW interfaces protocol definitions. 


4  The software requirements completely and consistently 

describe interactions and assumptions. 


5  A recognized method for software design is adopted and 

applied consistently. 


6  The architectural design defines the major components of the 

software and the interfaces between them. 


7  The architectural design defines or references all external 

interfaces. 


8  The architectural design document is complete, covering all 

the software requirements. 


9  The control flow between the components is defined.     

10  For each component the following information is detailed: 

data input, functions to be performed and data output. 


11  Re‐used components are clearly identified and properly 

documented. 


12  Data structures interfacing components are defined include: 

description of each element (e.g. name, type, dimension); 

relationships between the elements (i.e. the structure); range 

of possible values of each element; initial values of each 

element. 


13  The detailed design defines all components.     

14  All software verification and validation activities are 

documented. 


15  All the test procedures and data are in accordance with the 

test plans, namely in which respect to: the type of test to be 

performed, (e.g. functional, robustness, performance, 

usability, etc), test coverage goals 


16  The unit, integration, system and acceptance tests are 

properly documented reporting test design, cases, procedures 

and reports. 


55 

ECSS‐Q‐HB‐80‐04A  

30 March 2011 

56 

No  Question  Supporting  Mark 

    Evidence  (Y,N,NA) 

17  The following activities are covered in project plans: 

‐ development; 

‐ software product assurance; 

‐ specification, design and customer documents to be 

produced; 

‐ configuration and documentation management; 

‐ verification, testing and validation activities; 

‐ maintenance. 


18  SW development standards are defined and applied.     

19  Procedures and project standards include provision for all 

criticality categories of software included in the project. 


20  Detailed validation test and validation documentation (data, 

procedures and expected results) are consistent with the 

defined validation strategy. 


21  Validation test procedures, data and expected results are 

specified. 


22  All software verification and validation activities are planned 

and reported. 


23  Verification activities ensure that the product meets the 

quality, reliability, maintainability and safety requirements 

(stated in the requirements). 


ECSS‐Q‐HB‐80‐04A  

30 March 2011 

A.3.3.8 Adherence to coding standards

Main Characteristic  Functionality, Maintainability, Reliability, Suitability for safety 

Sub Characteristic  Correctness 

Metric name  Adherence to coding standards 

Goal  This metric provides a subjective assessment of the adherence to the 

applicable coding standards. 

Owner / Producer  Owner: SW PA manager 

Producer: development team 

Target audience  SW PA manager, development leader 

Evaluation method  Coding standards checklist, to be filled in with the help of static 

analysis tools. 

‐ Rules covered by automatic tools are expected to be verified for 100% 

of the code. 

‐ Sample code size will be specified for those rules to be verified 

manually (at least 5% of the code should be inspected). 

‐ No sample checklist is provided because this is strictly 

project/company dependant. 

Formula  X = A/B, where: 

A = sum of Yes or N/A answers to the questions in the checklist 

B = total number of questions 

Interpretation of 

measured value 

The measured value should be 100% (i.e. all questions either positively 

answered or found not applicable). 

No specific target value identified for each criticality category. 

Life cycle phase  Collected during SW validation and verification processes. 

Provided at CDR, and updated afterwards as required. 

Applicability  ‐ MANDATORY for criticality categories A to D. 

Pre‐conditions  ‐ Availability of the relevant documentation. 

‐ Availability of team members to answer the checklist. 

‐ Use of static analysis tools to support data collection is strongly 

recommended. 

Report format  ‐ Static analysis reports (textual and graphic, tool dependant). 

‐ Answered checklist for each manually inspected module. 

Other remarks  Even if no specific target values are identified (i.e. all applicable 

questions should be answered for the inspected modules), tailoring of 

this metric is possible from the point of view of sample code size, e.g.: 

‐ 10% of code should be inspected for levels A to C (in particular, 100% 

of the assembler code). 

‐ 5% of code should be inspected for level D 


57 

ECSS‐Q‐HB‐80‐04A  

30 March 2011 

A.3.3.9 CPU margin

Main Characteristic  Functionality 

Sub Characteristic  Efficiency 

Metric name  CPU margin 

Goal  This metric allows verifying whether the SW product fulfils its CPU 

margin requirements at a given phase of the development. 

Owner / Producer  Owner: SW development leader 

Producer: development team 

Target audience  Development leader, V&V leader, SW PA manager 

Evaluation method  Analysis of technical budgets versus applicable requirements. 

Formula  X = A/B, where: 

A= CPU power used (i.e. MIPS); 

B= Total CPU power (i.e. MIPS) 

Interpretation of 

measured value 

The estimated or measured CPU margin should be greater or equal 

than the required margin for the phase. 

Target values for this metric are strictly project dependant. 

Example: 50% CPU use at PDR; 75% CPU use at SW‐AR. 

Life cycle phase  Collection should start during the SW requirements & architecture 

engineering (preliminary estimation), and then continue during next 

phases. 

Provided at PDR and updated afterwards for each review. 

Applicability  ‐ MANDATORY for criticality categories A to C. 

‐ RECOMMENDED for criticality category D. 

Pre‐conditions  Availability of technical budgets updated for each review. 

Report format  ‐ Dedicated SW budget report as part of the DJF. 

‐ Global CPU margin should be indicated in the conclusions of that 

document. 

Other remarks  This metric is at the beginning based on estimations (for the initial 

phases), which then are replaced by actual measures (during SW 

validation and acceptance). 


58 

ECSS‐Q‐HB‐80‐04A  

30 March 2011 

A.3.3.10 Memory margin

Main Characteristic  Functionality 

Sub Characteristic  Efficiency 

Metric name  Memory margin 

Goal  This metric allows verifying whether the SW product fulfils its 

memory margin requirements at a given phase of the development. 

Owner / Producer  Owner: SW development leader 

Producer: development team 

Target audience  Development leader, V&V leader, SW PA manager 

Evaluation method  Analysis of technical budgets versus applicable requirements. 

Formula  X = A/B, where: 

A = memory size used; 

B = total memory size 

Interpretation of 

measured value 

The estimated or measured memory margin should be greater or equal 

than the required margin for the phase. 

Target values for this metric are strictly project dependant. 

Example: 60% memory use at PDR; 75% memory use at SW‐AR. 

Life cycle phase  Collection should start during the SW requirements & architecture 

engineering (preliminary estimation), and then continue during next 

phases. 

Provided at PDR and updated afterwards for each review. 

Applicability  ‐ MANDATORY for criticality category A to C. 

‐ RECOMMENDED for criticality category D. 

Pre‐conditions  Availability of technical budgets updated for each review. 

Report format  ‐ Dedicated SW budget report as part of the DJF. 

‐ Global memory margin should be indicated in the conclusions of that 

document. 

Other remarks  This metric is at the beginning based on estimations (for the initial 

phases), which are replaced later by actual measures (during SW 

validation and acceptance). 


59 

ECSS‐Q‐HB‐80‐04A  

30 March 2011 

A.3.3.11 Cyclomatic complexity (VG)

Main Characteristic  Maintainability 

Sub Characteristic  Complexity 

Metric name  Cyclomatic complexity 

Goal  This metric provides an indication of the code complexity, based on 

the number of linearly independent test paths for each subroutine. 

Owner / Producer  Owner: development leader 

Producer: development team 

Target audience  SW PA manager, development leader, V&V leader 

Evaluation method  Static code analysis with the support of automatic tools. 

Formula  The cyclomatic complexity of a single routine (function or procedure) 

is defined as: 

VG = (number of edges) ‐ (number of nodes) + 2 

Then, the cyclomatic complexity of a module is defined as: 

X = average VG for all routines in the module 

Interpretation of 

measured value 

In general, the lower the cyclomatic complexity the more simple and 

more testable a software product is. However, low complexity at 

routine level can increase granularity at design level. Therefore, a 

good compromise is to be reached for both properties. 

Proposed thresholds for the different criticality categories: 

VG target value for A‐B software: 10 

VG target value for C software: 15 

VG target value for D software: 20  

Further tailoring can be done in terms of allowed exceptions to these 

thresholds (such as multiple‐choice statements or error‐handling 

code). 

Life cycle phase  Collected during SW validation and verification processes. 

Provided at CDR, and updated afterwards as required. 

Applicability  ‐ MANDATORY for criticality categories A to D. 

Pre‐conditions  ‐ Coding activity finished (at least for a significant part of the 

product). 

‐ Availability of a static analysis tool (except maybe for small portions 

of assembler code). 

Report format  ‐ Tool dependant, but tabular and graphical results should both be 

provided (including summary figures). See sample in Figure A‐3 below. 

‐ Cyclomatic complexity results can be presented at routine level or at 

module level. 

60 

ECSS‐Q‐HB‐80‐04A  

30 March 2011 

61 

Other remarks  ‐ Remedial actions for modules/routines exceeding the threshold can 

be: redesign, code inspection, additional unit testing. 

‐ Adding comments to the code is not a good solution: poor design 

should be redesigned, not commented. 

‐ An alternative metric to the cyclomatic complexity is the essential 

complexity, where a more fair treatment is given to multiple‐choice 

statements (they only count as one for the complexity). 


For this Module: VG=5

Figure A‐3: Example of cyclomatic complexity 

ECSS‐Q‐HB‐80‐04A  

30 March 2011 

A.3.3.12 Nesting level

Main Characteristic  Maintainability 

Sub Characteristic  Complexity 

Metric name  Nesting level 

Goal  This metric provides an indication of the code complexity, based on 

the depth of imbrications of the code. 

Owner / Producer  Owner: development leader 

Producer: development team 

Target audience  SW PA manager, development leader, V&V leader 

Evaluation method  Static code analysis with the support of automatic tools. 

Formula  The nesting level of a single routine (function or procedure) is 

defined as: 

NL = maximum number of nested statements (simple or multiple‐

choice decisions, loops) in the routine 

(See sample computation in Figure A‐4 below) 

Then, the nesting level of a module is defined as: 

X = maximum NL for all routines in the module 

Interpretation of 

measured value 

In general, the lower the nesting level the more simple and more 

testable a software product is. However, too plain code might imply 

too complex design. Therefore, a good compromise should also be 

reached in this case. 

Proposed thresholds for the different criticality categories are: 

NL target value for A, B and C software: 5 

NL target value for D software: 7 

Further tailoring is also possible in terms of allowed exceptions to 

these thresholds (e.g. error‐handling code). 

Life cycle phase  Collected during SW validation and verification processes. 

Provided at CDR, and updated afterwards as required. 

Applicability  ‐ MANDATORY for criticality categories A to D. 

Pre‐conditions  ‐ Coding activity finished (at least for a significant part of the 

product). 

‐ Availability of a static analysis tool (except maybe for small 

portions of assembler code). 

Report format  ‐ Tool dependant, but tabular and graphical results should both be 

provided (including summary figures). 

‐ Nesting level results can be presented at routine level or at module 

level. 

62 

ECSS‐Q‐HB‐80‐04A  

30 March 2011 

63 

Other remarks  ‐ Remedial actions for modules/routines exceeding the threshold can 

be: redesign, code inspection, additional unit testing. 

‐ Nesting level and cyclomatic complexity values are very often 

highly coupled, but not always (they measure different kinds of 

complexity). 

‐ For programming languages where there is no separate exception 

block (e.g. ANSI C), error‐handling code is believed to increase 

nesting level in an artificial way. In some cases this can be used as a 

justification for high nesting level values. 


For this Module: NL=3

Figure A‐4: Example of nesting level 

ECSS‐Q‐HB‐80‐04A  

30 March 2011 

A.3.3.13 Lines of code (LOC)

Main Characteristic  Maintainability 

Sub Characteristic  Complexity 

Metric name  Lines of code 

Goal  This metric provides an indication of the code complexity, based on 

the number of executable lines per routine. 

Owner / Producer  Owner: development leader 

Producer: development team 

Target audience  SW project manager, SW PA manager, development leader, V&V 

leader 

Evaluation method  Static code analysis with the support of automatic tools. 

Formula  LOC = (total number of lines of code) – (comment and blank lines) 

Interpretation of 

measured value 

This metric can be computed at routine level or at module level (by 

simple aggregation). In this Handbook, thresholds are proposed at 

routine level, as no limit is established for the number of routines per 

module. 

Proposed thresholds for the different criticality categories: 

LOC target value for A‐C software: 50 

LOC target value for D software: 75 

Life cycle phase  Collected during SW validation and verification processes. 

Provided at CDR, and updated afterwards as required. 

Applicability  ‐ MANDATORY for criticality categories A to D. 

Pre‐conditions  ‐ Coding activity finished (at least for a significant part of the 

product). 

‐ Availability of a static analysis tool (except maybe for small 

portions of assembler code). 

Report format  Tool dependant, but tabular and graphical results should both be 

provided (including summary figures). 

Other remarks  ‐ There is some correlation between cyclomatic complexity and lines 

of code: high VG values imply often high LOC values; but not 

necessarily the opposite. 

‐ This metric is very often used to estimate effort in software projects 

(e.g. based on cost estimation models like COCOMO). 


64 

ECSS‐Q‐HB‐80‐04A  

30 March 2011 

A.3.3.14 Comment frequency

Main Characteristic  Maintainability 

Sub Characteristic  Complexity 

Metric name  Comment frequency 

Goal  This metric provides an indication of the legibility of the code in 

terms of percentage of comment lines. 

Owner / Producer  Owner: SW PA manager 

Producer: development team 

Target audience  SW PA manager, development leader 

Evaluation method  Static code analysis with the support of automatic tools. 

Formula  X= A/B, where: 

A = number of comment lines (excluding headers); 

B = LOC + (number of lines of comments) = total number of lines 

excluding blank lines 

Interpretation of 

measured value 

0 <= X <= 0.3 

Proposed thresholds for the different criticality categories: 

Target value for criticality categories A to C: 0.3 

Target value for criticality category D: 0.2 

The metric can be collected at routine or module level. Proposed 

thresholds are applicable in both cases. 

Life cycle phase  Collected during SW validation and verification processes. 

Provided at CDR, and updated afterwards as required. 

Applicability  ‐ MANDATORY for criticality categories A to D. 

Pre‐conditions  ‐ Coding activity finished (at least for a significant part of the 

product). 

‐ Availability of a static analysis tool (except maybe for small portions 

of assembler code). 

Report format  Tool dependant, but tabular and graphical results should both be 

provided (including summary figures). 

Other remarks  ‐ In modern programming, comment frequency is considered a poor 

indicator of legibility. Adherence to coding standards (naming 

conventions, programming rules) is considered a better alternative, 

although more expensive to reinforce and verify. 

‐ Remedial actions for modules/routines exceeding the threshold can 

be: code inspection to confirm whether additional comments are 

necessary or not. 

‐ If module/routine headers are included in this metric, then different 

thresholds should be established. 


65 

ECSS‐Q‐HB‐80‐04A  

30 March 2011 

A.3.3.15 Requirement testability

Main Characteristic  Maintainability, Reliability 

Sub Characteristic  Testability 

Metric name  Requirement testability 

Goal  This metric provides the percentage of requirements that are verified 

by test. 

Owner / Producer  Owner: V&V leader 

Producer: V&V team 

Target audience  SW PA manager, V&V leader, development leader 

Evaluation method  Analysis of traceability matrices (i.e. requirements versus validation 

tests), eventually with the aid of some automatic tools (e.g. DOORS). 

Formula  X = A/B, where: 

A = number of requirements verified by test; 

B = total number of requirements 

Interpretation of 

measured value 

0 <= X <= 1, the closer to 1 the better 

No generic target can be provided for this metric (it is application 

dependant), but a value below 80% should be a matter of concern. 

Life cycle phase  Collected during SW validation and verification processes. 

Provided at PDR, and updated afterwards as required. 

Applicability  ‐ MANDATORY for criticality categories A to C 

‐ RECOMMENDED for criticality category D. 

Pre‐conditions  Availability of traceability matrices. 

Report format  Textual (just a figure). 

Other remarks  This metric can be applied at both RB and TS levels. This would 

allow analysing how the requirement testability evolves down to 

next lower level. 


66 

ECSS‐Q‐HB‐80‐04A  

30 March 2011 

A.3.3.16 Modular span of control

Main Characteristic  Maintainability 

Sub Characteristic  Modularity 

Metric name  Modular span of control 

Goal  This metric provides an indication of the number of subroutines that 

are called by the subroutine under consideration (similar to fan‐out).  

Owner / Producer  Owner: SW PA manager  

Producer: development team 

Target audience  SW PA manager, development leader  

Evaluation method  Static code analysis with the support of automatic tools. 

Formula  There is no formula associated to this metric. 

Interpretation of 

measured value 

The modularity of the software product is the better the smaller the 

number of subroutines with a number of called subroutines that 

exceeds the agreed target value 

Proposed thresholds for the different criticality categories: 

MSC target value for A software: 2 

MSC target value for B software: 5 

MSC target value for C software: 7 

MSC target value for D software: 9 

Life cycle phase  Collected during SW design and implementation engineering and 

SW verification processes. 

Provided at CDR and updated afterwards as required 

Applicability  ‐ MANDATORY for criticality category A 

‐ RECOMMENDED for criticality categories B and C 

‐ OPTIONAL for criticality category D. 

Pre‐conditions  Source code is available. 

Source code inspection for conformance to the coding standard  is 

carried out and documented 

Use of static analysis tools to support data collection is recommended 

Report format  Tool dependant or textual figure per subroutine  

Table with the names of the subroutines, the corresponding unit 

name, the criticality category of the unit, the agreed maximum 

modular span of control value, the actually measured modular span 

of control value together with the list of called subroutines; short 

analysis identifying the number of non‐justifiable subroutines with a 

modular span of control value higher than the agreed target value. 

Other remarks   


67 

ECSS‐Q‐HB‐80‐04A  

30 March 2011 

A.3.3.17 Modular coupling

Main Characteristic  Maintainability 

Sub Characteristic  Modularity 

Metric name  Modular coupling 

Goal  This metric provides an indication of the coupling of the modules 

Owner / Producer  Owner: SW PA manager  

Producer: development team 

Target audience  SW PA manager, development leader  

Evaluation method  Manual code analysis (possibly with the support of an automatic 

tool). 

Formula  C = Median {coup(Di, Dj): 1<= i < j <= n} with coup(x, y) = k + m/(m+1) 

with: 

n being the number of modules under consideration, 

k being the maximum of the numbers corresponding to the different 

types of coupling among modules x and y as outlined below, i.e. 

0 No coupling relation: x and y have no communication. 

1 Data coupling relation:   x and y communicate through parameters, where 

these are either single data elements or homogeneous set of data items that 

have no control elements 

2 Stamp coupling relation: x and y accept the same record type as a 

parameter. 

3 Control coupling relation: x passes a variable to y with the intention of 

controlling its actions. 

4 Common coupling relation: x and y refer to the same global data. 

5 Content coupling relation: x refers to the inside of y; hence it branches 

into, changes data in, or alters a statement in y and 

m being the number of times the type of coupling among x and y 

with the highest ordinal number k is implemented (see Fenton and 

Melton, 1990) 

Interpretation of 

measured value 

The modularity of the software product is the better the smaller the 

metric result value. 

Proposed thresholds for the different criticality categories: 

A and B software: 3 

C and D software: 4 

Life cycle phase  Collected during SW design and implementation engineering and 

SW verification processes. 

Provided at CDR and updated afterwards as required 

Applicability  ‐ MANDATORY for criticality category A. 

‐ RECOMMENDED for criticality categories B, C. 

‐ OPTIONAL for criticality category D. 

68 

ECSS‐Q‐HB‐80‐04A  

30 March 2011 

Pre‐conditions  Source code is available. 

In the course of the software unit design phase, detailed information 

about the coupling to other software units is collected and 

documented (e.g. in the software unit design specification) 

Report format  Table with the names of the software units, the criticality category of 

the unit, the agreed maximum modular coupling, the actually 

measured modular coupling value together with the list of software 

units that are coupled to the software unit under consideration and 

the respective coupling type 

Other remarks   


A.3.3.18 Modular cohesion

Main Characteristic  Maintainability 

Sub Characteristic  Modularity 

Metric name  Modular cohesion 

Goal  This metric provides an indication of the functions assigned to a 

single software module. 

Owner / Producer  Owner: SW PA manager  

Producer: development team 

Target audience  SW PA manager, development leader  

Evaluation method  Manual code analysis (possibly with the support of an automatic 

tool). 

Formula  C = Max {coh(Di): 1<= i <= n} with coh(x) = k with: 

n being the number of modules under consideration, 

k being the ordinal value corresponding to the cohesion type valid 

for the module under consideration according to 

0 Functional: the module carries out a specific well‐defined function. 

1 Sequential: the module performs more than one function, but they happen 

in an order set out by a specification. 

2 Communicational:  the module performs more than one function, but all 

on the same set of data. 

3 Procedural: the module carries out more than one function, and they are 

related only to a general procedure influenced by the software. 

4 Temporal: the module carries out more than one function, and they are 

linked only by the fact that they must happen in the same time period. 

5 Logical: the module carries out more than one function, and they are 

associated only logically. 

6 Coincidental:  the module carries out more than one function, and they 

are not related. 

69 

ECSS‐Q‐HB‐80‐04A  

30 March 2011 

Interpretation of 

measured value 

The modularity of the software product is the better the smaller the 

metric result value 

Proposed thresholds for the different criticality categories: 

A and B software: 2 

C and D software: 3 

Life cycle phase  Collected during SW design and implementation engineering and 

SW verification processes. 

Provided at CDR and updated afterwards as required 

Applicability  ‐ MANDATORY for criticality category A. 

‐ MANDATORY for criticality categories B and C 

‐ OPTIONAL for criticality category D. 

Pre‐conditions  Source code is available. 

In the course of the software unit design phase, detailed information 

about the coupling to other software units is collected and 

documented (e.g. in the software unit design specification) 

Report format  Table with the names of the software units, the criticality category of 

the unit, the agreed maximum modular coupling, the actually 

measured modular coupling value together with the list of software 

units that are coupled to the software unit under consideration and 

the respective coupling type 

Other remarks   


A.3.3.19 Process reliability adequacy

Main Characteristic  Reliability 

Sub Characteristic  Reliability evidence 

Metric name  Process reliability adequacy 

Goal  This metric provides a subjective assessment of the adequacy of 

reliability activities to accomplish the SW reliability requirements  

Owner / Producer  Owner: SW Project manager  

Producer: SW PA manager 

Target audience  SW project manager, SW PA manager, development leader, V&V 

leader 

Evaluation method  Checklist to assess to what extent the development takes into account 

reliability aspects  

Formula  X = A / B 

A = Number of selected checklist items supported by evidence 

B = Number of selected checklist items. 

Interpretation of 

measured value 

0<=X<=1, the closer to 1 the better 

The confidence in the reliability is the higher the more thoroughly the 

validity of the checklist items is substantiated by evidence. 

70 

ECSS‐Q‐HB‐80‐04A  

30 March 2011 

Life cycle phase  Collected during SW requirements and architecture engineering, 

design and implementation engineering and SW verification and 

validation,  

Provided at SRR and updated afterwards as required 

Applicability  ‐ MANDATORY for criticality categories A,B and C 

‐ RECOMMENDED for criticality category D 

Pre‐conditions  ʺReliabilityʺ requirements specified in the requirements baseline and 

the technical specification. 

Report format  Table displaying for each selected checklist item the evidence that is 

supposed to cover that item. 

Other remarks   


Table A‐4: Checklist for process reliability adequacy 

No  Question  Supporting  Mark 

    Evidence  (Y,N,NA) 

1  The software requirements related to reliability are defined 

based on suitable and rigorous methods. 


2  The requirements baseline specifies the fault detection, 

identification, and recovery strategy to be implemented, and 

that the strategy is coherent with the dependability, security 

and safety level of the software under consideration. 


3  The technical specification includes all non‐functional 

requirements necessary to satisfy the reliability requirements 

baseline. 


4  The quality level of the existing software is analysed with 

respect to the project requirements, according to the criticality 

of the system function implemented. 


5  The software dependability and safety analysis is based on a 

combination of well‐established methods and techniques, to be 

performed at technical specification and design level, such as 

(ref. ECSS‐Q‐HB‐80‐03): software failure modes, effects and 

criticality analysis; software fault tree analysis; software 

common cause failure analysis. 


6  All results from the dependability analysis are taken into 

account in the definition of the technical specification. 


7  The results of SW safety and dependability analyses are used 

in order to determine the criticality of individual software 

components. 


8  Based on the results of the software criticality analysis, suitable 

engineering measures are applied o reduce the number of 

software critical components and mitigate the risks associated 

with the critical software.  


71 

ECSS‐Q‐HB‐80‐04A  

30 March 2011 

72 

No  Question  Supporting  Mark 

    Evidence  (Y,N,NA) 

9  Measures are defined and implemented to avoid propagation 

of failures between software components of different 

criticality. 


10  Measures to assure the reliability and dependability of critical 

software are defined and applied. 


11  Status of the implementation and verification of the software 

dependability and safety analysis recommendations is 

reported. 


12  Test are defined and executed according to the software 

module criticality category. 


13  The selected measures to handle critical components are 

properly verified. 


14  Robustness tests are planned and successfully carried out.      

15  Stress tests are planned and successfully carried out.     

16  Verification and validation activities are performed to verify 

that all dependability requirements have been satisfied and 

that all dependability recommendations have been considered. 


17  The SUM contains correct and complete information about 

features for FDIR in accordance to technical specification. 


18  ISVV activities are planned and identified, taking into account 

the outcomes of the SW dependability analysis, and define the 

ISVV activities to be performed. The ISVV activities include 

reviews, inspections, testing and audits. 


19  Recommendations from ISVV team are taken into account by 

the mainstream development team. 


ECSS‐Q‐HB‐80‐04A  

30 March 2011 

A.3.3.20 Structural coverage

Main Characteristic  Reliability 

Sub Characteristic  Reliability Evidence 

Metric name  Structural coverage 

Goal  This metric allows assessing whether the structural coverage 

requirements are met. 

Owner / Producer  Owner: V&V leader 

Producer: V&V team 

Target audience  SW PA manager, V&V leader, development leader 

Evaluation method  Dynamic analysis of the code with the support of automatic tools. 

Formula  X = A/B, where: 

A = number of executed statements/decisions/conditions; 

B = total number of statements/decisions/conditions; 

Interpretation of 

measured value 

See table below for proposed target values depending on criticality category 

and coverage type. 

Life cycle phase  Collected during SW validation and verification processes. 

Provided at CDR, and updated afterwards as required. 

Applicability  ‐ MANDATORY for all criticality categories 

Pre‐conditions  ‐ Coding activity finished (at least for a significant part of the 

product). 

‐ V&V activities at unit level properly planned and unit test cases and 

procedures available. 

‐ Availability of a dynamic analysis tool (except maybe for small 

portions of assembler code). 

‐ Unit testing regression strategy defined and implemented. 

Report format  ‐ Tool dependant, but tabular and graphical results should both be 

provided (including summary figures). 

‐ Structural coverage results can be presented at subroutine level or at 

module level (average for all routines in a given module). 

Other remarks  ‐ Very important metric, which can be directly mapped into one or 

more quality requirements. 

‐ The purpose of functional test coverage and structural coverage are 

different. One should not be used to justify the other. 

‐ Unit test coverage is sometimes referred too as the combination of 

structural coverage (by test) and manual coverage (by visual 

inspection). In that way, very demanding coverage requirements can 

be satisfied when some statements/paths are unreachable, or 

verification by test is too expensive for them. 


73 

ECSS‐Q‐HB‐80‐04A  

30 March 2011 

Table A‐5: Test coverage requirements 

CRITICALITY CATEGORY COVERAGE TYPE 

A  B  C  D   

Statement Coverage 

(Source Code) 100 %  100 %  100 %  AM   

Statement Coverage 

(Object Code) 100%  AM  AM  AM.   

Decision Coverage 

(Source Code) 100%  100%  AM  AM.   

Modified Condition & 

Decision Coverage 

(Source Code) 

100%  AM.  AM  AM.   

NOTE:  “AM“ means that the value is agreed with the customer and measured as per 

ECSS‐Q‐ST‐80 clause 6.3.5.2. 


74 

ECSS‐Q‐HB‐80‐04A  

30 March 2011 

A.3.3.21 SPR/NCR status

Main Characteristic  Reliability 

Sub Characteristic  Reliability evidence 

Metric name  SPR/NCR status 

Goal  This metric provides a snapshot of the SPR/NCR status at a given 

point in time, classified by SPR/NCR severity levels. 

Owner / Producer  Owner: SW PA manager  

Producer: CM responsible 

Target audience  SW project manager, SW PA manager, development leader, V&V 

leader, CM responsible 

Evaluation method  Analysis of SPR/NCR database. 

Formula  There is no formula associated to this metric. 

Interpretation of 

measured value 

‐ No major/critical SPR/NCR should remain open at SW‐AR. 

‐ All minor SPRs/NCRs still open at SW‐AR should be properly 

covered by temporary or permanent RFW. 

Life cycle phase  Collected during SW verification and validation, SW delivery and 

acceptance, SW operation and SW maintenance processes. 

Provided at CDR and updated afterwards for each milestone or 

progress meeting. 

Applicability  ‐ MANDATORY for all  categories 

Pre‐conditions  ‐ SPR/NCR procedure defined and implemented. 

‐ A good policy to classify SPRs/NCRs by severity level (e.g. critical, 

major, minor) should be also in place. 

‐ SPR/NCR system should allow identifying those NCRs that are 

software‐related. 

‐ Availability of supporting tools to analyse the SPR/NCR database is 

strongly recommended. 

Report format  SPR/NCR table with summary figures at the end (e.g. total number of 

raised, analysed, implemented, tested, closed). 

Other remarks  Only software‐related NCRs are considered. 


75 

ECSS‐Q‐HB‐80‐04A  

30 March 2011 

A.3.3.22 Environmental software independence

Main Characteristic  Maintainability, Reusability 

Sub Characteristic  Portability  

Metric name  Environmental software independence 

Goal  This metric provides an indication of the degree of independence of 

the SW product from its software environment (such as operating 

system or external libraries). 

Owner / Producer  Owner: SW PA manager 

Producer: development team, V&V team 

Target audience  SW PA manager, development leader, V&V leader 

Evaluation method  ‐ Analysis of the design documentation, eventually with the help of 

an automatic tool. 

‐ Identification of those design components including external calls 

(e.g. to operating system or external libraries routines) or using 

external data. 

Formula  X= A/B, where: 

A = number of design components expected to maintain their correct 

behaviour in a different software environment; 

B = total number of design components 

Interpretation of 

measured value 

0 <= X <= 1, the closer to 1 the better 

Target value for levels A to C: 0.95 

Target value for level D: 0.90 

Life cycle phase  Collected during SW design and implementation engineering 

process. 

Provided at DDR and updated afterwards as required. 

Applicability  ‐ MANDATORY for criticality categories A to C. 

‐ RECOMMENDED for criticality category D. 

Pre‐conditions  ‐ Availability of design documentation, with a level of detail 

sufficient to identify external calls and data. 

‐ Use of a supporting tool is highly recommended. 

Report format  Tool dependant. 

For example, a cross matrix identifying all external dependencies for 

each design component. 

Other remarks  The notion of design component can vary from project to project (e.g. 

HOOD terminal object, UML class). 


76 

ECSS‐Q‐HB‐80‐04A  

30 March 2011 

A.3.3.23 System hardware independence

Main Characteristic  Maintainability, Reusability 

Sub Characteristic  Portability 

Metric name  System hardware independence 

Goal  This metric provides an indication of the degree of independence of 

the SW product from its hardware environment. 

Owner / Producer  Owner: SW PA manager 

Producer: development team, V&V team 

Target audience  SW PA manager, development leader, V&V leader 

Evaluation method  ‐ Analysis of the design documentation, eventually with the help of 

an automatic tool. 

‐ Identification of those design components including direct interface 

with hardware. 

Formula  X= A/B, where: 

A = number of design components expected to maintain their correct 

behaviour in a different hardware environment; 

B = total number of design components 

Interpretation of 

measured value 

0 <= X <= 1, the closer to 1 the better 

Target value for level A: 0.95 

Target value for level B: 0.90 

Target value for levels C and D: 0.85 

Life cycle phase  Collected during SW requirements and architecture engineering, SW 

design and implementation engineering processes. 

Provided at PDR and updated afterwards as required. 

Applicability  ‐ MANDATORY for criticality categories A to C. 

‐ RECOMMENDED for criticality category D. 

Pre‐conditions  ‐ Availability of HW/SW ICD and high‐level design documentation 

with a level of detail sufficient to identify individual components 

interfacing with hardware. 

‐ Use of a supporting tool is highly recommended. 

Report format  List of design components including direct interface with hardware, 

including summary figures. 

Other remarks  It is expected that the software part interfacing with hardware is 

isolated in a low‐level design layer, which is then used by other 

higher‐level design components. This is why the target values for this 

metric are quite strict. 


77 

ECSS‐Q‐HB‐80‐04A  

30 March 2011 

A.3.3.24 Reusability checklist

Main Characteristic  Reusability 

Sub Characteristic  Reusability documentation 

Metric name  Reusability checklist 

Goal  This metric provides a subjective assessment of the reuse potential 

based on the quality of the development and V&V documentation. 

Owner / Producer  Owner: SW PA manager 

Producer: development team, V&V team 

Target audience  SW PA manager, development leader, V&V leader 

Evaluation method  Reusability checklist (see sample checklist below) 

Formula  X = A/B, where: 

A = sum of Yes or N/A answers to the questions in the checklist 

B = total number of questions 

Interpretation of 

measured value 

The measured value should be 100% (i.e. all questions either 

positively answered or found not applicable). 

No specific target value identified for each criticality category. 

Life cycle phase  Collected from system engineering process. 

Provided at SRR, and updated afterwards as required. 

Applicability  ‐ MANDATORY for all criticality categories. 

Pre‐conditions  ‐ Availability of the relevant documentation. 

‐ Availability of team members to answer the checklist. 

Report format  Answered checklist. 

Other remarks  This metric becomes OPTIONAL if there are not ‘reuse’ requirements 

in the project. 


Table A‐6: Sample checklist for reusability checklist 

No  Question  Supporting  Mark 

    Evidence  (Y,N,NA) 

1  Re‐use related requirements are specified.     

2  The procedures, methods and tools for reuse are specified and 

applied to the software engineering processes to comply with 

the reusability requirements for the software development. 


3  Maintainability, portability and verification requirements (for 

software to be re‐used) are specified in the technical 

specification. 


4  Dependability on the environmental software and on the 

environmental hardware is minimized (relative to the project 

constraints), described and justified. 


5  If the software is intended for re‐use and is executed on 

multiple hardware platforms, reliable evidences should be 


78 

ECSS‐Q‐HB‐80‐04A  

30 March 2011 

79 

No  Question  Supporting  Mark 

    Evidence  (Y,N,NA) 

provided that the corresponding validation tests have been 

carried out on all specified hardware platforms. 

6  The application conditions for the software intended for re‐

use are specified (i.e. all information necessary for the future 

decision making process whether the software is fit for the 

project specific purpose, e.g. the criticality of the 

corresponding software components). 


7  Specific design requirements are applied if the software is to 

be designed for intended reuse. 


8  The detail design specifies for each software component, 

whether it is intended for re‐use or not. 


9  The software is designed such that mission and configuration 

dependant data are separated (e.g. in a database). 


10  If the software is written for the reuse, the design provides its 

provided functionality from an external point of view and its 

external interfaces. 


11  Reusability limitations (e.g. due to a low criticality category) 

are defined. 


12  The configuration management system takes account the 

specific aspects of software developed for intended reuse, 

such as longer lifetime of these components as compared to 

other components of the project, evolution or change of the 

development environment for the projects that intend to use 

the components, and transfer of the configuration and 

documentation management information to these projects. 


13  Justification of methods and tools of the design for re‐use is 

provided. 


14  The information related to components developed for 

intended reuse is separated from others (in the technical 

specification, the design justification file, the design definition 

file and the product assurance file). 


15  The Software Reuse File describes the technical and 

management information available on the software intended 

for reuse. 


16  The Software Reuse File documents the results of the software 

reuse analysis. 


17  Assumptions and methods applied when estimating the level 

of reuse are provided in the Software Reuse File. 


18  Corrective actions identified to ensure that the software 

intended for reuse meets the applicable project requirements 

and its implementation are documented in the Software 

Reuse File.  


ECSS‐Q‐HB‐80‐04A  

30 March 2011 

80 

No  Question  Supporting  Mark 

    Evidence  (Y,N,NA) 

19  The Software Reuse File includes the detailed configuration 

status of the reused software baseline. 


20  The design for re‐use organization and the content of the user 

manual or equivalent document helps people in re‐using 

software. 


21  The analysis of the potential reusability of existing software 

components is performed through: 

1. identification of the reuse components and models with 

respect to the functional requirements baseline, and; 

2. a quality evaluation of these components. 


22  An evaluation of the reuse potential of the software is 

performed. 


23  Analyses of the advantages obtained with the selection of 

existing software instead of new development are carried out. 


24  Justification of re‐use with respect to requirements baseline is 

provided. 


25  Specific constraints induced by reused software (e.g. COTS, 

free software and open source) are specified. 


26  For each software item, the estimated level of reuse and the 

assumptions and methods applied when estimating the level 

of reuse are provided. 


27  List of reuse components is provided.     

28  The re‐use related software acquisition process is defined and 

implemented. 


29  The design describes how to handle the existing reused 

components. 


30  Reverse engineering techniques are applied to generate 

missing documentation and to reach the required verification 

and validation coverage. 


31  For software products whose life cycle data from previous 

development are not available and reverse engineering 

techniques are not fully applicable, the following methods are 

applied:  

1. generation of validation and verification documents based 

on the available user documentation (e.g. user manual) and 

execution of tests in order to achieve the required level of test 

coverage;  

2. use of the product service history to provide evidence of 

the product’s suitability for the current application. 


ECSS‐Q‐HB‐80‐04A  

30 March 2011 

A.3.3.25 Reuse modification rate

Main Characteristic  Reusability 

Sub Characteristic  Reuse Modification  

Metric name  Reuse modification rate 

Goal  This metric keeps track of the amount of estimated and/or performed 

modifications applied to every existing software component. 

Owner / Producer  Owner: SW PA manager 

Producer: development team, V&V team 

Target audience  SW PA manager, development leader, V&V leader 

Evaluation method  Static code analysis 

Formula  X = NLOC MO/LOC, where: 

NLOC MO= total number of estimated or actually modified/added 

lines of existing software 

LOC= total lines of code of the existing software 

Interpretation of 

measured value 

‐ This metric gives a guideline for assessing what extent modifications 

can be made before needing to treat the existing software as an 

entirely new software product to be developed. 

‐ The ratio of modified/added lines of code should be lower or equal 

than the estimated % of software modification. 

‐ If the ratio is greater that the estimated % of modifications, then the 

software is considered as new software.  

‐ No specific target value is identified for the estimated % of code 

modified for each criticality category. They are strictly project 

dependant 

Example: up to an estimated 20% of source code modified/added is to 

be considered reuse software.  

Life cycle phase  Collected from system engineering process. 

Provided at SRR, and updated afterwards as required. 

Applicability  ‐ MANDATORY for all criticality categories. 

Pre‐conditions  Availability of the source code. 

Report format  Graphical chart (KLOC modified ‐ %modified) 

Other remarks   


81 

ECSS‐Q‐HB‐80‐04A  

30 March 2011 

A.3.3.26 Safety activities adequacy

Main Characteristic  Suitability for Safety 

Sub Characteristic  Safety Evidence 

Metric name  Safety activities adequacy 

Goal  This metric provides a subjective assessment of the adequacy of the 

safety activities performed in the project. 

Owner / Producer  Owner: SW PA manager 

Producer: development team, V&V team 

Target audience  SW PA manager, development leader, V&V leader 

Evaluation method  Safety checklist (see sample checklist below) 

Formula  X = A/B, where: 

A = sum of Yes or N/A answers to the questions in the checklist 

B = total number of questions 

Interpretation of 

measured value 

The measured value should be 100% (i.e. all questions either 

positively answered or found not applicable). 

No specific target value identified for each criticality category. 

Life cycle phase  Collected from system engineering process. 

Provided at SRR, and updated afterwards as required. 

Applicability  ‐ MANDATORY for criticality categories A to B. 

‐ RECOMMENDED for criticality category C. 

‐ OPTIONAL for criticality category D. 

Pre‐conditions  ‐ Availability of the relevant safety material. 

‐ Availability of team members to answer the checklist. 

Report format  Answered checklist. 

Other remarks  ‐ The proposed checklist covers three areas: safety planning, safety 

analysis and safety techniques. 

‐ The proposed target values might seem quite strict, but this is not 

the case: For the lower criticality categories the answer to most 

questions is probably N/A. 

‐ This metric is only applicable if there are safety‐related 

requirements in the project. 


Table A‐7: Sample checklist for safety activities adequacy 

No  Question  Supporting  Mark 

    Evidence  (Y,N,NA) 

1  Definition of the SW safety activities as part of the Software 

product assurance plan, specifying activities to be carried out, 

the implementation schedule and the resulting products. 


2   Software safety responsibilities are identified.     

3  ISVV activities are planned and identified, taking into account     

82 

ECSS‐Q‐HB‐80‐04A  

30 March 2011 

83 

No  Question  Supporting  Mark 

    Evidence  (Y,N,NA) 

the outcomes of the SW safety analysis, and define the ISVV 

activities to be performed. The ISVV activities include 

reviews, inspections, testing and audits. 

4  Evidences that the software requirements (at TS level) cover 

the safety requirements (at RB level) completely and 

appropriately are provided. 


5  Definition of SW safety requirements (involving analysis of 

system safety requirements, hardware, software and user 

interfaces, and areas of system performance) are provided. 


6  Safety analyses at the SW requirements phase are performed 

to identify hazards and possible incorrect assignment of 

safety requirements to the software and consequent 

enhancement of the TS, coding and testing by safety 

recommendations. 


7  SW safety requirements are allocated into SW design.     

8  Safety analysis are performed at SW design and 

implementation phases to identify hazards and possible 

incorrect assignment of safety requirements to the software; 

and consequent enhancement of the TS, coding and testing by 

safety recommendations. 


9  Verification and validation activities are performed to verify 

that all safety requirements have been satisfied and that all 

safety recommendations have been considered. 


10  Recommendations from ISVV team are taken into account by 

the mainstream development team. 


11  Means are defined to receive feedback from the upper level 

safety representative regarding possible safety impact of 

SPRs/NCRs and derived requirements properly identified. 


12  Verification that the above identified processes are properly 

applied is performed. 


13  Measures that increase the safety of the software are 

incorporated into the design or implementation (e.g. safe 

subset of programming languages, use of formal or semi‐

formal methods, definition of a safe state, etc.). 


14  The code implements safety requirements based on suitable 

methods and measures used. 


15  It is ensured that the code is controlling any possible software 

contribution to system hazardous events. 


ECSS‐Q‐HB‐80‐04A  

30 March 2011 

A.3.3.27 Security checklist

Main Characteristic  Security 

Sub Characteristic  Security Evidence 

Metric name  Security checklist 

Goal  This metric provides a subjective assessment of the adequacy of the 

security activities performed in the project. 

Owner / Producer  Owner: SW PA manager 

Producer: development team, V&V team 

Target audience  SW PA manager, development leader, V&V leader 

Evaluation method  Security checklist 

Formula  X = A/B, where: 

A = sum of Yes or N/A answers to the questions in the checklist 

B = total number of questions 

Interpretation of 

measured value 

The measured value should be 100% (i.e. all questions either 

positively answered or found not applicable). 

No specific target value identified for each criticality category. 

Life cycle phase  Collected from system engineering process. 

Provided at SRR, and updated afterwards as required. 

Applicability  ‐ MANDATORY for all criticality categories. 

Pre‐conditions  ‐ Availability of the relevant security material. 

‐ Availability of team members to answer the checklist. 

Report format  Answered checklist. 

Other remarks  This metric is only applicable if there are security requirements in the 

project. 


Table A‐8: Checklist for security checklist  

No  Question  Supporting  Mark 

    Evidence  (Y,N,NA) 

1  The requirement baseline covers all project relevant information 

that is necessary to specify security related software requirements 

(on technical specification level). 


2  A systematic security analysis (to identify potential security 

problems) has been carried out, the results are documented and 

have been used to specify the security related software 

requirements on the technical specification level. 


3  Software security responsible is identified.     

4  A security level is assigned to each SW item, according to project 

security criteria. 


5  Security procedures are defined and applied to handle SW items 

at each security level. 


84 

ECSS‐Q‐HB‐80‐04A  

30 March 2011 

85 

No  Question  Supporting  Mark 

    Evidence  (Y,N,NA) 

6  Verification that the above identified procedures are properly 

applied is performed. 


7  The security related software requirements (technical specification 

level) are sufficient to cover the security related information 

specified in the requirements baseline. 


8  All user interfaces (for installation, for operation, for maintenance, 

for updates, etc.) are specified in a self‐contained manner and 

have each got assigned a security level (specifying the criticality 

with regards to security). 


9  Access to critical user interfaces (security) is limited by individual 

accounts that are secured against misuse by a password. 


10  An appropriate guideline for the selection of a suitable password 

is available (e.g. length of the password, usage of special 

characters, etc.). 


11  An appropriate guideline for the “superuser” responsibilities and 

interfaces to the software is available (e.g. for account and 

password management). 


12  The software design is justified (e.g. encapsulation of security 

relevant software components). 


13  Methods to ensure integrity, availability and confidentiality of 

data have been defined and implemented. 


14  Verification and validation activities are performed to verify that 

all security requirements have been satisfied and that all security 

recommendations have been considered. 


15  The assignment of database read/write rights (to software units) 

have been reviewed for security related impacts. 


16  All activities carried out under a (security) critical account are 

logged such that the integrity of the logging files is ensured. 


17  Possible security flaws (i.e. security related abnormal conditions 

on software unit level) have been specified based on experience 

and on a systematic approach. 


18  Each identified security flaw has got assigned a justified counter 

measure (to be applied by the coder), spot checks are 

recommended. 


19  The software has been analyzed by a specialist (e.g. a vulnerability 

analyst) to identify not yet covered security flaws in the software. 


ECSS‐Q‐HB‐80‐04A  

30 March 2011 

A.3.3.28 User documentation clarity

Main Characteristic  Usability, Maintainability 

Sub Characteristic  User documentation quality 

Metric name  User documentation clarity 

Goal  This metric provides an indication of the quality of the user 

documentation. 

Owner / Producer  Owner: SW PA manager 

Producer: development team 

Target audience  SW PA manager, development leader 

Evaluation method  Analysis of user documentation, eventually with the aid of some 

automatic tools. 

Formula  X= A/B, where: 

A= number of ambiguous statements within the user documentation; 

B= total number of statements within the user documentation 

Interpretation of 

measured value 0 <= X <= 1, the closer to 0 the better 

Life cycle phase  Collected during SW design and implementation engineering, SW 

verification and validation processes. 

Provided at CDR, and updated afterwards as required. 

Applicability  ‐ RECOMMENDED for all criticality categories. 

Pre‐conditions  ‐ Availability of user documentation. 

‐ Use of supporting tools is strongly recommended. 

Report format  Tool dependant. 

Other remarks  For the purpose of this metric, a sentence is defined as a group of 

words containing a subject, a verb and expressing a complete 

thought. Sentences can be identified counting the full stops “.”. 


86 

ECSS‐Q‐HB‐80‐04A  

30 March 2011 

A.3.3.29 User documentation completeness

Main Characteristic  Usability, Maintainability 

Sub Characteristic  User documentation quality 

Metric name  User documentation completeness 

Goal  This metric provides the number of remaining open points in the user 

documentation. 

Owner / Producer  Owner: SW PA manager 

Producer: development team 

Target audience  SW PA manager, development leader 

Evaluation method  Analysis of user documentation, eventually with the aid of automatic 

tools (e.g. macros). 

Formula  X= A/B, where: 

A= number of sections containing TBCs/TBDs; 

B= total number of sections; 

Interpretation of 

measured value 0 <= X <= 1, the closer to 0 the better 

Life cycle phase  Collected during SW design and implementation engineering, SW 

verification and validation processes. 

Provided at CDR, and updated afterwards as required. 

Applicability  ‐ RECOMMENDED for all criticality categories. 

Pre‐conditions  ‐ Availability of user documentation. 

‐ Use of a supporting tool is highly recommended. 

Report format  TBC/TBD table as an annex to the relevant document (including 

summary figures). 

Other remarks  The metric does not take into consideration the relevance of each 

TBC/TBD (otherwise it would become too complicate to be collected). 

It just provides an indication of the number of open points. 


A.3.3.30 User manual suitability

Main Characteristic  Usability, Maintainability 

Sub Characteristic  User documentation quality 

Metric name  User manual suitability 

Goal  This metric provides a subjective indication of the suitability of the user manual. 

Owner / Producer  Owner: SW PA manager 

Producer: development team 

Target audience  SW PA manager, development leader 

Evaluation method  Application of a user manual suitability checklist. 

87 

ECSS‐Q‐HB‐80‐04A  

30 March 2011 

Formula  X= A/B, where: 

A = sum of Yes or N/A answers to the questions in the checklist 

B = total number of questions  

Interpretation of 

measured value 

The measured value should be 100% (i.e. all questions either 

positively answered or found not applicable) 

Life cycle phase  Collected during SW requirements and architecture engineering, SW 

design and implementation engineering, SW verification and 

validation processes. 

Provided at CDR, and updated afterwards as required. 

Applicability  ‐ MANDATORY for all criticality categories. 

Pre‐conditions  ‐ Availability of the user manual. 

‐ Availability of team members to answer the checklist. 

Report format  Answered checklist 

Other remarks   


Table A‐9: Checklist for User manual suitability 

No  Question  Supporting  Mark 

    Evidence  (Y,N,NA) 

1  The user manual reports an overview of the system.     

2  Each operation is described in the user manual.     

3  Cautions and warning are described in the user manual.     

4  For each operation the user manual provides: 

‐ set‐up and initialisation; 

‐ input operations; 

‐ what results to expect. 


5  Probable errors and possible causes are provided.     

6  The user manual reports error messages and recovery 

procedures. 


7  The maintenance process and the activities to be carried out 

by the user are described. 


8  The fault reporting process and the activities to be carried out 

by the user are. 


9  The parameterization capabilities of the software are 

described. 


10  The application conditions of the software (i.e. constraints 

that are necessary for a requirement conformant program 

execution) are described. 


11  Help desk information (in form of a phone number, of an E‐

mail address, etc.) is sufficiently detailed. 


88 

ECSS‐Q‐HB‐80‐04A  

30 March 2011 

A.3.3.31 Adherence to MMI standards

Main Characteristic  Usability 

Sub Characteristic  Understandability 

Metric name  Adherence to MMI standards 

Goal  This metric provides a subjective assessment of the adherence to the 

applicable MMI standards. 

Owner / Producer  Owner: SW PA manager 

Producer: development team 

Target audience  SW PA manager, development leader 

Evaluation method  MMI standards checklist, to be filled in with the help of static analysis 

tools. 

‐ Rules covered by automatic tools are expected to be verified for 100% 

of the code. 

‐ Sample code size should be specified for those rules to be verified 

manually (at least 5% of the code should be inspected). 

‐ No sample checklist is provided because this is strictly 

project/company dependant. 

Formula  X = A/B, where: 

A = sum of Yes or N/A answers to the questions in the checklist 

B = total number of questions 

Interpretation of 

measured value 

The measured value should be 100% (i.e. all questions either positively 

answered or found not applicable). 

No specific target value identified for each criticality category. 

Life cycle phase  Collected during SW validation and verification processes. 

Provided at CDR, and updated afterwards as required. 

Applicability  ‐ MANDATORY for criticality categories A to D. 

Pre‐conditions  ‐ Availability of the relevant documentation. 

‐ Availability of team members to answer the checklist. 

‐ Use of static analysis tools to support data collection is strongly 

recommended. 

Report format  ‐ Static analysis reports (textual and graphic, tool dependant). 

‐ Answered checklist for each manually inspected module. 

Other remarks  ‐ Even if no specific target values are identified (i.e. all applicable 

questions should be answered for the inspected modules), tailoring of 

this metric is possible from the point of view of sample code size. 

‐ Code size is not necessarily measured in LOC (lines of code) for this 

metric. A different unit of measure can be used for MMI applications 

(e.g. number of windows, buttons, menu choices). 


89 

ECSS‐Q‐HB‐80‐04A  

30 March 2011 

A.3.3.32 Process assessment [ECSS-HB-Q-80-02]

Main Characteristic  Software Development Effectiveness 

Sub Characteristic  Project development process level 

Metric name  Process assessment 

Goal  This metric provides the capability levels of those software processes 

that are applicable to the current project. 

Owner / Producer  Owner: SW PA manager 

Producer: customer or third‐party assessor 

Target audience  Project manager, SW PA manager, others (depending on the assessed 

processes). 

Evaluation method  [ECSS‐HB‐Q‐80‐02] assessment (or equivalent) 

Formula  Assessment performed according to [ECSS‐HB‐Q‐80‐02] method 

Interpretation of 

measured value 

See ECSS‐Q‐HB‐80‐02 for recommended target capability levels depending on 

the SW criticality category. 

Life cycle phase  The assessment should be conducted before the actual processes start, 

in order to detect possible gaps with the required levels and solve them.

E.g. SW design and SW construction processes should be assessed 

before the SW design & implementation engineering process starts. 

Applicability  ‐ MANDATORY for criticality categories A‐B.  

‐ RECOMMENDED for criticality categories C‐D. 

Pre‐conditions  Availability of data to perform the assessment of the relevant processes 

(either from previous similar projects or from current project). 

Report format  Assessment report according to [ECSS‐HB‐Q‐80‐02] method. 

Other remarks  A process improvement program should be initiated to cover the gaps 

between the required capability levels and the measured capability 

levels (if any). 

Should this be the case, a re‐assessment of the concerned processes 

should be performed after some time, in order to measure the results of 

the improvement program. 


A.3.3.33 Milestone tracking

Main Characteristic  Software Development Effectiveness 

Sub Characteristic  Project management effectiveness 

Metric name  Milestone tracking 

Goal  This metric provides a graphical representation of planned milestones 

versus achieved milestones over time. 

Owner / Producer  Owner: project management 

Producer: project management 

Target audience  Project manager, SW PA manager, development leader 

Evaluation method  Analysis of project management data 

90 

ECSS‐Q‐HB‐80‐04A  

30 March 2011 

Formula  For each project milestone, both planned and actual dates should be 

provided. 

Interpretation of 

measured value 

For each project milestone, the closer the actual date is to the planned 

date, the better. 

Life cycle phase  Collected before every progress meeting. 

Provided with every progress report. 

Applicability  ‐ MANDATORY for all criticality categories 

Pre‐conditions  Project management data should be available and accessible 

Report format  Results should be presented in a graphical manner (e.g. bar chart, 

progress chart), so the actual date can be compared with the expected 

one, for each milestone. 

(See sample graphic below) 

Other remarks  Possible variations of this metric: 

In case of major schedule modifications, both the initial planned date and 

the current planned date should be collected (for each milestone). 

In case of significant gap between provisional achievement (i.e. successful 

pending of closure of all identified actions) and final close‐out of a given 

milestone, both dates should be indicated as well. 


A.3.3.34 Effort tracking

Main Characteristic  Software Development Effectiveness 

Sub Characteristic  Project management effectiveness 

Metric name  Effort tracking 

Goal  This metric provides a graphical representation of estimated effort 

versus actually spent effort over time. 

Owner / Producer  Owner: project management 

Producer: project management 

Target audience  Project manager, project controller 

Evaluation method  Analysis of project management data 

Formula  For each ongoing or completed task, both the estimated and the 

actual effort figures should be provided. 

Interpretation of 

measured value 

For each task, the closer the actual spent effort is to the estimated 

effort, the better. 

Life cycle phase  As a minimum: 

‐ Collected before every progress meeting. 

‐ Provided with every progress report. 

Applicability  ‐ MANDATORY for all criticality categories 

Pre‐conditions  Project management data should be available and accessible 

91 

ECSS‐Q‐HB‐80‐04A  

30 March 2011 

Report format  Results should be presented in a graphical manner (e.g. bar chart, 

progress chart), so the actual spent effort can be compared with the 

expected one, for each task. 

Other remarks  In case of major changes in effort estimations (e.g. due to change 

requests), both the initial estimated effort and the current estimated effort 

should be collected (for each related task). 


A.3.3.35 Code size stability

Main Characteristic  Software Development Effectiveness 

Sub Characteristic  Project management effectiveness 

Metric name  Code size stability 

Goal  This metric gives a graphical representation of estimated code size 

versus actual code size over time. 

Owner / Producer  Owner: development leader 

Producer: development team 

Target audience  SW project manager, SW PA manager, development leader, V&V 

leader 

Evaluation method  Static code analysis with the support of automatic tools. 

Formula  For each major design component, both estimated code size and actual 

code size should be provided. 

Interpretation of 

measured value 

The lower the gap between estimated code size and actual size the 

better. 

Life cycle phase  Collected during SW design and implementation engineering process. 

Provided at DDR (estimations only) and then updated for each 

progress meeting or milestone with actual data. 

Applicability  ‐ MANDATORY for all criticality categories 

Pre‐conditions  ‐ Detailed design activity finished (for estimations). 

‐ Coding activity started (for actual data). 

‐ Availability of a static analysis tool (except maybe for small portions 

of assembler code). 

Report format  Results should be presented in a graphical manner (e.g. bar chart, 

progress chart), so the actual code size can be compared with the 

estimated one, for each design component. 

(See sample graphic below) 

Other remarks  ‐ Moderate increases with respect to estimations are quite common, 

even with fairly stable requirements. But differences larger than 20% 

between estimated and actual values should be investigated. 

‐ In case of major changes in size estimations (e.g. due to change 

requests), both the initial estimated size and the current estimated size 

should be collected (for each affected design component). 


92 

ECSS‐Q‐HB‐80‐04A  

30 March 2011 

A.3.3.36 Requirement stability

Main Characteristic  Software development effectiveness 

Sub Characteristic  Project management effectiveness 

Metric name  Requirement stability 

Goal  This metric provides an indication of the stability of requirements (at 

both RB and TS levels) in terms of added/modified/deleted 

requirements over time. 

Owner / Producer  Owner: SW PA manager 

Producer: development team 

Target audience  SW PA manager, development leader 

Evaluation method  Analysis of requirements documents (SRD, ICDs), eventually with the 

aid of some automatic tools (e.g. DOORS). 

Formula  X = N/T 

Y = M/T 

Z = D/T, where: 

N = number of added requirements since last version; 

M = number of modified requirements since last version; 

D = number of deleted requirements since last version; 

T = total number of requirements 

The global metric is then computed as an aggregation of X+Y+Z. 

Interpretation of 

measured value 

The lower the metric value the better. 

However, no target values are proposed for this metric because the 

reasons for high requirement volatility are strictly project dependant, 

and no generic thresholds that are valid for all situations can be 

established. 

Life cycle phase  Collected during all development phases of the project. 

Provided at SRR, and updated regularly for each milestone until the 

SW‐AR. 

Applicability  ‐ MANDATORY for criticality categories A to C. 

‐ RECOMMENDED for criticality category D. 

Pre‐conditions  ‐ Availability of requirements documents. 

‐ Use of supporting tools is strongly recommended. 

Report format  Tool dependant. Both textual and graphic representations are possible 

(see examples below). 

Other remarks  ‐ A high requirements volatility rate might require adjustment of 

schedule and effort estimations. 

‐ Some system and software engineering processes should be 

reviewed, if the reason for this high volatility is not fully understood. 


93 

ECSS‐Q‐HB‐80‐04A  

30 March 2011 

94 

0.13540V3

0.281035V2

0030V1

Requirement StabilityNumber of changed/pndrequirements 

A

Total number of existing 

requirements B

SW Version

Figure A‐5: Sample of requirements stability 

A.3.3.37 RID/action status

Main Characteristic  Software Development Effectiveness 

Sub Characteristic  Project management effectiveness 

Metric name  RID/action status 

Goal  This metric provides a snapshot of the RID/action status at a given 

point in time, classified by relevance (major, minor). 

Owner / Producer  Owner: SW PA manager  

Producer: CM responsible 

Target audience  SW project manager, SW PA manager, development leader, V&V 

leader, CM responsible 

Evaluation method  Analysis of RID/action database. 

Formula  There is no formula associated to this metric. 

ECSS‐Q‐HB‐80‐04A  

30 March 2011 

95 

Interpretation of 

measured value 

‐ No major RID from previous milestones should remain open at next 

milestone. 

‐ All RIDs/actions still open at SW‐AR should be declared as ‘open 

work’ and a proper action plan to close them should be agreed with the 

customer.  

Life cycle phase  Collected during all life cycle phases. 

Provided at SRR and updated afterwards for each milestone or 

progress meeting. 

Applicability  ‐ MANDATORY for all criticality categories. 

Pre‐conditions  ‐ RID/action management procedures and tools in place. 

‐ A good policy to classify and handle major/minor RIDs/actions 

should be also in place.  

Report format  RID/action status table with summary figures at the end (e.g. total 

number of issued, on‐going, closed with/without action). 

See sample graphic below. 

Other remarks   


Figure A‐6: Sample of RID/action status 

A.3.3.38 V&V progress

Main Characteristic  Software development effectiveness 

Sub Characteristic  Project management effectiveness 

Metric name  V&V progress 

Goal  This metric gives a graphical representation of planned V&V activities 

versus completed V&V activities over time. 

Owner / Producer  Owner: V&V leader 

Producer: V&V team 

Target audience  SW project manager, SW PA manager, V&V leader, development 

leader 

ECSS‐Q‐HB‐80‐04A  

30 March 2011 

96 

Evaluation method  Analysis of SW V&V progress data or reports (when properly 

updated). 

Formula  X = A/B, where: 

A = number of successfully completed V&V activities; 

B = number of planned V&V activities at this time 

Interpretation of 

measured value 

0 <= X <= 1, the closer to 1 the better 

No specific target value for each criticality category. 

Life cycle phase  Collected during SW validation and verification processes. 

Provided at PDR, and updated afterwards as required. 

Applicability  ‐ MANDATORY for all criticality categories 

Pre‐conditions  Availability of relevant V&V progress data. 

Report format  See example below. 

Other remarks  This metric can be used to estimate the date of completion of the 

different V&V phases. 


Internal Verifications note book

Planned3/02/05VALn

No successful7/10/0420/08/04VALi

Suspended15/08/04VAL2

Succesfull6/10/042/09/04VAL1

ResultLast Execution Date

Expected Execution Date

Planned Verification

Figure A‐7: Sample of V&V progress 

ECSS‐Q‐HB‐80‐04A  

30 March 2011 

A.4 List of proposed OO metrics

A.4.1 Introduction

This subclause provides a detailed description of a set of OO metrics proposed to measure some of the 

above  presented  characteristics  and  sub‐characteristics  as  an  alternative  to  the  classic metrics  (i.e. 

modular span of control), which are not considered appropriate for an object‐oriented design. 

The list of proposed OO metrics is not exhaustive. What is proposed here is a realistic small set of OO 

metrics found as more used  in space projects. The  thresholds provided here are not exact, but quite 

precise since, although  they are  taken  from  literature,  they haven been confirmed  later by practical 

application on real projects. 

Within the quality model at hand, the following five additional metrics have been selected: 

Number of children (NOC) 

Depth of inheritance tree (DIT) 

Parametric Polymorphism factor (PPF) 

Coupling between objects (CBO) 

Lack of cohesion of methods (LOCM). 

With the evaluation of these metrics, the following aspects are covered: 

Inheritance (NOC, DIT) 

Polymorphism (PPF) 

Modularity (CBO, LOCM). 

A.4.2 Detail description of the proposed OO metrics

A.4.2.1 Number of children

Main Characteristic  Maintainability 

Sub Characteristic  Analyzability 

Metric name  Number of children (NOC) 

Goal  To assess the degree of complexity induced by inheritance. The 

number of children is the number of immediate subclasses 

subordinate to a class in the hierarchy. It is an indicator of the 

potential influence a class can have on the design and on the system  

Owner / Producer  Owner: development leader 

Producer: development team 

Target audience  SW PA Manager, development leader, V&V leader 

Evaluation method  Static code analysis with the support of automatic tools. 

Formula  No Formula 

97 

ECSS‐Q‐HB‐80‐04A  

30 March 2011 

Interpretation of 

measured value 

NOC<= 4  

The larger the number of children of a class, the greater is the possible 

impact arising from a modification of that class. 

The greater the number of children, the greater the likelihood of 

improper abstraction of the parent and may be a case of misuse of 

subclassing. But the greater the number of children, the greater the 

reuse since inheritance is a form of reuse. 

Life cycle phase  Collected during design and implementation engineering, SW 

validation and verification processes. 

Provided at CDR, and updated afterwards as required. 

Applicability  ‐ MANDATORY for  categories A‐B‐C 

‐ RECOMMENDED for criticality category D 

Pre‐conditions  Coding activity finished  

Availability of a static analysis tool. 

Report format  Tool dependant, but tabular and graphical results should both be 

available. 

Table with the names of the classes, the criticality category of the class 

and the actually measured value. 

Remarks on classes with a large NOC value 

Other remarks  If a class has a large number of children, it may require more testing 

of the methods of that class, thus increase the testing time. 

Remedial actions for classes with a large NOC value can be: redesign, 

code inspection, additional low level testing. 


A.4.2.2 Depth of inheritance tree

Main Characteristic  Maintainability 

Sub Characteristic  Analyzability 

Metric name  Depth of inheritance tree (DIT) 

Goal  To assess the degree of complexity induced by inheritance 

Owner / Producer  Owner: development leader 

Producer: development team 

Target audience  SW PA Manager, development leader, V&V leader 

Evaluation method  Static code analysis with the support of automatic tools. 

Formula  No Formula 

Interpretation of 

measured value 

DIT <= 4 

The larger the maximum length of a chain of inheritance the more 

complex is the software. The deeper a class is within the hierarchy, 

the greater the number methods it is likely to inherit making it more 

complex to predict its behaviour. 

98 

ECSS‐Q‐HB‐80‐04A  

30 March 2011 

Life cycle phase  Collected during design and implementation engineering, SW 

validation and verification processes. 

Provided at CDR, and updated afterwards as required. 

Applicability  ‐ MANDATORY for criticality categories A‐B‐C 

‐ RECOMMENDED for criticality category D 

Pre‐conditions  Coding activity finished. 

Availability of a static analysis tool. 

Report format  Tool dependant, but tabular and graphical results should both be 

available. 

Table with the names of the classes, the criticality category of the class 

and the actually measured value. 

Other remarks  A parameterized class is also called a generic class. 

Parameterized classes should be subject of extra review activities to 

detect possible problems due to parameterization  

A.4.2.3 Parametric polymorphic factor

Main Characteristic  Maintainability 

Sub Characteristic  Analyzability 

Metric name  Parametric polymorphism factor (Numerator only) 

Goal  To assess the degree of complexity induced by (parameterized) 

polymorphism by providing the percentage of the classes that are 

parameterized. 

Owner / Producer  Owner: development leader 

Producer: development team 

Target audience  SW PA Manager, development leader, V&V leader 

Evaluation method  Static code analysis with the support of automatic tools. 

Formula  PPF = Parameterized classes/All classes 

The numerator of the source code metric “Parametric polymorphism 

factor” is the total number of parameterized classes (also called 

generic classes or template classes ) 

Interpretation of 

measured value 

The larger the number of parameterized classes the more complex is 

the software 

Life cycle phase  Collected during design and implementation engineering, SW 

validation and verification processes. 

Provided at CDR, and updated afterwards as required. 

Applicability  ‐ MANDATORY for criticality categories A‐B‐C 

‐ RECOMMENDED for criticality category D 

Pre‐conditions  Coding activity finished. 

Availability of a static analysis tool. 

99 

ECSS‐Q‐HB‐80‐04A  

30 March 2011 

Report format  Tool dependant, but tabular and graphical results should both be 

available. 

Table with the names of the classes, the criticality category of the class 

and the actually measured value. 

Other remarks  A parameterized class is also called a generic class. 

Parameterized classes should be subject of extra review activities to 

detect possible problems due to parameterization  

A.4.2.4 Coupling between objects

Main Characteristic  Maintainability 

Sub Characteristic  Modularity 

Metric name  Coupling between objects (CBO) 

Goal  To measure the number of other classes to which a class is coupled. 

Owner / Producer  Owner: development leader 

Producer: development team 

Target audience  SW PA Manager, development leader, V&V leader 

Evaluation method  Static code analysis with the support of automatic tools. 

Formula  No Formula. Just by counting the number of distinct non‐inheritance 

related class hierarchies on which a class depends. 

Interpretation of 

measured value 

CBO<=4 

The larger the number of couples, the higher the sensitivity to changes 

in other parts of the design and therefore maintenance is more difficult 

Life cycle phase  Collected during design and implementation engineering, SW 

validation and verification processes. 

Provided at CDR, and updated afterwards as required. 

Applicability  ‐ MANDATORY for criticality categories A‐B‐C 

‐ RECOMMENDED for criticality category D 

Pre‐conditions  Coding activity finished. 

Availability of a static analysis tool. 

Report format  Tool dependant, but tabular and graphical results should both be 

available. 

Table with the names of the classes, the criticality category of the class 

and the actually measured value.

Other remarks  Excessive coupling is detrimental to modular design and prevents 

reuse. Strong coupling complicates a system since a class is harder to 

understand, change or correct by itself if it is interrelated with other 

classes. Complexity can be reduced by designing systems with the 

weakest possible coupling between classes. 


100 

ECSS‐Q‐HB‐80‐04A  

30 March 2011 

A.4.2.5 Lack of cohesion of methods

Main Characteristic  Maintainability 

Sub Characteristic  Modularity 

Metric name  Lack of cohesion of methods (LCOM) 

Goal  To measure the dissimilarity of methods in a class by instance variable 

or attributes. 

Owner / Producer  Owner: development leader 

Producer: development team 

Target audience  SW PA Manager, development leader, V&V leader 

Evaluation method  Static code analysis with the support of automatic tools. 

Formula  Henderson‐Sellers LCOM* 

Consider a set of m methods, M1 , M2 ,... , Mm; the methods access a data 

attributes, A1 , A2 ,... , Aa; let m(Ak) = number of methods that access 

data Ak. Then 


Please note: 0 <= LCOM* <=m / (m‐1), since the term in brackets is 

greater or equal zero and smaller or equal m. 

Interpretation of 

measured value 

LMOC >= 1.5 x m (m‐1) 

High cohesion indicates good class subdivision. Lack of cohesion or low 

cohesion increases complexity, thereby increasing the likelihood of 

errors during the development process. High cohesion implies 

simplicity and high reusability. High cohesion indicates good class 

subdivision. Lack of cohesion or low cohesion increases complexity, 

thereby increasing the likelihood of errors during the development 

process. 

Life cycle phase  Collected during design and implementation engineering, SW 

validation and verification processes. 

Provided at CDR, and updated afterwards as required. 

Applicability  ‐ MANDATORY for criticality categories A‐B‐C 

‐ RECOMMENDED for criticality category D 

Pre‐conditions  Coding activity finished. 

Availability of a static analysis tool. 

Report format  Tool dependant, but tabular and graphical results should both be 

available. 

Table with the names of the classes, the criticality category of the class 

and the actually measured value. 

Other remarks  Classes with low cohesion could probably be subdivided into two or 

more subclasses with increased cohesion. For example, an 

implementation can be the number of times the attributes have been 

used in each method of the class. 


101 


Recommended