ICES-2020- 147 Spacesuit Dust Mitigation-Study in Vacuum Settings Using Carbon Nanotube Fibers with Electric Fields Kavya K. Manyapu 1 and Leora Peltz 2 The Boeing Company, Houston, TX 77546 Pablo de Leon 3 University of North Dakota, Grand Forks, ND, and Carlos Calle 4 NASA Kennedy Space Center, Cape Canaveral, FL, Zip Code Even after 50 years since the first lunar manned missions, lunar exploration has been a significant topic of interest to advance human space exploration. With NASA working towards an eventual return to the lunar surface to set up permanent human outposts, these activities necessitate robust and reusable spacesuits to enable frequent extravehicular activities in the dusty environments of the lunar surface. Dust contamination was shown to be a serious problem during Apollo missions when the powdery dust substantially degraded the performance of spacesuits and other critical equipment. The research presented in this paper designed, developed, and tested the Specially Integrated Carbon nanotube Dust Ejection/Removal (SPIcDER) system. SPIcDER generates an electric field that can actively levitate and repel dust particles off the spacesuit outerlayer when energized using a multi-phase AC voltage signal. Carbon nanotube (CNT) flexible fibers, used as electrodes, are embedded within the outerlayer of the spacesuit as they provide the required resilience and flexibility required for spacesuit operations. The system leveraged the Electrodynamic Dust Shield (EDS) developed by NASA for rigid surfaces. SPIcDER applies novel fabrication methods to create a ‘smart fabric’ suited for repelling dust from flexible surfaces. Proof of concept for SPIcDER was demonstrated successfully at coupon level and a functional full-scale knee joint section of a spacesuit prototype. Our experiments with lunar and Martian dust simulants demonstrated the functionality and efficacy of SPIcDER in preventing dust contamination. The current paper details the performance of SPIcDER in vacuum conditions based on experiments conducted at the Kennedy Space Center utilizing spacesuit material coupons with CNT fibers. The research provides an assessment of both the design and manufacturing parameters influencing SPIcDER dust cleaning performance. While SPIcDER was initially developed for spacesuits, the underlying technology is versatile, applicable to flexible structures deployed during a mission in space, or on Earth. Nomenclature %DA = percentage of dust covering the fabric post cleaning operations AC = clean area of the fabric evaluated AdA = area of the fabric covered in dust post cleaning %DB = percentage of dust covering the fabric prior to cleaning operations AdB = area of the fabric covered in dust before cleaning %DC = efficiency of the dust cleaning performance AC = Alternation Current CNT = Carbon Nanotube EVA = Extra Vehicular Activity ISS = International Space Station MMOD = Micrometeoroids and Orbital Debris PTFE = Polytetrafluoroethylene SPIcDER = Spacesuit Integrated Carbon nanotube Dust Ejection/Removal WFM = Work Function Matching coating 1 Adjunct Professor, University of North Dakota, Grand Forks, ND 58202, and Flight Crew Operations Engineer, CST-100, The Boeing Company, Houston, 77058, USA 2 Technical Fellow, Boeing Research and Technology, Huntington Beach, CA 92647, USA 3 Professor, Department of Space Studies, University of North Dakota, Grand Forks, ND 58202, USA 4 Research Scientist, NASA Kennedy Space Center, Cape Canaveral, FL 32899, USA
Transcript
ICES-2020- 147
Spacesuit Dust Mitigation-Study in Vacuum Settings Using
Carbon Nanotube Fibers with Electric Fields Kavya K. Manyapu1 and Leora Peltz2
The Boeing Company, Houston, TX 77546
Pablo de Leon3
University of North Dakota, Grand Forks, ND,
and
Carlos Calle4
NASA Kennedy Space Center, Cape Canaveral, FL, Zip Code
Even after 50 years since the first lunar manned missions, lunar exploration has been a significant
topic of interest to advance human space exploration. With NASA working towards an eventual return to the
lunar surface to set up permanent human outposts, these activities necessitate robust and reusable spacesuits
to enable frequent extravehicular activities in the dusty environments of the lunar surface. Dust contamination
was shown to be a serious problem during Apollo missions when the powdery dust substantially degraded the
performance of spacesuits and other critical equipment.
The research presented in this paper designed, developed, and tested the Specially Integrated Carbon
nanotube Dust Ejection/Removal (SPIcDER) system. SPIcDER generates an electric field that can actively
levitate and repel dust particles off the spacesuit outerlayer when energized using a multi-phase AC voltage
signal. Carbon nanotube (CNT) flexible fibers, used as electrodes, are embedded within the outerlayer of the
spacesuit as they provide the required resilience and flexibility required for spacesuit operations. The system
leveraged the Electrodynamic Dust Shield (EDS) developed by NASA for rigid surfaces. SPIcDER applies novel
fabrication methods to create a ‘smart fabric’ suited for repelling dust from flexible surfaces. Proof of concept
for SPIcDER was demonstrated successfully at coupon level and a functional full-scale knee joint section of a
spacesuit prototype. Our experiments with lunar and Martian dust simulants demonstrated the functionality
and efficacy of SPIcDER in preventing dust contamination.
The current paper details the performance of SPIcDER in vacuum conditions based on experiments
conducted at the Kennedy Space Center utilizing spacesuit material coupons with CNT fibers. The research
provides an assessment of both the design and manufacturing parameters influencing SPIcDER dust cleaning
performance. While SPIcDER was initially developed for spacesuits, the underlying technology is versatile,
applicable to flexible structures deployed during a mission in space, or on Earth.
Nomenclature
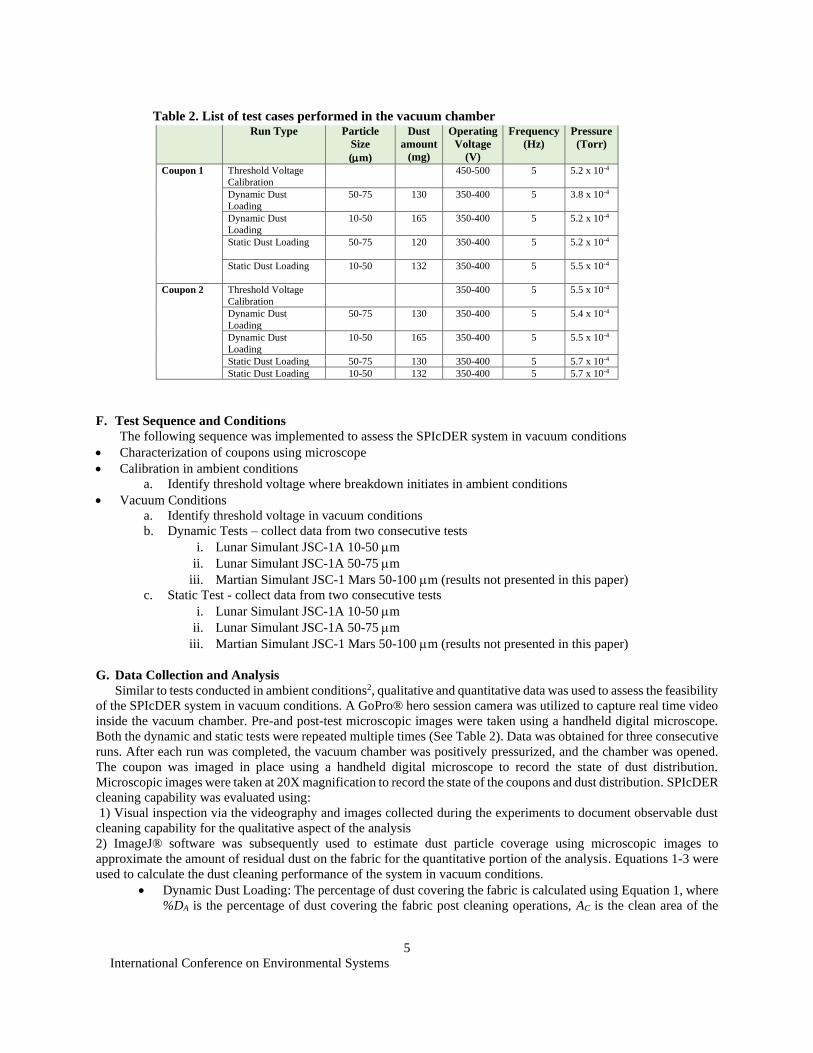
%DA = percentage of dust covering the fabric post cleaning operations
AC = clean area of the fabric evaluated
AdA = area of the fabric covered in dust post cleaning
%DB = percentage of dust covering the fabric prior to cleaning operations
AdB = area of the fabric covered in dust before cleaning
1Adjunct Professor, University of North Dakota, Grand Forks, ND 58202, and Flight Crew Operations Engineer,
CST-100, The Boeing Company, Houston, 77058, USA 2 Technical Fellow, Boeing Research and Technology, Huntington Beach, CA 92647, USA 3 Professor, Department of Space Studies, University of North Dakota, Grand Forks, ND 58202, USA 4 Research Scientist, NASA Kennedy Space Center, Cape Canaveral, FL 32899, USA
International Conference on Environmental Systems
2
I. Introduction
ITH the US Government’s vison to go back to the moon as early as 2024, it is imperative that the issue of dust
contamination is addressed. Dust mitigation has been identified as a critical path for the success of sustainable
missions to the moon for the Artemis program1. Spacesuits and all other systems that may be exposed to lunar
dust/regolith should be designed for maintainability in dusty environments. This dust mitigation will also
become necessary for planetary exploration of Mars and asteroids.
While numerous solutions for dust mitigation have been proposed in literature using active and passive methods, most
of these techniques were demonstrated for use on rigid surfaces such as solar panels, optical planes, glass structures
and thermal radiators2, 3. Our research is geared towards addressing dust contamination for flexible surfaces such as
spacesuits, thermal covers, habitat outerlayers, etc., which are predominately characterized by irregular contours,
flexible structure of the soft goods and generally covered with Teflon coated outerlayers (example: beta cloth or
orthofabric).
This paper is a continuation to the research efforts previously4 conducted by the current authors on developing the
Specially Integrated Carbon nanotube Dust Ejection/Removal (SPIcDER) system. The SPIcDER system utilizes
parallel conductive yarns made of Carbon Nanotube (CNT) flexible fibers embedded into the outerlayer of the
spacesuit. The CNT yarns are energized with a multi-phase AC voltage signal (‘cleaning signal’), which forms a
travelling wave of electric field around the surface exposed to dust (for example, spacesuit outerlayer). This active
system has dual action 1. To prevent accumulation of dust particles and 2. To repel dust particles that may have already
accumulated on the spacesuit surface. The performance of this ‘dust repellent smart fabric’ of the SPIcDER system
can be further augmented by adding a passive coating such as the Work Function Matching (WFM) coating developed
by NASA that works to lower dust adhesion to the surface, thereby enhancing the efficacy of the active system.
Proof of concept and feasibility
of the SPIcDER system have
been previously demonstrated in
laboratory ambient conditions at
the Electrostatics and Surface
Physics Laboratory at the
Kennedy Space Center (KSC)
and Boeing previously by this
research team4,5. The
experiments utilized coupons (3
by 3 inch) and full scale spacesuit
joint knee section prototype
made of spacesuit orthofabric
material embedded with CNT fiber electrodes. Orthofabric is the outerlayer currently used on the International Space
Station (ISS) EVA suits to protect the internal components of the suit from dust, abrasion, flame resistance,
Micrometeoroid and Orbital Debris (MMOD), and for thermal insulation. It is also a potential outer fabric in
consideration for future lunar spacesuits. Current ISS EVA suits use orthofabric as the outermost layer and it is a
potential material identified for future planetary spacesuits. Orthofabric is a complex weave of Nomex (DuPont) and
Kevlar (DuPont) with an outer layer of Gortex (W.L. Gore & Associates), which is made from expanded
Polytetrafluoroethylene (PTFE). Experiments demonstrated that the SPIcDER system is capable of repelling > 80%
of JSC-1A lunar dust simulant particles with grain sizes between 10-75 m in ambient conditions, in both dynamic
and static dust loading4,5. This cleaning using the SPIcDER system resulted in less than 10% of the fabric area covered
in residual lunar dust.
The current paper details initial investigations of SPIcDER concept in vacuum conditions using the same coupons
tested in ambient condition. The experiments were conducted using lunar and Martian dust simulants. Details of these
experiments and future work scope to advance the technology to utilize for sustainable moon missions are provided
here.
W
Figure 1. Operating concept of SPIcDER
International Conference on Environmental Systems
3
II. Experimental Set-up
A. Test Samples
Table 1. Configuration of coupons tested in vacuum conditions
Two coupons were constructed to test
the effectiveness of the SPIcDER system
in vacuum conditions. Configuration of
the two coupons are presented in Table 1.
Prior to embedding electrodes into the
second orthofabric coupon, the CNT fiber
was heated to 300oC for 24 hours to
remove any residual matter from the fiber
to prevent off-gassing in vacuum.
Prior to depositing dust over the coupon
in the chamber, calibration tests to
evaluate the threshold voltage at which
breakdown occurs in vacuum was
performed. Subsequent dust deposition
for dust cleaning characterization was
conducted at 50-100V below the
threshold voltage.
B. Vacuum Chamber
Vacuum tests were conducted at the
Kennedy Space Center (KSC) in the
Electrostatics and Surface Physics
Laboratory (ESPL). The vacuum chamber
was custom built for ESPL and can attain high vacuum down to 1.0e-6 torr. The chamber is made from stainless steel
with internal dimensions of approximately 18” x 18” x 24”. It has multiple 2.75” Conflat® ports that can
accommodate pumps, viewports, high voltage feed throughs, and other instrumentation. Figure 2 illustrates the test
set-up.
Figure 2. [A]Vacuum chamber test set-up in the ESPL at KSC, [B] Metal box inside the vacuum chamber that
holds the coupons, [C] Coupons mounted inside the metal box, [D] Power electronics to control dust cleaning
operations
Coupon 1 Coupon 2
No. of CNT
electrodes
12 9
CNT fiber type Unbaked Baked at 300o C
Fiber Insulation None None
Coating WFM coating No Coating
Spacing ~1-1.2mm ~1-1.2mm
Phase 3 phase 3 phase
International Conference on Environmental Systems
4
C. Power Supply
Experiments were conducted using a three-
phase AC voltage signal at 120o phase
difference. Generation of multi-phase voltage
was performed using tunable electronics power
supply developed by NASA that can generate
upto 3kV of three phase AC. A frequency of
5Hz using a square waveform was utilized
based on observations from previous studies4,6.
Figure 3 shows the power supply used for the
experiments.
D. Lunar Soil Simulant
Experiments were conducted utilizing the
JSC-1A lunar simulant with size ranges of 50-75m and
10-50m. The specifications for this simulant
developed by Orbital Technologies Corporation are
summarized in their specification database7. The
specific simulant particle sizes were pre-sieved at the
NASA ESPL and were obtained for these experiments.
The two particle size ranges were chosen for these
preliminary tests to compare the performance of
SPIcDER on flexible surfaces to that of similar tests
conducted on rigid surfaces using the EDS system2.
Figure 4 provides the distribution of the optically
measured (microscope and image analysis) JSC-1A
particle sizes utilized for this study. Future tests of
SPIcDER will utilize appropriate mixture replicating
lunar dust particle size distribution. Results from the
Martian dust simulant study are not reported in this
paper.
E. Test Methods
The following steps provide a description of how the coupons were set-up inside the vacuum chamber.
Each coupon was cleaned using puffs of compressed air and imaged under the microscope. The coupon was then
mounted inside a metal box shown in Figure 2C on insulating plate holders. The metal box has interfaces to the power
supply connections and is facilitated with a tray that holds the dust (Figure 2B). The tray can be actuated from outside
the vacuum chamber to drop dust. The tray contains several orifices at evenly spaced intervals to drop the dust. When
the tray is actuated, the cover on the underside of the tray slides open allowing the dust to drop onto the coupon.
Appropriate phase connections to the CNT electrodes were made inside the metal box. The metal box was then placed
inside the vacuum chamber. Connections to the power supply on the metal box exterior were mated. Additional
connections to a LED light inside the metal box and the dust tray were mated. A GoPro® hero session camera was
placed over the metal box to capture live video that could be controlled using an iPhone via Wi-Fi from outside the
vacuum chamber. The chamber was closed and pumped down to vacuum. Once chamber pressure stabilized, the power
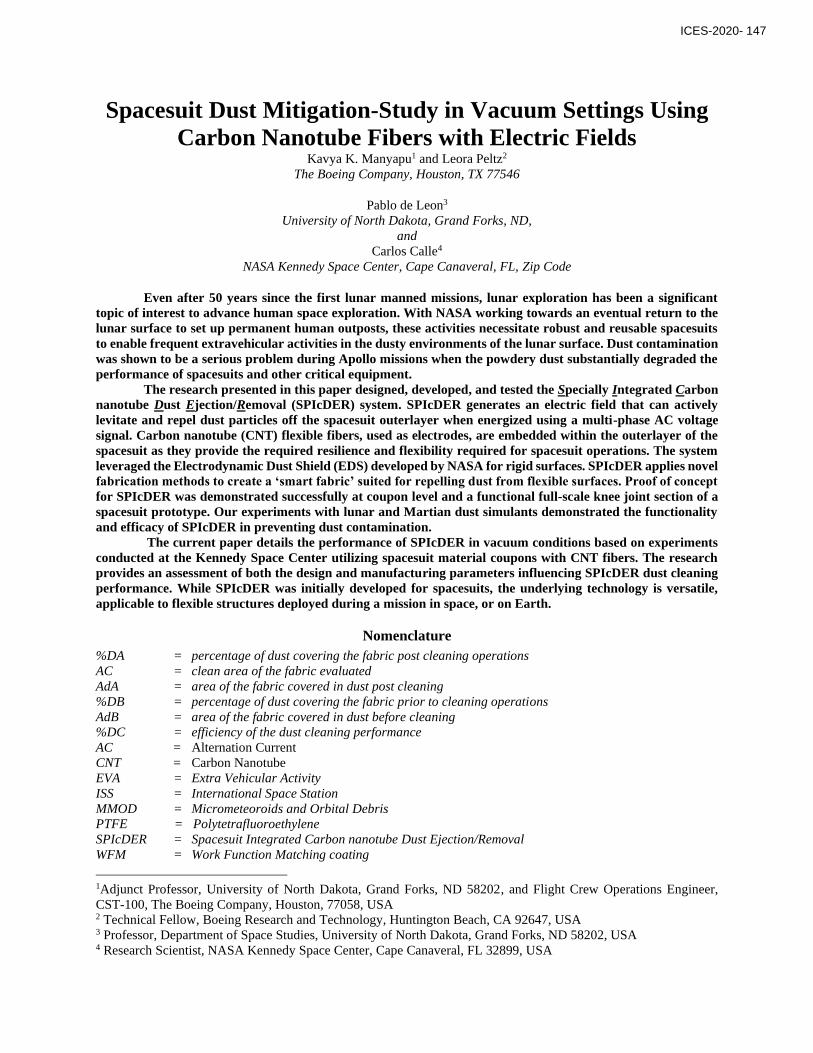
system was turned on to verify threshold voltages. Table 2 provides a list of test cases performed in the vacuum
chamber. Two dust loading conditions were employed to test SPIcDER.
• Dynamic Test: The first method employed SPIcDER activation as the first step prior to dust deposition. The
dust tray was actuated to continuously drop approximately 10mg of dust over the coupon when SPIcDER was
active. This is an approximate representation of dust dynamically interacting with the suit during an EVA
• Static Test: In the second method, approximately 10-100mg of simulant was deposited over the area on the
coupon covered with electrodes prior to SPIcDER activation. This represents a scenario where the dust
statically adhered to the spacesuits during an EVA. The dust tray was actuated first followed by turning on
the power to energize the CNTs.
Figure 3. (Top Left) Three phase power supply. (Top
2 Calle, C. I., Buhler, C. R., Johansen, M. R., Hogue, M. D., and Snyder, S. J., “Active dust control and mitigation technology
for lunar and Martian exploration”. Acta Astronautica, 69(11), 2011, pp 1082-1088.
3Margiotta, D. V., Peters, W. C., Straka, S. A., Rodriguez, M., McKittrick, K. R., and Jones, C. B., “The Lotus coating for
space exploration: a dust mitigation tool. Society of Photo-Optical Instrumentation Engineers (SPIE) Conference Series, Vol. 7794,
2010, pp 14, 2010. 4Manyapu, K. K., Peltz, L., de Leon, P., Gaier, J. R., Tsentalovich, D., Calle, C., & Mackey, P., “Investigating the Feasibility
of Utilizing Carbon Nanotube Fibers for Spacesuit Dust Mitigation,” 46th International Conference on Environmental Systems,
Vienna, Austria, 2016 5 Manyapu, K. K., Peltz, L., de Leon, P., Gaier, J. R., “Spacesuit integrated carbon nanotube dust removal system: a scaled
prototype,” 48th International Conference on Environmental Systems, Alberquerque, NM, 2018 6Manyapu, K.K., “Spacesuit Integrated Carbon Nanotube Dust Mitigation System for Lunar Exploration,” Ph.D. Dissertation,
Aerospace Science Dept., University of North Dakota, Grandforks, ND, 2017 7JSC-1AF Characterization, Orbital Technologies Corporation, http://www.orbitec.com/store/JSC-1AF_Characterization.pdf
[accessed 03.01.2019] 8Cheng, Y., & Zhou, O., “Electron field emission from carbon nanotubes”. Comptes Rendus Physique, 4(9), 2003, pp 1021-