7/27/2019 Spain’s Most Exported Products
http://slidepdf.com/reader/full/spains-most-exported-products 1/4
Spain’sMostExported
Products
Since2007,Spanishexportshaveincreasedbymoretan20%.However,thisincreasehasn’taffecteddifferentsectorsand
productfamiliesinthesameway–whilesomehavedoubledtheir
exports,othershavelostaquarteroftheirvolume.Discoverwhichonesinthefollowingreport.
VesselinPetrovVassilev|exportaric.com June,2013
7/27/2019 Spain’s Most Exported Products
http://slidepdf.com/reader/full/spains-most-exported-products 2/4
Vessel inPetrovVassi lev|exportaric.com
nthisreportweexaminethemostrepresentativeproductsamongSpanishexports.Wewill
beusingtheclassificationoftheSpanishInstituteofForeignTrade(ICEX,inSpanish)dueto
itsclarityasopposedtotheHarmonizedSystemclassification(TARIC),whichisstillthe
industrystandard.Weintendtoanswerthefollowingquestions:
• WhicharethemostexportedSpanishproducts?
• Howhavetheirexportsevolvedinthepastfewyears? ICEXSectors Atthefirstleveloftheclassificationweare
using,weobservethefollowingsector-wide
distributionofSpanishexports.Weobserve
thepredominantpositionoftechnological
andindustrialproducts–70%ofexportsin
2012,asopposedtojust2%corresponding
tobeverages.However,itisimportantto
haveinmindthatwearepresenting
statisticsbasedonthevalueoftheexports,
andnotthenumberofoperationsthatwere
carriedout.
Togetabetterideaofthefrequencyof
exportsineachsector,wepresentthesameclassification,thistimebasedonthenumber
ofoperations.Weobservethatconsumer
goodsrepresentmoretanhalfofall
exports,althoughtheyonlygenerate14%of
thetotalvalue,while70%ofthevalueof
exportsaregeneratedbyonlyathirdofall
operations,focusedonindustryand
technology.
Ontheotherhand,therelativeweightofbeveragesandagri-foodexportshardly
variesbetweenvaluesandnumberof
operations.
I
Raw materials,
Industrial
Equipment
33%
ConsumerGoods
52%
Agri‐Food
12%
Beverages
3%
MainExportsin2012(Operations)
Data: ICEX
Raw materials,
Industrial
Equipment
70%
Consumer
Goods
14%
Agri‐Food
14%
Beverages
2%
MainExportsin2012(Values)
Data: ICEX
7/27/2019 Spain’s Most Exported Products
http://slidepdf.com/reader/full/spains-most-exported-products 3/4
Vessel inPetrovVassi lev|exportaric.com
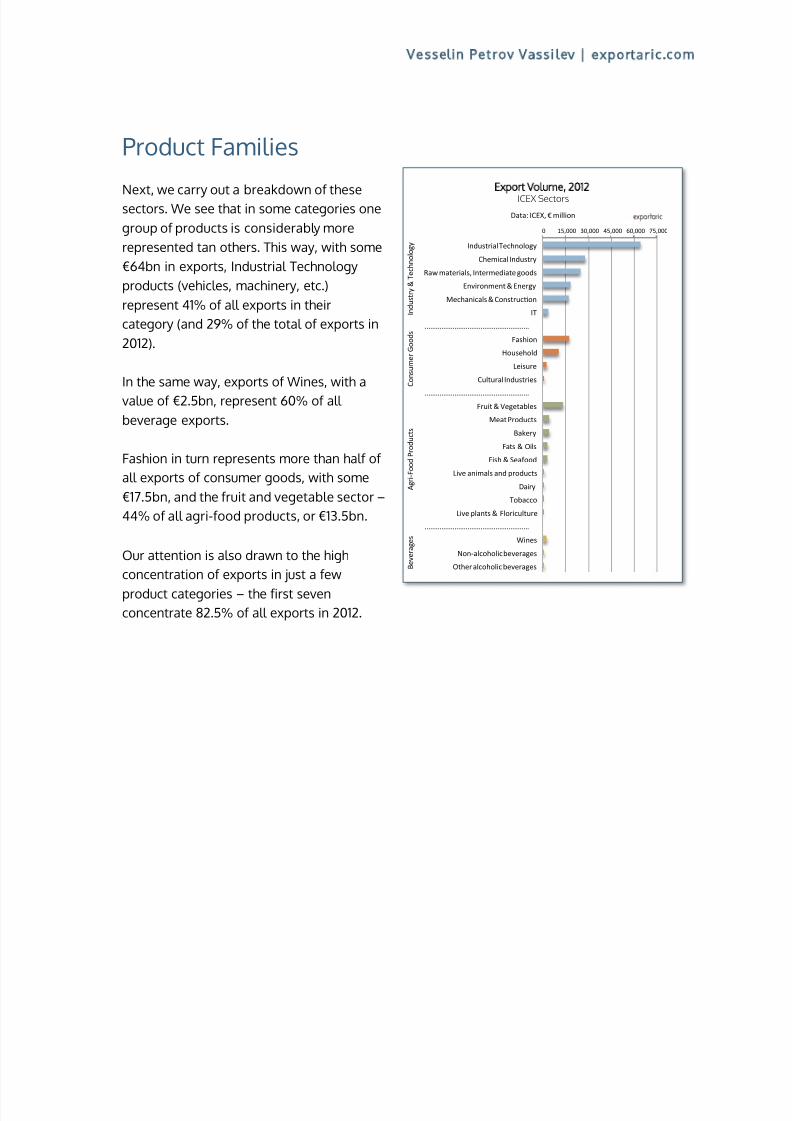
ProductFamilies Next,wecarryoutabreakdownofthesesectors.Weseethatinsomecategoriesone
groupofproductsisconsiderablymore
representedtanothers.Thisway,withsome
€64bninexports,IndustrialTechnology
products(vehicles,machinery,etc.)
represent41%ofallexportsintheir
category(and29%ofthetotalofexportsin
2012).
Inthesameway,exportsofWines,witha
valueof€2.5bn,represent60%ofall
beverageexports.
Fashioninturnrepresentsmorethanhalfof
allexportsofconsumergoods,withsome
€17.5bn,andthefruitandvegetablesector–
44%ofallagri-foodproducts,or€13.5bn. Ourattentionisalsodrawntothehigh
concentrationofexportsinjustafew
productcategories–thefirstseven
concentrate82.5%ofallexportsin2012.
0 15,000 30,000 45,000 60,000 75,000
Industrial Technology
Chemical Industry
Raw materials, Intermediate goods
Environment & Energy
Mechanicals & ConstrucOon
IT
........................................................
Fashion
Household
Leisure
Cultural Industries
........................................................
Fruit & Vegetables
Meat Products
Bakery
Fats & ils
Fish & Seafood
Live animals and products
Dairy
Tobacco
Live plants & Floriculture
........................................................
Wines
Non‐alcoholic beverages
ther alcoholic beverages
I n d u s t r y & T e c h n o l o g y
C o n s u m e r G o o d s
A g r i ‐ F o o d P r o d u c t s
B e v e r a g e s
ExportVolume,2012ICEXSectors
Data: ICEX, € million
7/27/2019 Spain’s Most Exported Products
http://slidepdf.com/reader/full/spains-most-exported-products 4/4
Vessel inPetrovVassi lev|exportaric.com
ExportEvolution Wealsowanttoknowhowexportsinthesecategorieshaveevolvedinrecentyears.In
thefollowingchartweobservethatthe
greatlossofbusinessof2009didnotaffect
themallinthesameway–theTechnology
sectorregisteredalossof18%,while
exportsofbeverageshardlydecreasedby
1%.
From2007to2012notallsectorshadthe
sameevolution–comparedtotheaverage
increaseofexportsof20.3%,different
sectorsfaredasfollows:
• Technologysector–21%
• Consumergoods–4%
• Agri-foodproducts–36%
• Beverages–40%
Amongsub-categoriesoftheICEX
classification,contrastsareevenstarker.
Since2007,theevolutionofexportvaluevariesfroma27%lossforculturalindustries
toa120%gainforenvironmentaland
energy-relatedproducts.
Exportsthathaveincreasedthemostsince
2007:
• EnvironmentandEnergyproduction–
120%
• Rawmaterials,semi-manufactures,
intermediateproducts–89%
• Tobacco–76%
• Meatproducts–75%
• Wines–42%
• Liveanimalsandbyproducts–42%
Exportsthathavedecreasedthemostsince
2007:
• Culturalindustries–27%
• Household–20%
• Leisure–19%
• IndustrialTechnology–3%
• IT–2%
Beverages
Agri‐Food ProductsConsumer Goods
Industry & Technology
0.
40,000,000.
80,000,000.
120,000,000.
160,000,000.
2007 2008 2009 2010
2011 2012
EvolutionofExports,2007-2012ICEXSectors
Data: ICEX, € thousands