Spatial analysis of fluoride in groundwater in the Singida region (Tanzania) and laboratory experiments to identify potential sources Undergraduate Research Thesis Submitted in partial fulfillment of the requirements for graduation with research distinction in Earth Sciences in the undergraduate colleges of The Ohio State University By Jonathan L. Bell The Ohio State University 2019
Transcript
Spatial analysis of fluoride in groundwater in the Singida region (Tanzania) and laboratory experiments to identify
potential sources
Undergraduate Research Thesis
Submitted in partial fulfillment of the requirements for
graduation with research distinction in Earth Sciences
8.2 Additional Tables and Figures……………………………………………….25
ii
Abstract Fluoride contamination of drinking water is a significant health hazard in many parts of Tanzania, and understanding fluoride distribution is vital for future groundwater development. In the Singida region, a spatial analysis of fluoride concentrations in wells showed that fluoride distribution is primarily controlled by bedrock lithology, and most boreholes with dangerous fluoride concentrations are drilled in igneous and metamorphic rocks of the Kavirondian-Nyanzian Supergroup. Borehole productivity depends on striking water-bearing fractures in the bedrock, and drilling efficiency may be improved by abandoning dry wells at depths of 50 meters, shallower than is typical for local drilling companies. Dissolution experiments performed on soil and bedrock samples from a village in the Kilimanjaro region that struggles with fluoride contamination showed that soil can be a major source of fluoride to groundwater, while bedrock releases negligible fluoride. An external source like hydrothermal water is likely needed to explain observed fluoride in groundwater.
iii
Acknowledgements I would first like to thank Dr. Audrey Sawyer for her endless support and guidance throughout the entirety of this project as well as my entire undergraduate career. I am extremely grateful for the research opportunities she has provided to me, and she has been a wonderful mentor. This project could not have been completed without her help.
I would like to thank Dr. Susan Welch for her tremendous help with the chemical analysis of my samples and advice and Dr. Berry Lyons for his advice and practicality consultations. I would also like to thank Dr. Julie Sheets, Dr. Dave Cole, and the Subsurface Energy Materials Characterization and Analysis Laboratory (SEMCAL) at the Ohio State University for their assistance with microscopy.
I would like to thank Dr. Anne Carey for her helpful suggestions, and Amelia Nelson and all the other graduate students who have helped me find my way around the laboratory.
I thank Devon Goeller for collecting the samples used in my dissolution experiments, and the Tanzanian Ministry of Water and Majitech for sharing borehole and water quality records.
Funds for this project were provide by a grant from USAID and Coca-Cola. I would also like to thank Rebecca Gianotti, Gajan Sivandran, and the Global Water Institute at The Ohio State University for their assistance and advice.
Finally, I would like to thank The Ohio State University and the School of Earth Sciences for financial aid, including the School of Earth Sciences Field Travel Experience Travel Fund, the Edmund M. Spieker Memorial Scholarship Fund, and the Joseph and Marcia Newhart Scholarship fund which have allowed me to attend university for my undergraduate studies and all the amazing experiences I’ve had as a member of the School of Earth Sciences.
iv
List of Figures and Tables Figure 2.0. Study locations…………………………………………………………....2
Figure 2.2.1 Marwa village borehole locations……..…………………………………....3
Table 4.2.2 Freely available fluoride…………………………………………………….14
Figure 4.2.3 Fluoride ratios at 2 weeks…………………………………………………..15
Figure 4.2.4 Evolution of fluoride ratios………………………………………………...16
Figure 4.3.1 Rock and soil thin sections……………………………....…….......................18
Table 8.2.1 Chemical Analysis Results………………………………………………….25
Figure 8.2.2. Phosphate vs fluoride……………………………………………………...27
Figure 8.2.3 Phosphate to fluoride ratios over time……………………………………...27
1
1. Introduction
Fluoride contamination is common across the globe and can lead to serious health problems (Ali et al., 2016; Edmunds and Smedley, 2005; Fuge, 2019). Fluoride occurs naturally in groundwater due to the dissolution of fluorine-bearing minerals in rocks and soils such as fluorite, apatite, amphibole, and biotite (Fuge, 2019; Edmunds and Smedley, 2005; Pickering, 1985). Groundwater containing elevated fluoride concentrations, defined here as exceeding the World Health Organization (WHO) drinking water standard of 1.5 mg/L, can be found in many areas including India (up to 22.8 mg.L), the United States (up to 78 mg/L), Mexico (up to 7.5 mg/L), and Africa (up to 204 mg/L)(Ali et al., 2016).
Trace amounts of fluoride have been shown to be beneficial in the prevention of dental cavities, and the U.S Public Health Service recommends an optimal concentration of 0.7 mg/L in drinking water (U.S. Public Health Service, 2015). However, fluoride concentrations above 1.5 mg/L have been shown to increase the risk of dental fluorosis, which can cause significant discoloration of teeth (WHO, 2011; Fawell et al., 2006). Fluoride ingestion above 6 mg/day increases the risk of developing bone structure defects. Intake rates greater than 14 mg/day can increase the risk of bone fractures and cause skeletal fluorosis, a condition wherein bones become misshapen, especially in children (IPCS, 2002). Despite WHO recommendations, some countries like Tanzania set drinking water standards as high as 4 mg/L, perhaps due to the challenge of meeting a stricter standard under widespread fluoride contamination or water scarcity (Edmunds and Smedley, 2005, Nanyaro et al., 1984).
Understanding sources and distributions of elevated fluoride in countries like Tanzania can help minimize exposure to harmful fluoride concentrations and guide groundwater development. This study presents an analysis of the spatial distribution of fluoride concentrations in groundwater from government and private datasets covering the Singida region of Tanzania, where the Global Water Institute at The Ohio State University is currently engaged in a well rehabilitation project. The overall goal of this research was to understand relationships between fluoride concentrations and geology in order to assess potential fluoride sources and improve the placement of future groundwater wells. Possible fluoride sources in the region include geothermal fluids and the weathering of soils, volcanic rocks, and the crystalline basement complex (British Geological Survey, 2000; Kilham and Hecky, 1973).
Unfortunately, it was not possible to obtain water or rock samples from the Singida Region to support an assessment of potential fluoride sources with geochemical analyses. However, water, rock, and soil samples were obtained from the village of Marwa in the Kilimanjaro Region, where groundwater also has elevated fluoride concentrations (Goeller, 2017). These samples were used in batch dissolution experiments to assess sources of fluoride to groundwater. Similar experiments could be used to refine understanding of the fluoride sources in the Singida Region, once samples become available.
2
2. Study Areas
Fig. 2.0. Study locations.
In the Singida region, a geospatial analysis of known fluoride concentrations was conducted to support future drilling efforts. In the Kilimanjaro region, soil and rock samples were available from Marwa Village, and batch experiments were conducted to examine potential fluoride sources to groundwater.
2.1 Singida Region
The Singida region lies on a plateau bounded by extensional faults created by the East African Rift System. The dominant lithology is crystalline rock of Neoarchean age (2800-2500 Ma), composed of granitoids, migmatites, gneisses and other metamorphic rocks. Volcanic rocks of both Neoarchean and Quaternary age can also be found, and there are several volcanoes associated with the East African Rift System just to the north and east of the region (Geological Survey of Tanzania, 2018). Locally, superficial Quaternary fluvial and lacustrine sedimentary deposits drape igneous and metamorphic rocks, but these sedimentary deposits do not typically exceed 100 meters in thickness. While shallow sediments may contain some groundwater, most groundwater in the Singida region resides in fracture systems within crystalline basement rocks (British Geological Survey, 2000). Drilling logs frequently characterize aquifer materials as granite or gneiss of the crystalline basement (Geological Survey of Tanzania, 2018).
The Singida region has a population of over 1.3 million people, and 79% of the population is concentrated in the northern half. The region has an average annual population growth rate of 2.3% (National Bureau of Statistics, 2013). If this growth continues, new water resources will be required
3
to support the growing population. The northern, more populated part of the region belongs to a large internal drainage basin and is dotted with alkaline lakes, where high salinity makes lake water unpotable without treatment (British Geological Survey, 2000). The region receives little to no rainfall in the dry season between May through October (Hijams et al., 2005), making groundwater an important year-round source of potable water. However, groundwater development is frequently challenged by accessibility and quality issues. Dry boreholes and low yields are common, as boreholes do not always intersect water-bearing fractures (Mseli et al., in review). When borehole yields are acceptable, high salt and fluoride concentrations sometimes render the water unfit for consumption (British Geological Survey, 2000, Mseli et al., in review). Aquifers in fractured granite with semi-arid climates like those in Tanzania are known to have a higher risk of elevated fluoride concentrations (Edmunds and Smedley, 2005; Padhi and Muralidharan, 2011; Rao and Devadas, 2003). It is therefore imperative to understand geologic controls on groundwater quality and quantity for future water resource development.
2.2 Marwa Village
Fig. 2.2.1 Borehole locations and satellite image of Marwa Village, showing the locations of the Lesirway and Njakitai well heads (from Goeller, 2017).
The village of Marwa is made up of four subvillages and is located on the southwestern edge of the Kilimanjaro region. Marwa is home to between 4,000 and 7,000 people, mainly livestock keepers (Goeller, 2017). It lies on the edge of the Pangani River floodplain, and the river is the main source of water for the village. However, health and drought concerns have led the village to seek water from other sources like boreholes (Goeller, 2017). The underlying rocks are predominantly gneiss, migmatite, granite, and amphibolite of Neoproterozoic age (1000-541Ma), and are similar to the rocks found in the Singida region (Geological Survey of Tanzania, 2018). Groundwater sampled
4
from the borehole in the subvillage of Lesirway in 2009 had a fluoride concentration of 3.47 mg/L (Goeller, 2017). There is also a borehole in the subvillage of Njakitai, but the borehole produces water that is too salty to be potable. Laboratory experiments in this study aimed to determine whether the elevated fluoride in the area can be attributed to minerals and salts in soils or the underlying rock.
3. Methods
3.1 Geospatial Analysis
Borehole records were obtained from two sources: the Tanzanian Ministry of Water and the private drilling company Majitech. Spreadsheets from the Ministry of Water contained lists of individual boreholes. These spreadsheets usually had the village name, borehole number and coordinates, date of drilling, depth to water, and water quality data such as fluoride, salinity, or total dissolved solids measurements. The Majitech dataset was composed of borehole drilling logs and water quality reports. The drilling logs contained the well design, well depth, depth to water, and rock type. The water quality reports contained concentrations of analytes such as fluoride, nitrate, iron, and additional water quality parameters such as total dissolved solids and salinity. These analyses were performed at national laboratories in Tanzania, such as the Arusha Regional Water Lab.
Both the Majitech and the Ministry of Water datasets were combined into a single data table. When possible, the Majitech data were used to supplement the Ministry of Water records. However, many of the Ministry of Water records had inconsistent amounts of information. For example, only two thirds of the records included spatial coordinates, and many of these lacked fields of interest such as fluoride and depth to water. In addition to this, some records were vague or lacked units. For example, borehole information under the Water Quality heading varied widely, and often contained comments such as: very salty, unfit for human consumption, F=2.5, and 2000 ppm. Sometimes it was necessary to interpret and correct the contents of these records. For example, entries with units of μS/cm were assumed to represent fluid conductivity measurements. The records were then standardized, and extraneous entries such as borehole diameter or borehole cost were removed from the records. Occasionally, records contained conflicting information. For example, depth to water was sometimes greater than the drilled depth. These records were considered unreliable and were removed. Boreholes were sometimes recorded as dry or abandoned. These were kept in the dataset, but they were not used for calculations involving water quality or quantity, such as fluoride, salinity, or depth to water.
To assess potential relationships between fluoride distribution and geology, geologic maps were obtained from the Geological and Mineral Information System produced by the Geological Survey of Tanzania. Structural maps reporting the locations of known faults and hot springs (Macheyeki et al., 2008, Kabete et al., 2012) were also acquired. However, the Singida region lies near the East African Rift zone, and small faults and hot springs may not be included in the maps. Elevation data for Tanzania were obtained from the Shuttle Radar Topography Mission (SRTM) 1 Arc-Second Global dataset. The SRTM Water Body Dataset was used to map the locations of lakes in and near the Singida region.
5
Data were integrated into a geodatabase in ArcMap for visualization and spatial analysis. Spatial joins were used to associate borehole data with geological information. For some boreholes, drill logs reported different rock types than those on the geologic map. This occurred most often in areas mapped as sedimentary, where the driller’s log reported only a thin veneer of sedimentary rock overlying crystalline rocks. To represent the aquifer geology more accurately, these boreholes were attributed to the nearest mapped crystalline rock unit of similar description, rather than the sedimentary drape. Boreholes that did not match either nearby rock or surficial geology, but were otherwise deemed reliable, were preserved in the geologic category other.
For each borehole, the distance to the nearest fault, hot spring, and lake was calculated using spatial joins in ArcMap. For each borehole, elevation was calculated using the SRTM digital elevation model. The compiled data were exported to MATLAB for statistical analysis. To provide an overview of the state of water quality and quantity in the Singida region, cumulative distributions of fluoride and depth to water were calculated. A correlation matrix was created to explore relationships between various groundwater and geologic parameters. Fluoride data were also analyzed in GSLIB (Deutsch and Journel, 1997) to examine spatial statistics of groundwater fluoride concentrations.
3.2 Batch Dissolution Experiments
Water, rock, and soil samples were collected by Devon Goeller from the village of Marwa (Kilimanjaro region) during May of 2017 as part of a civil engineering capstone class trip. Groundwater samples were collected from a hand pump installed over a borehole in the subvillage of Lesirway. These samples were immediately passed through a 0.45 µm pore size nylon filter into new polypropylene tubes which were first rinsed with sample. The tubes were then sealed and refrigerated (Devon Goeller, personal communication, 2017). Three soil samples were also collected, one from the well head in the subvillage of Njakitai, one from the well head in the subvillage of Lesirway, and one from the floodplain of the Pangani River near the subvillage of Lesirway. The soils were collected by manual grab sample and immediately preserved in Whirl-Pak bags and refrigerated. A fresh rock sample likely representing the local bedrock and aquifer lithology was broken off an outcrop, sealed in a Ziploc bag, and refrigerated (Devon Goeller, personal communication, 2017).
To asses potential mineralogical sources of fluoride, thin sections of the rock sample and grain mounts of the three soil samples were analyzed using a petrographic microscope. Polarized light images were acquired with an Olympus BX53 Petrographic microscope at the Subsurface Energy Materials Characterization and Analysis Laboratory (SEMCAL) in the School of Earth Sciences at The Ohio State University.
To determine whether elevated fluoride concentrations could have originated from the dissolution of minerals in the local soils or bedrock, batch dissolution experiments using the soil and rock samples were performed, and concentrations of fluoride and other ions were compared with groundwater from the area. A detailed standard operating procedure (SOP) for the batch dissolution experiments can be found in Appendix 1. First, a portion of the rock sample was crushed by hand using a ceramic mortar and pestle (SOP, Appendix 1). The crushed rock was sieved to remove
6
particles larger than 1 mm to achieve a similar grain size to the soil samples and to homogenize the sample. The total amount of crushed rock was small (>100g) and not all minerals or grains present in the rock unit may be present in the samples used for the dissolution experiments. The rock and soils were set out to air dry in polystyrene weighing boats on a lab shelf at 22° C for 2 weeks (SOP, Appendix 1). In an effort to represent natural soil conditions, the soil samples were not sieved.
Once dry, 2.50 g of each sample was measured into a new sterile 50 mL Falcon® polypropylene centrifuge tube along with 40 ml of MilliQ deionized water (18MΩ) (SOP, Appendix 1). The mass of water was recorded, and the tubes were sealed to minimize evaporation. The tubes were then agitated vigorously for 10 seconds to ensure complete dispersion of the sample. Samples were allowed to soak at 22° C for durations of 1h, 2h, 4h, 12h, 1d, 2d, 1wk, 2wk. These durations were chosen because fluoride can be released from a variety of minerals, including apatite and biotite, and dissolution occurs most rapidly within the first 100 hours (Chae et al., 2006, Zhu et al., 2009). Filter blanks were created by filtering MilliQ deionized water (18MΩ) into tubes using the same methods as the samples (SOP, Appendix 1). Duplicates were run to assess analytical error and uncertainties in dissolution rates. For each duplicate and each dissolution time, separate tubes were used, resulting in a total of 72 individual tubes.
Solution aliquots (15 mL) were removed from each tube using a sterile 60 mL syringe (SOP, Appendix 1). Care was taken to minimize suspension of sediments within the tube. Each aliquot was passed through a 0.45 µm pore size nylon syringe filter into a polypropylene tube (SOP, Appendix 1). The tubes were then sealed and refrigerated at 4° C until the time of analysis. The solutions from the batch dissolution experiments and groundwater from the Lesirway well head were analyzed for fluoride (F-) and chloride (Cl-) using a Dionex ICS-2100 ion chromatograph following the methods of Welch et al. (1996). Phosphate (as phosphorus) and dissolved silica concentrations were determined using a Skalar San++ Continuous Flow Analyzer using the molybdate blue analysis methods provided by the manufacturer.
Time series of fluoride and other analyte concentrations produced by the batch dissolution experiments were plotted. For the one hour and two week dissolution times, the released fluoride mass from each solid sample was calculated from the produced fluoride concentrations and normalized by the dry mass of sample. Sample mass, water volume, and fluoride concentrations of duplicate runs were averaged for this calculation. Concentrations of fluoride were plotted against chloride, silica, and phosphate concentrations. For the chloride versus fluoride plot, chloride and fluoride concentrations found in the Marwa groundwater, hydrothermal springs from Kenya, and seawater were also plotted for comparison. Ratios of chloride to fluoride, silica to fluoride, and phosphate to fluoride were also calculated and plotted as a time series.
7
4. Results and Discussion
4.1 Fluoride Distribution in the Singida Region
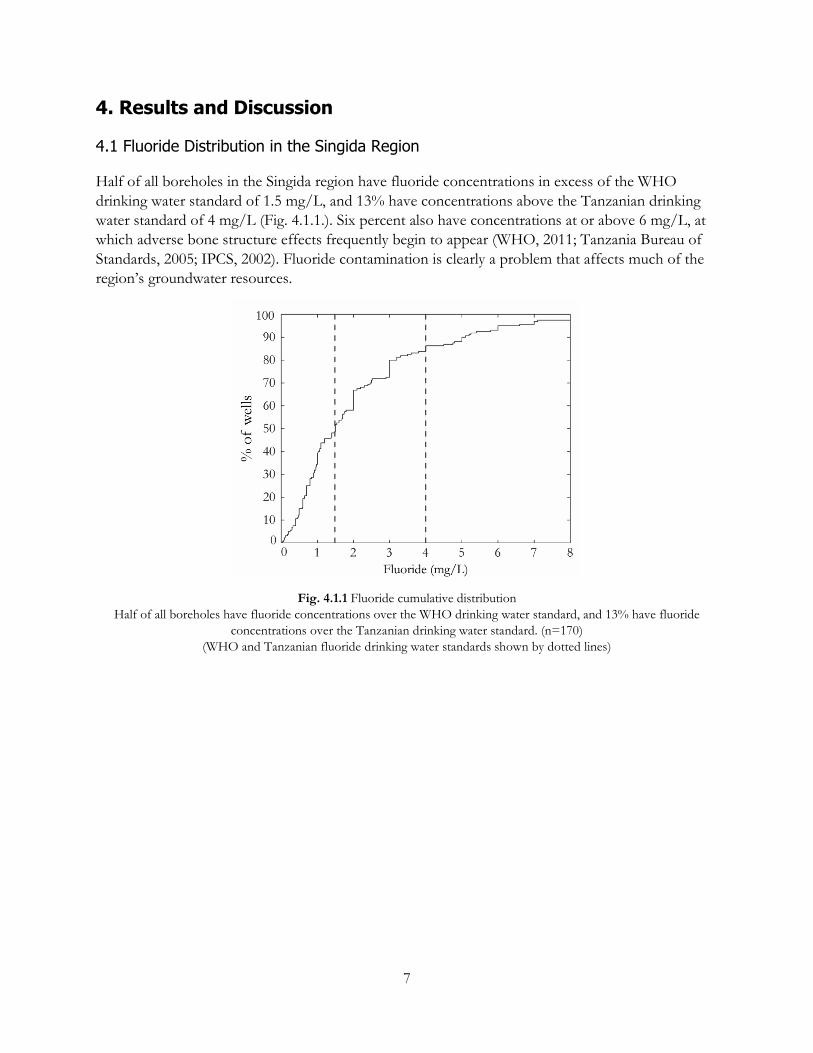
Half of all boreholes in the Singida region have fluoride concentrations in excess of the WHO drinking water standard of 1.5 mg/L, and 13% have concentrations above the Tanzanian drinking water standard of 4 mg/L (Fig. 4.1.1.). Six percent also have concentrations at or above 6 mg/L, at which adverse bone structure effects frequently begin to appear (WHO, 2011; Tanzania Bureau of Standards, 2005; IPCS, 2002). Fluoride contamination is clearly a problem that affects much of the region’s groundwater resources.
Fig. 4.1.1 Fluoride cumulative distribution
Half of all boreholes have fluoride concentrations over the WHO drinking water standard, and 13% have fluoride concentrations over the Tanzanian drinking water standard. (n=170)
(WHO and Tanzanian fluoride drinking water standards shown by dotted lines)
8
Fig. 4.1.2. Map of lithology and fluoride The control of lithology on fluoride can be clearly observed. 76% of wells with elevated fluoride are drilled in the
Kavirondian-Nyanzian Supergroup (lithology data from the Geological Survey of Tanzania, 2018).
Borehole distribution roughly mimics the population distribution, with most wells located near the region’s capital city, Singida City (Fig. 4.1.2.). Many of the wells in and around the city have elevated fluoride concentrations. These wells are predominantly located in granitoids and migmatites of the Kavirondian-Nyanzian Supergroup. Across the region, a clear relationship exists between fluoride concentrations and the lithology of the aquifer (Table 4.1.3.). A majority (67.2%) of the wells drilled in granitoids, migmatites, and meta-sediments of the Kavirondian-Nyanzian Supergroup have elevated fluoride. In contrast, only 18.5% of wells drilled in granites, migmatites, and gneisses of the Dodoman and Isangan Group have elevated fluoride. A lack of boreholes drilled in the other lithologies make risk assessment uncertain. Only two wells in the dataset are located in lacustrine sediments and evaporites, but these wells have some of the highest concentrations of fluoride
9
observed in the region. Fluoride is likely concentrated in those areas by evaporation (Edmunds and Smedley, 2005).
Table 4.1.3. Elevated fluoride distribution by lithology In the two most frequently drilled lithologies, 67% of boreholes in the Kavirondian-Nyanzian Supergroup have elevated
fluoride and 18% of boreholes in the Dodoman and Isangan Group have elevated fluoride. Lithology Number of
*this group contains wells that were located within one lithologic unit on the map, but were recorded as not encountering that type of rock
10
Fig. 4.1.4. Map of geologic features and fluoride
No strong correlations were observed between fluoride and elevation or distance to features such as lakes, hot springs, and faults.
No strong correlations were observed between fluoride concentration and well depth, depth to water, elevation, or distance to faults, lakes, and hot springs (Table 4.1.5.). However, maps of faults and hot springs may be incomplete, and stronger correlations may emerge with a more complete dataset. Cross-plots (not shown) were created to explore whether any non-linear relationships might exist between fluoride concentrations and each parameter, but no clear relationships were evident.
11
Table 4.1.5. Correlation matrix of geologic parameters No strong correlations were observed, but lithologies were combined in this analysis due to a lack of data points.
Correlation: R Significance: (p)
Fluoride Well Depth
Depth to Water
Elevation Distance to Faults
Distance to Lakes
Distance to Hot Springs
Fluoride 1
Well Depth -0.22 (0.01)
1
Depth to Water -0.28 (>0.01)
0.27 (>0.01)
1
Elevation 0.20 (0.03)
-0.11 (0.01)
-0.34 (>0.01)
1
Distance to Faults -0.09 (0.35)
-0.03 (0.53)
-0.18 (>0.01)
0.10 (0.01)
1
Distance to Lakes -0.41 (>0.01)
0.15 (>0.01)
0.19 (>0.01)
-0.10 (0.01)
0.06 (0.13)
1
Distance to Hot Springs
>0.01 (0.97)
0.02 (0.63)
-0.18 (>0.01)
0 .35 (>.001)
0.24 (>0.01)
0.43 (>0.01)
1
Fig. 4.1.6. Fluoride spatial variability The correlation between fluoride concentrations for close boreholes (such as those separated by 10-15 km) was similar
to the correlation at longer distances (such as those separated by more than 100 km).
Semivariograms describe the correlation between two values at a range of distances, and lower semivariance values indicate higher spatial correlation (Deutsch and Journel, 1997). Figure 4.1.6. shows some correlation in fluoride concentrations between close wells separated by less than 10 km, but the correlation no longer varies with distance over longer separation distances. Boreholes at typical separations (>10 km) can have dramatically different fluoride concentrations, and fluoride concentrations at one borehole are not generally useful for predicting fluoride concentrations at other borehole locations. Wells separated by only a few kilometers (within the same village) may
12
display a higher degree of spatial correlation, but this dataset does not have sufficiently high resolution to resolve spatial correlations at small scales (<5 km).
Many aquifers in the region are in fractured bedrock (British Geological Survey, 2000), and fracture systems may contribute to strong heterogeneity over short and long distances. Fracture systems can be well connected or isolated, and fluoride may be concentrated in isolated fracture systems through evaporation or dissolution of minerals. Conversely, in well-connected systems, water containing high fluoride may be transported over long distances. The interconnectedness of fractures in the region is not known; but is likely an important influence on fluoride concentrations over small distances.
Fig 4.1.7. Depth to water cumulative distribution (does not include dry wells). 85% of wells encounter water before 30 m, and 96% of wells encounter water before 50 m
(n=835)
The fracture systems are also likely the cause of dry boreholes. Ten percent of the boreholes in the dataset are recorded as being dry, and another six percent of wells have been abandoned for various reasons, such as being saline. Because dry and abandoned boreholes are less likely to be recorded, the actual frequency of dry boreholes is likely higher than this dataset reflects. Some dry boreholes are drilled within 5 km of water-producing boreholes. If a borehole does not intersect a fracture system, it is unlikely to be very productive, and may be completely dry. Many villages attempt to drill multiple boreholes before striking water. It may be difficult to determine whether any given borehole location will encounter water without detailed fracture maps. Mapping fracture systems using aerial or satellite photos may be a cost-effective solution for improving the chance of encountering water while drilling (Lattman and Parizek, 1964).
In the absence of fracture information, it may be possible to improve drilling decisions based on the statistics in this dataset. 85% of recorded wells that do encounter water do so before 30 m, and 96% encounter water before 50 m (Fig 4.1.7.). Conversely, dry boreholes are drilled to an average depth of 76 meters, and 20% of dry boreholes are drilled deeper than 100 meters. Therefore, abandoning wells that have not encountered water by 50 meters could potentially decrease the cost and amount of drilling time required to find water.
13
4.2 Marwa Village Dissolution Experiments
Fig. 4.2.1. Dissolution behavior Concentrations of all analytes increased over time, but the Njakitai and Lesirway well head soils released more fluoride than the other samples. Relatively large amounts of fluoride, silica, and phosphate are freely available (after only 1 hour) in the well head soils.
Goundwater from the Lesirway well had a fluoride concentration of 5.2 mg/L. This concentration was from a sample taken from 2017 and is greater than the concentration of 3.47 mg/L measured in 2009 at the Arusha National Water Lab (Goeller, 2017). This exceeds the Tanzanian drinking water standard of 4 mg/L. In soil samples, fluoride generally increased with time, but the Njakitai well head soil produced much greater concentrations of fluoride than the other samples (1.1 mg/L after 2 weeks)( Fig. 4.2.1.). The Njakitai well head soil also produced fluoride concentrations of 0.45 mg/L after only 1 hour. No detectable amount of fluoride was present in the controls.
14
Table 4.2.2. Freely available fluoride Units of micrograms of fluoride per gram of solid
Sample Type 1 hour 2 weeks
Njakitai well head soil 7.22 17.41
Crushed bedrock (Njakitai) 1.26 0.97
Lesirway well head soil 1.46 3.48
Lesirway floodplain soil 0.87 1.33
The soil from the Njakitai well head contained the most freely available fluoride (7.22 µg/g after 1 hour) and produced the most fluoride after two weeks (17.41 µg/g). With relatively high amounts of freely available fluoride, local soils such as the Njakitai well head soil likely contribute to the elevated fluoride found in the groundwater by releasing fluoride to infiltrating water that recharges the aquifer. The observed decrease in fluoride concentrations at two weeks in the Njakitai and Lesirway well head soils may be the result of precipitation of fluorite. This can occur when calcium concentrations increase during the dissolution of calcium-bearing plagioclase (Chae et al., 2006) or other minerals. The bedrock and all the soil samples were observed to contain plagioclase (Section 4.3), but the elemental compositions of the plagioclase were not able to be determined.
The well head soils also released the most chloride, while minimal chloride was released from the rock sample and the Lesirway floodplain soil (Fig. 4.2.1.). The soil surrounding the Njakitai and Lesirway well heads produced chloride concentrations of around 2 mg/L after 2 weeks. For comparison, the groundwater from the Lesirway well contained chloride concentrations of 311 mg/L, which is around the concentration where a salty taste becomes detectable in water (WHO, 2011). The Njakitai well was not in operation but has been reported to contain even higher chloride concentrations than those found in the Lesirway well, rendering the water unusable to the Njakitai subvillage (Goeller, 2017). The soils from the Lesirway and Njakitai well heads produced much lower chloride concentrations than was found in the groundwater, and are not likely to be a major source of chloride to the groundwater.
In all samples, dissolved silica increased with time (Fig. 4.2.1). The steady increase indicates that dissolution of silicate minerals occurred. Despite similar mineralogies (Section 4.3), the Lesirway well head soil produced much more silica than the Njakitai well head soil. The Njakitai well head soil is visually finer grained than those from the Lesirway well head, so the difference is unlikely to be due to a difference in grain size but rather other factors that influence silica mobility and solubility. The Lesirway floodplain soil and crushed rock samples produced less silica than the well head soils. Groundwater from the Lesirway well contained 33.3 mg/L silica, greater than any concentration produced in the batch experiments.
Phosphate concentrations for all samples increased over time (Fig. 4.2.1.). Samples of the crushed bedrock and control contained concentrations too low to be detected (>0.01 mg/L). The Lesirway well head soil and the Njakitai well head soil produced a similar amount of phosphate (around 1 mg/L over two weeks). Groundwater from the Lesirway well had phosphate concentrations of 0.029 mg/L. It is known that phosphate does not easily migrate from soils to groundwater (Mabilde
15
et al.,2017; Sawhney, 1978), and this may explain why the phosphate levels in the soils are much higher than those in the groundwater. It is also possible that the higher amounts of phosphate in the soils around well heads are biologic in origin and could be due to livestock watering in the well head vicinity, but this was not directly observed during sampling in 2017.
The fluoride, chloride, and phosphate concentrations present in the groundwater are all greater than those produced by dissolution of the bedrock. However, bedrock could produce greater concentrations over longer dissolution timescales as found in natural aquifers. It is also possible that the rock sample used in this experiment is not an accurate representation of the aquifer lithology, but the rock sample was broken off a local outcrop and matches regional lithology descriptions (Geological Survey of Tanzania, 2018), so this explanation is unlikely. The total amount of rock used was small (<100 g) and may not contain minerals present elsewhere in the unit, particularly in fractures that host large flow rates and have likely experienced a higher degree of rock-water interactions. It is possible that some of the fluoride present in the Lesirway and Njakitai well head soils could have come from spilled and evaporated groundwater around the well head. If this were the case, the soils would be expected to have similar chloride to fluoride ratios as the groundwater, but this was not observed (Fig. 4.2.3.).
Fig. 4.2.3. Fluoride ratios at 2 weeks Water from the dissolution experiments, groundwater, and water from hydrothermal springs are all highly enriched in fluoride relative to seawater. The line on the fluoride vs chloride plot represents the range of expected ratios if marine aerosols were the dominant source of fluoride. (Hydrothermal spring concentrations from Tarits et al., 2006. Seawater concentrations from Pilson, 2013)
16
Chloride to fluoride ratios found in the groundwater are much more similar to ratios found in waters from hydrothermal springs than those produced by the dissolution of the local soils and rock (Fig. 4.2.3.). This suggests that there may be some influence of the Marwa groundwater from hydrothermal sources. This difference in chloride to fluoride ratios indicate that the bedrock is not likely a primary contributor of fluoride to the groundwater. Ratios associated with the groundwater also greatly exceed those found in marine aerosols (Fig. 4.2.3.) (Pilson, 2013). Evaporative concentration cannot explain the observed differences in ratios between groundwater and marine aerosols because the groundwater is greatly enriched in fluoride compared to marine aerosols. In summary, soils may enrich the groundwater in fluoride, and hydrothermal sources may enrich the groundwater in both fluoride and chloride. The relative contributions of fluoride and chloride from soils and from potential hydrothermal sources are not known.
Fig. 4.2.4. Evolution of fluoride ratios Groundwater from the Lesirway well had a chloride to fluoride ratio of 59.5 and a silica to fluoride ratio of 6.3. Silica to fluoride ratios diverge from groundwater values over time, therefore dissolution of silicate minerals is not likely a major source of fluoride to groundwater.
Chloride to fluoride ratios in the well head samples, which produced the most fluoride, decreased over time, while the crushed rock exhibited a steady increase in chloride to fluoride ratios (Fig. 4.2.4). Silica to fluoride ratios generally increase over time, and appear to diverge from the ratio of 6.3 found in the groundwater. This suggests that dissolution of silicate minerals is not a major contributor of fluoride to groundwater. Although the silica to fluoride ratios found in the Njakitai well head soils stay relatively constant over time and are close to those of the groundwater, the high amounts of fluoride and silica present at short times (1h) cannot be explained by the dissolution of silicate minerals alone. Despite similar mineralogical compositions of all three soils (Section 4.3), the silica to fluoride ratio evolution varies widely between the soils. This also suggests that dissolution of silicate minerals is not a major source of fluoride to the groundwater.
17
4.3 Marwa Village Rock and Soil Mineralogy The rock sample (Figure 4.3.1) is a granitoid that consists mainly of large grains of white perthitic plagioclase feldspar, interlaced with wormy veins of smaller clear quartz and clusters of unidentified, sub-microscopic minerals along vein walls. Quartz is restricted entirely to within veins. Small amounts of myrmekite can be found along vein boundaries. Composition of the plagioclase could not be determined using the Michel-Lévy method due to the lack of grains with intact twinning.
The soil sample from the well head in the subvillage of Njakitai is dark orange and is made up mostly of silt and fine sand-sized grains. A thick orange coating surrounds most of the grains. Quartz and plagioclase feldspar grains dominate, but pyroxene, amphibole, and biotite fragments are common. Garnet fragments and opaque minerals are also found in smaller quantities.
The soil sample from the well head in the subvillage of Lesirway is dark brown with silt to medium sand-sized grains. A thin orange coating covers all but the largest grains. Quartz and plagioclase feldspars are the most common minerals present, but there are also abundant garnet fragments. Pyroxene, amphibole, and biotite are common. A few unidentified opaque minerals are also present.
The soil sample from the floodplain near the subvillage of Lesirway is tan with grain size ranging from fine to coarse sand. A very thin orange coating covers some of the grains. Quartz and plagioclase feldspar make up the majority of the grains, and garnet, pyroxene, amphibole, and large flecks of biotite are common. Opaque minerals are found in lesser amounts.
The coatings found in the soils are dark orange in color, and likely contains a mix of clays and iron-bearing minerals such as goethite or other iron oxides. Because the floodplain soils have less coating than the other soil samples, the coating is presumed to be water-soluble, and has likely been dissolved during flood events. The coating is also likely the source of observed orange staining of the water during dissolution experiments. A very thin layer of this coating was present on the exterior of the rock sample during crushing.
Of the common fluorine-bearing minerals, only biotite and amphibole were observed. However, variations in the amounts of biotite among samples do not appear to exert a strong control on the production of fluoride, as the Lesirway floodplain soil contained abundant large flecks of biotite but did not produce nearly as much fluoride as the Njakitai well head soil. Similarly, variations in amphibole did not correlate well with released fluoride concentrations.
The coating present around soil grains may contain some amount of fluoride. Clays are known to adsorb and store fluoride in soils (Fuge, 2019; Reilly et al., 2009) and probably exist in the coating. The Njakitai well head soil contained far more coating than the other samples, and also had the most freely available fluoride of all the samples. The Lesirway well head soil had less of the coating, and produced less fluoride than the Njakitai well head soil. However, the Lesirway well head soil still had much more freely available fluoride than the Lesirway floodplain soil and rock samples, which contained negligible amounts of the coating. It is therefore likely that most of the fluoride released from the soils is sorbed to clays or other sub-microscopic minerals in the coating and may be rapidly released upon contact with water.
18
Fig. 4.3.1. Rock and soil thin sections
19
5. Conclusions Fluoride contamination of groundwater is widespread in the Singida region, and half of all boreholes exceed the World Health Organization drinking water standard for fluoride.
Regionally, fluoride concentrations are controlled by lithology. The migmatites and granitoids of the Kavirondian-Nyanzian Supergroup are likely the dominant source of fluoride in the Singida region. No significant correlations were observed between fluoride concentrations and geologic features such as lakes, faults, or hot springs. While it would not be practical to avoid drilling altogether in these areas, boreholes drilled within these rocks should be regularly tested for fluoride.
Statistical analysis of the Singida borehole dataset also showed that dry boreholes are often drilled to great depths before abandonment, although 96% of wells that do encounter water do so before 50 meters. In the future, it is recommended that drillers abandon wells by 50 meters if water has not yet been encountered to reduce drilling time and costs. Fracture trace analysis could also improve the likelihood of drilling productive wells, since fracture systems are the primary water-bearing features in the crystalline bedrock aquifers in the area.
Dissolution experiments show that soils can contain high amounts of freely available fluoride. Soils may be a source of significant fluoride to groundwater during recharge events when infiltrating water interacts with soils. However, chloride to fluoride ratios produced by soils and bedrock are significantly lower than the groundwater, suggesting another source such as hydrothermal water Marine aerosols are not a significant source of fluoride or chloride. Silicate minerals are not likely to contribute much fluoride to groundwater, although fluoride bearing minerals not found in the bedrock of Marwa may be present in the bedrock of other fluoride contaminated areas like the Singida region.
6. Recommendations for Future Work Batch dissolution experiments are a promising approach for assessing fluoride sources to groundwater in the Singida region. In anticipation of procuring more samples from the Singida region and performing similar batch dissolution experiments, a standard operating procedure for the experiments has been prepared and can be found in the appendix. It is likely that patterns not seen in this study will emerge with a larger or more comprehensive set of samples that includes borehole cuttings. Further research will doubtlessly be beneficial towards future groundwater development in Tanzania.
Precipitation of fluorite or other minerals may affect the mobility of fluoride, chloride, or other ions in the hydrological system. During future studies, testing for calcium, iron, and other potentially influential ions may help to illuminate how fluoride behaves in the complex chemical environment of soils.
Fracture mapping using aerial or satellite photos holds promise for decreasing the chance of drilling a dry borehole. Fracture maps may also shed some light on the nature of groundwater movement in the area, which is currently poorly understood.
20
7. References Ali, S., Thakur, S.K., Sarkar, A., Shekhar, S., 2016, Worldwide contamination of water by fluoride, Environ Chem Lett. v. 14, p. 291-315, doi: 10.1007/s10311-016-0563-5
British Geological Survey, 2000, Groundwater Quality: Tanzania [Fact Sheet], 4 p., https://www.bgs.ac.uk/downloads/start.cfm?id=1291
Chae, G. T., Yun, S. T., Kwon M.J., Kim Y. S., and Mayer, B., 2006, Batch dissolution of granite and biotite in water: Implication for fluorine geochemistry in groundwater: Geochemical Journal, v. 40, p. 95-102, doi: 10.2343/geochemj.40.95
Deutsch, C. V., and Journel, A. G., 1997, GSLIB: Geostatistical Software Library and User’s Guide, 2nd ed., Oxford University Press, 384 pg.
Edmunds, M., and P. Smedley. 2005. Fluoride in natural waters. In: O. Selinus et al., eds., Essentials of Medical Geology: Impacts of natural environment on public health. Elsevier Academic Press, London. p. 301–329.
Fawell, J., Bailey, K., Chilton, J., Dahi, E., Fewtrell, L., Magara, Y., 2006, Fluoride in drinking-water, on behalf of the World Health Organization, Geneva, IWA Publishing, 144 p., http://www.who.int/iris/handle/10665/43514
Fuge, R.F., 2019, Fluorine in the environment, a review of its sources and geochemistry, Applied Geochemistry, v.100, p. 393-406, doi: 10.1016/j.apgeochem.2018.12.016
Geological Survey of Tanzania, 2018, Geological and Mineral Information System, http://www.gmis-tanzania.com/
Goeller, Devon, personal communication (2017)
Goeller, D. R., 2017, Investigation of water quality and availability in rural Tanzanian villages. [Senior Thesis]: The Ohio State University, 32 pg.
Hijams, R.J., Cameron, S.E., Parra, J.L., Jones, P.G., and Jarvis, A., 2005, Very high resolution interpolated climate surfaces for global land areas: International Journal of Climatology, v. 25, p. 1965-1978.
International Programme on Chemical Safety (IPCS), 2002, Fluorides, Environmental Health Criteria 227, Geneva. http://www.inchem.org/documents/ehc/ehc/ehc227.htm#1.9
Kabete, J. M., Groves, D.I., McNaughton, N.J., Mruma, A.H., 2012, A new tectonic and temporal framework for the Tanzanian Shield: Implications for gold metallogeny and undiscovered endowment, Ore Geology Reviews, v. 48, p. 88-124. doi: 10.1016/j.oregeorev.2012.02.009
Kilham, P., Hecky, R.E., 1973, Fluoride: geochemical and ecological significance in East African waters and sediments, Limnology and Oceanography, v. 18(6), p. 932-945, doi: 10.4319/lo.1973.18.6.0932
Lattman, L.H., and Parizek, R.R., 1964, Relationship between fracture traces and the occurrence of ground water in carbonate rocks, Journal of Hydrology, v. 2(2). p. 73-91 doi: 10.1016/0022-1694(64)90019-8
Mabilde, L., De Neve, S., Sleutel, S., 2017, Regional analaysis of groundwater phosphate concentrations under acidic sandy soils: edaphic factors and water table strongly mediate the soil P-groundwater P relation, Journal of Environmental Management, v.203 (1), p. 429-438, doi:10.1016/j.jenvman.2017.07.058
MacDonald, A.M., Bonsor, H.C., Ó Dochartaigh, B.E., Taylor, R.G., 2012, Quantitative maps of groundwater resources in Africa: Environmental Research Letters, 7 (2), 024009. doi: 10.1088/1748-9326/7/2/024009
Macheyeki, A. S., Delvaux, D., De Batist, M., Mruma, A., 2008, Fault kinematics and tectonic stress in the seismically active Manyara–Dodoma Rift segment in Central Tanzania – Implications for the East African Rift, Journal of African Sciences, v. 51, p. 163-188. doi: 10.1016/j.jafrearsci.2008.01.007
Mseli, Z.H., Goeller, D., Scharenberg, M., Mwegoha, W. J.S., Gianotti, R., Bongiornia, D., Sawyer, A.H., In Review, Physical factors limiting access to clean groundwater in 45 Tanzania villages.
Nanyaro, J.T., Asawathanarayana, U., Mungure, J.S., Lahermo, P.W., 1984, A geochemical model for the abnormal fluoride concentrations in waters in parts of northern Tanzania, Journal of African Earth Sciences, v.2 (2), p. 129-140, doi: 10.1016/S0731-7247(84)80007-5
National Bureau of Statistics, 2013, 2012 Population and housing census: http://www.tzdpg.or.tz/fileadmin/documents/dpg_internal/dpg_working_groups_clusters/cluster_2/water/WSDP/Background_information/2012_Census_General_Report.pdf (accessed January 2019)
Padhi, S., and Muralidharan, D., 2011, Fluoride occurrence and mobilization in geo-environment of semi-arid Granite watershed in southern peninsular India: Environmental Earth Sciences, v. 66, p. 471-479, doi:10.1007/s12665-011-1255-x.
Pickering, W. F., 1985, The mobility of soluble fluoride in soils. Environmental Pollutution Series B, v. 9(4), p. 281–308. doi:10.1016/0143-148X(85)90004-7
Pilson, M. E. Q., 2013, An introduction to the chemistry of the sea, 2nd ed., Cambridge University Press, 466 pg.
Rao, N.S., Devadas, D.J., 2003, Fluoride incidence in groundwater in an area of Peninsular India, Environmental Geology, v. 45, p. 243-251, doi: 10.1007/s00254-003-0873-3
Reilly, T. J., Fishman, N.S., Baehr, A.L., 2009, Effect of grain-coating mineralogy on nitrate and sulfate storage in the unsaturated zone, Vadose Zone Journal, v. 8(1), p. 75-85, doi:10.2136/vzj2008.0053
Sawhney, B.L., 1978, Leaching of phosphate from agricultural soils to groundwater, Water, Air, and Soil Pollution, v.9 (4), p. 499-505, doi: 10.1007/BF00213545
Tarits, C., Renaut, R. W., Tiercelin, J., Hérissé, A., et al., 2006, Geochemical evidence of hydrothermal recharge in Lake Baringo, central Kenya Rift Valley, Hydrological Processes, v. 20 (9), p. 2027-2055, doi: 10.1002/HYP.6046
Tanzania Bureau of Standards, 2005, National environmental standards compendium, p. 30, http://www.tzdpg.or.tz/fileadmin/documents/dpg_internal/dpg_working_groups_clusters/cross_cutting_groups/environment_and_natural_resources/Resources/Sector_Documents_-_Government_of_Tanzania/National_Environmental_Standards_Compendium.pdf
UNICEF/Skat Foundation (2016) Professional Water Well Drilling: A UNICEF Guidance Note, Cost Effective Boreholes Partnership of the Rural Water Supply Network by UNICEF and Skat Foundation
U.S. Public Health Service, 2015, U.S. Public Health Service recommendation for fluoride concentration in drinking water for the prevention of dental caries: Public Health Reports, v. 130(4), p. 318-331, doi: 10.1177/003335491513000408
Welch, K., Lyons, W., Graham, E., Neumann, J., Thomas, J., Mikesell, D., 1996, Determination of major element chemistry in terrestrial waters form Antarctica by ion chromatography, Journal of Chromatography A, v. 739 (1), p. 256-263.
World Health Organization (WHO), 2011, Guidelines for drinking-water quality, 4th ed., Geneva
Zhu, Y., Zhang, X., Chen, Y., Xie, Q., Lan, J., Qian, M., He. N., 2009, A comparative study on the dissolution and solubility of hydroxylapatite and fluorapatite at 25 °C and 45 °C: Chemical Geology, v. 268, p. 89-96, doi: 10.1016/j.chemgeo.2009.07.014
8.1 Batch Dissolution Experiment Standard Operating Procedure Used to examine dissolution kinetics of soils or rocks. This method produces solutions which can be analyzed for various ions and dissolved material using a variety of techniques, including Ion Chromatography and Skalar Nutrient Analysis.
Supplies:
Mortar and Pestle or other rock crushing apparatus Polystyrene weighing boats MilliQ deionized water (18MΩ) 45 mL sterile polypropylene Falcon ® centrifuge tubes with screw-on cap (called “dissolution tube” or “tube” below) and tube holders 60 mL sterile polypropylene syringes Sterile plastic tubing (make sure it fits snugly on the end of the syringes) 0.45 µm pore size syringe filters
Rock and Soil Procedures:
1. Wrap rock samples in a towel and use a rock hammer to break the rock into small pieces about 1-2 cm in diameter. (If samples are soil, proceed to step 3.)
2. Use a mortar and pestle (or other rock crusher) to crush the rock until it passes through a 1 mm screen and return the captured fraction to the grinding apparatus for further grain size reduction.
3. Spread out (<1 cm thick) each sample (either rock or soil) in individual polystyrene weighing boats to air dry for two weeks at room temperature (22° C)
Reaction Tube Procedures:
4. Affix the reaction tube upright on an analytical scale and tare the scale. 5. Using a metal scoopula, add 2.50 grams of sample to the dissolution tube and record the
mass of sample added. 6. Repeat steps 4-5 for all samples. Create duplicates for each sample type. 7. Tare the scale with both the sample and dissolution tube. 8. Measure 40 mL of MilliQ water in a graduated cylinder. 9. Pour the water into the dissolution tube and record the mass of the added water. 10. Seal the dissolution tube tightly with the cap and shake vigorously for ten seconds. Then
set aside in a tube rack. 11. Repeat steps 7-11 for all samples. 12. Create a filter blank using only MilliQ water following steps 7-10. 13. Allow the dissolution tubes to soak at 22° C for durations of 1h, 2h, 4h, 12h, 1d, 2d,
1wk, 2wk. Label tubes as desired. It is recommended to prepare tubes in batches based
24
on dissolution duration. (Store in a location where the reaction tubes will not be disturbed such as a high shelf.)
Sample Extraction Procedures:
14. Cut 5 cm lengths of clear sterile plastic tubing and affix to the end of a 60 mL syringe. 15. Uncap a new tube and set upright in a holder. 16. Remove the cap from the dissolution tube and set upright in the holder. (Take care not
to disturb the reaction tubes to prevent re-suspension of the sample.) 17. Using the syringe, remove approximately 15 mL of water from the dissolution tube,
taking care not to disturb the sediment at the bottom. (Plastic tubing and syringes may be re-used between duplicate samples. To accomplish this, in step 16, shake out any remaining water in the plastic tube and syringe, then extract a small volume of water from the reaction tube and shake the syringe gently to wash out the previous sample. Discard the wash water, then proceed with step 16 as normal.)
18. Remove the plastic tubing from the syringe and squeeze any air out of the syringe. Attach a .45 µm pore size syringe filter to the syringe and squeeze the sample through the filter into the waiting new tube.
19. Seal the new tube and refrigerate the extracted solution until the time of analysis. The remaining sediment and solution in the reaction tube can be discarded.
20. Repeat steps 14-18 for all dissolution tubes and filter blanks, ensuring that the sample extraction order is the same as the reaction tube preparation order to maintain proper timing, especially at short dissolution durations (1h, 2h)
25
8.2 Additional Figures and Tables Table 8.2.1 Chemical Analysis Results Values of 0 represent values too small to be detected. Phosphate was measured as phosphorus.
Sample type # Time (hours)
Chloride (mg/L)
Fluoride (mg/L)
Phosphate (mg/L)
Silica (mg/L)
Crushed Bedrock 1 1 0.382 0.079 0.007 0.068 Crushed Bedrock 1 2 0.351 0.067 0.005 0.064 Crushed Bedrock 1 4 0.472 0.061 0.007 0.093 Crushed Bedrock 1 12 0.499 0.065 0.011 0.182 Crushed Bedrock 1 24 0.533 0.072 0.008 0.161 Crushed Bedrock 1 48 0.561 0.056 0.000 0.297 Crushed Bedrock 1 168 0.610 0.071 0.000 1.472 Crushed Bedrock 1 336 0.871 0.055 0.000 2.060 Crushed Bedrock 2 1 0.395 0.080 0.007 0.064 Crushed Bedrock 2 2 0.394 0.067 0.006 0.078 Crushed Bedrock 2 4 0.422 0.073 0.006 0.075 Crushed Bedrock 2 12 0.487 0.066 0.012 0.199 Crushed Bedrock 2 24 0.528 0.082 0.009 0.239 Crushed Bedrock 2 48 0.579 0.060 0.000 0.353 Crushed Bedrock 2 168 0.626 0.063 0.000 0.990 Crushed Bedrock 2 336 0.875 0.067 0.000 2.152 Lesirway well head soil 1 1 1.454 0.091 0.435 2.297 Lesirway well head soil 1 2 1.633 0.090 0.399 2.081 Lesirway well head soil 1 4 1.818 0.088 0.403 1.949 Lesirway well head soil 1 12 1.839 0.112 0.525 3.683 Lesirway well head soil 1 24 1.954 0.096 0.396 2.025 Lesirway well head soil 1 48 2.171 0.139 0.456 3.206 Lesirway well head soil 1 168 2.271 0.270 0.584 5.030 Lesirway well head soil 1 336 1.733 0.212 0.945 10.185 Lesirway well head soil 2 1 1.417 0.093 0.436 2.409 Lesirway well head soil 2 2 1.511 0.088 0.384 1.955 Lesirway well head soil 2 4 1.996 0.094 0.454 2.668 Lesirway well head soil 2 12 1.923 0.111 0.534 3.832 Lesirway well head soil 2 24 2.014 0.099 0.426 2.674 Lesirway well head soil 2 48 2.241 0.142 0.464 3.413 Lesirway well head soil 2 168 2.346 0.322 0.688 6.139 Lesirway well head soil 2 336 1.771 0.226 0.918 9.982
26
Table 8.2.1 Chemical Analysis Results (continued)
Sample type # Time (hours)
Chloride (mg/L)
Fluoride (mg/L)
Phosphate (mg/L)
Silica (mg/L)
Lesirway floodplain soil 1 1 0.243 0.055 0.015 0.333 Lesirway floodplain soil 1 2 0.234 0.054 0.015 0.346 Lesirway floodplain soil 1 4 0.258 0.054 0.017 0.502 Lesirway floodplain soil 1 12 0.258 0.058 0.029 0.968 Lesirway floodplain soil 1 24 0.270 0.059 0.018 0.997 Lesirway floodplain soil 1 48 0.289 0.083 0.011 1.084 Lesirway floodplain soil 1 168 0.288 0.073 0.046 2.073 Lesirway floodplain soil 1 336 0.679 0.089 0.067 2.813 Lesirway floodplain soil 2 1 0.236 0.055 0.017 0.387 Lesirway floodplain soil 2 2 0.236 0.055 0.016 0.386 Lesirway floodplain soil 2 4 0.255 0.055 0.017 0.388 Lesirway floodplain soil 2 12 0.248 0.056 0.022 0.610 Lesirway floodplain soil 2 24 0.287 0.061 0.016 1.138 Lesirway floodplain soil 2 48 0.310 0.078 0.010 0.951 Lesirway floodplain soil 2 168 0.256 0.068 0.053 2.132 Lesirway floodplain soil 2 336 0.668 0.078 0.061 2.955 Njakitai well head soil 1 1 1.275 0.451 0.506 1.644 Njakitai well head soil 1 2 1.432 0.345 0.445 1.528 Njakitai well head soil 1 4 1.531 0.389 0.499 2.018 Njakitai well head soil 1 12 2.968 0.508 0.691 2.620 Njakitai well head soil 1 24 1.924 0.460 0.453 1.858 Njakitai well head soil 1 48 1.666 0.660 0.523 2.247 Njakitai well head soil 1 168 1.628 1.213 0.806 3.113 Njakitai well head soil 1 336 1.506 1.113 1.191 4.838 Njakitai well head soil 2 1 1.243 0.458 0.509 1.659 Njakitai well head soil 2 2 1.789 0.484 0.630 2.089 Njakitai well head soil 2 4 1.350 0.326 0.438 1.568 Njakitai well head soil 2 12 1.588 0.530 0.711 2.605 Njakitai well head soil 2 24 1.379 0.331 0.416 1.644 Njakitai well head soil 2 48 1.707 0.939 0.709 2.848 Njakitai well head soil 2 168 1.777 1.271 0.888 3.568 Njakitai well head soil 2 336 1.456 1.077 1.188 5.164 Groundwater (Lesirway well)
311.499 5.230 0.029 33.342
27
Fig. 8.2.2. Phosphate vs fluoride (2 week) Phosphate concentrations in the crushed bedrock were below the detection limit
Fig. 8.2.3. Phosphate to fluoride ratios over time