Page 1
Maria Lígia Chuerubim
Federal University of Uberlândia - São Carlos School of Engineering
[email protected]
Spatial and temporal identification of community structures of road accidents through homogeneous complex networks and measures of
centrality
Alan Valejo
São Carlos School of Engineering
[email protected]
Irineu da Silva
São Carlos School of Engineering
[email protected]
704
Page 2
8º CONGRESSO LUSO-BRASILEIRO PARA O PLANEAMENTO URBANO, REGIONAL, INTEGRADO E SUSTENTÁVEL (PLURIS 2018) Cidades e Territórios - Desenvolvimento, atratividade e novos desafios
Coimbra – Portugal, 24, 25 e 26 de outubro de 2018
SPATIAL AND TEMPORAL IDENTIFICATION OF GROUPING STRUCTURES
OF ROAD ACCIDENTS THROUGH HOMOGENEOUS COMPLEX NETWORKS
AND MEASURES OF CENTRALITY
M. L. Chuerubim, A. Valejo e I. da Silva
ABSTRACT
The investigation of road accident in space and time is essential for the development of
researches in Road Safety since it allows identifying the degree and variation of accidents
on a highway. Based on this motivation, this work analyses the four years of data collected
in a stretch of 20 km of highway, through the application of homogeneous complex networks
and measures of centrality. The results allowed to identify the main groups of accidents and
the critical points of the highway. It has been found that the approach by homogeneous
complex networks to identify groups of accidents can provide competitive results when
compared with traditional clustering techniques. As the theories of complex network have
assimilated the concepts of clustering techniques, it can be observed that neighbourhood-
based analysis consists of a refinement of the results obtained with the traditional techniques
and allows a clearer visualization of the data in the space.
1 INTRODUCTION
Brazil is a developing country characterized by a tendency to increase population density
and, consequently, the demand for urban mobility. In this scenario, the state of São Paulo,
located in the southeast region of the country, leads the ranking of the most populous states,
with 45.1 million inhabitants, concentrating 21.7% of the country's population (IBGE, 2017).
When considering the relationship between deaths and economic development, the city of
Campinas, located in the state of São Paulo, with a population of 1.098 million inhabitants
and HDI of 0.805 (2010), occupies the eighth position in the national ranking, with a rate of
19.4 deaths/100,000 inhabitants (ONSV, 2,014). These figures reinforce that traffic deaths
in Brazil should be characterized as a public health problem. Reason why researches on
traffic accidents is of high interest to the country.
Considering the territorial dimensions and regional differences of Brazil, it is verified that
the number of researches on traffic accident is still insufficient and that the study of this
phenomenon, in recent years, has been restricted to the use of traditional mathematical tools
such as statistical tests and regression analyses. However, these approaches have become
ineffective in the study of multiple and observational problems such as traffic accidents.
In this perspective, the main motivation of this work refers to the difficulty in detecting
possible natural structures of groups or communities in databases of traffic accidents, since
they comprise recurrent events, but of random order and of a heterogeneous nature.
Page 3
Specifically, it was adopted the modelling by homogeneous complex networks using
neighbourhood criteria and centrality measures, in order to detect possible patterns,
connections or temporal space interactions in individual accidents, registered in a Brazilian
highway, where there is a diversity of properties and characteristics associated with causal
factors, road infrastructure variables and climatic conditions.
The results obtained indicate the main groups of accidents and the critical points of the
highway, that is, the sections with the highest concentration of accidents. Because complex
network theory has assimilated the concepts of clustering techniques, it has been found that
neighbourhood-based analysis provides a refinement of the results obtained by traditional
clustering techniques and allows a more adequate visualization of these data in space.
Finally, the topological analysis of the data provided indications that it cannot be assumed a
priori that road accident data have natural grouping structures, since each individual accident
presents a particular set of parameters directly and indirectly recorded in the database.
This article has 6 sections, including this introduction. Section 2 presents a brief discussion
of the works found in the literature. Section 3 presents the main concepts of the technique
adopted for modelling the problem. Section 4 discuss the methodology used by the authors.
The results and final discussions are presented in section 5. Finally, the main conclusions
are described in section 6.
2 BACKGROUND
In the literature, most of the traffic engineering works explore intensively the statistical tests
t and 2 (Chang and Wang, 2006), as well as the linear regression models (Miaou and
Lum, 1993), negative binomial (Hauer, 2007), Poisson (Greibe, 2003), logistics and Probit
(Savolainen et al., 2011).
The statistical tests and the regression models are used to investigate the degree of severity
of accidents, correlating the type of injury with road and environmental characteristics.
However, many studies have demonstrated that classic statistical approaches are ineffective
in the study of multiple and observational problems such as traffic accidents. In addition,
they require prerequisites between dependent (target) and independent (predictor) variables
to be adopted a priori, otherwise they lead to illegitimate interpretations of reality, especially
in complex and dynamic universes such as in road environments (López et al., 2012).
Facing this challenge, the scientific community has been directed to the learning of data
mining techniques, with the purpose of carefully investigating the multiple factors that
contribute to traffic accident. Among these techniques are those that allow the reduction of
the dimensionality of the problem as the PCA – Principal Component Analysis and the
grouping of data based on similarities as the clustering (Hongyu et al., 2015; Zhang et al.,
1996). These techniques are indicated to the exploratory analysis and pre-processing phase
of the database. In addition, it has been also adopted, classification and forecasting
techniques based on the extraction of decision rules using binary tree structures, (López et
al., 2012; De Oña et al., 2014) and structures in networks, such as artificial neural networks,
Bayesian networks and, more recently, complex networks (Newman, 2003).
The tree structures are indicated to carry out specific analysis of a certain category of a
dependent variable in the severity of the accident, such as the driver's profile (age, sex), level
of drunkenness (high, low, medium), among others. While network-based techniques are
Page 4
used when multiple associations between the variables present in a database are necessary
to understand multi-causal effects associated with road accidents.
Neural and Bayesian networks are effective in modelling real systems such as in transport
networks including roads, railways and airports, where we represent the places and the links
the information flow of the network. However, the real world is a complex system that has
no trivial topological structure with irregular or random connection patterns, community
structure, and other statistical characteristics, which makes modelling based on traditional
graph theory insufficient and inefficient to explain its behaviour and dynamic aspects
(Barabási et al., 2002).
Complex networks, in turn, comprise a still recent approach whose resources can be applied
to almost all systems, as there are different measurement or calculation tools that allow
solving and answering specific questions and questioning certain problems. They represent,
therefore, a general, but powerful means of representing patterns, connections, or
interactions in dynamic and complex natural systems of the real world, in which one has a
diversity of properties and characteristics (Newman, 2010).
The advantage of using complex networks in the analysis of nonlinear systems, whose
variables interact with each other and exhibit both emergent and hidden relations, refers to
the fact that the vertices and edges can be labelled with additional information and through
a vast tooling mathematical, as the measures of centrality. This allows to describe in more
detail the characteristics and the distributions of the modelled system (Newman, 2010).
3 COMPLEX NETWORKS
Formally, a network R can be described by the relation ),( EVR , on what V corresponds
to the set of vertices indicated by nvvvV ,...,, 21 and E corresponds to the set of edges
or links, indicated by neeeE ,...,, 21 , (Newman, 2004a). In a network R an edge e is
defined by the relation ),|,(),(, Vuvvuuve uv , in which each edge uve , connects to at
least two vertices v and u , called end edges. The vertices v and u are neighbors or adjacent
and can be denoted by vu ~ , that is, u tending v . The number of neighbors of the vertex u
is called degree ( d ) of u , expressed algebraically by vuVvud ~|)( , (Kunegis, 2014).
In complex networks, when storing information, some considerations can be made about
the vertices and links in the modelling process. A network can be classified as multimodal
when the information is present at the vertices, multi-relational or multidimensional, when
information is present on the links (Wasserman and Faust, 1994), or heterogeneous, when
it is multimodal and multi-relational, (Han et al., 2009).
Regarding the links, one of the fundamental properties refers to the targeting (Newman,
2010; Soares and Prudêncio, 2012). Targeting indicates the type of relationship between the
vertices that make up the network. Relationships can be directional giving origin to
directional networks (oriented or digraphs), in which, for each link, one vertex acts as
transmitter and the other as receiver. When the relationship between the vertices is
reciprocal, the network is called non-directed or no oriented.
Page 5
3.1 Measures of centrality
The centrality measures are proposed with the objective of capturing the importance of
vertices and edges in a given context and incorporate concepts such as the shortest distance,
the number of smaller paths and the average degree of centrality of the vertices that make up
a network. These measures allow the identification of the most influential nodes in the
topological construction of a network. Among the most known measures of centrality are
the Degree Centrality ( DC ), the Betweenness Centrality ( BC ) and the centrality of
Closeness Centrality ( CC ), (Bao et al., 2017; Bonacich, 1987 and Newman, 2010).
The DC represents the number of vertices directly connected to a specific vertex (Bonacich,
1987). Thus, given a no directed network represented by ),( EVR , with V vertices and
E edges, its structure can be described by an adjacent matrix or matrix of relationships A
with n vertices and of dimensions nn . In this case,nnijaA
, where a refers to the
elements of the adjacent matrix and the indices i and j to the nodes or vertices belonging
to V . Then, 1, jia if the node i is connected to the node j and 0, jia otherwise. The
DC of node i is defined as the number of incident edges, as shown in Equation (1),
(Newman, 2004b):
n
j
jiaiDC
1
,)( (1)
The BC corresponds the average of the smallest paths that pass through a vertex. It is the
most used measure to explain the flow of information in road networks, because it indicates
the vertices that appear more frequently between the paths or links. In this way, the BC of
a certain vertex Rv if based on the count of the smallest paths calculated by Equation (2),
(Brandes, 2001):
Vtvs st
st vvBC
)()( (2)
Where st comprises the amount of smaller paths connecting all pairs of vertices s , v and t
V , and )(vst the number of smaller paths connecting all the pairs of vertices that pass
through v .
The CC is defined as the sum of the shortest distance from one vertex to the other vertices
of the network (Sabidussi, 1966). It corresponds to the inverse of the mean distance of the
shortest path, as shown in Equation (3), (Newman, 2010):
j
jii d
n
lvCC
,
1)( (3)
Page 6
Where il indicates the average distance between the vertices i and j , n the number of
vertices of the network and jid , corresponds to the length of the shortest path between the
vertices i and j , that is, the number of edges detected along the path. Therefore, the lower
values of CC indicate that the vertices are in the same neighbourhood or how much the
observables are similar to each other. Proximity indicates how close this vertex is to all other
vertices of the network.
4 METODOLOGY
4.1 Case study
For the study of the temporal variation of road accidents it was used a database with 2,903
road accidents occurring in the period of four years (2009 to 2012), on the Dom Pedro I
Highway (SP-065), between km 125 and km 146, in the urban sector of the Municipality of
Campinas, in the State of São Paulo, Brazil. The study was based on the application of the
technique of homogeneous complex networks.
The variables considered in the analysis were mileage, accident type (rear-end collision,
head-on collision, transverse collision, sideswipe collision, pile-up, rollover, pedestrian
collision and crash with fixed or mobile object), weather condition (dry, wet and oily),
geometry road (straight, smooth curve and sharp curve) and profile road (level, ascending,
descending).
The time selected in this study corresponds to the time interval that precedes the
implementation of traffic accident countermeasures and the construction of marginal roads
in the analysed sector. In addition, the 21 kilometres of the SP-065 were selected based on
the spatial configuration of the site, which suggests a clear traffic conflict between the flow
generated by the population living in the region or around the macro region of Campinas
with the daily traffic of vehicles of the highway.
4.2 Detection of clusters using homogeneous complex networks and measures of
centrality
The selected variables were analysed using the algorithm for the construction of
homogeneous complex networks using the algorithm k Nearest Neighbors ( NNk ),
which chooses for each iteration the k neighbors with the highest number of correlated
attributes. The NNk algorithm requires that a vertex connect to its closest neighbors, even
if some of these vertices are distant or have some dissimilarity with the neighbourhood
(Anastasiu and Karypis, 2015). Therefore, it is interesting that in addition to the construction
of the networks, the properties associated to network centrality measures, such as degree of
centrality, betweenness and closeness of centrality were also verified. Based on this, one can
identify the communities obtained by the algorithm NNk , which correspond to sub-graphs
that are densely connected internally and with few external connections, and then, depending
on these measurements and the frequency of occurrence of observations at each vertex, refine
the results and obtain structures of more homogeneous communities.
The centrality measures used in this work were carried out with the help of the IGraph
library, available in the Python language, which presents the state of the art in algorithms
Page 7
based on metrics for analysis of graphs, complex networks and community structures (Csárdi
and Nepusz, 2006).
In this work, it was adopted networks with 12k vertices. since for 12k vertices it has
been obtained disjointed networks with the formation of isolated communities. For 12k
vertices it was not identified any significant changes in the network. Therefore, for 12k
it was obtained smoother and uniform networks, with a tendency to generate as many
communities as existing classes. Scenarios were generated with 2 to 6 communities to obtain
homogeneous structures of accidents with maximum heterogeneity among them.
Communities were broken down by acronym iC , on what C indicates community and i
refers to the community index.
5 EXPERIMENTS AND ANALYSIS OF RESULTS
For the year 2009, considering the homogeneity of each community and the maximum
heterogeneity among the community structures generated, it was verified that the results
suggest that the algorithm NNk with 12k converge for the year 2009 with four
communities )( 41iC . The 1C concentrates 30% of data, the 2C 10% of the observables, the
3C and the 4C , respectively, 40% and 20% of total of the occurrences.
In order to validate the results and verify the optimal convergence it was analysed the
frequency of occurrence of the observations in each km for the database of the year 2009, as
shown in Figure 1.
Fig. 1 Homogenous segments obtained for the year 2009.
In the optimal scenario formed by 41iC (Figure 1) for the year 2009, the critical points in the
1C were from km 144 to km 146, in the 2C from km 125 to km 131, in the 3C the kilometres
128 and 138 and in the 4C the kilometres 129, 132 and 136. The scenario with 41iC resulted,
in general, in communities with lower closeness values (0.2 to 0.39), fewer high betweenness
(0.57 to 0.87), and more homogeneous degree distribution (13 to 41).
0%
20%
40%
60%
80%
100%
125
126
127
128
129
130
131
132
133
134
135
136
137
138
139
140
141
142
143
144
145
146
To
tal ac
ciden
ts (
%)
Kilometerk1 k2 k3 k4
Page 8
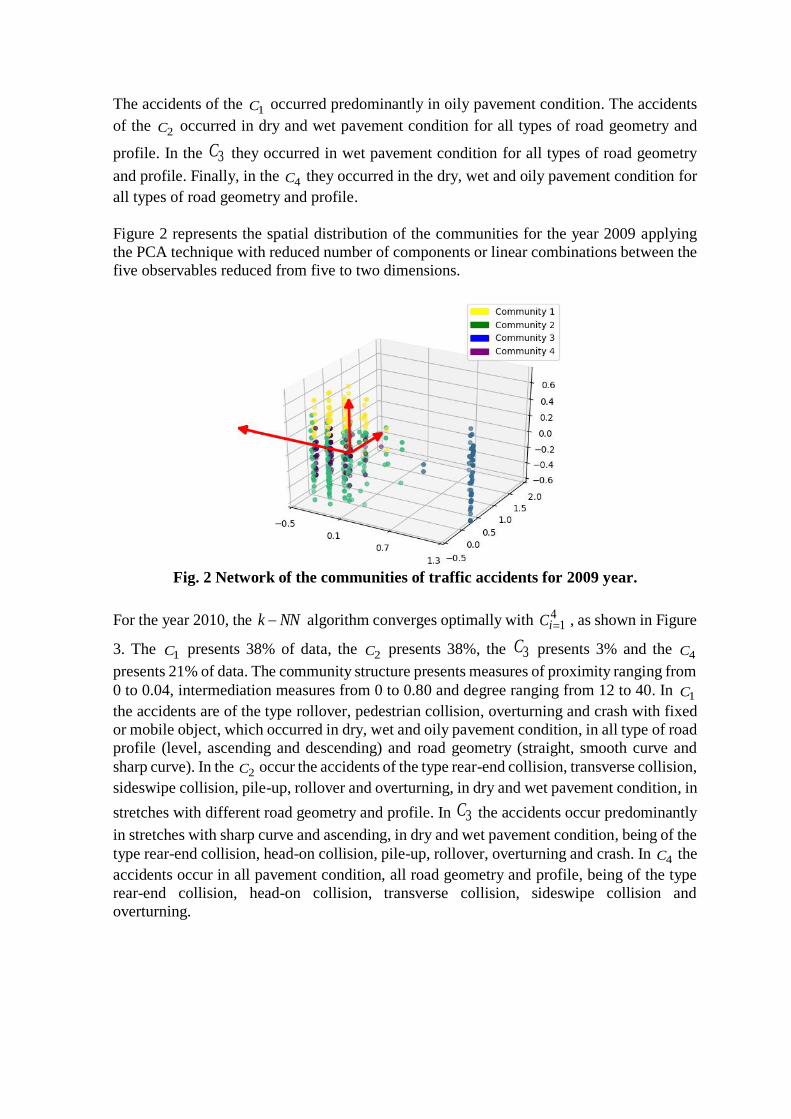
The accidents of the 1C occurred predominantly in oily pavement condition. The accidents
of the 2C occurred in dry and wet pavement condition for all types of road geometry and
profile. In the 3C they occurred in wet pavement condition for all types of road geometry
and profile. Finally, in the 4C they occurred in the dry, wet and oily pavement condition for
all types of road geometry and profile.
Figure 2 represents the spatial distribution of the communities for the year 2009 applying
the PCA technique with reduced number of components or linear combinations between the
five observables reduced from five to two dimensions.
Fig. 2 Network of the communities of traffic accidents for 2009 year.
For the year 2010, the NNk algorithm converges optimally with 41iC , as shown in Figure
3. The 1C presents 38% of data, the 2C presents 38%, the 3C presents 3% and the 4C
presents 21% of data. The community structure presents measures of proximity ranging from
0 to 0.04, intermediation measures from 0 to 0.80 and degree ranging from 12 to 40. In 1C
the accidents are of the type rollover, pedestrian collision, overturning and crash with fixed
or mobile object, which occurred in dry, wet and oily pavement condition, in all type of road
profile (level, ascending and descending) and road geometry (straight, smooth curve and
sharp curve). In the 2C occur the accidents of the type rear-end collision, transverse collision,
sideswipe collision, pile-up, rollover and overturning, in dry and wet pavement condition, in
stretches with different road geometry and profile. In 3C the accidents occur predominantly
in stretches with sharp curve and ascending, in dry and wet pavement condition, being of the
type rear-end collision, head-on collision, pile-up, rollover, overturning and crash. In 4C the
accidents occur in all pavement condition, all road geometry and profile, being of the type
rear-end collision, head-on collision, transverse collision, sideswipe collision and
overturning.
Page 9
Fig. 3 Network of the communities of traffic accidents for 2010 year.
The critical sections observed for the year 2010 were detected approximately in the km 139,
km 142, km 143 and km 145. In terms of homogeneous segments for 2010, we have the first
segment located between km 125 to km 135 and km 137 to km 141. The second segment
located between km 138 and km 146 and the third segment located between km 129 to km
136.
For the year 2011, there was a greater concentration of accidents at km 139 and between km
141 to km 145. The homogeneous segments were detected between km 139 to km 146, km
125 to km 129 and km 130 to km 138. The NNk algorithm converged optimally with 31iC
as indicates in Figure 4. Being 1C with 42% of the data, the 2C with 36% and 3C with 22%
of the data. The 1C presents the accidents rear-end collision, head-on collision, transverse
collision, sideswipe collision, pile-up and rollover, occurring in dry and wet pavement
condition, with straight or sharp curve geometry road and in different profile road. It presents
values of measures of centrality between 0 to 0.48 for betweenness, 0 to 0.01 for closeness,
and 12 to 60 for degree. The 2C is formed by accidents of the type rollover, pedestrian
collision, overturning, crash with fixed or mobile object and other, occurring in dry and wet
pavement condition, in all types of road geometry and profile. It presents values of measures
centrality of betweenness between 0 to 0.96, closeness between 0 to 0.01 and degree of 13
to 37. The 3C contains the accidents rear-end collision, transverse collision, sideswipe
collision, pile-up and overturning, occurring in dry and wet pavement condition, and in all
type of road geometry and profile. It presents the measures centrality betweenness between
0 to 0.92, the closeness between 0 to 0.01 and degree of 12 to 34.
Page 10
Fig. 4 Network of the communities of traffic accidents for 2011 year.
Finally, for the year 2012, checks of the NNk algorithm converged optimally with 31iC ,
as presented in Figure 5. The 1C presents the accidents of the type rear-end collision,
transverse collision, sideswipe collision and pile-up occurring in dry and wet pavement
condition, straight, smooth and sharp curve geometry, with ascending, descending and
levelled profile road, with measures of centrality between 0 at 0.47 for betweenness, between
0.13 at 0.32 for closeness and between 13 to 39 for degree. In 2C the more frequent accidents
are rollover, pedestrian collision, overturning, crash and others, with dry, wet and oily
pavement condition, with straight, smoot and sharp curve geometry, with ascending
descending and levelled profile road. The measures of centrality were between 0 to 0.82 for
betweenness, between 0.19 to 0.31 for closeness and between 13 to 38 for degree. In the 3C
stand out the accident of the type, rear-end collision, head-on collision, sideswipe collision,
pile-up, rollover and pedestrian collision, with dry and wet pavement condition, with
straight, smooth and sharp curve geometry, with ascending, descending and levelled profile
road. The measures of centrality were between 0 to 0.82 for betweenness, between of 0.19
to 0.31 for closeness and between 13 to 38 for degree.
Fig. 5 Network of the communities of traffic accidents for 2012 year.
Page 11
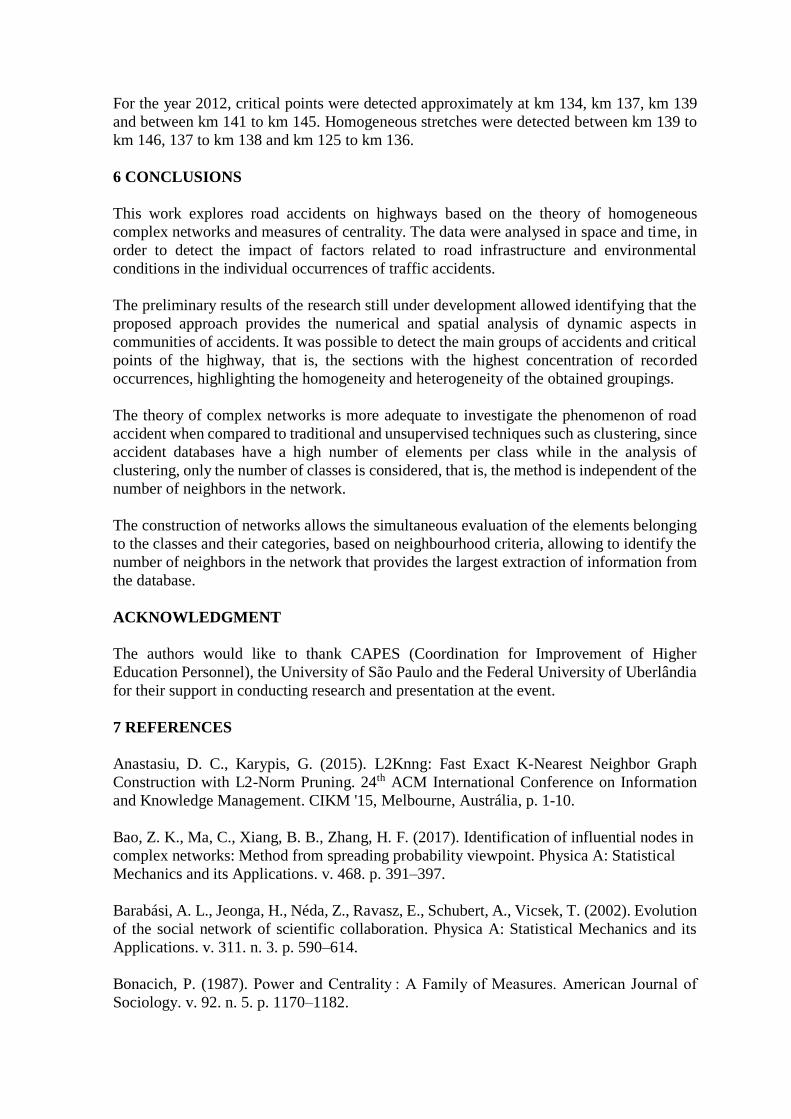
For the year 2012, critical points were detected approximately at km 134, km 137, km 139
and between km 141 to km 145. Homogeneous stretches were detected between km 139 to
km 146, 137 to km 138 and km 125 to km 136.
6 CONCLUSIONS
This work explores road accidents on highways based on the theory of homogeneous
complex networks and measures of centrality. The data were analysed in space and time, in
order to detect the impact of factors related to road infrastructure and environmental
conditions in the individual occurrences of traffic accidents.
The preliminary results of the research still under development allowed identifying that the
proposed approach provides the numerical and spatial analysis of dynamic aspects in
communities of accidents. It was possible to detect the main groups of accidents and critical
points of the highway, that is, the sections with the highest concentration of recorded
occurrences, highlighting the homogeneity and heterogeneity of the obtained groupings.
The theory of complex networks is more adequate to investigate the phenomenon of road
accident when compared to traditional and unsupervised techniques such as clustering, since
accident databases have a high number of elements per class while in the analysis of
clustering, only the number of classes is considered, that is, the method is independent of the
number of neighbors in the network.
The construction of networks allows the simultaneous evaluation of the elements belonging
to the classes and their categories, based on neighbourhood criteria, allowing to identify the
number of neighbors in the network that provides the largest extraction of information from
the database.
ACKNOWLEDGMENT
The authors would like to thank CAPES (Coordination for Improvement of Higher
Education Personnel), the University of São Paulo and the Federal University of Uberlândia
for their support in conducting research and presentation at the event.
7 REFERENCES
Anastasiu, D. C., Karypis, G. (2015). L2Knng: Fast Exact K-Nearest Neighbor Graph
Construction with L2-Norm Pruning. 24th ACM International Conference on Information
and Knowledge Management. CIKM '15, Melbourne, Austrália, p. 1-10.
Bao, Z. K., Ma, C., Xiang, B. B., Zhang, H. F. (2017). Identification of influential nodes in
complex networks: Method from spreading probability viewpoint. Physica A: Statistical
Mechanics and its Applications. v. 468. p. 391–397.
Barabási, A. L., Jeonga, H., Néda, Z., Ravasz, E., Schubert, A., Vicsek, T. (2002). Evolution
of the social network of scientific collaboration. Physica A: Statistical Mechanics and its
Applications. v. 311. n. 3. p. 590–614.
Bonacich, P. (1987). Power and Centrality : A Family of Measures. American Journal of
Sociology. v. 92. n. 5. p. 1170–1182.
Page 12
Brandes, U. (2001). A faster algorithm for betweenness centrality. The Journal of
Mathematical Sociology. v. 25. n. 2. p. 163–177.
Chang, L., Wang, H. (2006). Analysis of traffic injury severity : An application of non-
parametric classification tree techniques. Accident Analysis and Prevention. v. 38. p. 1019–
1027.
Csárdi, G., Nepusz, T. (2006). The Igraph software package for complex network research.
InterJournal Complex Systems, v. 1695, p. 1–9.
De Oña, J., De Oña, R., Eboli, L., Forciniti, C., Machado, J. L., Mazzulla, G. (2014).
Analyzing the relationship among Accident Severity. Drivers’ Behaviour and Their Socio-
economic Characteristics in Different Territorial Contexts. Procedia - Social and Behavioral
Sciences. v. 160, p. 74–83.
Greibe, P. (2003). Accident prediction models for urban roads. Accident Analysis and
Prevention. v. 35. n. 2. p. 273–285.
IBGE. (2017). Brazilian Institute of Geography and Statistics. Available at:
<https://agenciadenoticias.ibge.gov.br/agencia-sala-de-imprensa/2013-agencia-de-
noticias/releases/16131-ibge-divulga-as-estimativas-populacionais-dos-municipios-para-
2017.html>. Access: fev/2018. In Portuguese.
Han, J.; Kamber, M.; Pei, J. Mining heterogeneous information networks by exploring the
power of links. Lecture Notes in Computer Science, v. LNAI 5808, n. Springer-Verlag
Berlin Heidelberg, p. 13–30, 2009.
Hauer, E. (2007). Safety Models for Urban Four-lane Undivided Road Segments.
Transportation Research Record: Journal of the Transportation Research Board, n. 96–105.
p. 1–22. 2007.
Hongyu, K., Sandanielo, V. L. M., Oliveira Junior, G. J. (2015). Principal Component
Analysis: theory, interpretations and applications. E&S - Engineering and Science, Volume
1, Ed. 5:1.
Kunegis, J. (2014). Exploiting the Structure of Bipartite Graphs for Algebraic and Spectral
Graph Theory Applications. Internet Mathematics. v. 11. n. 3. p. 201–321.
López, G., De Oña, J., Abellán, J. (2012). Using Decision Trees to extract Decision Rules
from Police Reports on Road Accidents. Procedia - Social and Behavioral Sciences. v. 53.
n. SIIV-5th International Congress-Sustainability of Road Infrastructures. p. 106–114.
Miaou, S. P., Lum, H. (1993). Modeling vehicle accidents and highway geometric design
relationships. Accident Analysis and Prevention. v. 25. n. 6. p. 689–709.
Newman, M. E. J. (2003). The Structure and Function of Complex Networks. SIAM Review.
v. 45. n. 2. p. 167–256.
Page 13
Newman. M. E. J. (2004a). Coauthor ship networks and patterns of scientific collaboration.
In: Proceedings of the National Academy of Science of the United States. v. 101. n.
PNAS’04. p. 5200–5205.
Newman. M. E. J. (2004b). Analysis of weighted networks. Physical Review E - Statistical.
Nonlinear and Soft Matter Physics. v. 70. n. 52, p. 1–9.
Newman. M. E. J. (2010). Networks: An Introduction. 1. Ed. New York: Oxford University
Press.
ONS. (2014). National Road Safety Observatory. Statistics. Available at:
<http://iris.onsv.org.br/iris-beta/#/stats/maps>. Access: fev/2018. In Portuguese.
Sabidussi, G. (1966). The centrality index of a graph. Psychometrika, v. 31, n. 4, p. 581–
603.
Savolainen, P. T., Mannering, F. L., Lord, D. Q., Mohammed, A. (2011). The statistical
analysis of highway crash-injury severities: A review and assessment of methodological
alternatives. Accident Analysis and Prevention, v. 43. n. 5. p. 1666–1676.
Soares, P. R. S., Prudêncio, R. B. C. (2012). Time series based link prediction. Neural
Networks (IJCNN), The 2012 International Joint Conference, p. 1–7.
Wasserman. S., Faust. K. (1994) Social network analysis: methods and applications.
Cambridge University Press. 825p.
Zhang, T., Ramakrishnan, R., Livny, M. (1996). BIRCH: An Efficient Data Clustering
Databases Method for Very Large. ACM SIGMOD Int. Conf. Manag. Data
v. 1, p. 103–114.