Spatial and Temporal Variability of GPCP Precipitation Estimates By C. F. Ropelewski Summarized from the generous input Provided by G. Huffman, R. Adler, S. Curtis, P. Arkin, X. Yin J.Janowiak, P. Xie R. Ferraro P. Bauer C.Beck, J.Grieser, B.Rudolf M. Bell, B. Blumenthal, B. Lyon F. R. Robertson T. Smith Presented at the 30 th Climate Diagnostics and Prediction WS, 24-28 Oct 2005 State College, PA Go LIONS
Transcript
Spatial and Temporal Variability of GPCP Precipitation Estimates
By C. F. RopelewskiSummarized from the generous input
Provided byG. Huffman, R. Adler, S. Curtis,
P. Arkin, X. YinJ.Janowiak, P. Xie
R. Ferraro P. Bauer
C.Beck, J.Grieser, B.RudolfM. Bell, B. Blumenthal, B. Lyon
F. R. RobertsonT. Smith
Presented at the 30th Climate Diagnosticsand Prediction WS, 24-28 Oct 2005State College, PA
Go LIONS
Characteristics of the GPCP Data Set• Global Complete Monthly Precipitation Analysis
•January 1979 to Present
•2.5o latitude by 2.5o longitude
• Input data• Satellite Infrared (geostationary0• Microwave (from mid-1987)• Gauge data (Global Precipitation Climatology Center (GPCC) operated by the DWD
• Output Data•Satellite only •Merged gauge and satellite• Monthly, pentad, daily
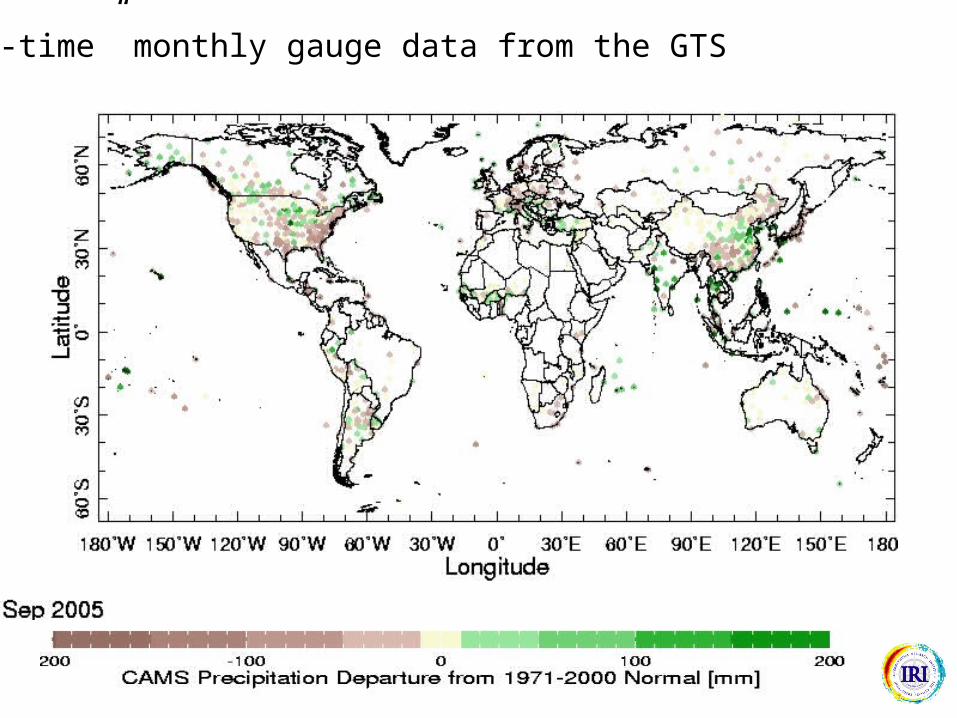
“Real-time” monthly gauge data from the GTS
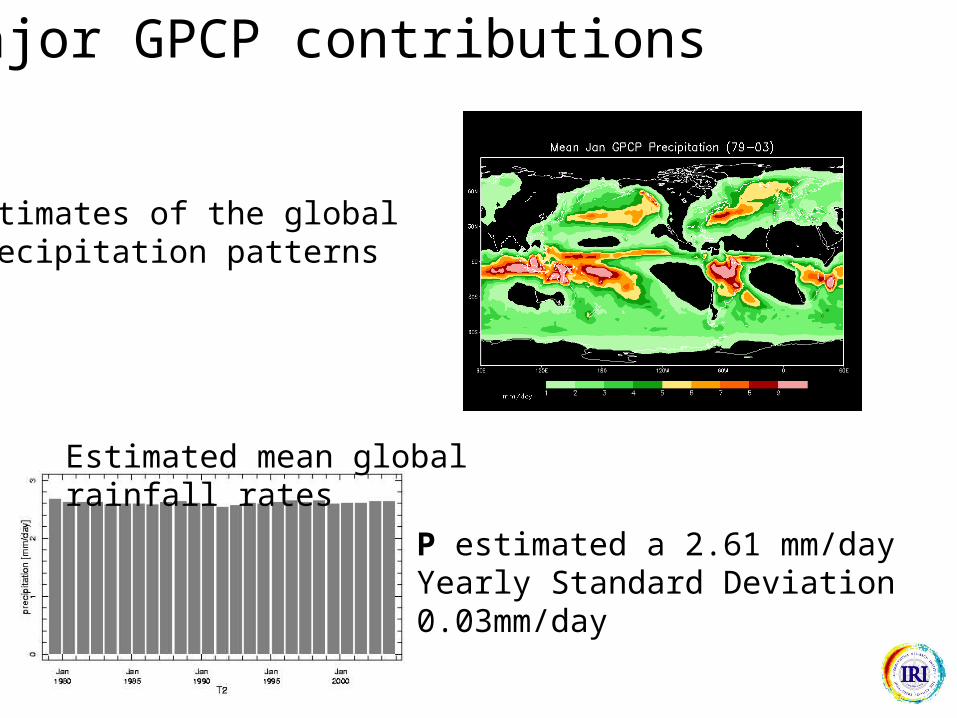
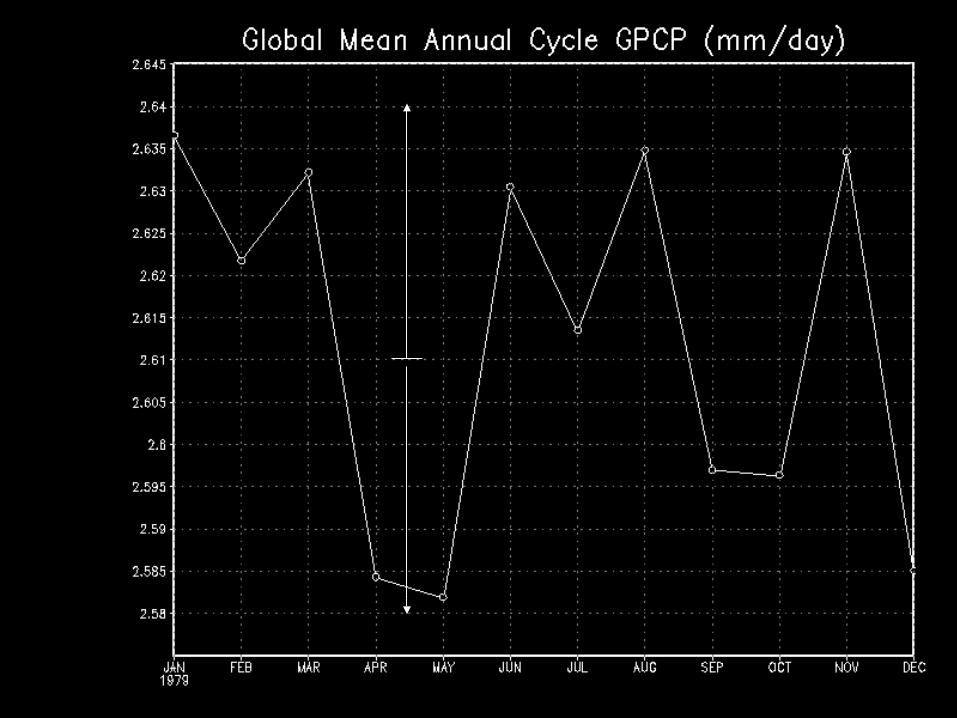
P estimated a 2.61 mm/dayYearly Standard Deviation 0.03mm/day
Estimated mean global rainfall rates
Major GPCP contributions
Estimates of the globalPrecipitation patterns
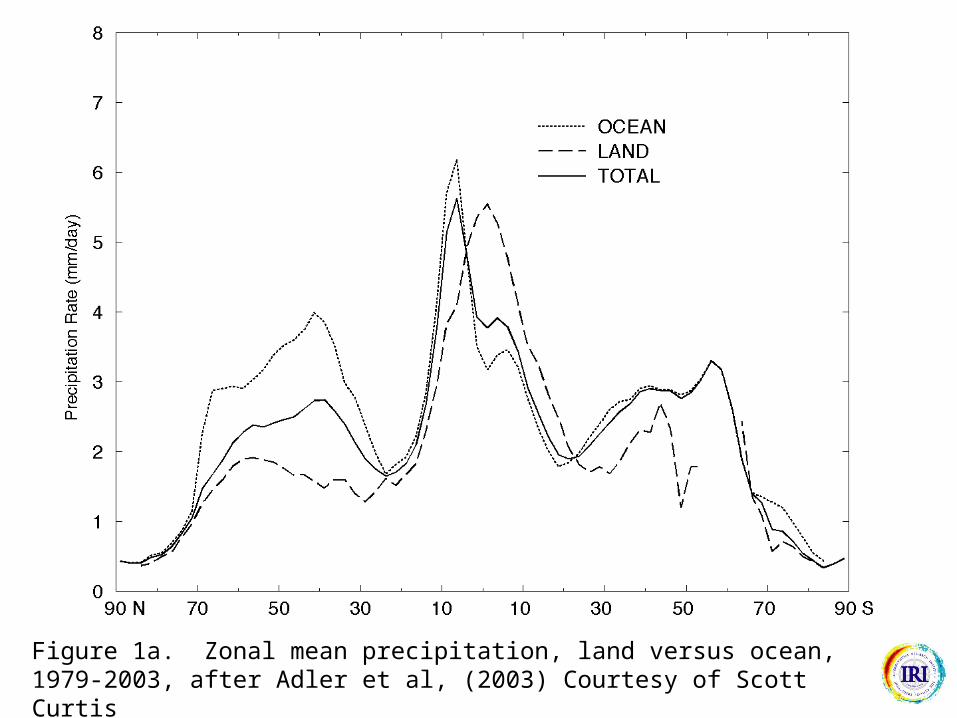
Figure 1a. Zonal mean precipitation, land versus ocean, 1979-2003, after Adler et al, (2003) Courtesy of Scott Curtis
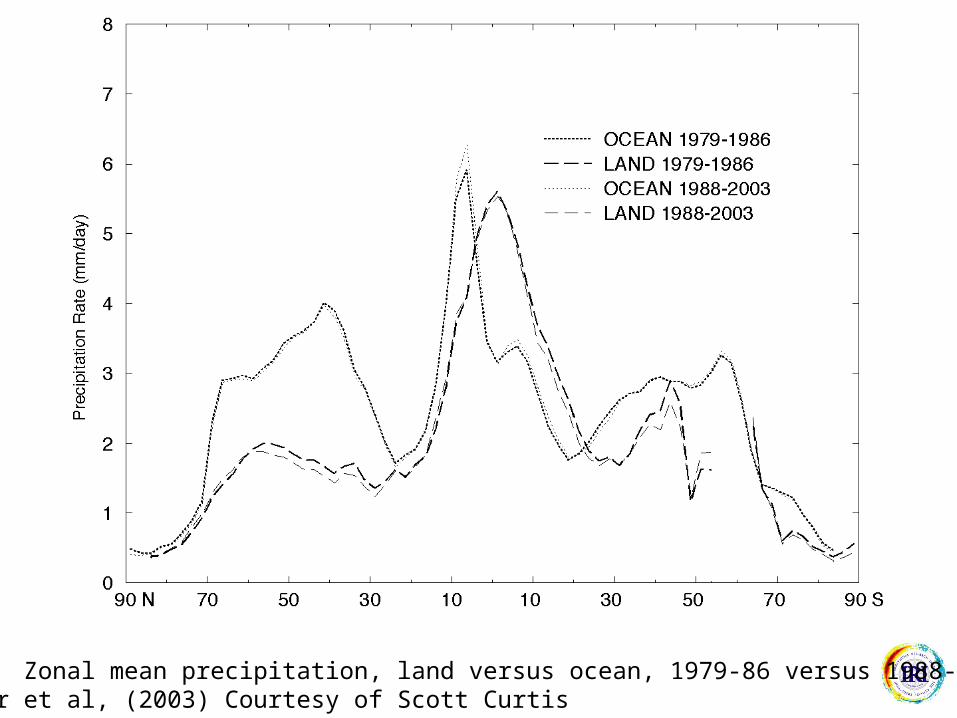
Figure 1b. Zonal mean precipitation, land versus ocean, 1979-86 versus 1988-2003After Adler et al, (2003) Courtesy of Scott Curtis
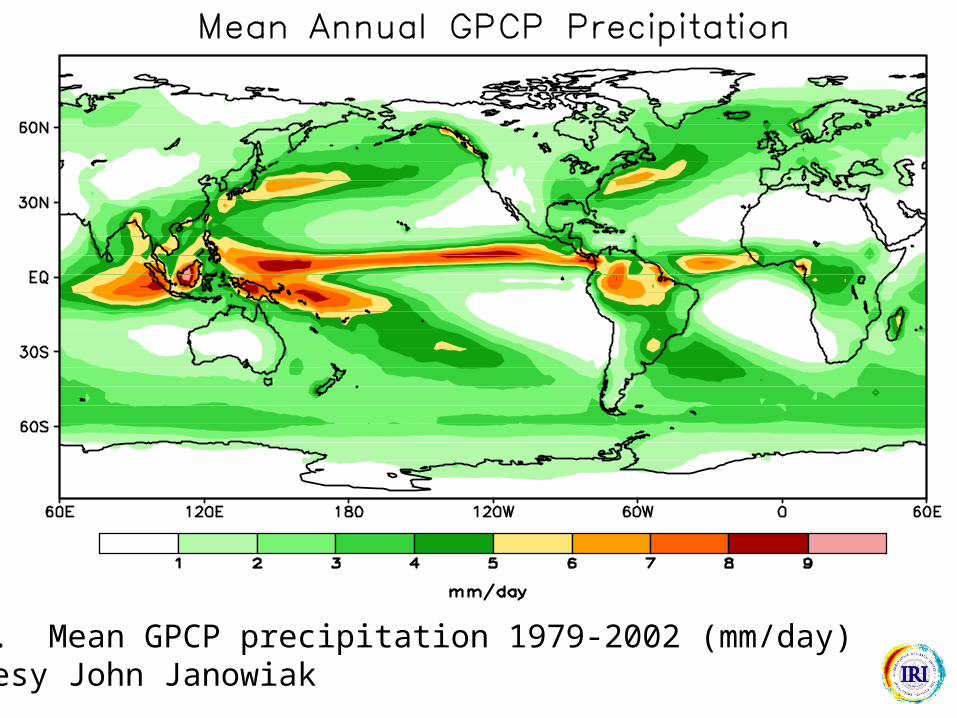
Fig 2. Mean GPCP precipitation 1979-2002 (mm/day)Courtesy John Janowiak
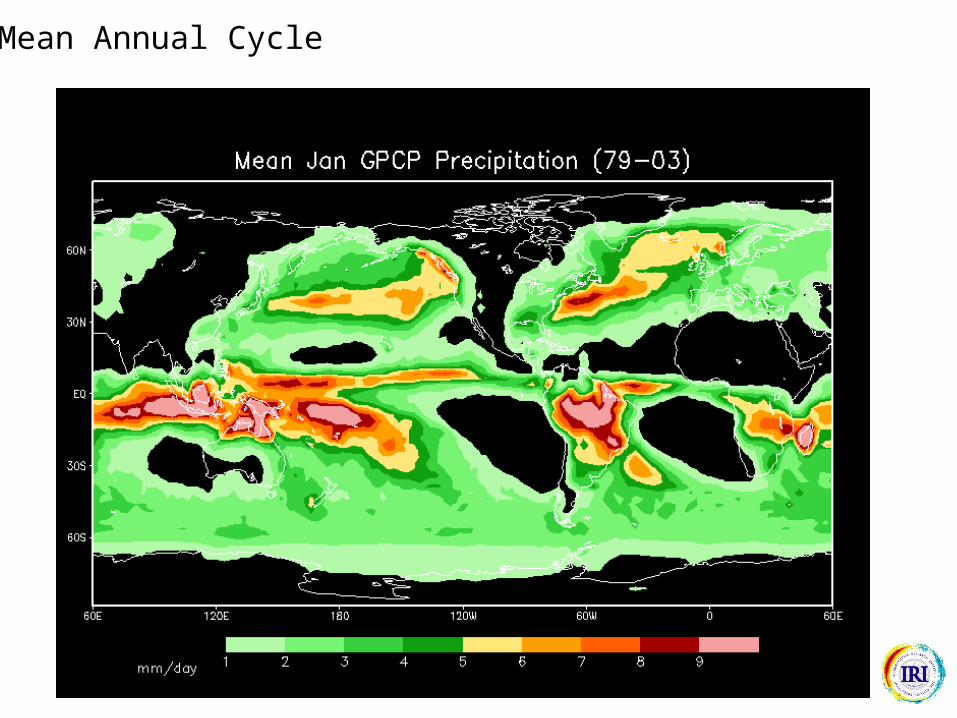
Mean Annual Cycle
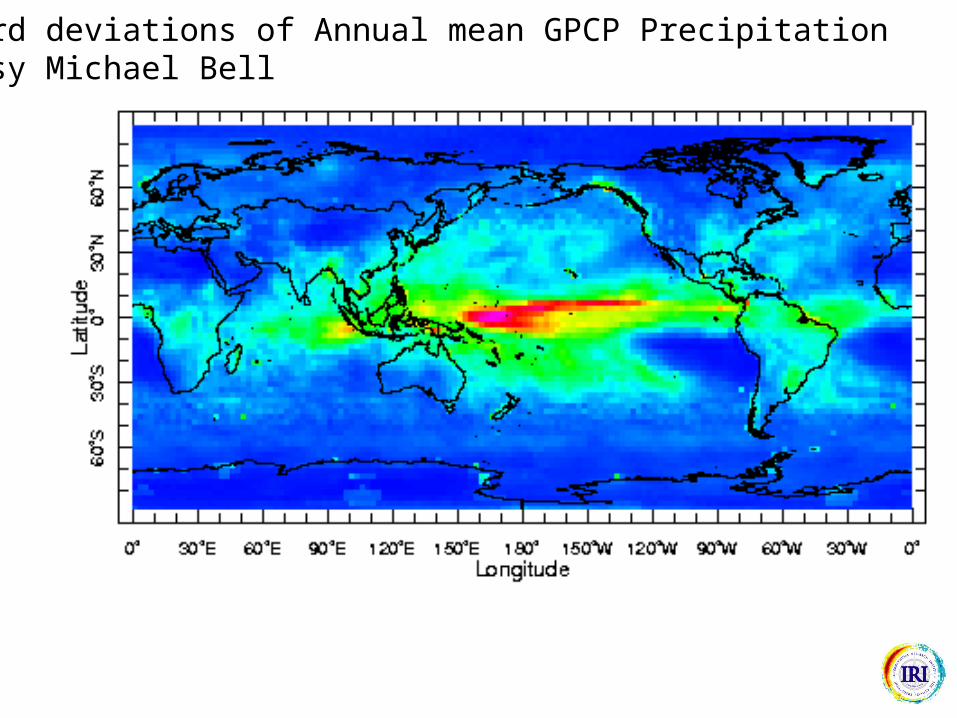
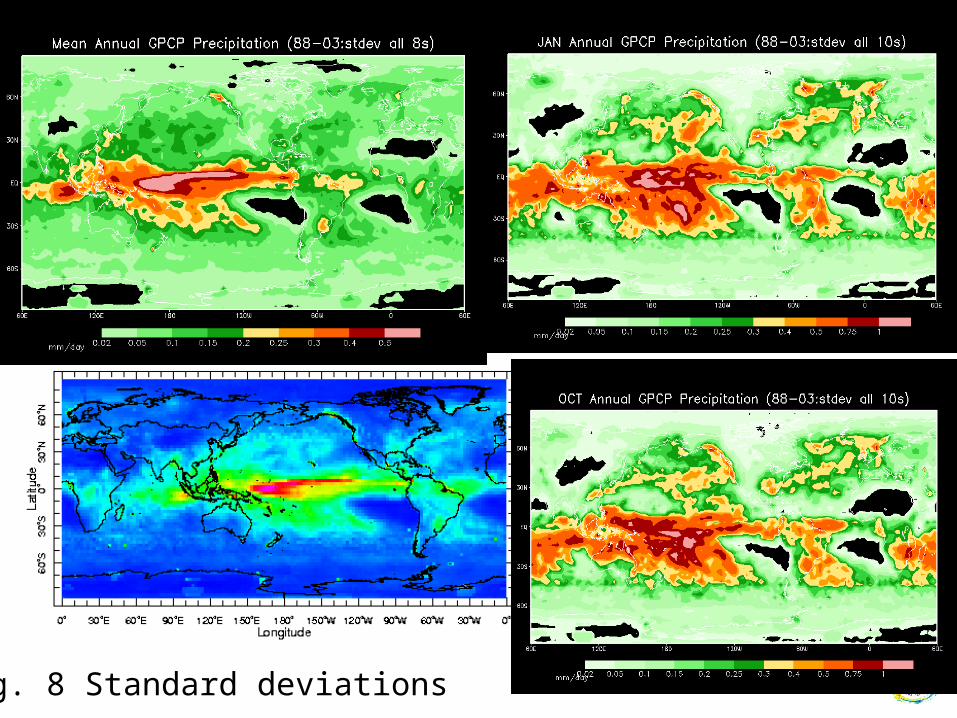
Standard deviations of Annual mean GPCP Precipitation Courtesy Michael Bell
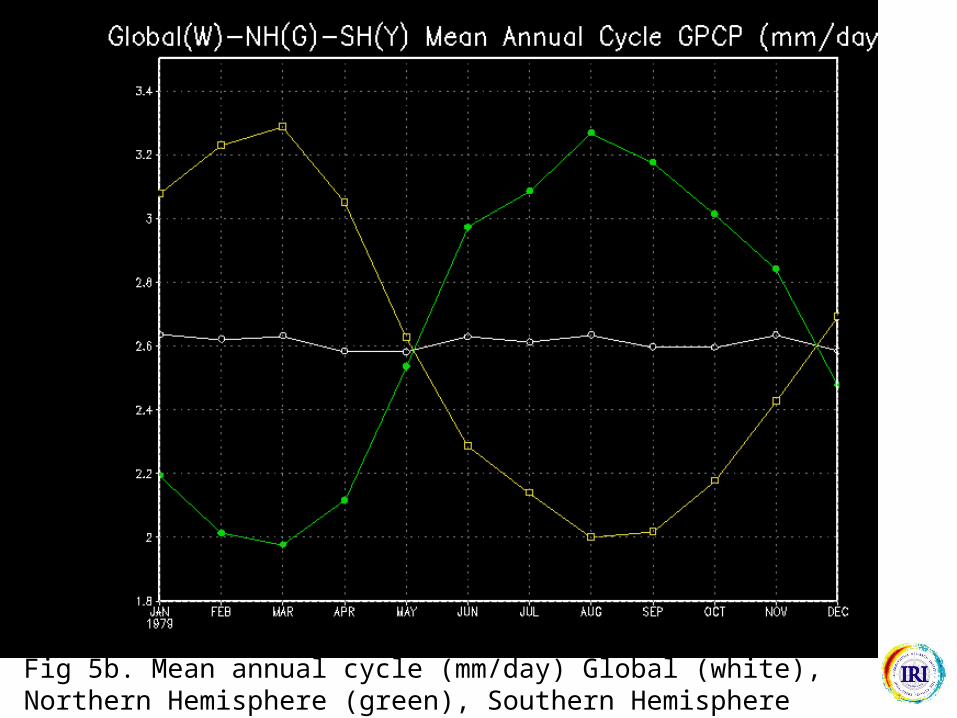
Fig 5b. Mean annual cycle (mm/day) Global (white), Northern Hemisphere (green), Southern Hemisphere (yellow).
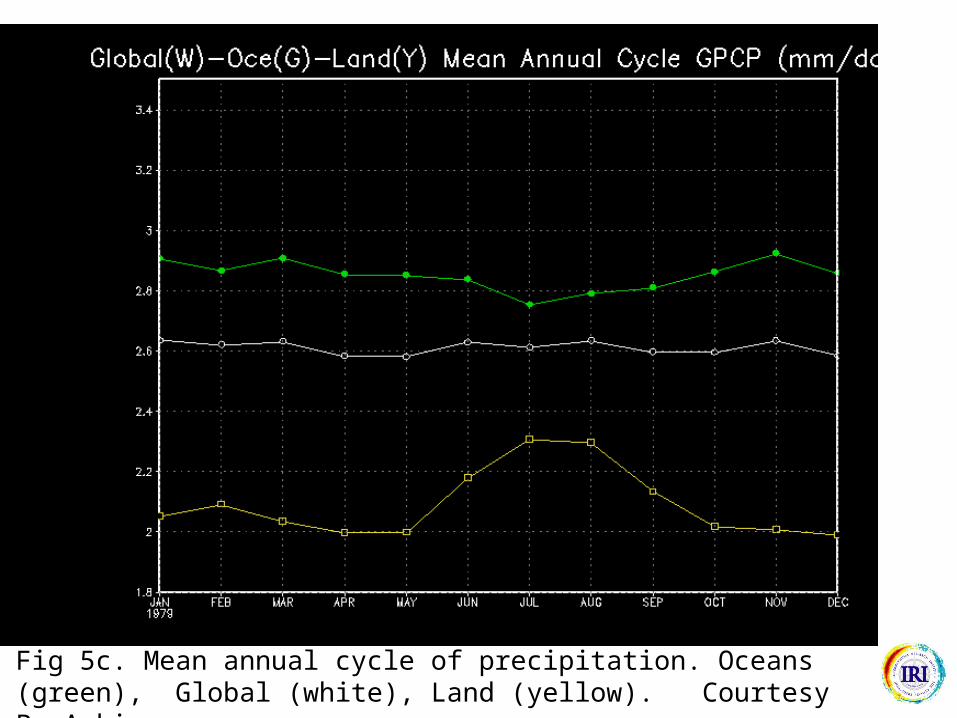
Fig 5c. Mean annual cycle of precipitation. Oceans (green), Global (white), Land (yellow). Courtesy P. Arkin
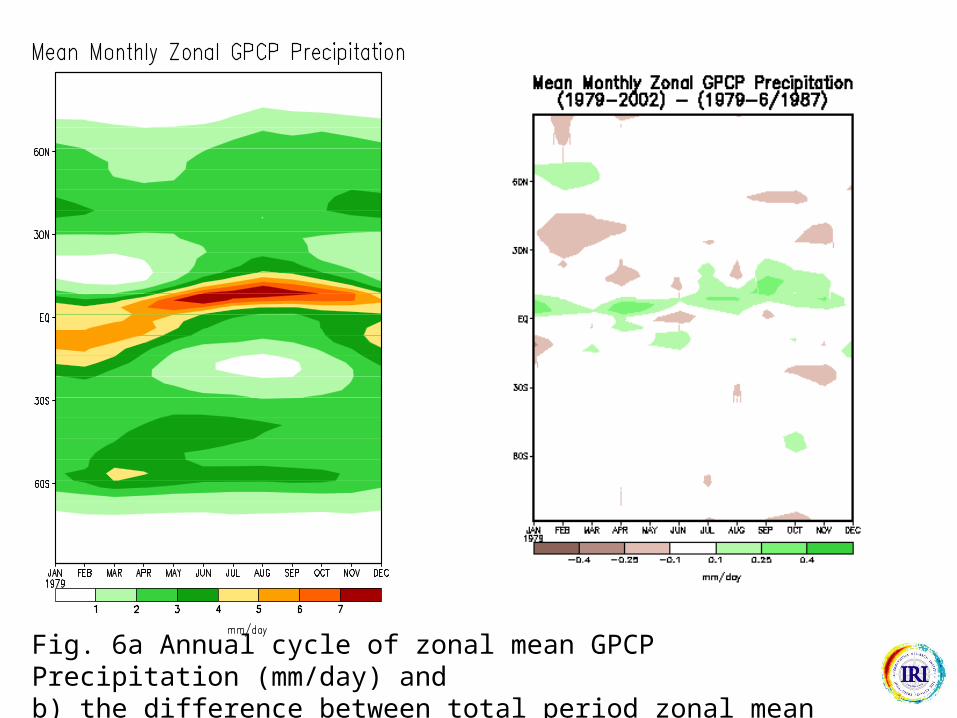
Fig. 6a Annual cycle of zonal mean GPCP Precipitation (mm/day) and b) the difference between total period zonal mean 1979 – 2002and 1979-86/87. Courtesy J. Janowiak
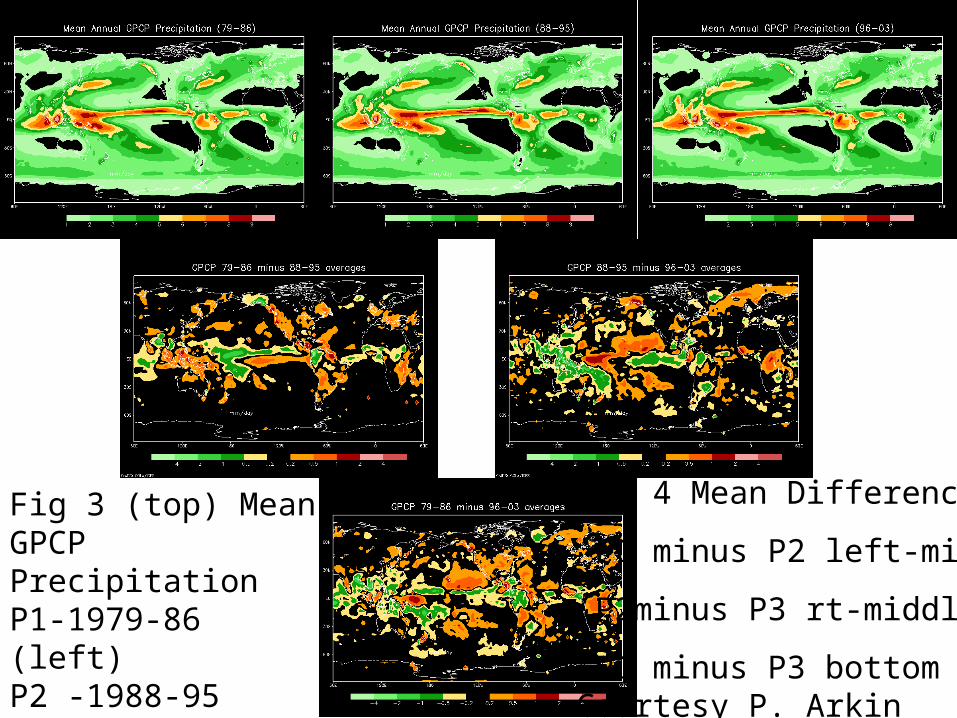
Fig 3 (top) Mean GPCP PrecipitationP1-1979-86 (left)P2 -1988-95 (middle)P3- 1996-2003 (right)Courtesy P. Arkin
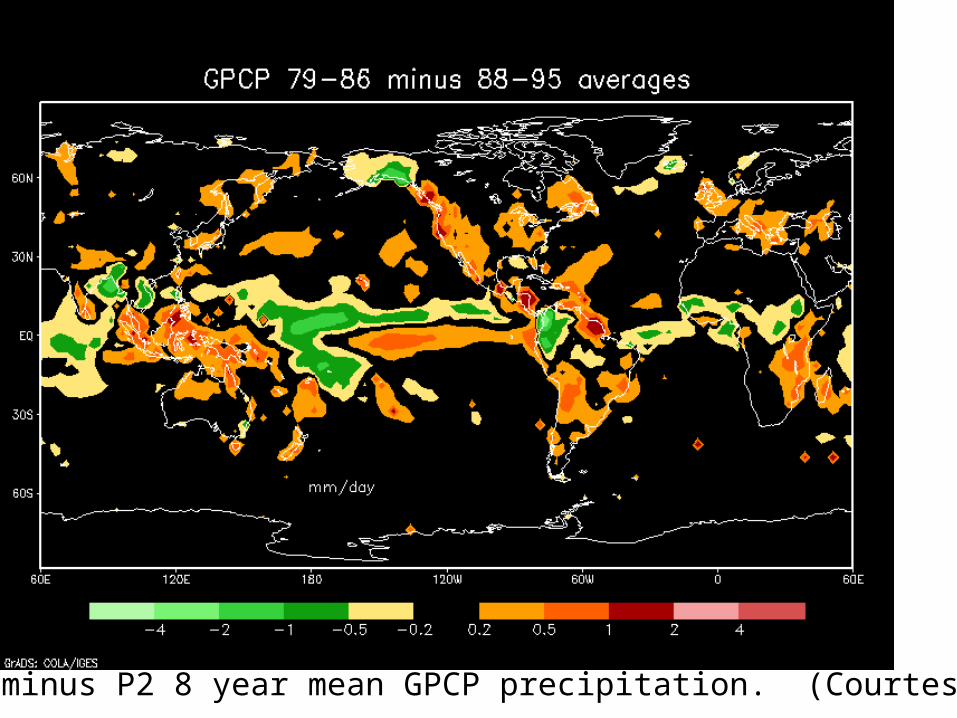
Fig 4 Mean Differences
P1 minus P2 left-middle
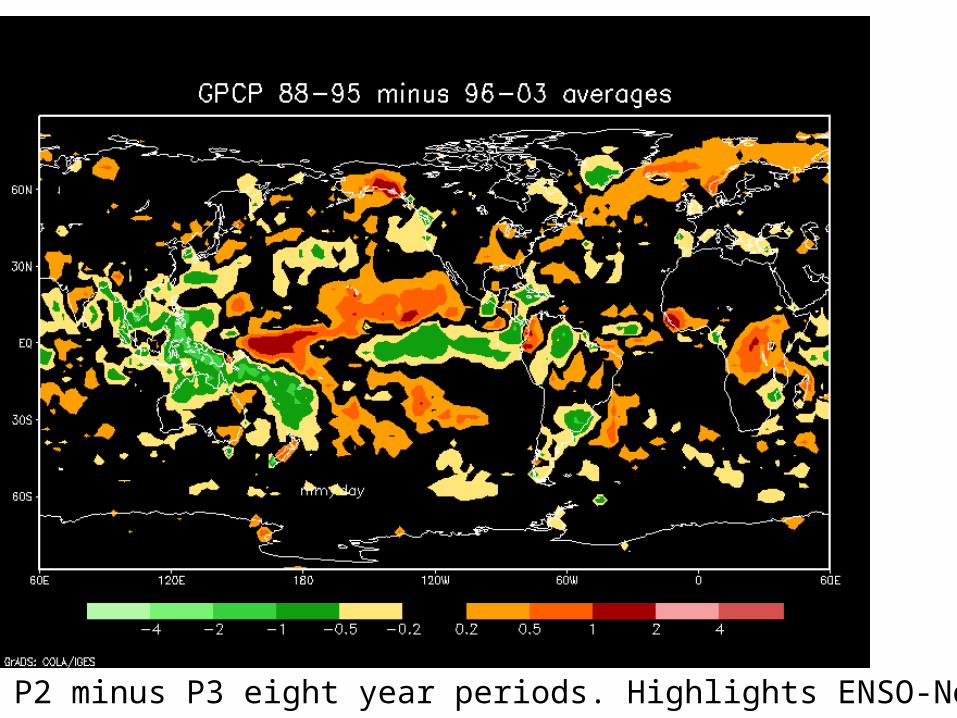
P2minus P3 rt-middle
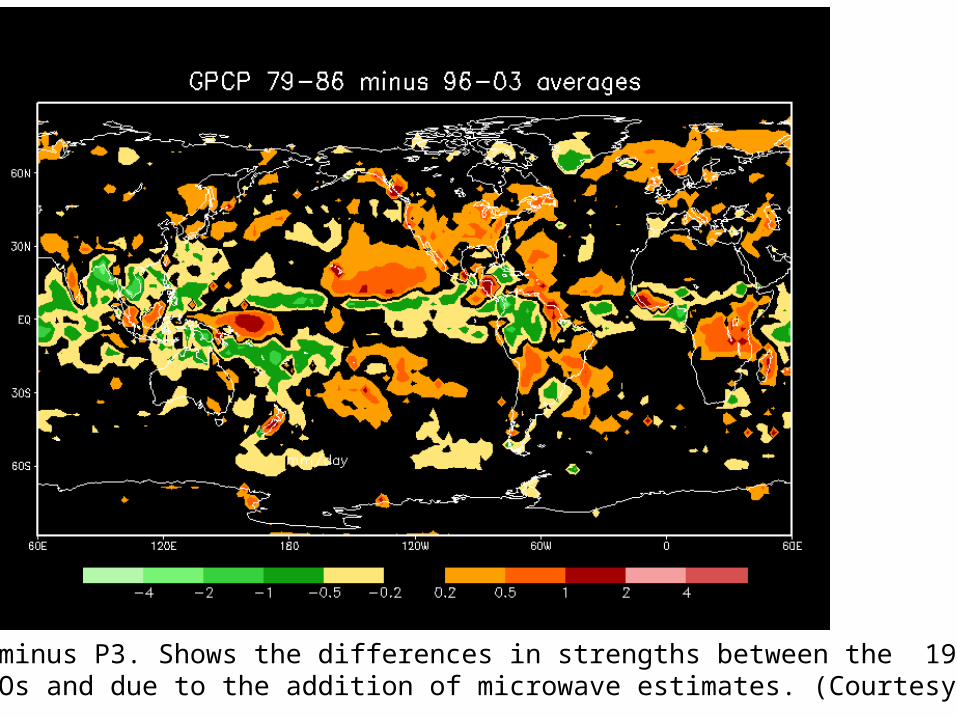
P1 minus P3 bottomCourtesy P. Arkin
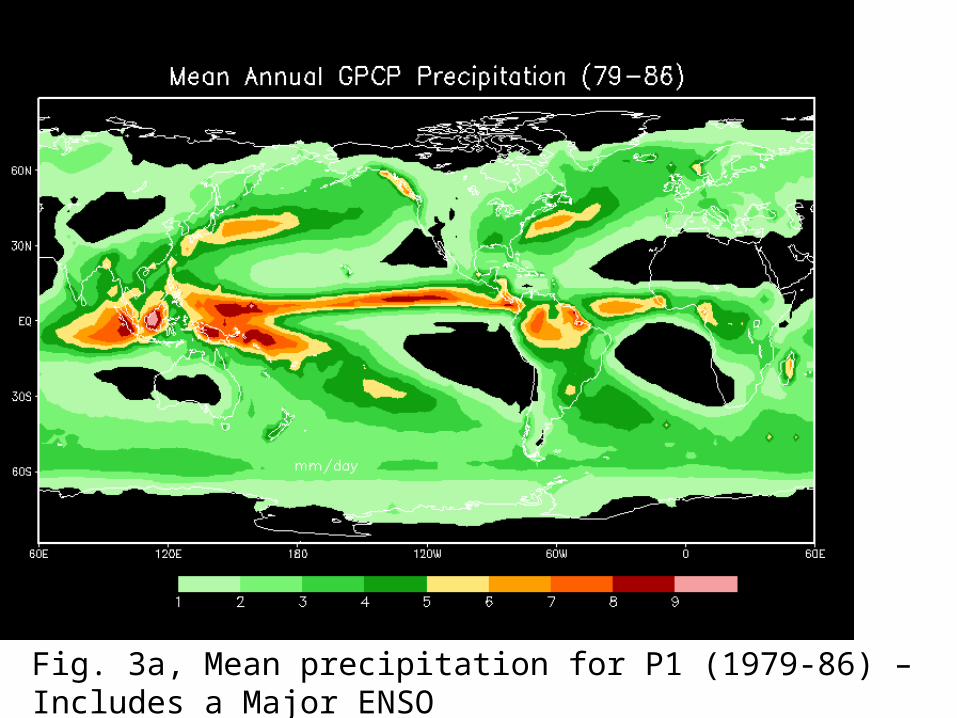
Fig. 3a, Mean precipitation for P1 (1979-86) – Includes a Major ENSO Warm episode but no microwave estimates. (Courtesy P. Arkin)
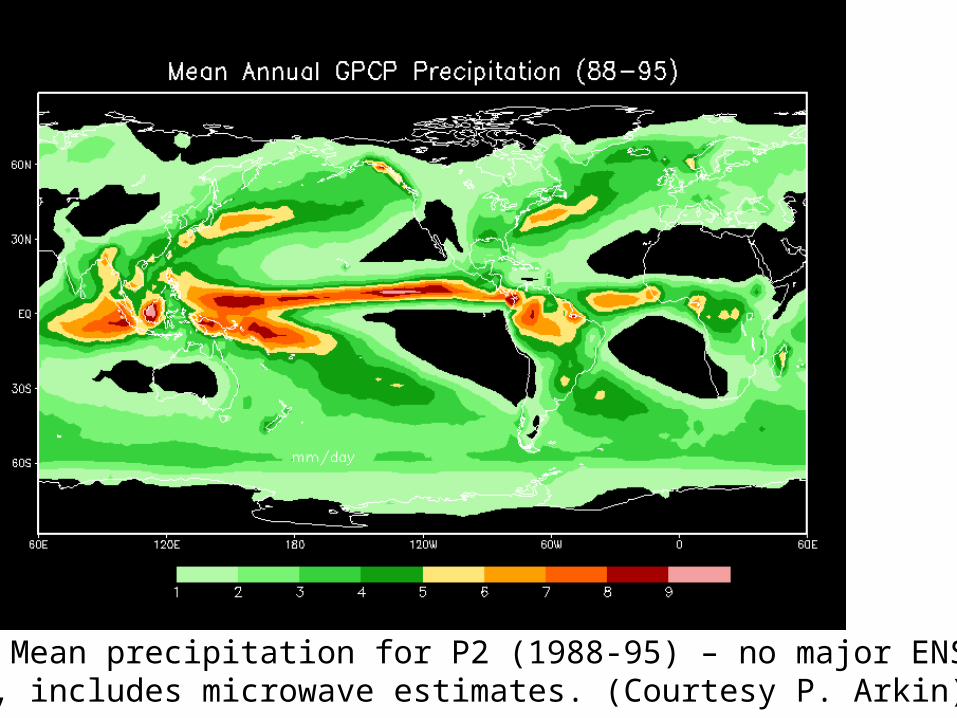
Fig. 3b, Mean precipitation for P2 (1988-95) – no major ENSO warmEpisodes, includes microwave estimates. (Courtesy P. Arkin)
Fig 4a P1 minus P2 8 year mean GPCP precipitation. (Courtesy P. Arkin)
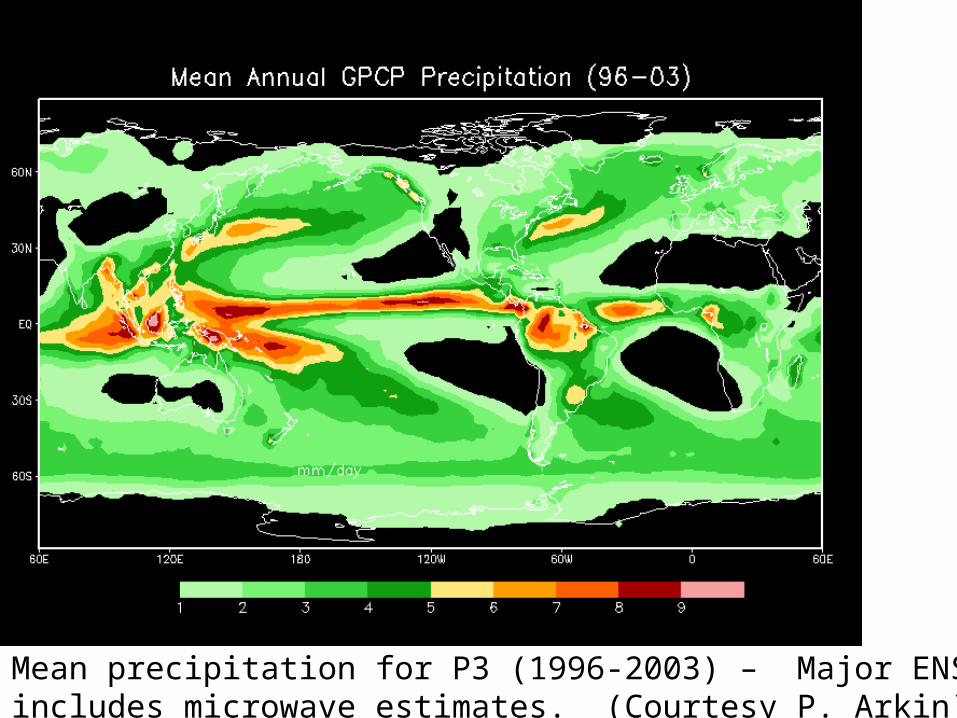
Fig. 3c, Mean precipitation for P3 (1996-2003) – Major ENSO warmEpisode, includes microwave estimates. (Courtesy P. Arkin)
Fig. 4b P2 minus P3 eight year periods. Highlights ENSO-No ENSO
Fig 4c P1 minus P3. Shows the differences in strengths between the 1982/83 and 1997/98 ENSOs and due to the addition of microwave estimates. (Courtesy P. Arkin)
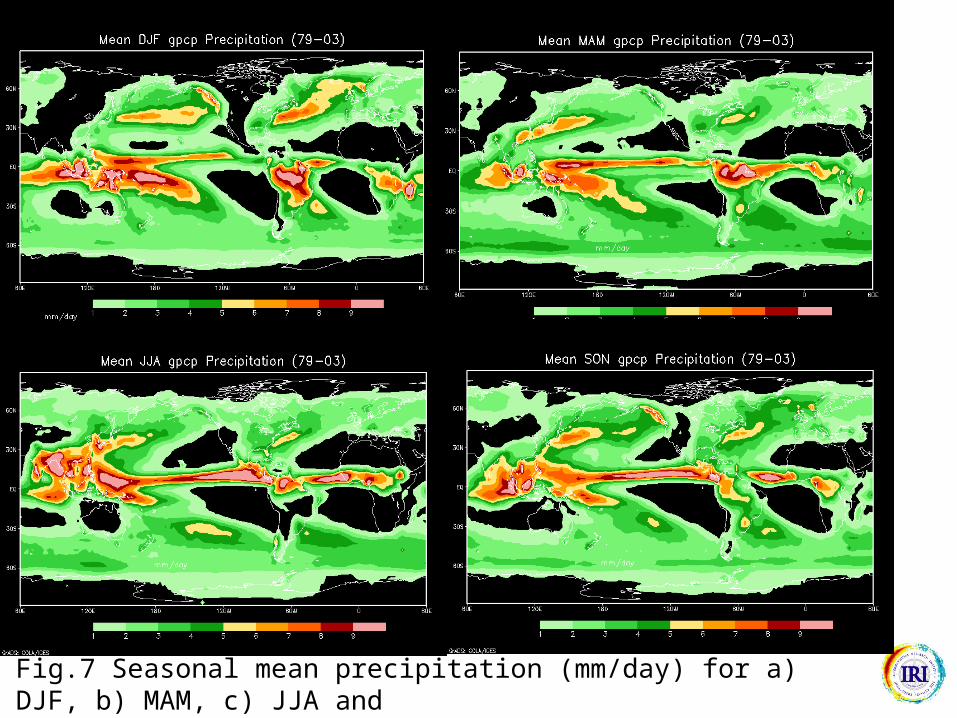
Fig.7 Seasonal mean precipitation (mm/day) for a) DJF, b) MAM, c) JJA andd) SON. Courtesy P. Arkin
Fig. 8 Standard deviations
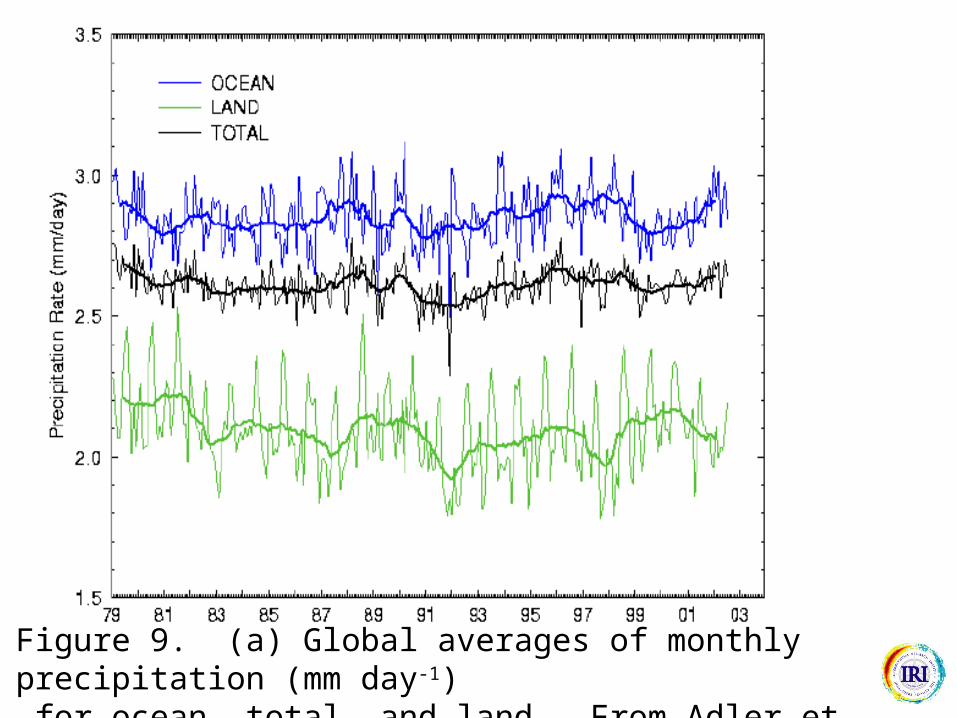
P estimated at 2.61 mm/dayYearly Standard Deviation 0.03mm/day
Time series of GPCP annual mean global precipitation 1979-2003
See Allen, M.R. and W. J. Ingram, 2002: Constraints on future changes in climate and the Hydrologic cycle. Nature, 419, 224-232
Figure 9. (a) Global averages of monthly precipitation (mm day-1) for ocean, total, and land . From Adler et al. 2003.
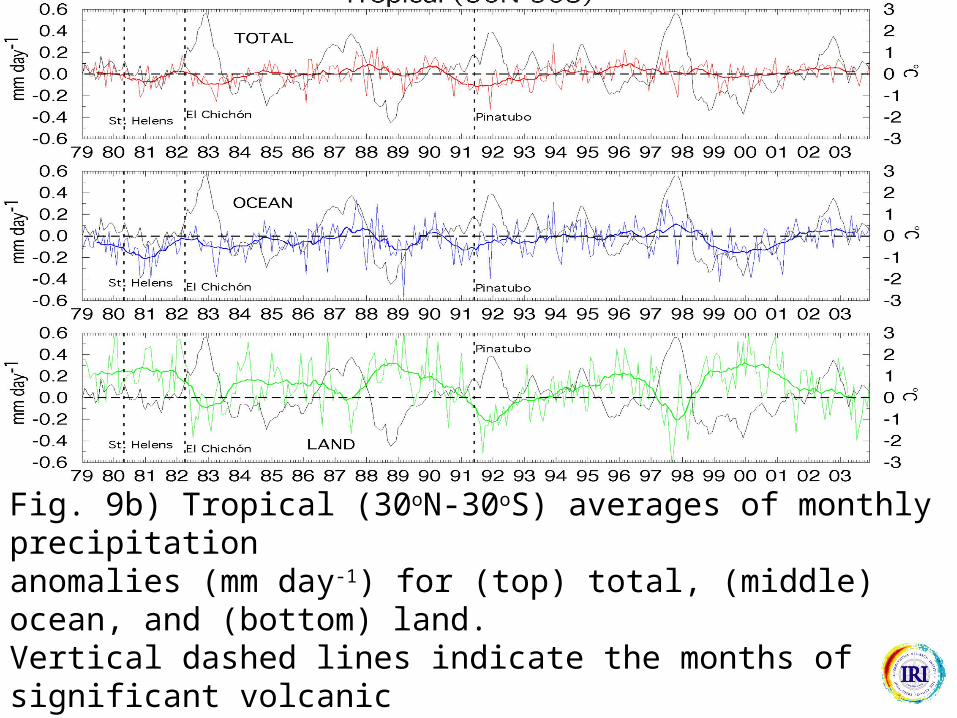
Fig. 9b) Tropical (30oN-30oS) averages of monthly precipitation anomalies (mm day-1) for (top) total, (middle) ocean, and (bottom) land. Vertical dashed lines indicate the months of significant volcanic eruptions. The thin black curves indicate the Niño-3.4 SST index (oC). After Adler et al 2003.
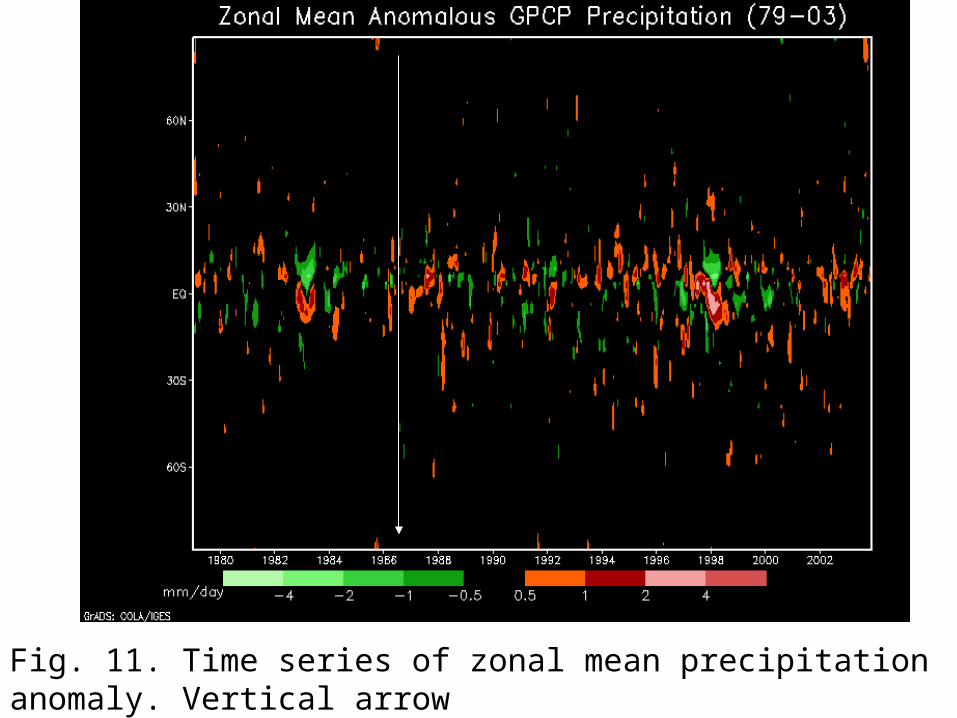
Fig. 11. Time series of zonal mean precipitation anomaly. Vertical arrow shows the approximate introduction of microwave data Courtesy P. Arkin
Fig 10 Alternate. Zonal means for tropics only.
a
b
c
d
e
f
g
h
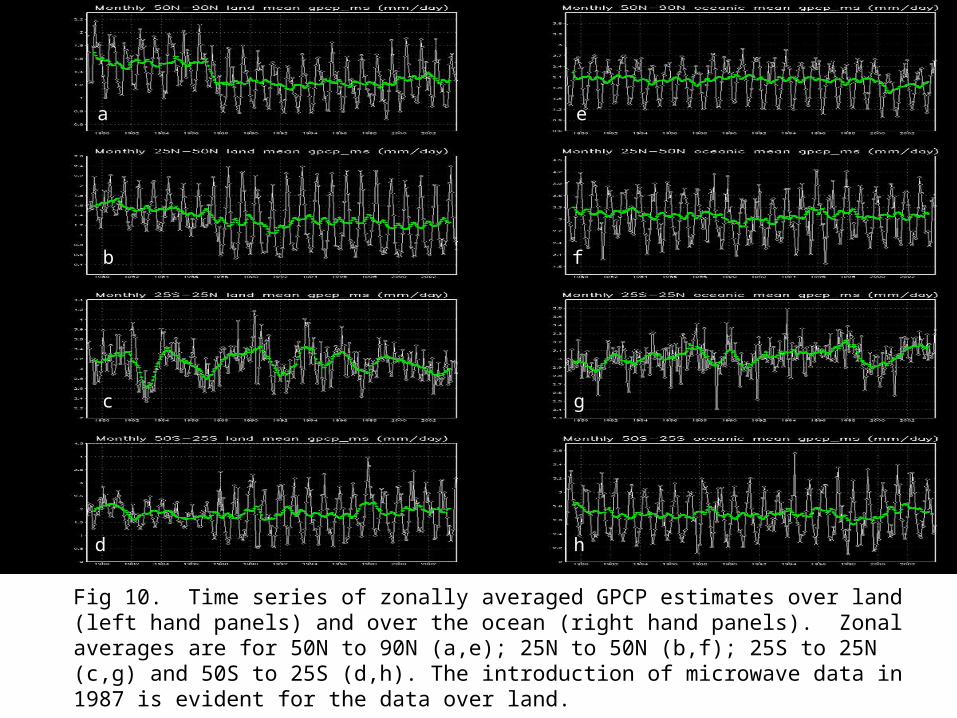
Fig 10. Time series of zonally averaged GPCP estimates over land (left hand panels) and over the ocean (right hand panels). Zonal averages are for 50N to 90N (a,e); 25N to 50N (b,f); 25S to 25N (c,g) and 50S to 25S (d,h). The introduction of microwave data in 1987 is evident for the data over land.
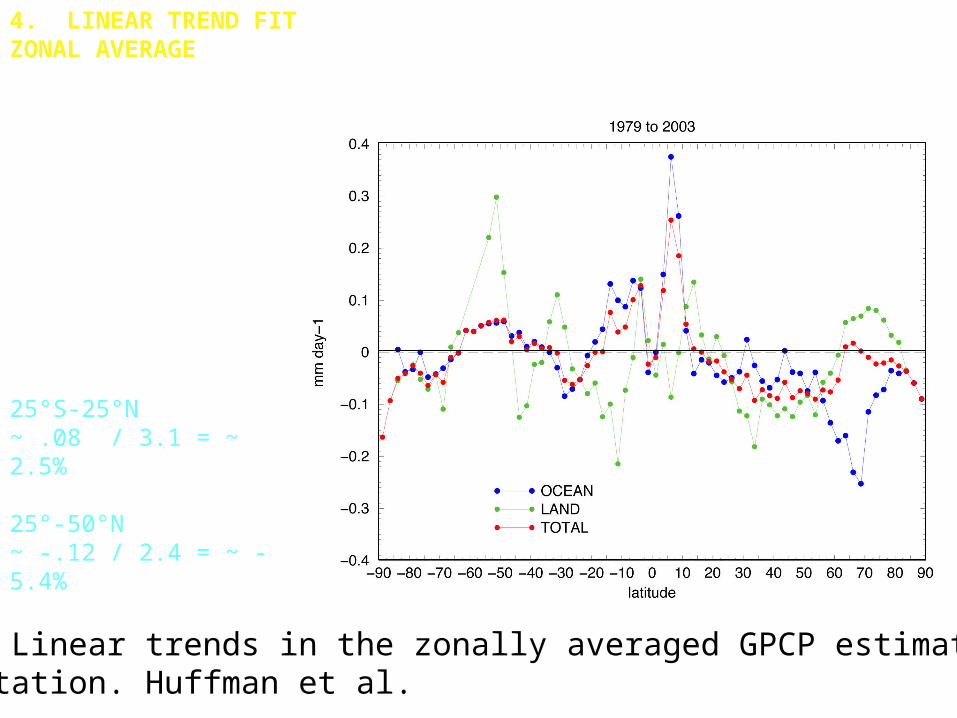
4. LINEAR TREND FIT ZONAL AVERAGE
Zonal averages of 25-year linear trend showquite different trends indifferent lat. bands – again, note regional coherence.
25°S-25°N~ .08 / 3.1 = ~ 2.5%
25°-50°N ~ -.12 / 2.4 = ~ -5.4%
Land and Ocean are notuniformly related.
Fig 10a Linear trends in the zonally averaged GPCP estimated precipitation. Huffman et al.
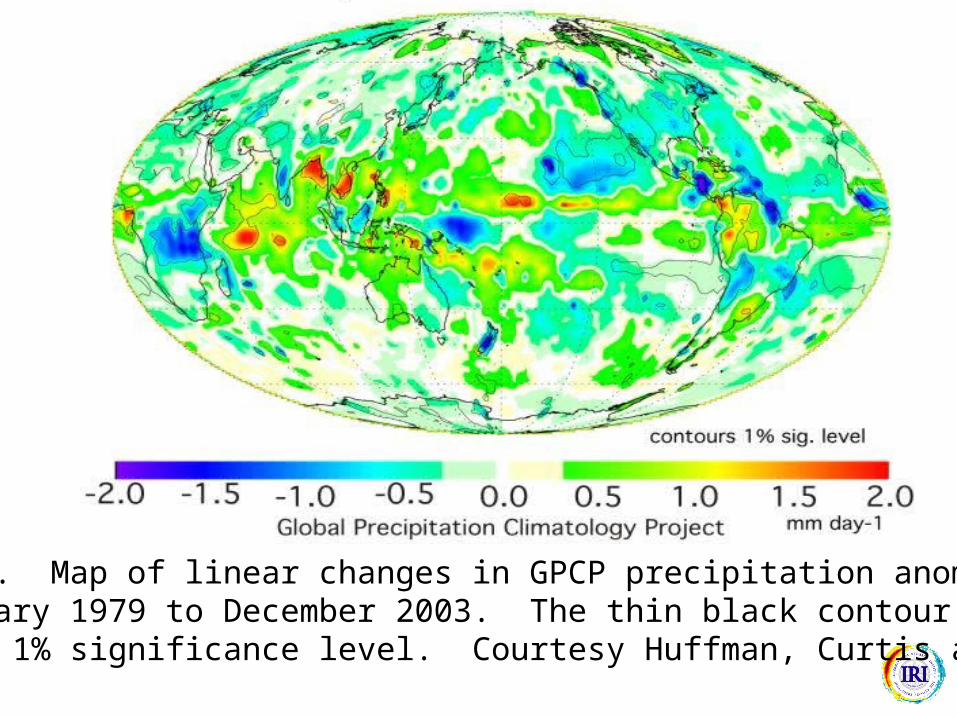
Figure 12. Map of linear changes in GPCP precipitation anomalies from January 1979 to December 2003. The thin black contour outlines the local 1% significance level. Courtesy Huffman, Curtis and Adler
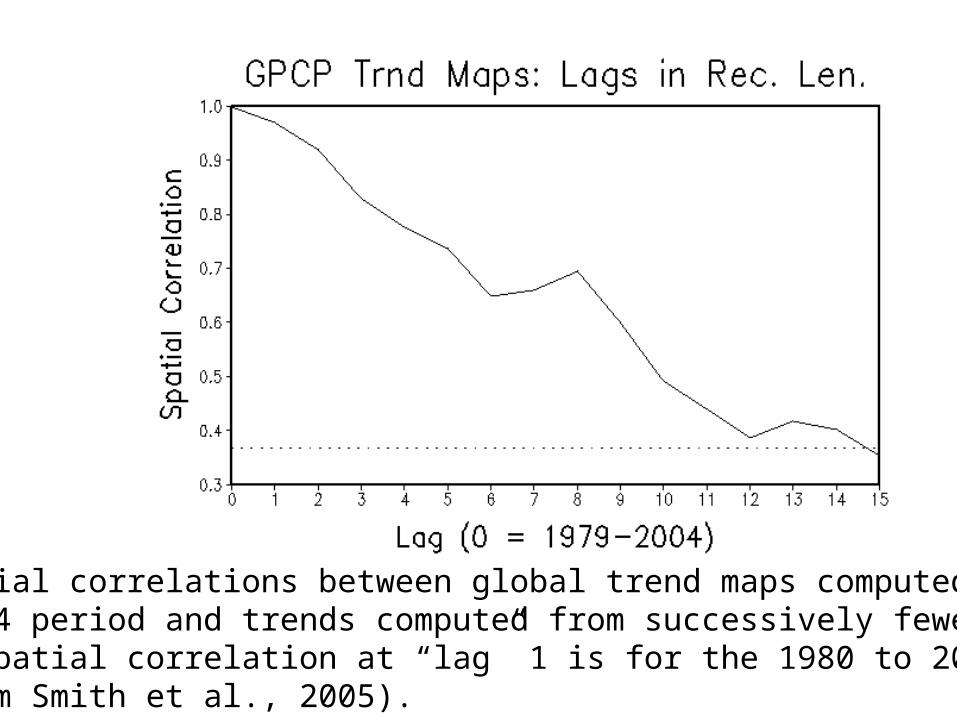
Fig 12 Spatial correlations between global trend maps computed for the 1979 to 2004 period and trends computed from successively fewer years. E.g., the spatial correlation at “lag” 1 is for the 1980 to 2004 period andso on. (from Smith et al., 2005).
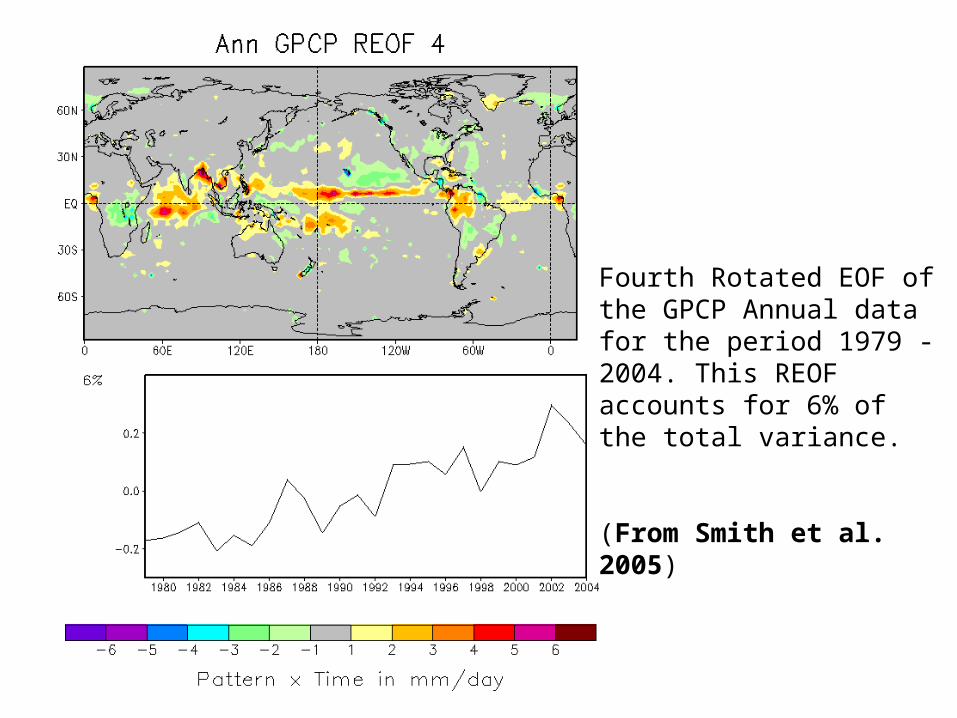
Fourth Rotated EOF of the GPCP Annual data for the period 1979 - 2004. This REOF accounts for 6% of the total variance.
(From Smith et al. 2005)
Summary:
• The GPCP Data provide (relatively) consistent and complete global precipitation estimates from (1979) 1988 to the present.
• These data identify (illuminate) features of the large-scale precipitation fields not (well) known before. E.g, oceanic precipitation patterns, storm tracks, individual ENSO patterns.
• Global precipitation shows no significant trends over the period of record…however regional “trends” are evident in the tropics. These aren’t easily untangled from instrumental differences and differences in ENSO in the 17 (25) yr record.
• These are research data. For real-time monitoring go to CAMS-OPI or other “operational” estimates (eventually go to CMORPH).