Page 1
Spatial and temporal variation in aquatic food-web structure in the Pecos River in New
Mexico and Texas, USA
by
Jessica L. East
A Thesis
In
Wildlife, Aquatic, and Wildlands Science and Management
Submitted to the Graduate Faculty
of Texas Tech University in
Partial Fulfillment of the
Requirements for the Degree of
MASTER OF SCIENCES
Approved
Dr. Allison Pease
Chair of Committee
Dr. Timothy Grabowski
Dr. Scott Longing
Mark Sheridan
Dean of the Graduate School
May, 2015
Page 2
Copyright 2015, Jessica L. East
Page 3
Texas Tech University, Jessica L. East, May 2015
ii
Acknowledgments
This project was made possible by many moving parts. First and foremost, I
would like to thank my major advisor, Dr. Allison Pease, who has become my
professional and personal mentor. I appreciate the incredible investment she placed in my
project and professional development. My committee members have been exceptional
sources of knowledge, Dr. Tim Grabowski provided invaluable edits, and Dr. Scott
Longing spent time and energy on invertebrate identification and study design. I would
like to thank Dr. Chris Hoagstrom, Steve Davenport, Natascha Israel, and Matthew
Vanlandeghem for their expertise on the Pecos River and allowing me to tag along on
their Pecos projects. Thank you to Dr. Tom Turner, Dr. Jake Vander Zanden, Dr. Juske
Horita, and Ushio Kawai for their knowledge of the art of stable isotope sample
preparation and analyses. I would also like to thank the Clark Hubbs Scholarship
Foundation through the Texas Chapter of the American Fisheries Society for additional
funding. I appreciate the help trudging in the Orla sludge and the long days at
Independence Creek from Matthew Acre, Jared Breaux, Jordan Calvert, Andrew East,
Ashton Howe, Grant Kilcrease, Wade Massure, Jessica Pease, Allison Pease, Cassie
Vaughan, and Chris Wilcut. For what probably felt like endless hours, Chris Wilcut,
Jared Breaux, and Cassie Vaughan assisted in sample preparation in the lab; I could not
thank you enough. The staff at Bitter Lake National Wildlife Refuge and The Nature
Conservancy Preserve at Independence Creek, especially Jeff Sanchez, Floyd Truetken,
Jason and Lisa Wrinkle, and Corbin Neil were gracious enough to allow us access to the
Pecos and on-site lodging. Lastly, but quite possibly the most important, I need to thank
my husband Andrew East for becoming incredibly skilled at solving existential crises. I
could not have completed this thesis without you.
Page 4
Texas Tech University, Jessica L. East, May 2015
iii
Table of Contents
Acknowledgments .............................................................................................................. ii
Abstract .............................................................................................................................. iv
List of Tables ..................................................................................................................... vi
List of Figures ..................................................................................................................... ii
I. Introduction............................................................................................................. 1
II. Methods .................................................................................................................. 8
III. Results .................................................................................................................. 16
IV. Discussion ............................................................................................................. 40
Literature Cited ................................................................................................................. 51
Page 5
Texas Tech University, Jessica L. East, May 2015
iv
Abstract
Understanding how aquatic communities change with natural variation along
longitudinal gradients and how they respond to anthropogenic impacts is critical
for effective riverine management. In addition to natural shifts along its
continuum, the Pecos River is impacted by a variety of anthropogenic influences
that affect discharge, salinity, and riparian and instream habitat structure. I
assessed variation in main-stem river food webs by estimating carbon sources,
trophic positions, niche breadth and resource use by consumers at twelve sites
using stable isotope analysis (carbon and nitrogen). Across physiographic regions,
fish species richness, food chain length, and assemblage-wide niche breadth were
inversely related to specific conductivity. IsoError mixing models revealed
differences in sources of dietary carbon supporting fish production along the
longitudinal fluvial gradient, with a shift toward reliance on algal production in the
middle reaches of the river. Trophic niche breadth was greatest for assemblages in
less degraded sites with higher fish species richness. My analyses also suggest that
anthropogenic inputs may be enriching baseline nitrogen isotope ratios at one
study site. Across seasons, isotope signatures remained fairly constant in five
common fish species. In general, my results suggest that anthropogenic influences
in portions of the Pecos River have negative impacts on the diversity of consumers
and trophic resources in local food webs. Characterizing changes in food-web
structure in relation to natural and anthropogenic factors is important for habitat
assessment, stream restoration, and management and conservation strategies.
Page 6
Texas Tech University, Jessica L. East, May 2015
v
List of Tables
1. A subset of environmental variables measured during field surveys in summer
2013 representing local habitat variation across physiographic regions. Three-
month average discharge was estimated using data from nearest USGS flow
gages. ................................................................................................................... 17
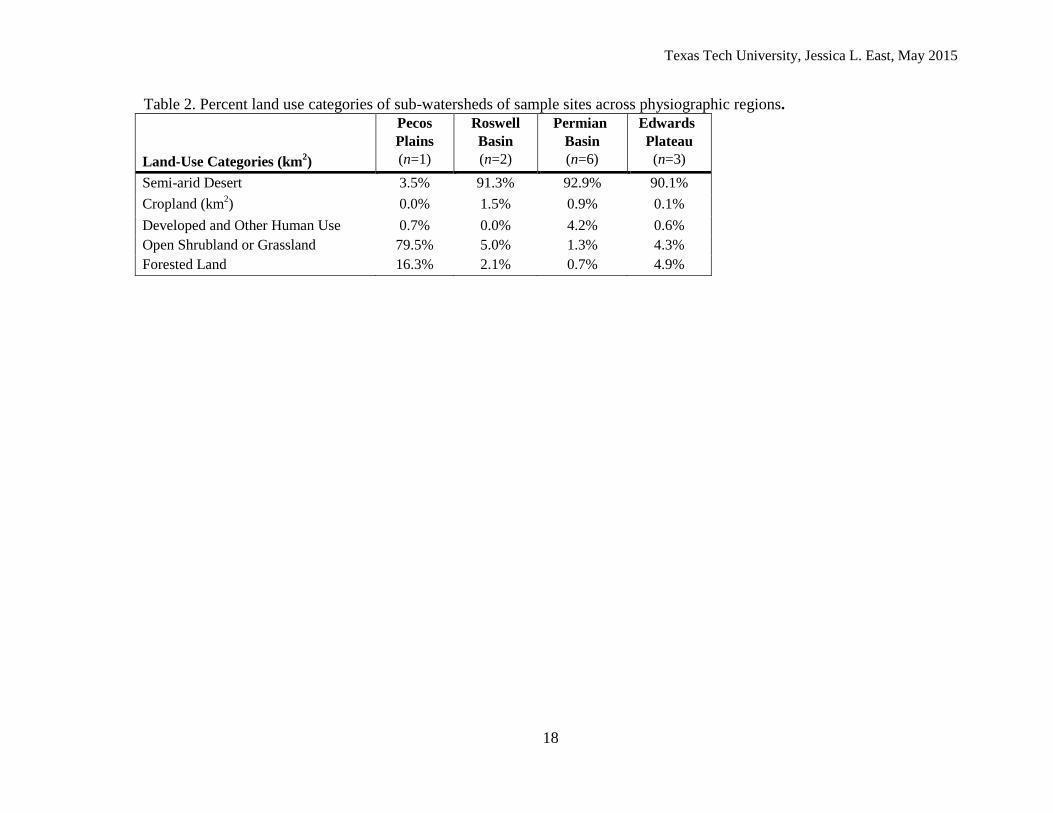
2. Percent land use categories of sub-watersheds of sample sites across
physiographic regions. ......................................................................................... 18
3. . Presence of fish species at each site across physiographic regions. .................. 20
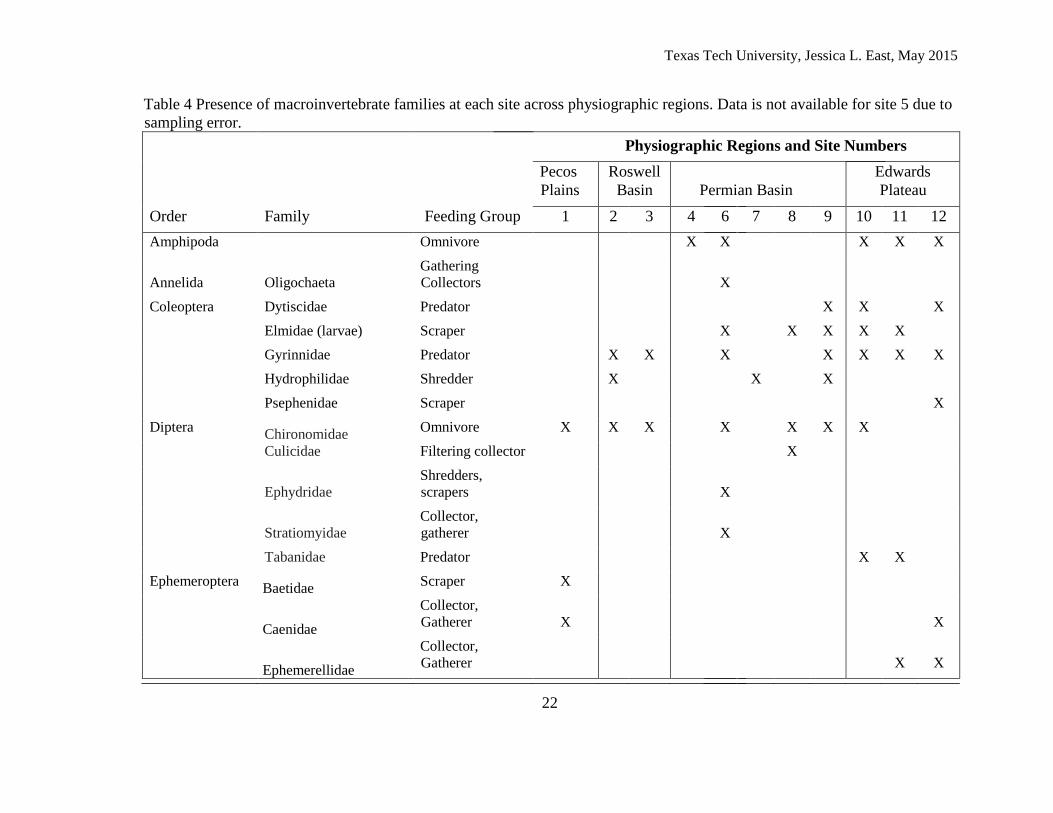
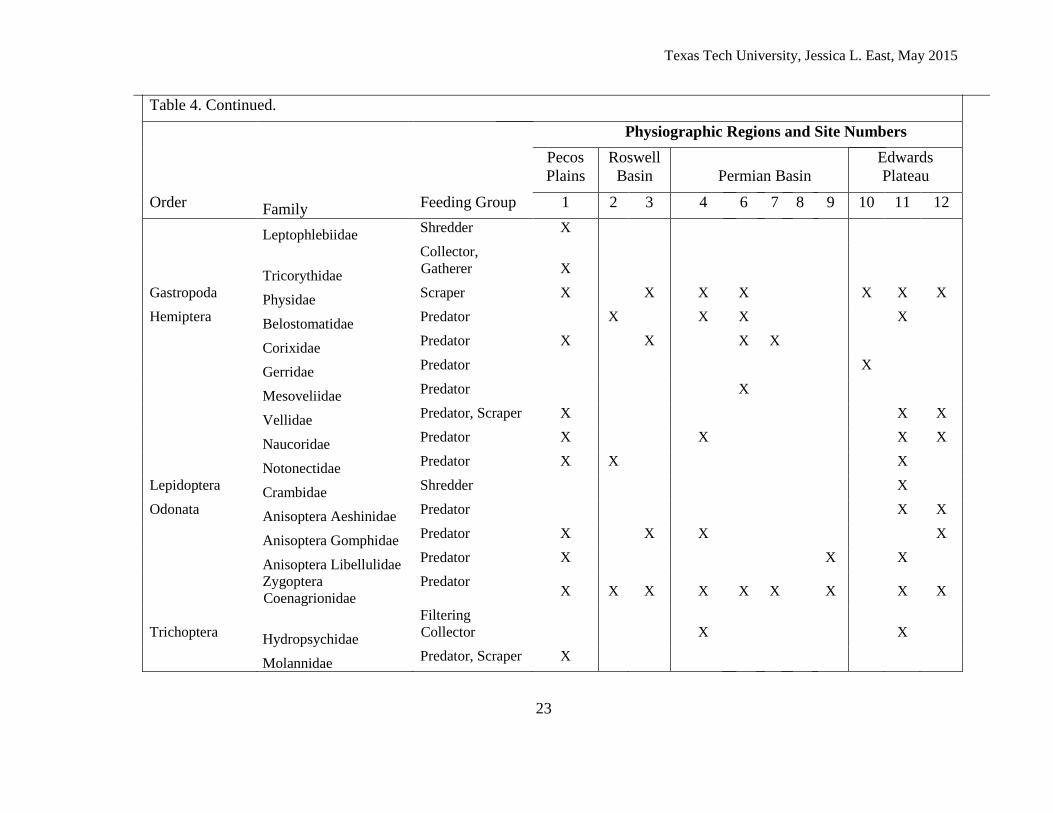
4. Presence of macroinvertebrate families at each site across physiographic regions.
Data is not available for site 5 due to sampling error. ......................................... 22
5. Mean isotopic ratios ± SE for fish species across physiographic regions. Sample
size (n) refers to number of specimens used for stable isotope analysis ............. 28
6. Mean isotopic ratios ± SE for macroinvertebrate families across physiographic
regions. Sample size (n) refers to number of specimens used for stable isotope
analysis. Families may have been present at a site (see Table 4) but not analyzed
due to cost limitations. ......................................................................................... 30
7. Community-wide metrics: nitrogen range (NR), carbon range (CR), total convex
hull area (TA), nearest neighbor distance (NND), standard deviation of NND
(NNDsd), and food-chain length (FCL) across physiographic regions ............... 36
Page 7
Texas Tech University, Jessica L. East, May 2015
vi
List of Figures
1. Map of study area. Study sites are designated by shaded circles. Shades represent the
physiographic regions within the Pecos Basin.................................................................. 10
2. Longitudinal trends for fish species richness and specific conductivity. Sites are
placed in longitudinal order (upstream-downstream) from left to right. The black
line indicates specific conductivity (μS/cm) and the color of species richness bars
indicate physiographic region. ........................................................................................... 24
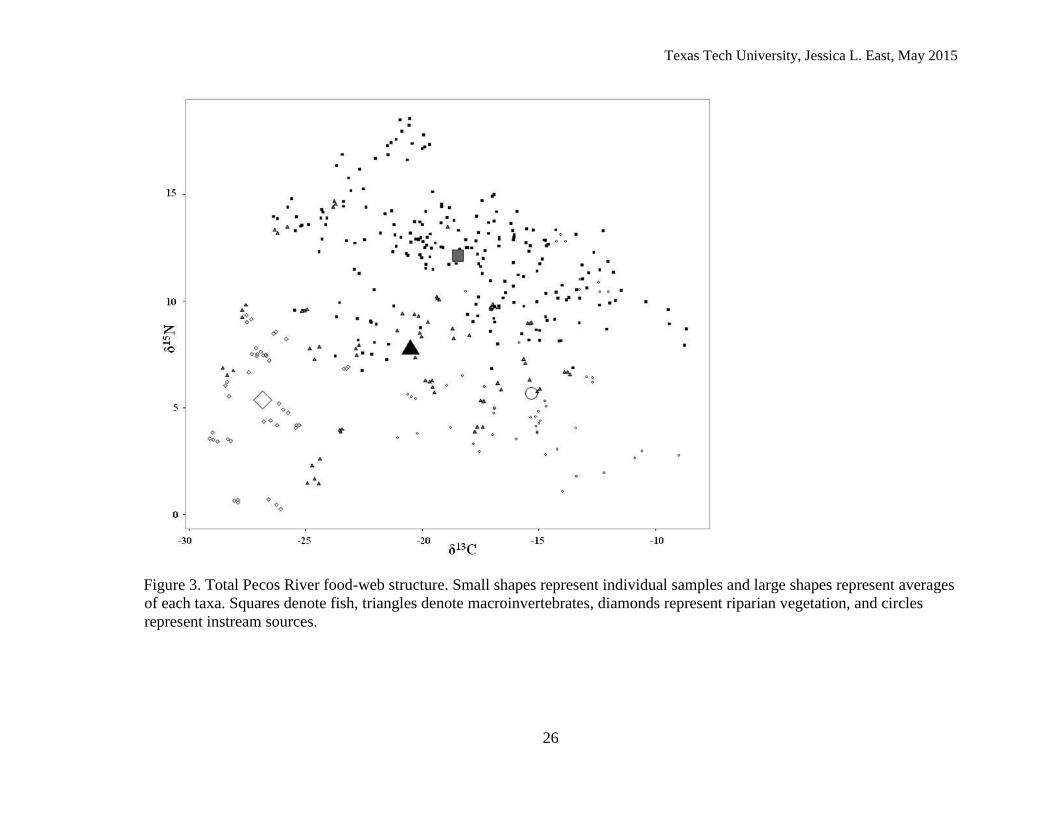
3. Total Pecos River food-web structure. Small shapes represent individual samples and
large shapes represent averages of each taxa. Squares denote fish, triangles denote
macroinvertebrates, diamonds represent riparian vegetation, and circles represent
instream sources. ............................................................................................................... 26
4. Mean isotopic ratios with standard error bars of fishes across the Pecos River. Species
codes are the same as listed in Table 3. ............................................................................ 31
5. Proportions of carbon sources derived from ISOError two-source mixing model. Plot
A is the basal carbon sources of fishes and Plot B is macroinvertebrate carbon sources. The sources are listed in a longitudinal gradient, with dotted lines delineating
change in physiographic region ..........................................................................................33
6. Isotope biplots of sample sites in longitudinal order, site 1 is in the Pecos Plains physiographic region, sites 2-3 are in the Roswell Basin, sites 4-9 are in the Permian Basin, and sites 10-12 are in the Edwards Plateau. Dark symbols represent consumers
and white symbols represent producers. The squares represent all fishes at a site,
triangles represent invertebrates, diamonds indicate riparian trees, and circles
represent instreamproducers. ............................................................................................. 35
7. Simple linear regression of specific conductivity for each site against food chain length
(R2=0.391, p-value=0.02). ................................................................................................ 37
8. Total convex hulls of each physiographic region calculated from consumer ratios from
each site. ............................................................................................................................ 38
9. Seasonal variation found in fish species at site 3 near Artesia, NM. Different color
squares indicate species, general trends across species appear to have enriched nitrogen
ratios in the spring and summer compared to fall and spring. .......................................... 39
Page 8
Texas Tech University, Jessica L. East, May 2015
vii
10. Seasonal variation found in fish species at site 11 downstream of the confluence of
Independence Creek. Difference color squares indicate different species, general trend is
a broadening of carbon signatures in summer and fall compared to tighter clustering in
the winter and spring ......................................................................................................... 39
Page 9
Texas Tech University, Jessica L. East, May 2015
1
Chapter I
Introduction
Understanding and predicting how aquatic communities change with natural
variation along longitudinal gradients, and how they respond to anthropogenic impacts, is
critical for effective riverine management. As such, elucidating the complex interactions
influencing stream ecosystem food-web structure, including linkages between landscape
features, local abiotic conditions, and biotic assemblages, remains one of the main
challenges confronting stream ecologists (Richards, Johnson & Host, 1996). Natural
variation in river ecosystems is influenced by climate, basin geology, topography, and
vegetation, which interact at multiple spatial and temporal scales (Poff & Ward, 1990;
Bunn & Arthington, 2002; Olden, 2010).
Variation in food-webs along natural longitudinal gradients
Stream systems are organized as nested hierarchies whereby larger-scale abiotic
factors (e.g, surficial geology, climate, land use) constrain the structural and dynamic
organization of local-scale physical habitat elements (e.g, geomorphology,
physicochemistry), which may in turn regulate biological communities (Frissell et al.
1986, Poff 1997). Fish and macroinvertebrate communities are expected to shift along the
longitudinal gradient as the presence and distribution of riffles, runs, and pools changes
(Schlosser, 1987) and substrate composition shifts (Berkman & Rabeni, 1987; Pease et
al., 2011) along with changes in temperature, conductivity, turbidity, and instream cover
(Montgomery, 1999; Fischer & Paukert, 2008).
Traditional models have described the spatial and temporal shifts in basal carbon
sources of riverine food webs as a function of stream canopy cover, stream width,
connectivity, productivity, and the magnitude and timing of flooding of energy rich
Page 10
Texas Tech University, Jessica L. East, May 2015
2
riparian areas (Vannote et al., 1980; Ward & Stanford, 1983; Junk, Bayley & Sparks,
1989; Thorp & Delong, 1994). According to the river continuum concept (Vannote et al.,
1980), allochthonous inputs contribute more energy to the upper reaches of streams and
as the river widens, a shift to autochthonous inputs occurs with decreases in canopy
cover. However, lower reaches can have similar contributions of autochthonous and
allochthonous carbon as the depth of the photic zone decreases. In floodplain rivers, the
flood pulse concept (Junk, Bayley & Sparks, 1989) describes how regular, highmagnitude
flooding allows carbon from the energy-rich floodplain to be available to the aquatic food
web, making the shift from allochthonous to autochthonous less distinct. Previous
studies of fish communities along longitudinal gradients have shown that addition of
species and functional feeding groups should be expected from upstream to downstream
and should correlate with an increase in ecosystem size (e.g., Schlosser, 1987; Rahel &
Hubert, 1991; Pease et al., 2012).
Natural seasonal variation in riverine systems
Seasonal variation in habitat characteristics, resource availability, and fish and
invertebrate communities also influences food-web structure in rivers (Winemiller, 1990;
Closs & Lake, 1994; Zeug & Winemiller, 2008). Rivers of the US Great Plains have
pronounced variation in habitat characteristics associated with natural flood-drought
cycles (Poff et al., 1997; Dodds et al., 2004). The contribution of autochthonous and
allochthonous sources also varies with flooding and seasonal drying (Pease et al., 2006;
Zeug & Winemiller, 2008). Seasonality can restructure food webs as consumers are able
to capitalize on shifting availability of food sources. In seasons with greater availability
Page 11
Texas Tech University, Jessica L. East, May 2015
3
and diversity of prey items, some consumers may move up a trophic level (Hoeinghaus et
al., 2003; Deus & Petrere-Junior, 2003).
Anthropogenic influences on Southwestern rivers
In lotic systems, anthropogenic disturbances influence local and landscape-scale
abiotic factors by disrupting the hierarchy of natural variables which drive stream
ecosystems (Poff et al., 1997; Allan, 2004). Studies of altered rivers and streams have
shown that anthropogenic factors disrupt the natural longitudinal patterns of food-web
structure in relation to consumer diversity (Wang, Lyons & Kanehl, 2001; Allan, 2004),
alter basal resource use and availability (Power, Dietrich & Finlay, 1996; Bunn, Davies &
Winning, 2003; Burford et al., 2008), and enrich nitrogen isotopic ratios (DeBruyn,
Marcogliese & Rasmussen, 2003; Anderson & Cabana, 2005; Winemiller et al., 2011).
The Pecos River lies at the southwestern edge of the Great Plains in New Mexico
and Texas and is an example of a highly altered freshwater system. The Pecos River is
affected by threats common to rivers in semi-arid regions including altered flow regime
and watershed land use (e.g., agricultural, urban, potash mining, and oil and gas drilling),
which also can increase the salinity of the system (Hoagstrom, 2009; Linam &
Kleinsasser, 1996; Williams, 2001).
Stream ecosystems in the North American Great Plains and arid Southwestern U.S.
regions display natural “boom and bust” flow variability (Thoms & Sheldon, 2002)
which is sensitive to flood-pulse alterations. Inhibition of these floods via dams has led to
surface-flow intermittence and homogenization of habitat via channel incision
(Hoagstrom, 2009). For example, when the storage capacities of reservoirs are greater
than the runoff rates, as in the arid Southwest, downstream flows can be reduced up to
100% (Graf, 1999) which reduces connectivity. Reduced habitat availability with
Page 12
Texas Tech University, Jessica L. East, May 2015
4
diminished flow can decrease local consumer diversity and prevent access to riparian
resources by aquatic species (Bunn, Davies & Winning, 2003; Dekar & Magoulick,
2007; Bogan, Boersma & Lytle, 2013). These impacts, coupled with increased
sedimentation and altered temperature regimes, can lead to shifts in species richness and
local assemblage structure (Ward & Stanford, 1983; Allan & Castillo, 2007). For
example, an increase in sediment can cause a shift in invertebrates assemblages towards
burrowing taxa, making them less accessible to predators (Suttle et al., 2004).
Downstream of dams, a decrease in the flux of nutrients can shift the sources of primary
production (Winemiller et al., 2011), and a decrease in total suspended solids can lead to
loss of species that are adapted to a sediment-rich and turbid conditions, triggering a
decline in biodiversity (Ward & Stanford, 1983; Kummu & Varis, 2007). According to
the Serial Discontinuity Concept (Ward & Stanford, 1983), position of impoundments
along the longitudinal gradient can influence multiple abiotic and biotic parameters. The
presence of seven major dams and other flow alterations (abstractions, diversions) along
the Pecos River likely has affected aquatic food-web structure via the mechanisms
described above.
Agricultural and urban land-use practices may influence aquatic food-web
structure by increasing nutrient and sediment loads to streams, decreasing aquatic
consumer diversity, reducing availability of riparian vegetation and woody debris, and
alteration of flows (Wang et al., 1997; Quinn, 2000; Wang, Lyons & Kanehl, 2001;
Stepenuck, Crunkilton & Wang, 2002; Allan, 2004; Yuan & Miyamoto, 2005;
Hoagstrom, 2009; Marzin, Verdonschot & Pont, 2013). Additional nutrient loads
increase autotrophic biomass and production, and have been shown to shift consumer
assemblages, reduce biodiversity, and disrupt natural ecosystem functions (Allan, 2004;
Page 13
Texas Tech University, Jessica L. East, May 2015
5
Anderson & Cabana, 2005). An increase of sedimentation to a stream has been shown to
cause a decrease in primary production by causing bottom-up effects through food webs
as it fills interstices of benthic substrate. Filling of interstitial habitat influences fish and
invertebrate community structure as it coats gills and respiratory surfaces, increases
turbidity, scouring, and abrasion (Allan, 2004). Portions of the Pecos watershed have
been converted for water-intensive row crops (National Land Cover Database, 2011),
using the river as a source for irrigation. Large dairy farms are present in parts of the
watershed in New Mexico, possibly contributing increased nutrients to the system (J.L.
East, observation, April 2013). While urban land cover is not extremely high in the
region, studies have shown that a relatively low amount of impervious surfaces can have
large impacts on riverine ecosystems (Wang et al., 1997; Wang, Lyons & Kanehl, 2001).
The dominant source of impervious surfaces in the Pecos watershed comes from the
infrastructure associated with mining, oil, and gas production in the region including,
roads and pump-jack platforms (J.L. East, observation, April 2013).
Increased salinity associated with anthropogenic change is a concern in many
river ecosystems (Cañedo-Argüelles et al., 2013; Williams, 2001). Naturally occurring
salinity in rivers is the result of climate, catchment geology, distance from the ocean,
topography, and vegetation (Cañedo-Argüelles et al., 2013). Agriculture increases
salinity by replacing natural, deep-rooted vegetation with shallow-rooted species, thus
increasing saline wastewater discharge to the rivers (Williams, 2001). Irrigation for
agriculture also affects salinity of nearby rivers as crops tend to absorb only a small
portion of the salt in water while the rest returns to the river channel via runoff. Diversion
of inflows for irrigation also increases evapotranspiration leading to a higher salinity
(Cañedo-Argüelles et al., 2013; Hoagstrom, 2009). Increased salinity can have dramatic
Page 14
Texas Tech University, Jessica L. East, May 2015
6
impacts on the diversity and function of a system (Brock, Nielsen & Crossle, 2005). One
such impact is a shift to a more simplified euryhaline food web (Cañedo-Argüelles et al.,
2013; Dickman & Gochnauer, 1978). It can also increase growth of bacteria (Dickman &
Gochnauer, 1978), decrease invertebrate abundance (Carver et al., 2009), and reduce fish
diversity (Ostrand & Wilde, 2002). The natural salinity in the Pecos River is attributed to
saline strata which underlie much of the watershed and saline springs which feed into the
main channel (Hoagstrom, 2009). Frequent floods, historically part of the Pecos flow
regime, would have diluted streamflows and facilitated salt export from the area.
Anthropogenic salinization in the Pecos River has been associated with flow alteration
from dams and water extraction, agricultural practices, and mining, oil, and gas
wastewater (Hoagstrom, 2009).
Assessing changes in food-web structure with stable isotope analysis
Characterizing spatial and temporal changes in food-web structure in relation to
environmental gradients altered by anthropogenic factors is important for habitat
assessment, stream restoration, and conservation strategies. Stable isotope analysis has
been widely adopted as a useful tool to characterize changes in trophic positions in food
webs, resource acquisition, and amount of niche space occupied by assemblages
(Boecklen et al., 2011). Ratios of stable carbon (δ13
C) can be used to infer basal
production sources, while nitrogen (δ15
N) isotopes indicate trophic position of consumers
within a food-web (Fry, 2006). Isotope ratios have been used extensively to examine
individual and population-level responses to physiochemical variation and biotic
interactions that influence community structure across complex ecotones, such as
Page 15
Texas Tech University, Jessica L. East, May 2015
7
longitudinal fluvial gradients, freshwater-marine transitions in estuaries, and shifts in
anthropogenic influences within the watershed (Anderson & Cabana, 2005; Gido,
Franssen & Propst, 2006; Winemiller et al., 2011).
The objectives of this study were to (1) examine differences in taxonomic and
functional structure of fish and invertebrate assemblages across multiple environmental
gradients along the Pecos River (2) estimate changes in aquatic food-web structure
related to natural physiography and anthropogenic impacts across the basin and (3)
examine seasonal variation in aquatic food-web structure at a subset of reaches. In
accordance with the RCC and studies relating aquatic diversity with habitat size, I
expected to see an increase in consumer diversity from upstream to downstream sites, but
previous studies have shown that anthropogenic factors can lead to deviations from this
expected pattern (Delong & Brusven, 1998; Cheek & Taylor, 2015). Additionally, I
expected sources of carbon to shift from greater relative importance of allochthonous
carbon in upstream sites with gradually increasing contribution of autochthonous carbon
downstream (Vannote et al., 1980). Similar to other North American Great Plains rivers, I
expected to see temporal shifts in food-web structure with changes in availability of
carbon sources and prey items (Pease et al., 2006; Zeug & Winemiller, 2008).
Page 16
Texas Tech University, Jessica L. East, May 2015
8
Chapter II
Methods
Study region
The Pecos River flows for 1480 km through Texas and New Mexico. The river
begins in the mid-elevation conifer forests of the Sangre de Cristo Mountains in
northcentral New Mexico and flows south-southeast approximately 672 km before its
confluence with the Rio Grande in Texas. It is the largest tributary of the Rio Grande,
with a drainage area of approximately 115,000 km2, and contributes high levels of
salinity when entering Lake Amistad near Langtry, Texas (Jensen et al., 2006; Gregory &
Hatler, 2008). Below the Sangre de Cristo Mountains, the Pecos River enters the Great
Plains where it flows through four main geographic regions: the Pecos Plains, Roswell
Basin, Permian Basin, and the Edwards Plateau (Fiedler & Nye, 1933; Head & Orcutt,
2002; Hoagstrom, 2009) (Figure 1). The river is impounded by seven large dams on the
main stem and many smaller low-head irrigation dams (Yuan & Miyamoto, 2008).
Salinity of the Pecos River in some segments is far higher than historical levels mainly
because of irrigation, increased evapotranspiration, and flood suppression (Hoagstrom,
2009). Much of the natural stream flow in the upper portion of the river is derived from
springs and spring snow melt which is then captured in the Santa Rosa Reservoir in New
Mexico (Hatch, Baltosser & Schmitt, 1985; Yuan & Miyamoto, 2008). The river
perennially meanders through a broad, sandy valley in the Roswell Basin, with low
discharge controlled by Fort Sumner Dam releases, groundwater inflows and treated
wastewater returns (Hoagstrom, Brooks & Davenport, 2008). Natural salinity in this
region is derived from brine aquifer discharge near New Mexico-Texas border. In the
Permian Basin the channel is wide, discharge is low, and the salinity is high as flows are
Page 17
Texas Tech University, Jessica L. East, May 2015
9
derived from irrigation returns, minimal releases from dams, and a small amount is
contributed by seeps and springs between Red Bluff Dam and Girvin, TX (Hoagstrom,
2009). The river then flows through the limestone canyons of the Edwards Plateau,
where the influence of freshwater springs and tributaries, the largest of which,
Independence Creek (watershed area of ~1976 km2), greatly increases discharge while
decreasing salinity levels (Linam & Kleinsasser, 1996; Hoagstrom, 2009).
Page 18
Texas Tech University, Jessica L. East, May 2015
10
Figure 1. Map of study area. Study sites are designated by shaded circles. Shades represent the physiographic
regions within the Pecos Basin.
Page 19
Texas Tech University, Jessica L. East, May 2015
11
Field data collection
In June and July 2013, twelve sites were sampled in the main stem of the Pecos
River: one site in the Pecos Plains region, two in the Roswell basin, six in the Permian
Basin and three in the Edwards Plateau (Figure 1.1). Five sites were resampled
seasonally, two in the Roswell Basin, two in the Permian Basin, and one in the Edwards
Plateau region. Each sample reach was approximately 150 m in length.
Temperature, pH, dissolved oxygen, and specific conductance were measured at
each site using an EXO1 multi-probe sonde (Yellow Springs Instruments, Yellow
Springs, Ohio). Reach-wide characteristics of number of riffles and maximum pool depth
were taken at each study site. Additional environmental variables were assessed using
one to four habitat transects, 50 m apart, at each site. Transects spanned the width of the
river and were chosen to represent the variety of mesohabitats across the reach. Variables
measured at each transect included in-stream cover, wetted width, depth and flow
velocity profile, canopy cover, bank slope, substrate composition, riparian buffer width,
and composition of riparian vegetation. Percent land cover was calculated using ArcGIS
10.1 for USGS cataloging hydrologic unit (subwatershed scale). Land-cover types were
classified under five categories: cropland, developed and other human use, open
shrubland-grassland, forested land, or semi-arid desert using the publicly available
National Land Cover Database (NLCD) for 2011 (http://www.mrlc.gov/nlcd2011.php3).
Macroinvertebrates were collected using a 500 µm mesh kick net and a 500 µm
mesh Surber sampler. Riparian vegetation, aquatic macrophytes, and multicellular benthic
algae were grab sampled to obtain a representative sample of the most abundant taxa in
each reach. In sites where rocks were present (in the Pecos Plains and Edwards Plateau),
a representative sample of periphyton was scraped from the rocks. Fishes were collected
Page 20
Texas Tech University, Jessica L. East, May 2015
12
using a 1.8 m by 6.1 m, 4.8 mm braided cotton mesh seine. Number of seine hauls was
determined by species composition of hauls, with a minimum of five 5-m seine hauls per
reach until no new species were captured. In reaches where deep pools were present,
experimental gill nets, trotlines, and angling were used for supplemental sampling of
large-bodied fishes. Fishes were identified, counted, and either released or euthanized in
MS-222. White muscle tissue free of bone, scales, or exoskeletal fragments was used for
stable isotope analysis of consumers. Macroinvertebrates were placed in a cooler with
water for 10-12h to clear gut contents and then placed on ice for transport to lab where
they were identified to the taxonomic level of family. Three replicate grab samples of
algae, aquatic macrophytes (where present), and riparian vegetation from each site were
preserved on ice for transport to the lab and identified to lowest taxonomic level possible.
All tissue samples were placed on dry-heat sterilized Petri dishes and desiccated in a
drying oven at 60˚C for 48h and then ground into fine powder with a mortar and pestle.
Composite samples of similar sized small fish and macroinvertebrate specimens per
family were used to ensure adequate sample mass.
To assess temporal variation, five common fish species, Cyprinella lutrensis (Red
Shiner), Cyprinodon variagatus X Cyprinodon pecosensis hybrid (Sheepshead Minnow X
Pecos Pupfish), Fundulus grandis (Gulf Killifish), Lucania parva (Rainwater Killifish),
and Gambusia affinis (Western Mosquitofish), were also sampled seasonally in October
2013, February 2014, and April 2014 at a subset of sites (Sites 2, 3, 5, 9, 11) and prepared
for stable isotope analysis as described above.
Stable isotope analyses
Page 21
Texas Tech University, Jessica L. East, May 2015
13
Fish, macroinvertebrate, riparian and instream vegetation samples were weighed in
tin capsules (Costech Analytical Technologies Inc., Valencia, CA) prior to analysis of
carbon and nitrogen isotope ratios at the Laboratory for Stable Isotope Geochemistry,
Department of Geosciences, Texas Tech University (TTU), or University of Wyoming
Stable Isotope Facility (UWYOSIF), depending on Delta V (TTU) or ThermoFinnigan
Delta Plus (UWYOSIF) mass spectrometer instrument availability. Ratios of stable
isotopes were reported in parts per thousand (‰ or per mil) in standard delta (δ) notation.
The δ-values were computed as:
δ13
C or δ15
N = [(Rsample/Rstandard)-1] x 1000
where R is equal to 13
C/12
C or 15
N/14
N (Fry, 2006; Sharp, 2007). Pee Dee Belemnite
limestone was used as the standard for the carbon isotopes, and atmospheric nitrogen for
the nitrogen standard.
Bi-plots of mean δ13
C/δ15
N signatures of consumers were used to identify general
patterns of variation according to site, consumer species or family, season, and
physiographic region. Trophic position of consumers was calculated using the formula
from Vander Zanden and Rasmussen (2001), with primary consumers as baseline trophic
position (λ=2).
Trophic Positionconsumers = (δ15Nconsumer- δ15Nbaseline)/3.4+λ
Sources of carbon used by consumers were divided into instream (autochthonous)
and riparian (allochthonous ) sources to determine the percent contribution of each
production source. Mean δ13
C values for common instream autotrophs (Chara algae and
submerged macrophytes) made up the autochthonous sources, and mean δ13
C values for
common riparian trees and shrubs (Salix nigra, Prosopis spp. and Tamarix spp.) were
Page 22
Texas Tech University, Jessica L. East, May 2015
14
used for allochthonous carbon sources. Along with the δ13
C ratios for the instream and
riparian carbon sources, δ13
C signatures for fishes and macroinvertebrates were pooled
and averaged per site and analyzed using a two-source single isotope mixing model,
ISOERROR 1.04 (Phillips & Gregg, 2001). The model uses consumer isotopic values to
estimate proportions of allochthonous and autochthonous basal resources supporting
secondary production.
I calculated site-specific, stable-isotope-based community metrics to quantify
variation in trophic structure among sites (Layman et al., 2007). I calculated the
following four metrics to describe trophic diversity based on the δ13
C- δ15
N bi-plots, with
metrics serving as a proxy for niche space: range in δ13
C (CR), range in δ15
N (NR), total
area (TA), and mean distance to centroid (CD). These metrics were calculated using the
mean 13
C and 15
N ratios of fish species at each site. CR is a measure of basal δ13
C
variation; theoretically, a larger range indicates greater basal resource availability. NR
represents the magnitude of vertical structure within a food web in relation to the δ15
N
values of a baseline specific to each sample site. In this study I used macroinvertebrates
classified as either shredders (Coleoptera Elmidae larvae, Coleoptera Hydrophilidae
larvae, and Ephemeroptera Tricorythidae) or scrapers (Gastropoda Physidae) as the
baseline at each site depending on availability. To measure the extent of trophic diversity
across both axes (carbon and nitrogen), total area of the convex hull in Euclidean space
(TA) was compared across sites. Trophic redundancy was measured using nearest
neighbor distance (NND) and standard deviation of nearest neighbor distance (SDNND).
Food chain length (FCL) was calculated for each site using a trophic position (λ) of 2.0 as
a baseline for primary consumers (Vander Zanden & Rasmussen, 1999):
Page 23
Texas Tech University, Jessica L. East, May 2015
15
FCL = (δ15Ntop predator - δ15Nbaseline)/3.4+λ
As with NR calculation above, I used shredders and scrapers as a baseline across
sites, with the exception of site 5, where no shredders were collected where we
substituted a filterer-collector taxon, Hydropychidae (Trichoptera). In this case δ15
N
values were deemed appropriate for baseline values as they were between producers and
secondary consumers. Simple linear regression was used to determine relationships
between community-wide metrics and environmental variables.
Page 24
Texas Tech University, Jessica L. East, May 2015
16
Results
Abiotic factors at the watershed and local reach scale varied along the longitudinal
gradient. Specific conductivity was lowest in the Pecos Plains and Edwards Plateau
regions, while peaking in the Permian Basin (Table 1). Discharge was lowest in the
Roswell Basin, and highest in the Edwards Plateau. Dominant substrate was sand in
Pecos Plains and Roswell Basin, mud/silt in the Permian Basin, and cobble/bedrock in the
Edwards Plateau. Land-cover analysis revealed semi-arid desert as the dominant land
cover type across all sub-watersheds except for the Pecos Plains where shrub and
grassland was dominant (Table 2). The Roswell Basin had the most agriculture vegetation
cover of the four regions, the Permian Basin had the most developed or anthropogenically
disturbed land cover. The Edwards Plateau had the greatest variety of land-cover types.
Page 25
Texas Tech University, Jessica L. East, May 2015
17
Table 1. A subset of environmental variables measured during field surveys in summer 2013 representing local habitat
variation across physiographic regions. Three-month average discharge was estimated using data from nearest USGS flow
gages.
Site Name
Site
No.
Specific
Conductivity
(μS/cm)
3-month
Average
Discharge
(m3/s)
Instantaneous
Discharge
(m3/s)
Dominant
Substrate
Tamarix
spp.
Abundant
Max
Depth
(cm)
No.
Riffles
in
Reach
Presence of
Aquatic
Macrophytes
Pecos Plains
Santa Rosa, NM
Roswell Basin
BLNWR, NM
1
2
149 0.207 0.68 Sand N 45.9 1 Common
31575 1.070 0.056 Sand Y 54.4 0 Absent
Artesia, NM
Permian Basin
Loving, NM
3
4
15835 1.383 1.051 Sand Y 150 0 Absent
9352 0.575 1.362 Cobble N 46.5 2 Common
Orla, TX 5 34499 0.001 0.000 Mud/Silt Y 67 0 Common
Coyanosa, TX 6 29690 0.066 0.374 Mud/Silt Y 60.8 1 Common
FM1053, TX 7 32373 0.344 Mud/Silt Y 45.4 1 Common
Girvin, TX 8 39370 0.266 3.112 Mud/Silt Y 80.1 1 Common
Iraan, TX
Edwards
Plateau
I-10 Bridge, TX
9
10
13769 0.288 Cobble Y 72.1 3 Abundant
13568 0.430 Cobble Y 91.5 0 Common
Independence
Crk Confl., TX 11 5221 0.298 6.594 Cobble N >200 2 Rare
Pandale, TX 12 3805 1.597 18.449 Bedrock N 48.8 4 Rare
Page 26
Texas Tech University, Jessica L. East, May 2015
18
Table 2. Percent land use categories of sub-watersheds of sample sites across physiographic regions.
Land-Use Categories (km2)
Pecos
Plains
(n=1)
Roswell
Basin
(n=2)
Permian
Basin
(n=6)
Edwards
Plateau
(n=3)
Semi-arid Desert 3.5% 91.3% 92.9% 90.1%
Cropland (km2) 0.0% 1.5% 0.9% 0.1%
Developed and Other Human Use 0.7% 0.0% 4.2% 0.6%
Open Shrubland or Grassland 79.5% 5.0% 1.3% 4.3%
Forested Land 16.3% 2.1% 0.7% 4.9%
Page 27
Texas Tech University, Jessica L. East, May 2015
19
A total of thirty fish species were collected from the 12 sample reaches; of these
species, six were non-native: Fundulus grandis, Hybognathus placitus, Cyprinella
venusta, Cyprinus carpio, Lepomis auritus, and Cyprinodon hybrids. No species was
present at all sites, but Menidia beryllinia and Cyprinodon hybrids were found at eight
sites, all downstream of Brantley Dam, NM. Hybognathus placitus was collected
exclusively in the Roswell Basin, at Bitter Lake National Wildlife Refuge. Cyprinella
proserpina was observed only in the Edwards Plateau at sites downstream of the
Independence Creek confluence. Larger-bodied fishes like Polydictis olivaris,
Micropterus salmoides and Lepisosteus osseus were collected only in the Edwards
Plateau (Table 3). The most abundant fish species in the Permian Basin was the
Cyprinodon hybrid which comprised 48.6% of total catch. Cyprinella proserpina, a
vulnerable species in Texas, was the most abundant species collected in the Edwards
Plateau. Fundulus grandis, C. lutrensis, and Gambusia affinis were the most abundant
species in the Roswell Basin. Fish species richness at sites ranged from four to 15 and
was negatively associated with specific conductivity (Figure 2). Thirty-two invertebrate
families were collected from 11 sample reaches. One site (Site 5) was excluded from
analysis of invertebrate diversity due to inadequate sampling. Order Ephemeroptera was
collected exclusively in the Edwards’s Plateau, the non-native gastropod (Physidae) was
present at seven sites, and the most common macroinvertebrate families were Elmidae
(Coleoptera) and Coenagrionidae (Odonata). Macroinvertebrate family diversity was
highest in the Edwards Plateau and lowest in the Roswell Basin (Table 4.) Invasive,
nonnative saltcedar (Tamarix spp.) was abundant in the riparian zones at eight of the 12
reaches.
Page 28
Texas Tech University, Jessica L. East, May 2015
20
Table 3. . Presence of fish species at each site across physiographic regions.
Physiographic Regions and Site Numbers
Species
Code
Pecos
Plains
Roswell
Basin Permian Basin
Edwards
Plateau
Family Species 1 2 3 4 5 6 7 8 9 10 11 12
Atherinopsidae Menidia beryllina MENBER X X X X X X X
Catostomidae Carpoides carpio CARCAR X
Catostomus commersoni CATCOM X
Moxostoma congestum MOXCON X X
Centrarchidae Lepomis auritus LEPAUR X X
L. cyanellus LEPCYA X
Micropterus salmoides MICSAL X X X
Characidae Astyanax mexicanus ASTMEX X X X X
Cichlidae Herichthys cyanoguttatus HERCYA X
Clupeidae Dorosoma cepedianum DORSEP X
Cyprinidae Cyprinus carpio CYPCAR X X
Cyprinella lutrensis CYPLUT X X X X X X
Cyprinella proserpina CYPPRO X X
Cyprinella venusta CYPVEN X
Dionda episcopa DIOEPI X
Hybognathus placitus HYBPLA X
Notropis amabolis NOTAMA X X
N. stramineus NOTSTR X X
Page 29
Texas Tech University, Jessica L. East, May 2015
21
Table 3 Continued.
Physiographic Regions and Site Numbers
Pecos
Plains
Roswell
Basin Permian Basin
Edwards
Plateau
Family Species
Species
Code 1 2 3 4 5 6 7 8 9 10 11 12
Pimephales promelas PIMPRO X X
P. vigilax PIMVIG X X
Cyprinodontidae Cyprinodon hybrid CYPSPP X X X X X X X X
Fundulidae Fundulus grandis FUNGRA X X X X X X X
F.zebrinus FUNZEB X X X X X X X X X
Lucania parva LUCPAR X X X X X X
Ictaluridae Ictalurus punctatus ICTPUN X X
Pylodictis olivaris PYLOLI X
Lepisosteidae Lepisosteus osseus LEPOSS X
Poeciliidae Gambusia affinis GAMAFF X X X X X
Page 30
Texas Tech University, Jessica L. East, May 2015
22
Table 4 Presence of macroinvertebrate families at each site across physiographic regions. Data is not available for site 5 due to
sampling error.
Physiographic Regions and Site Numbers
Pecos
Plains
Roswell
Basin Permian Basin
Edwards
Plateau
Order Family Feeding Group 1 2 3 4 6 7 8 9 10 11 12
Amphipoda Omnivore X X X X X
Annelida Oligochaeta
Gathering
Collectors X
Coleoptera Dytiscidae Predator X X X
Elmidae (larvae) Scraper X X X X X
Gyrinnidae Predator X X X X X X X
Hydrophilidae Shredder X X X
Psephenidae Scraper X
Diptera Chironomidae
Omnivore X X X X X X X
Culicidae Filtering collector X
Ephydridae
Shredders,
scrapers X
Stratiomyidae
Collector,
gatherer X
Tabanidae Predator X X
Ephemeroptera Baetidae
Scraper X
Caenidae
Collector,
Gatherer X X
Ephemerellidae
Collector,
Gatherer X X
Page 31
Texas Tech University, Jessica L. East, May 2015
23
Table 4. Continued.
Physiographic Regions and Site Numbers
Pecos
Plains
Roswell
Basin Permian Basin
Edwards
Plateau
Order Family Feeding Group 1 2 3 4 6 7 8 9 10 11 12
Leptophlebiidae Shredder X
Tricorythidae
Collector,
Gatherer X
Gastropoda Physidae
Scraper X X X X X X X
Hemiptera Belostomatidae
Predator X X X X
Corixidae Predator X X X X
Gerridae Predator X
Mesoveliidae Predator X
Vellidae Predator, Scraper X X X
Naucoridae Predator X X X X
Notonectidae Predator X X X
Lepidoptera Crambidae
Shredder X
Odonata Anisoptera Aeshinidae
Predator X X
Anisoptera Gomphidae Predator X X X X
Anisoptera Libellulidae Predator X X X
Zygoptera
Coenagrionidae
Predator X X X X X X X X X
Trichoptera Hydropsychidae
Filtering
Collector X X
Molannidae Predator, Scraper X
Page 32
Texas Tech University, Jessica L. East, May 2015
24
Figure 2. Longitudinal trends for fish species richness and specific conductivity. Sites are placed in longitudinal order
(upstream-downstream) from left to right. The black line indicates specific conductivity (μS/cm) and the color of species
richness bars indicate physiographic region.
Page 33
Texas Tech University, Jessica L. East, May 2015
25
Isotopic signatures of consumers across the longitudinal gradient
Across sites, fishes occupied a large space on the δ13C axis (-25.5 to -8.68‰, n =
224; Figure 3). Similarly, macroinvertebrates occupied a large range on δ13C axis (-28.6 to -
13.7‰, n = 70) across the Pecos River. Instream (algal)carbon signatures were enriched (-
14.9‰ ±2.9 SD, n =54) compared to the average riparian carbon signature (-22.6‰±6.3 SD,
n = 73; Figure 3).
Page 34
Texas Tech University, Jessica L. East, May 2015
26
Figure 3. Total Pecos River food-web structure. Small shapes represent individual samples and large shapes represent averages
of each taxa. Squares denote fish, triangles denote macroinvertebrates, diamonds represent riparian vegetation, and circles
represent instream sources.
Page 35
Texas Tech University, Jessica L. East, May 2015
27
Fish isotopic ratios varied considerably across physiographic regions (Table
5).The Pecos Plains and Edwards Plateau fish assemblages were depleted in δ13
C
compared to assemblages in the Roswell and Permian Basin. On average, δ13
C of
macroinvertebrates from the Pecos Plains and the Edwards Plateau were also depleted
compared to the Roswell and Permian Basins (Table 6). Four species found at multiple
sites had high variation in δ15
N: Fundulus grandis (9.27-17.97‰, n=25), Gambusia
affinis (9.77-17.60‰, n=16), Menidia beryllina (8.71-18.57‰, n=23), and Cyprinella
hybrids occupied the lowest (2.86). Non-native F. grandis occupied a higher trophic
position than the native F. zebrinus.
lutrensis (8.76-17.3‰, n=22; Figure 4). Lepisosteus osseus occupied the highest trophic
position (4.79) across all sites based on site-specific δ15
N baselines, whereas Cyprinodon
Page 36
Texas Tech University, Jessica L. East, May 2015
28
Table 5. Mean isotopic ratios ± SE for fish species across physiographic regions. Sample size (n) refers to number of
specimens used for stable isotope analysis
Pecos Plains Roswell Basin Permian Basin Edwards Plateau
Species
Average
δ13
C
Average
δ15
N n
Average
δ13
C
Average
δ15
N n
Average
δ13
C
Averag
e δ15
N n
Average
δ13
C
Average
δ15
N n
ASTMEX -22.9±0.6 12.9±0.5 6
CARCAR -22.6±0.0 7.6±0.0 1
CATCOM -22. 6±0.0 6.8±0.0 1
HERCYA -19.7±0.0 12.1±0.0 1
CYPCAR -17.4±0.0 11.9±0.3 3
CYPLUT -22.9±1.1 9.2±0.2 4 -16.8±0.4 14.2±0.3 3 -20.8±0.4 16.6±0.6 5 -19.3±0.7 13.3±0.6 10
CYPPRO -25.3±1.0 13.6±0.4 3
CYPSPP -14.1±0.8 8.5±0.2 16 -16.8±1.1 11.4±0.8 4
CYPVEN -21.8±0.9 12.5±0.6 6
DORCEP -21.2±0.0 9.8±0.0 1
DIOEPI -25.3±0.1 13.4±0.1 2
FUNGRA -16.5±0.5 12.5±0.5 22 -18.7±0.5 13.4±0.4 3
FUNZEB -14.8±0.06 11.0±0.2 8 -14.5±0.6 10.0±0.2 11 -18.7±0.9 12.6±0.5 6
GAMAFF -14.6±0.26 12.0±0.3 7 -18.3±1.2 15.4±0.9 6 -20.3±0.9 13.2±0.1 5
HYBPLA -17.7±1.4 10.3±1.7 3
ICTPUN -22.5±1.1 9.0±1.0 2 -20.67±0.5 13.0±0.1 2
LEPAUR -25.2±0.5 14.5±0.2 3
Page 37
Texas Tech University, Jessica L. East, May 2015
29
Pecos Plains Roswell Basin Permian Basin Edwards Plateau
Species
Average
δ13
C
Average
δ15
N n
Average
δ13
C
Average
δ15
N n
Average
δ13
C
Averag
e δ15
N n
Average
δ13
C
Average
δ15
N n
LEPCYA -22.2±0.0 9.1±0.0 1
LEPOSS -22.6±0.3 16.2±0.3 3
LUCPAR -16.9±0.0 9.2±0.0 1 -15.7±0.7 11.4±0.3 12 -17.2±0.8 13.0±0.2 4
MENBER -16.9±1.0 12.9±0.7 17 -18.7±0.4 12.5±0.3 6
MICSAL -21.5±1.1 15.5±0.5 5
MOXCON -22.2±2.2 12.2±0.1 2
NOTAMA -21.7±1.3 13.3±0.5 3
NOTSTR -23.2±1.1 9.2±0.2 3 -19.4±0.0 12.7±0.0 1
PIMPRO -21.9±0.2 7.6±0.2 3 -17.5±1.0 12.8±0.7 3
PIMVIG -17.0±0.0 15.0±0.1 2
PYLOLI -19.6±0.0 15.1±0.0 1
Table 5. Continued
Page 38
Texas Tech University, Jessica L. East, May 2015
30
Table 6. Mean isotopic ratios ± SE for macroinvertebrate families across physiographic regions. Sample size (n) refers to
number of specimens used for stable isotope analysis. Families may have been present at a site (see Table 4) but not analyzed
due to cost limitations.
Pecos Plains Roswell Basin Permian Basin Edwards Plateau
Family
Feeding
Group
Average
δ13
C
Average
δ15
N n
Average
δ13
C
Average
δ15
N n
Average
δ13
C
Average
δ15
N n
Average
δ13
C
Average
δ15
N n
Ephemeroptera
Leptophlebiidae
Shredder
-24.6±0.2 2.4±0.2 2
Ephphemeroptera
Tricorythidae
Collector ,
gatherer -24.7±0.1 1.5±0.1 3
Odonata
Libellulidae
Predator
-23.5±0.0 3.9±0.0 3 -19.7±0.1 6.3±0.0 3 -27.7±0.1 9.6±0.2 3
Gastropoda
Physidae
Scraper
-20.0±0.1 8.6±0.2 3 -18.5±0.2 8.5±0.1 3 -18.9±0.0 13.5±0.0 1 -21.8±1.0 9.4±0.3 8
Coleoptera
Elmidae larvae
Shredder
-16.9±0.1 9.7±0.1 3 -17.1±0.7 5.7±0.1 8 -25.3±0.8 7.4±0.2 9
Odonata
Coenagrionidae
Predator
-16.9±0.1 7.9±0.8 6 -17.6±1.6 10.1±1.2 9 -20.5±0.2 9.4±0.0 3
Tricophtera
Hydropsychidae
Filtering
Collector -26.1±0.2 13.3±0.1 3
Page 39
Texas Tech University, Jessica L. East, May 2015
31
Figure 4.Mean isotopic ratios with standard error bars of fishes across the Pecos River. Species codes are the same as listed in
Table 3.
Page 40
Texas Tech University, Jessica L. East, May 2015
32
The two-source mixing model revealed that the proportion of dietary carbon
supporting fishes shifted from riparian sources to instream sources along the longitudinal
gradient. The Pecos Plains had a higher riparian carbon influence, then shifted to more
instream contribution in the Permian Basin, and in the Edwards Plateau the model
showed an increase of riparian input, with autochthonous carbon still the dominant source
(Figure 5a). Invertebrates showed a similar pattern of a shift from riparian in the Pecos
Plains to predominately instream production in the Permian, then riparian carbon
increasing in importance in the Edwards Plateau (Figure 5b).
Page 41
Texas Tech University, Jessica L. East, May 2015
33
Figure 5. Proportions of carbon sources derived from ISOError two-source mixing
model. Plot A is the basal carbon sources of fishes and Plot B is macroinvertebrate
carbon sources. The sources are listed in a longitudinal gradient, with dotted lines
delineating change in physiographic region
boo
b
Page 42
Texas Tech University, Jessica L. East, May 2015
34
Spatial variation in food-web structure
Consumers in the northernmost site in the Pecos Plains were depleted on both the
δ13
C (-22.70 ‰ ±1.3SD) and δ15
N (8.48 ‰±0.94SD) axes (Figure 6). Roswell Basin sites
were enriched in carbon and nitrogen compared to the Pecos Plains (Figure 6). The
northernmost Permian Basin site had elevated mean δ15
N signatures for instream
producers and consumers, the highest of all sites (Figure 6). Further downstream in the
Permian Basin, sites were δ13
C enriched compared to upstream sites (-15.31 ‰±2.81SD)
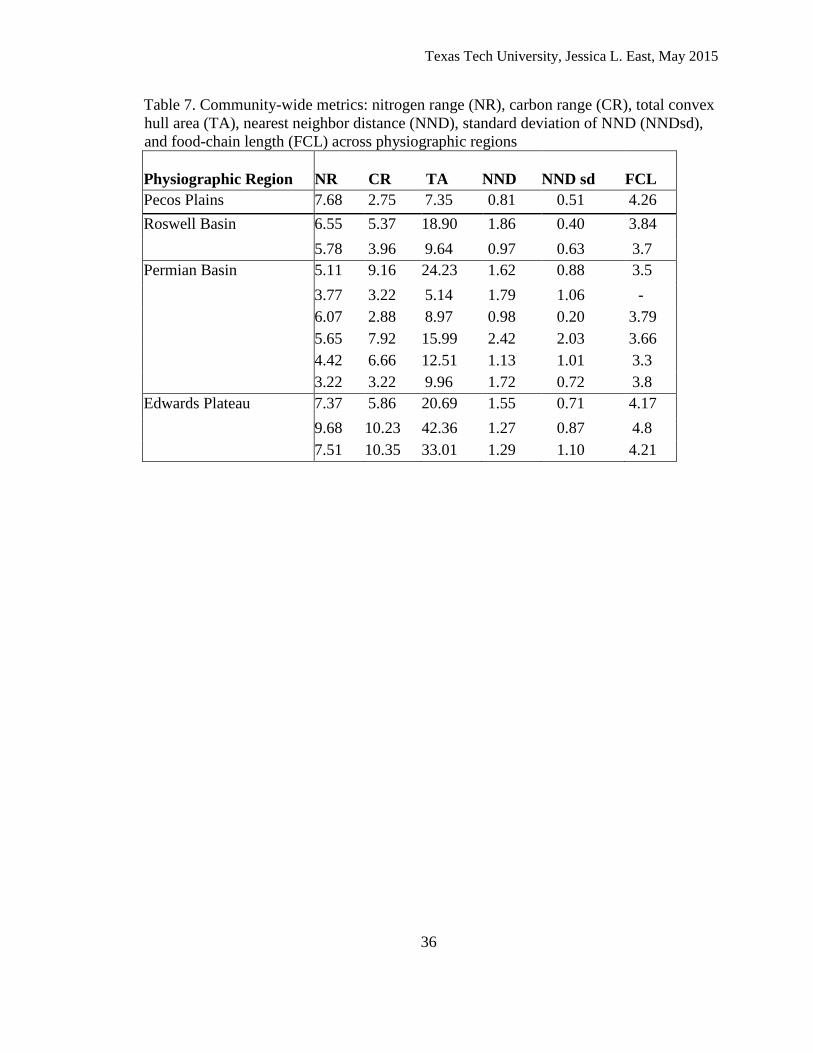
(Figure 6). The largest ranges in nitrogen (NR) were in the Pecos Plains and Edwards
Plateau. The largest ranges of carbon (CR), highest total convex hull area (TA), and
longest food chain length (FCL) were found in the Edwards Plateau (Table 7). CR and
NR were positively associated with environmental variables including river kilometer and
discharge. TA had a positive relationship with instantaneous discharge at the study reach
(p-value=0.02, r2=0.37). FCL and NR had an inverse relationship with specific
conductivity (Figure 7, p-value=0.06, R2=0.24, p-value=0.005, R
2=0.31, respectively)
Page 43
Texas Tech University, Jessica L. East, May 2015
35
Figure 6. Isotope biplots of sample sites in longitudinal order, site 1 is in the Pecos Plains physiographic region, sites 2-3 are in
the Roswell Basin, sites 4-9 are in the Permian Basin, and sites 10-12 are in the Edwards Plateau. Dark symbols represent
consumers and white symbols represent producers. The squares represent all fishes at a site, triangles represent invertebrates,
diamonds indicate riparian trees, and circles represent instream producers.
Page 44
Texas Tech University, Jessica L. East, May 2015
36
Table 7. Community-wide metrics: nitrogen range (NR), carbon range (CR), total convex
hull area (TA), nearest neighbor distance (NND), standard deviation of NND (NNDsd),
and food-chain length (FCL) across physiographic regions
Physiographic Region NR CR TA NND NND sd FCL
Pecos Plains 7.68 2.75 7.35 0.81 0.51 4.26
Roswell Basin 6.55 5.37 18.90 1.86 0.40 3.84
5.78 3.96 9.64 0.97 0.63 3.7
Permian Basin 5.11 9.16 24.23 1.62 0.88 3.5
3.77 3.22 5.14 1.79 1.06 -
6.07 2.88 8.97 0.98 0.20 3.79
5.65 7.92 15.99 2.42 2.03 3.66
4.42 6.66 12.51 1.13 1.01 3.3
3.22 3.22 9.96 1.72 0.72 3.8
Edwards Plateau 7.37 5.86 20.69 1.55 0.71 4.17
9.68 10.23 42.36 1.27 0.87 4.8
7.51 10.35 33.01 1.29 1.10 4.21
Page 45
Texas Tech University, Jessica L. East, May 2015
37
Figure 7. Simple linear regression of specific conductivity for each site against food chain
length (R2=0.391, p-value=0.02).
The TA of sample sites aggregated according to ecoregion, with an exception of one
Permian basin site with enriched N values (Figure 8). The Edwards Plateau sites
occupied a generally larger space on the left side of the δ13
C axis and along a wider range
on the δ15
N axis, indicating more diverse resource use. The Permian basin sites occupied
a space higher on the δ13
C axis, indicating greater instream input and a tighter range on
the δ15
N axis, indicating smaller niche space occupied by fishes at those sites (Figure 8).
The Pecos Plains orientation on the δ13
C axis indicates a greater influence from riparian
sources and its lower nitrogen ratios indicate lower trophic diversity. The Roswell Basin
TA was intermediate in size, similar to Permian Basin sites, and occupied the region in
between instream and riparian carbon sources.
Page 46
Texas Tech University, Jessica L. East, May 2015
38
Figure 8. Total convex hulls of each physiographic region calculated from consumer
ratios from each site.
Temporal variation in food-web structure
Overall, carbon and nitrogen signatures of fish consumers did not show
substantial temporal variation. Stable carbon and nitrogen isotope ratios of C. lutrensis
varied seasonally at one Roswell Basin site; mean δ15
N was higher in the spring and
summer than the fall and winter (Figure 9). Breadth of carbon supporting fish production
downstream of the confluence of Independence Creek increased in the summer and fall
(Figure 10).
Page 47
Texas Tech University, Jessica L. East, May 2015
39
Figure 9. Seasonal variation found in fish species at site 3 near Artesia, NM. Different
color squares indicate species, general trends across species appear to have enriched
nitrogen ratios in the spring and summer compared to fall and spring.
Figure 10. Seasonal variation found in fish species at site 11 downstream of the
confluence of Independence Creek. Difference color squares indicate different species,
general trend is a broadening of carbon signatures in summer and fall compared to tighter
clustering in the winter and spring
Page 48
Texas Tech University, Jessica L. East, May 2015
40
Chapter IV
Discussion
The above results indicate that food-web structure and biotic diversity in the
Pecos River follow some theoretical expectations for longitudinal patterns, while
deviations due to anthropogenic impacts were also apparent. Results also suggested that
resources used by aquatic consumers shifted seasonally in some cases. These findings
provide additional evidence for the potential detrimental impacts of secondary
salinization and diminished flow in river ecosystems of the semi-arid southwest.
Shifts in production sources and consumer signatures across the longitudinal gradient
Consumer diversity varied along the longitudinal gradient as would be expected
according to the river continuum concept (Vannote et al., 1980) and previous studies
describing an increase in fish diversity from upstream to downstream in river systems
(Angermeier & Karr, 1984; Schlosser, 1987; Beecher, Dott & Fernau, 1988). However,
the relationship was nonlinear as a decline in diversity was observed in the Permian
Basin, the region impacted most by anthropogenic salinization. Anthropogenic impacts
such as agricultural runoff, irrigation, impoundments, and oil and gas mining are the main
sources of secondary salinization in the Pecos River (Hoagstrom, 2009; Cheek & Taylor,
2015). Other factors that could have confounded longitudinal patterns of consumer
diversity include regional shifts in geomorphology and lack of a pronounced relationship
between longitudinal position and depth or temperature (Evans & Noble, 1979; Schlosser,
1987; Rahel & Hubert, 1991). However, a recent study on the lower Pecos River in Texas
determined salinity was the factor with greatest influence on fish diversity (Cheek &
Taylor, 2015). As the river entered the Edwards Plateau I observed a sharp decrease in
Page 49
Texas Tech University, Jessica L. East, May 2015
41
salinity and an increase in consumer diversity in both fish and macroinvertebrate
communities.
Riparian sources were generally more depleted in carbon isotope ratios compared
to instream sources. Filamentous algae samples were collected at a few sites but were not
included in dietary carbon analyses as they were generally more depleted (~ -21‰) than
other instream sources. This could be due to several factors: (1) samples were not
properly filtered of terrestrial detritus leading to an allochthonous signature; (2) the
samples taken were actually were contaminated with Prymnesium parvum (golden algae),
an invasive marine algae found in the Pecos River (Rhodes & Hubbs, 1992; Israël et al.,
2014) that has been shown to vary widely in carbon signature (-22 to -10‰) (Lindehoff,
Granéli & Granéli, 2009); (3) the samples were comprised of other salt-tolerant estuarine
macroalgae which tend to be depleted (~ -20‰) compared to freshwater algae (Kwak &
Zedler, 1997); or (4) high variation in algal δ13
C is associated with the amount of
dissolved inorganic carbon sources available to algae in the system (Finlay, 2001;
Michener & Lajtha, 2008). More robust filtration methods, more precise identification of
algal species present, and investigation of P. parvum carbon signatures and presence in
the Pecos River could elucidate this relationship.
Across the Pecos River, basal carbon sources supporting the fish and invertebrate
communities generally followed expectations from the River Continuum Concept (RCC)
(Vannote et al. 1980), with an increasing influence of production from instream carbon in
the downstream sites, and greater contributions from riparian carbon in the upstream
sites. However, the steep drop-off in allochthonous production supporting food webs in
Permian Basin sites was unexpected based on river continuum position. This could be
Page 50
Texas Tech University, Jessica L. East, May 2015
42
explained by the absence of palatable riparian litter, by expectations from the Riverine
Productivity Model (RPM) (Thorp & Delong, 1994; 2002), or by a breakdown of the
Flood-Pulse Concept (FPC) (Junk, Bayley & Sparks, 1989). As seen in similar arid or
semi-arid systems with riparian litter of low nutritional value, terrestrial carbon may not
be as important as instream sources due to the structure and composition of riparian
habitats (Grimm, 1987; Francis & Sheldon, 2002; Bunn, Davies & Winning, 2003; Dodds
et al., 2004; Turner & Edwards, 2012). Saltcedar, although found to be palatable in some
systems (Whitcraft et al., 2008), may influence the terrestrial carbon input as it has a
faster decomposition rate than native willows and cottonwoods (Bailey, Schweitzer &
Whitham, 2001), and a faster decomposition rate than native grasses that previously
dominated the riparian zone (Gregory & Hatler, 2008; Hultine et al., 2009).
Alternatively, Pomeroy (2000) found that an absence of shredding macroinvertebrates
likely reduced accessibility of saltcedar and other native riparian tree sources of carbon.
Degraded habitat conditions in Permian Basin sites may have limited abundance of
shredder taxa such as Trichoptera and Plecoptera.
A breakdown of the FPC due to the altered flow regime along with drought
conditions (Tinker, 2015) could have made the riparian carbon inaccessible to consumers.
A study by Turner & Edwards (2012) was also carried out in a relatively dry year in the
Rio Grande, and they posited that some aquatic habitats may have been inaccessible to
fishes, thus limiting energy transfer from some riparian macroinvertebrates to fishes.
However, I saw similar δ13
C ratios in macroinvertebrate signatures at Permian Basin
sites, suggesting that riparian carbon is relatively inaccessible to all aquatic consumer
groups in some parts of the Pecos River. Lastly, the RPM predicts a high relative
Page 51
Texas Tech University, Jessica L. East, May 2015
43
importance of algae compared to riparian inputs to large river food webs with constricted
channel habitats due to inaccessibility of the resources (Thorp & Delong, 1994; 2002),
which may explain the high relative importance of instream carbon I observed in a
majority of the sample sites.
As expected, nitrogen isotope signatures revealed that fishes generally
occupied higher trophic levels than macroinvertebrates. Looking specifically at five
common fish species, the observed high variance in nitrogen ratios could indicate a wide
niche breadth for these species across the longitudinal gradient. However, it is important
to note that a source of variation is driven, in part, by the inclusion of ratios from an N-
enriched site in the Permian Basin. The enrichment at the Loving site accounted for most
of the variation in F. grandis, G. affinis, and M. beryllina; however it only explains ~4%
of the variation among C. lutrensis. This large variation in C. lutrensis indicates a wide
diet variety. C. lutrensis have been generally regarded as generalists (Hale, 1962;
Goldstein & Simon, 1999; Hendrickson & Cohen, 2012). In the Pecos River C. lutrensis
have been found to feed mostly on aquatic insects based on gut contents analysis (A.A.
Pease, unpubl. data). Diet variation in M. beryllina may be explained by their feeding
ecology; generally they are planktivorous and size-selective invertebrate pickers
(Goldstein & Simon, 1999; Hendrickson & Cohen, 2012), and a diet study in the Pecos
revealed that they fed consistently across sites on terrestrial and benthic
macroinvertebrates in the Pecos River (A.A. Pease, unpubl. data). Fundulus grandis and
G.affinis had narrower niche breadths, as their diets remained consistent across sites.
These results enforce the importance of using δ15
N baselines and complimentary diet
studies to accurately interpret differences across communities.
Page 52
Texas Tech University, Jessica L. East, May 2015
44
In terms of expectations for nitrogen signatures across the longitudinal gradient,
the Permian basin consumer assemblages were more depleted in nitrogen than expected
according to the functional structure of riverine systems (Poff & Allan, 1995), with a
divergence from a predicted increase in functional feeding groups with stream order. The
anthropogenically increased salinity and habitat degradation present in the Permian Basin
have caused declines in local diversity (Cheek & Taylor, 2015) and this has likely
constrained the food-web structure. In the Edwards Plateau δ15
N ratios were relatively
enriched due to the presence of Largemouth Bass, Longnose Gar, and Flathead Catfish as
top predators. These species are rare in the Pecos Plains and Roswell Basin regions, and
they have not been recorded in recent surveys of the Permian Basin (Cheek & Taylor,
2015; Linam & Kleinsasser, 1996).
Differences in food-web structure across physiographic regions
Variation in isotopic signatures among regions may have been driven by a
combination of natural and anthropogenic environmental variables. As mentioned above,
carbon ratios did not exhibit a linear longitudinal relationship, which could be explained
by the differences among the physiographic regions. In the Pecos Plains site, the river is a
lower order, higher elevation, has low natural salinity, and diverse riparian habitat. The
average ratios at this site were depleted in carbon and nitrogen, suggesting use of the
riparian carbon sources and presence of fewer large piscivores as expected in lower order,
higher elevation streams (Schlosser, 1987; Beecher, Dott & Fernau, 1988). Downstream
in the Roswell Basin, the sites were more enriched in carbon and nitrogen compared to
the Pecos Plains, but lower than the Edwards Plateau, which could be due to the
historically high flow variability (Hoagstrom, 2009) which generally supports smaller
Page 53
Texas Tech University, Jessica L. East, May 2015
45
bodied fish communities (Poff, 1997). The dominance of generalist, small-bodied
cyprinids and cyprinodontiforms in Roswell Basin assemblages prevented signatures
from reaching those expected for assemblages with large piscivores. In addition to flow
variability, the dominant shifting sand substrate may have also constrained
macroinvertebrate (Anderson & Day, 1986) and macrophyte diversity (Nuttall, 1972).
The Pecos River enters the Chihuahan desert landscape in the Roswell basin, which may
account for the enrichment in carbon as there are fewer litter depositing trees.
The Permian Basin sites had a high variation across the carbon scale, but this
variation tracked a broad range of carbon signatures within the instream producers. The
reason for the broad range of signatures among instream producers is unknown, but it
could be due to a slight variation in flow across the seven sites; water velocity has been
shown to influence δ13
C ratios in periphyton (Singer et al., 2005), or due to variation in
the taxonomic composition, as identification was quite broad in this study (Finlay, 2001).
The riparian zone in the Permian Basin has been dominated by saltcedar in recent
decades, and has likely impacted availability of allochthonous carbon sources as
mentioned above. High salinity and low habitat diversity with substrate dominated by
mud and silt are generally not conducive to supporting high trophic diversity, including
top predators like Largemouth Bass and Longnose Gar. These species historically
occurred in the Permian Basin, but were only found in the Edwards Plateau in surveys of
the Pecos in Texas (Linam & Kleinsasser, 1996). The local extirpation of piscivorous
species may explain the low nitrogen signatures in the Permian Basin. The enriched
nitrogen levels found in consumers from one Permian Basin site are associated with
enriched nitrogen signatures at the base of the food web. This enrichment is most likely
Page 54
Texas Tech University, Jessica L. East, May 2015
46
due to a combination of agricultural runoff in the watershed and effluent water from a
wastewater treatment plant in the city of Carlsbad. Other studies have shown that urban
wastewater input or agricultural runoff can enrich baseline nitrogen signatures in aquatic
food webs (Anderson & Cabana, 2005).
Introduction of non-native F. grandis via baitbucket releases has also likely
changed Pecos river food-web structure in the Permian Basin. In the Pecos River, F.
grandis have been found to consume mostly detritivorous Cyprinodon hybrids (A.A.
Pease, unpubl. data), but are omnivorous elsewhere in their range (Simpson & Gunter,
1956; Hendrickson & Cohen, 2012). Non-native species with dietary flexibility are often
successful invaders (Ricciardi & Rasmussen, 1998). The native F. zebrinus primarily
feed on aquatic insects (A.A. Pease, unpubl. data; (Echelle, Mosier & Hill, 1972)
indicating that there may not be direct niche overlap and competition between the two
Fundulus killifish species as previously suggested (Cheek & Taylor, 2015), but predatory
interactions may be impacting local fish assemblages. Previous studies have shown that
when predacious non-native species occupy a higher trophic position than that of the
equivalent native species, they are more successful invaders and are likely to have a
significant impact on native food-web structure (Vander Zanden, Casselman &
Rasmussen, 1999; Simon & Townsend, 2003; Cucherousset et al., 2007).
Once the river enters the Edwards Plateau, the increase in discharge due to the
influx of spring-fed Independence Creek, the largest tributary to the Pecos, creates deep
pools and dilutes high salinity levels. The river has heterogeneous macrohabitats in the
Edwards Plateau region, with many run-riffle-pool sequences, allowing for gravel and
cobble deposits creating multiple mesohabitats that support a higher diversity of species.
Page 55
Texas Tech University, Jessica L. East, May 2015
47
The carbon ratios are more widely dispersed and I observed the highest trophic positions
in the Pecos at the lowest three sites. Higher δ15
N signatures in fish consumers in the
Edwards plateau were due to presence of large predators in the lower reaches of the river.
This is in concordance with the increase in stream order, discharge, and rocky substrate,
and with the decrease in salinity.
Spatial variation in assemblage-wide measures of food-web structure
Nitrogen ranges are an index of total distance from bottom to top of a food chain
measured in relation to the δ15
N values of a standardized baseline (Post, 2002). The
largest NR was found in the Edwards Plateau which suggests that this region supports a
larger number of trophic levels and trophic diversity within fish assemblages (Layman et
al., 2007). The shortest NR was found in the Permian Basin indicating that these highly
impacted sites had fewer trophic levels and were less diverse in terms of trophic resource
use. The Edwards Plateau, the most downstream physiographic region sampled with the
highest discharge and least amount of anthropogenic impact, had the highest carbon
ranges and total convex hull area which are both aspects of diversity in trophic resource
use (Layman et al., 2007). Degraded habitats are likely to contain simple food-webs as
fewer food resources and consumer taxa are supported. The Permian Basin had some of
the smallest convex hull areas and narrow carbon ranges, further suggesting that foodweb
structure in this region was constrained due to poor habitat conditions.
The food-chain lengths of sites on the Pecos River were on average 3.9 which is
in line with the global average for streams (Vander Zanden & Fetzer, 2007). As expected,
in the Edwards Plateau region I observed longer FCLs along with an increase in fish
Page 56
Texas Tech University, Jessica L. East, May 2015
48
diversity, higher discharge, and less anthropogenic disturbance compared to the rest of
the river. These conditions are expected to support longer food-chain lengths
(Pimm, 1977; Pimm, 1982; Cohen & Newman, 1991; Power, Dietrich & Finlay, 1996).
Food-chain lengths generally increase along longitudinal gradients of rivers (Post, 2002),
however, similar to research carried out by Turner and Edwards (2012) on the Rio
Grande, I found a nonlinear pattern with food-chain length. This was caused by the
dropoff in FCL for the Permian Basin sites. Food-chain lengths were negatively
correlated with salinity, indicating that the salinity gradient may have more of an
influence on foodweb structure than the longitudinal gradient.
Temporal variation in food-web structure
Winemiller (1990) found that major causes for temporal variation in aquatic
foodwebs were changes in the amount and availability of habitat and prey resources.
Seasonal and ontogenetic shifts are common in freshwater fishes (Werner & Gilliam,
1984), and the variation in nitrogen ratios of C. lutrensis in the Roswell Basin sites
potentially provides an example of this. An increase in nitrogen ratios in the summer and
spring could be attributed to prey availability following the resource pulse concept which
states that rare, concentrated, short periods of increased resource availability can have
impacts on diet and food-web structure in regards to invertebrate aggregations and flow
variability (Vanni et al., 2001; Gratton & Denno, 2003; Yang et al., 2008). In this feastor-
famine type of seasonality, consumers may shift their foraging efforts to less nutritional
prey items depending on availability (Yang et al., 2008). The shifts in breadth of carbon
signatures in the Edwards Plateau reveals how the relative importance of autochthonous
and allochthonous food sources varied temporally. In other arid-land rivers, seasonal
Page 57
Texas Tech University, Jessica L. East, May 2015
49
changes in the contribution of algal resources have been attributed to increasing water
temperatures and decreasing flow in summer (Pease et al., 2006). Seasonal changes in
algal resources are commonly observed in aquatic ecosystems (Fabbro & Duivenvoorden,
2000). The lack of seasonal shifts in carbon and nitrogen shifts in the Permian Basin may
be influenced by the suppression of the natural flow regime (Bunn & Arthington, 2002),
salinization, degradation of the riparian buffer, or any combination of the three. Stable
isotope ratios are a useful measure of energy flow through a system; however rate of
carbon assimilation or turnover rate has a large influence on interpretation (Fry, 2006).
The coarse scale at which we sampled temporal variation, and sampling over only one
year, may not have allowed me to observe the timing of variation across all sites. Further
investigation of the seasonality of the invertebrate community and a detailed seasonal diet
study could reveal the factors influencing the carbon and nitrogen shifts in this system.
Conservation implications
The implications of altered flow regimes in concert with anthropogenic
salinization on sensitive arid aquatic food web systems is extremely important because of
the fragility of the systems and the extreme endemism of the species in these regions
(Minckley & Meffre, 1987). Specific impacts of river salinization on organisms has been
studied, however the ecosystem impacts of secondary salinization has not been
extensively researched. Along with increasing water demand, climate change is expected
to increase river salinization globally through an increase in evaporation rates with
increase in water temperatures, and a decrease in precipitation lowering dilution rates
(Cañedo-Argüelles et al., 2013). Alleviation of anthropogenic impacts, such as flow
restoration in the Permian Basin, would lessen current and future impacts of climate
Page 58
Texas Tech University, Jessica L. East, May 2015
50
change on the salinity of the river. What I found in the Edwards Plateau suggests that
where there is a more natural flow regime, natural salinity levels, intact riparian and
instream habitats, and diverse resource availability the Pecos River can support fairly
diverse fish assemblages and aquatic food-webs. With the mechanistic understanding that
links salinity and altered flow regime, one could better implement management strategies
of controlled flood pulses to mimic the natural flow regime, aiding in mitigation of the
salinity inputs from natural and anthropogenic sources.
Page 59
Texas Tech University, Jessica L. East, May 2015
51
Literature Cited
Allan J.D. (2004) Landscapes and riverscapes: The influence of land use on stream
ecosystems. Annual Review of Ecology Evolution and Systematics, 35, 257-284.
Allan J.D. & Castillo M.M. (2007) Stream Ecology: Structure and Function of Running
Waters., Springer, Dordrecht, the Netherlands.
Anderson C. & Cabana G. (2005) Delta N-15 in riverine food webs: effects of N inputs
from agricultural watersheds. Canadian Journal of Fisheries and Aquatic
Sciences, 62, 333-340.
Anderson R.V. & Day D.M. (1986) Predictive quality of macroinvertebrate—habitat
associations in lower navigation pools of the Mississippi River. Hydrobiologia,
136, 101-112.
Angermeier P.L. & Karr J.R. (1984) Fish communities along environmental gradients in
a system of tropical streams. In: Evolutionary ecology of neotropical freshwater
fishes pp. 39-58. Springer.
Bailey J.K., Schweitzer J.A. & Whitham T.G. (2001) Salt cedar negatively affects
biodiversity of aquatic macroinvertebrates. Wetlands, 21, 442-447.
Beecher H.A., Dott E.R. & Fernau R.F. (1988) Fish species richness and stream order in
Washington State streams. Environmental Biology of Fishes, 22, 193-209.
Berkman H.E. & Rabeni C.F. (1987) Effect of siltation on stream fish communities.
Environmental Biology of Fishes, 18, 285-294.
Boecklen W.J., Yarnes C.T., Cook B.A. & James A.C. (2011) On the Use of Stable
Isotopes in Trophic Ecology. Annual Review of Ecology, Evolution, and
Systematics, 42, 411-440.
Bogan M.T., Boersma K.S. & Lytle D.A. (2013) Flow intermittency alters longitudinal
patterns of invertebrate diversity and assemblage composition in an arid‐land
stream network. Freshwater Biology, 58, 1016-1028.
Brock M.A., Nielsen D.L. & Crossle K. (2005) Changes in biotic communities
developing from freshwater wetland sediments under experimental salinity and
water regimes. Freshwater Biology, 50, 1376-1390.
Bunn S.E. & Arthington A.H. (2002) Basic principles and ecological consequences of
altered flow regimes for aquatic biodiversity. Environmental Management, 30,
492-507.
Bunn S.E., Davies P.M. & Winning M. (2003) Sources of organic carbon supporting the
food web of an arid zone floodplain river. Freshwater Biology, 48, 619-635.
Burford M.A., Cook A.J., Fellows C.S., Balcombe S.R. & Bunn S.E. (2008) Sources of
carbon fuelling production in an arid floodplain river. Marine and Freshwater
Research, 59, 224-234.
Page 60
Texas Tech University, Jessica L. East, May 2015
52
Carver S., Storey A., Spafford H., Lynas J., Chandler L. & Weinstein P. (2009) Salinity
as a driver of aquatic invertebrate colonisation behaviour and distribution in the
wheatbelt of Western Australia. Hydrobiologia, 617, 75-90.
Cañedo-Argüelles M., Kefford B.J., Piscart C., Prat N., Schäfer R.B. & Schulz C.-J.
(2013) Salinisation of rivers: An urgent ecological issue. Environmental
Pollution, 173, 157-167.
Cheek C.A. & Taylor C.M. (2015) Salinity and geomorphology drive long-term changes
to local and regional fish assemblage attributes in the lower Pecos River, Texas.
Ecology of Freshwater Fish, In Press.
Closs G. & Lake P. (1994) Spatial and temporal variation in the structure of an
intermittent-stream food web. Ecological Monographs, 2-21.
Cohen J.E. & Newman C.M. (1991) Community area and food-chain length: theoretical
predictions. American Naturalist, 1542-1554.
Cucherousset J., Aymes J., Santoul F. & Céréghino R. (2007) Stable isotope evidence of
trophic interactions between introduced brook trout Salvelinus fontinalis and
native brown trout Salmo trutta in a mountain stream of south‐west France.
Journal of Fish Biology, 71, 210-223.
Debruyn A.M., Marcogliese D.J. & Rasmussen J.B. (2003) The role of sewage in a large
river food web. Canadian Journal of Fisheries and Aquatic Sciences, 60,
13321344.
Dekar M. & Magoulick D. (2007) Factors affecting fish assemblage structure during
seasonal stream drying. Ecology of Freshwater Fish, 16, 335-342.
Delong M.D. & Brusven M.A. (1998) Macroinvertebrate community structure along the
longitudinal gradient of an agriculturally impacted stream. Environmental
Management, 22, 445-457.
Deus C.D. & Petrere-Junior M. (2003) Seasonal diet shifts of seven fish species in an
Atlantic rainforest stream in southeastern Brazil. Brazilian Journal of Biology, 63,
579-588.
Dickman M. & Gochnauer M. (1978) Impact of sodium chloride on the microbiota of a
small stream. Environmental Pollution (1970), 17, 109-126.
Dodds W.K., Gido K., Whiles M.R., Fritz K.M. & Matthews W.J. (2004) Life on the
edge: the ecology of Great Plains prairie streams. BioScience, 54, 205-216.
Echelle A.A., Mosier D. & Hill L.G.(1971) Aspects of the feeding ecology of Fundulus
zebrinus kansae. In: Proceedings of the Oklahoma Academy of Sciences, pp. 6-9.
Evans J.W. & Noble R.L. (1979) The longitudinal distribution of fishes in an east Texas
stream. American Midland Naturalist, 333-343.
Fabbro L.D. & Duivenvoorden L.J. (2000) A two-part model linking multidimensional
environmental gradients and seasonal succession of phytoplankton assemblages.
Hydrobiologia, 438, 13-24.
Page 61
Texas Tech University, Jessica L. East, May 2015
53
Fiedler A.G. & Nye S.S. (1933) Geology and ground water resources of the Roswell
artesian basin, New Mexico. U.S. Geol. Surv., Water Supply Paper 639, 372 p.
Finlay J.C. (2001) Stable-carbon-isotope ratios of river biota: implications for energy
flow in lotic food webs. Ecology, 82, 1052-1064.
Fischer J. & Paukert C. (2008) Habitat relationships with fish assemblages in minimally
disturbed Great Plains regions. Ecology of Freshwater Fish, 17, 597-609.
Francis C. & Sheldon F. (2002) River Red Gum (Eucalyptus camaldulensis Dehnh.)
organic matter as a carbon source in the lower Darling River, Australia.
Hydrobiologia, 481, 113-124.
Fry B. (2006) Stable isotope ecology, Springer-Verlang, New York, NY.
Gido K.B., Franssen N.R. & Propst D.L. (2006) Spatial variation in δ15N and δ13C
isotopes in the San Juan River, New Mexico and Utah: implications for the
conservation of native fishes. Environmental Biology of Fishes, 75, 197-207.
Goldstein R.M. & Simon T.P. (1999) Toward a united definition of guild structure for
feeding ecology of North American freshwater fishes. Assessing the sustainability
and biological integrity of water resources using fish communities. CRC Press,
Boca Raton, Florida, 123-202.
Graf W.L. (1999) Dam nation: A geographic census of American dams and their
largescale hydrologic impacts. Water Resources Research, 35, 1305-1311.
Gratton C. & Denno R.F. (2003) Inter-year carryover effects of a nutrient pulse on
Spartina plants, herbivores, and natural enemies. Ecology, 84, 2692-2707.
Gregory L. & Hatler W. (2008) A watershed protection plan for the Pecos River in Texas.
Texas Water Resources Institute: College Station, Texas.
Grimm N.B. (1987) Nitrogen dynamics during succession in a desert stream. Ecology,
1157-1170.
Hale M. A comparative study of the food of the shiners Notropis lutrensis and Notropis
venustus. In: Proceedings of the Oklahoma Academy of Science, pp. 125-129.
Hatch M.D., Baltosser W.H. & Schmitt C.G. (1985) Life-history and ecology of the
bluntnose shiner (Notropis simus pecosensis) in the Pecos River of New Mexico.
Southwestern Naturalist, 30, 555-562.
Head G.N. & Orcutt J.D. (2002) From Folsom to Fogelson: The Cultural Resources
Inventory Survey of Pecos National Historical Park, Anthropology Projects,
Cultural Resources Management, Intermountain Region, National Park Service,
Department of the Interior.
Hendrickson D.A. & Cohen A.E. (2012) Fishes of Texas Project and Online Database.
Vol. December 30. Texas Natural History Collection, a division of Texas Natural
Science Center, University of Texas at Austin.
Hoagstrom C.W. (2009) Causes and impacts of salinization in the lower Pecos River.
Great Plains Research, 19, 27-44.
Page 62
Texas Tech University, Jessica L. East, May 2015
54
Hoagstrom C.W., Brooks J.E. & Davenport S.R. (2008) Recent habitat association and
the historical decline of Notropis simus pecosensis. River Research and
Applications, 24, 789-803.
Hoeinghaus D., Layman C., Arrington D. & Winemiller K. (2003) Spatiotemporal
variation in fish assemblage structure in tropical floodplain creeks. Environmental
Biology of Fishes, 67, 379-387.
Hultine K.R., Belnap J., Van Riper Iii C., Ehleringer J.R., Dennison P.E., Lee M.E.,
Nagler P.L., Snyder K.A., Uselman S.M. & West J.B. (2009) Tamarisk biocontrol
in the western United States: ecological and societal implications. Frontiers in
Ecology and the Environment, 8, 467-474.
Israël N.M., Vanlandeghem M.M., Denny S., Ingle J. & Patiño R. (2014) Golden alga
presence and abundance are inversely related to salinity in a high-salinity river
ecosystem, Pecos River, USA. Harmful Algae, 39, 81-91.
Jensen R., Hatler W., Mecke M. & Hart C. (2006) The Influences of Human Activities on
the Waters of the Pecos Basin of Texas: A Brief Overview. Texas Water
Resources Institute.
Junk W.J., Bayley P.B. & Sparks R.E. (1989) The flood pulse concept in river-floodplain
systems. Canadian special publication of fisheries and aquatic sciences, 106,
110-127.
Kummu M. & Varis O. (2007) Sediment-related impacts due to upstream reservoir
trapping, the Lower Mekong River. Geomorphology, 85, 275-293.
Kwak T.J. & Zedler J.B. (1997) Food web analysis of southern California coastal
wetlands using multiple stable isotopes. Oecologia, 110, 262-277.
Layman C.A., Arrington D.A., Monta a C.G. & Post D.M. (2007) Can stable isotope
ratios provide for community-wide measures of trophic structure? Ecology, 88,
42-48.
Linam G.W. & Kleinsasser L.J. (1996) Relationship between fishes and water quality in
the Pecos River, Texas. Texas Parks and Wildlife Dept., Resource Protection
Division River Studies Report.
Lindehoff E., Granéli E. & Granéli W. (2009) Effect of tertiary sewage effluent additions
on Prymnesium parvum cell toxicity and stable isotope ratios. Harmful Algae, 8,
247-253.
Marzin A., Verdonschot P.F.M. & Pont D. (2013) The relative influence of catchment,
riparian corridor, and reach-scale anthropogenic pressures on fish and
macroinvertebrate assemblages in French rivers. Hydrobiologia, 704, 375-388.
Michener R. & Lajtha K. (2008) Stable isotopes in ecology and environmental science,
Blackwell Publishers, Boston, MA.
Minckley W. & Meffre G.K. (1987) Differential selection by flooding in stream-fish
communities of the arid American Southwest. Community and Evolutionary
Ecology of North American Fishes (eds W.J. Matthews and D.C. Heins), pp. 93-
104. University of Oklahoma Press, Oklahoma.
Page 63
Texas Tech University, Jessica L. East, May 2015
55
Montgomery D.R. (1999) Process domains and the river continuum. Journal of the
American Water Resources Association, 35, pp. 397-410.
Nuttall P. (1972) The effects of sand deposition upon the macroinvertebrate fauna of the
River Camel, Cornwall. Freshwater Biology, 2, 181-186.
Olden J.D., and Mark J. Kennard. (2010) Intercontinental comparison of fish life history
strategies along a gradient of hydrologic variability. pp. 83-107. Community
Ecology of Stream Fishes: Concepts, Approaches, and Techniques.
Ostrand K. & Wilde G. (2002) Seasonal and spatial variation in a prairie stream‐fish
assemblage. Ecology of Freshwater Fish, 11, 137-149.
Pease A.A., Justine Davis J., Edwards M.S. & Turner T.F. (2006) Habitat and resource
use by larval and juvenile fishes in an arid‐land river (Rio Grande, New Mexico).
Freshwater Biology, 51, 475-486.
Pease A.A., Taylor J.M., Winemiller K.O. & King R.S. (2011) Multiscale Environmental
Influences on Fish Assemblage Structure in Central Texas Streams. Transactions
of the American Fisheries Society, 140, 1409-1427.
Phillips D.L. & Gregg J.W. (2001) Uncertainty in source partitioning using stable
isotopes. Oecologia, 127, 171-179.
Pimm S.L. (1982) Food webs, Chapman & Hall, New York, NY.
Pimm S.L., J.H. Lawton. (1977) The numbers of trophic levels in ecological
communities. Nature, 268, 329-331.
Poff N.L. (1997) Landscape filters and species traits: Towards mechanistic understanding
and prediction in stream ecology. Journal of the North American Benthological
Society, 16, 391-409.
Poff N.L. & Allan J.D. (1995) Functional organization of stream fish assemblages in
relation to hydrological variability. Ecology, 76, 606-627.
Poff N.L., Allan J.D., Bain M.B., Karr J.R., Prestegaard K.L., Richter B.D., Sparks R.E.
& Stromberg J.C. (1997) The natural flow regime. BioScience, 769-784.
Poff N.L. & Ward J.V. (1990) Physical habitat template of lotic systems- recovery in the
context of historical pattern of spatiotemporal heterogeneity. Environmental
Management, 14, 629-645.
Pomeroy K.E., Shannon J.P. & Blinn D.W. (2000) Leaf breakdown in a regulated desert
river: Colorado River, Arizona, USA. Hydrobiologia, 434, 193-199.
Post D.M. (2002) The long and short of food-chain length. Trends in Ecology &
Evolution, 17, 269-277.
Power M.E., Dietrich W.E. & Finlay J.C. (1996) Dams and downstream aquatic
biodiversity: potential food web consequences of hydrologic and geomorphic
change. Environmental management, 20, 887-895.
Page 64
Texas Tech University, Jessica L. East, May 2015
56
Quinn J. (2000) Effects of pastoral development. New Zealand stream invertebrates:
ecology and implications for management, 208-229.
Rahel F.J. & Hubert W.A. (1991) Fish assemblages and habitat gradients in a Rocky
Mountain–Great Plains stream: biotic zonation and additive patterns of
community change. Transactions of the American Fisheries Society, 120, 319332.
Rhodes K. & Hubbs C. (1992) Recovery of Pecos River fishes from a red tide fish kill.
The Southwestern Naturalist, 178-187.
Ricciardi A. & Rasmussen J.B. (1998) Predicting the identity and impact of future
biological invaders: a priority for aquatic resource management. Canadian
Journal of Fisheries and Aquatic Sciences, 55, 1759-1765.
Richards C., Johnson L.B. & Host G.E. (1996) Landscape-scale influences on stream
habitats and biota. Canadian Journal of Fisheries and Aquatic Sciences, 53, 295-
311.
Schlosser I. (1987) A conceptual framework for fish communities in small warmwater
streams. Community and evolutionary ecology of North American stream fishes.
University of Oklahoma Press, Norman, 17, 24.
Sharp Z. (2007) Principles of stable isotope geochemistry, Pearson Education Upper
Saddle River, NJ, USA.
Simon K.S. & Townsend C.R. (2003) Impacts of freshwater invaders at different levels of
ecological organisation, with emphasis on salmonids and ecosystem
consequences. Freshwater Biology, 48, 982-994.
Simpson D.G. & Gunter G. (1956) Notes on habitats, systematic characters and life
histories of Texas salt water cyprinodonts.
Singer G.A., Panzenböck M., Weigelhofer G., Marchesani C., Waringer J., Wanek W. &
Battin T.J. (2005) Flow history explains temporal and spatial variation of carbon
fractionation in stream periphyton. Limnology and Oceanography, 50, 706-712.
Stepenuck K.F., Crunkilton R.L. & Wang L. (2002) Impacts of urban land-use on
macroinvertebrate communities in southeastern Wisconsin streams. Journal of the
American Water Resources Association, 38, 1041-1051.
Suttle K.B., Power M.E., Levine J.M. & Mcneely C. (2004) How fine sediment in
riverbeds impairs growth and survival of juvenile salmonids. Ecological
Applications, 14, 969-974.
Thoms M.C. & Sheldon F. (2002) An ecosystem approach for determining environmental
water allocations in Australian dryland river systems: the role of geomorphology.
Geomorphology, 47, 153-168.
Thorp J.H. & Delong M.D. (1994) The riverine productivity model: an heuristic view of
carbon sources and organic processing in large river ecosystems. Oikos, 305-308.
Thorp J.H. & Delong M.D. (2002) Dominance of autochthonous autotrophic carbon in
food webs of heterotrophic rivers. Oikos, 96, 543-550.
Page 65
Texas Tech University, Jessica L. East, May 2015
57
Tinker R. (2015) United States Drought Monitor. Vol. January 22. National Drought
Mitigation Center.
Turner T.F. & Edwards M.S. (2012) Aquatic foodweb structure of the Rio Grande
assessed with stable isotopes. Freshwater Science, 31, 825-834.
Vander Zanden M. & Fetzer W.W. (2007) Global patterns of aquatic food chain length.
Oikos, 116, 1378-1388.
Vander Zanden M. & Rasmussen J.B. (1999) Primary consumer δ13C and δ15N and the
trophic position of aquatic consumers. Ecology, 80, 1395-1404.
Vander Zanden M. & Rasmussen J.B. (2001) Variation in δ15N and δ13C trophic
fractionation: implications for aquatic food web studies. Limnology and
oceanography, 46, 2061-2066.
Vander Zanden M.J., Casselman J.M. & Rasmussen J.B. (1999) Stable isotope evidence
for the food web consequences of species invasions in lakes. Nature, 401, 464467.
Vanni M.J., Renwick W.H., Headworth J.L., Auch J.D. & Schaus M.H. (2001) Dissolved
and particulate nutrient flux from three adjacent agricultural watersheds: A
fiveyear study. Biogeochemistry, 54, 85-114.
Vannote R.L., Minshall G.W., Cummins K.W., Sedell J.R. & Cushing C.E. (1980) The
river continuum concept. Canadian journal of fisheries and aquatic sciences, 37,
130-137.
Wang L., Lyons J., Kanehl P. & Gatti R. (1997) Influences of watershed land use on
habitat quality and biotic integrity in Wisconsin streams. Fisheries, 22, 6-12.
Wang L.Z., Lyons J. & Kanehl P. (2001) Impacts of urbanization on stream habitat and
fish across multiple spatial scales. Environmental Management, 28, 255-266.
Ward J.V. & Stanford J. (1983) The serial discontinuity concept of lotic ecosystems.
Dynamics of lotic ecosystems, 29-42.
Werner E.E. & Gilliam J.F. (1984) The ontogenetic niche and species interactions in size structured populations. Annual review of ecology and systematics, 393-425.
Whitcraft C.R., Levin L.A., Talley D. & Crooks J.A. (2008) Utilization of invasive
tamarisk by salt marsh consumers. Oecologia, 158, 259-272.
Williams W. (2001) Anthropogenic salinisation of inland waters. Hydrobiologia, 466,
329-337.
Winemiller K.O. (1990) Spatial and temporal variation in tropical fish trophic networks.
Ecological monographs, 60, 331-367.
Winemiller K.O., Hoeinghaus D.J., Pease A.A., Esselman P.C., Honeycutt R.L.,
Gbanaador D., Carrera E. & Payne J. (2011) Stable isotope analysis reveals food
web structure and watershed impacts along the fluvial gradient of a mesoamerican
coastal river. River Research and Applications, 27, 791-803.
Yang L.H., Bastow J.L., Spence K.O. & Wright A.N. (2008) What can we learn from
resource pulses. Ecology, 89, 621-634.
Page 66
Texas Tech University, Jessica L. East, May 2015
58
Yuan F. & Miyamoto S. (2008) Characteristics of oxygen-18 and deuterium composition
in waters from the Pecos River in American Southwest. Chemical Geology, 255,
220-230.
Yuan F.S. & Miyamoto S. (2005) Dominant processes controlling water chemistry of the
Pecos River in American southwest. Geophysical Research Letters, 32, 1-4.
Zeug S.C. & Winemiller K.O. (2008) Evidence supporting the importance of terrestrial
carbon in a large-river food web. Ecology, 89, 1733-1743.