ORIGINAL PAPER Spatial asymmetry of temperature trends over India and possible role of aerosols D. R. Kothawale & K. Krishna Kumar & G. Srinivasan Received: 1 October 2010 / Accepted: 7 March 2012 / Published online: 24 March 2012 Abstract Dissimilarities in temperature trends in space and time over the Indian region have been examined to look for signatures of aerosols’ influence. Separate temperature time series for North and South India were constructed for dry (November–May) and wet (June–October) seasons. Tem- perature trend for the entire period 1901–2007 and different subperiods of 1901–1950, 1951–1990, 1971–2007, and 1991–2007 have been examined to isolate the aerosol and other greenhouse gas influences on temperatures. Maximum (daytime) temperatures during dry season corresponding to North and South India show significant warming trend of 0.8 and 1.0 °C per hundred years during the period 1901– 2007, while minimum temperature shows nebulous trend of 0.2 and 0.3 °C per hundred years over North and South India, respectively. During the wet season, maximum tem- perature shows nearly half of dry season maximum temper- ature warming trend. However, asymmetry is observed in dry season maximum temperature trend during post- industrial period 1951–1990 wherein the North/South India shows decreasing/increasing trends, while during the recent period 1991–2007 trends are uniformly positive for both the regions. Spatial and temporal asymmetry in observed trends clearly point to the role of aerosols in lowering temperature trends over northern India. Atmospheric aerosols could cause a negative climate forcing that can modulate the regional surface temperature trends in a significant way. As this forcing acts differentially on day and night temper- atures, trends in diurnal temperature range (DTR) provide a direct assessment of impacts of aerosols on temperature trends. Time series of diurnal temperature range for dry and wet seasons have been examined separately for North and South India. Over North India, the DTR for dry season has increased gradually during the period 1901–1970 and thereafter showed decreasing trend, while trends in temper- ature range over Southern India were almost opposite in phase with North India. The aerosol and greenhouse gases seem to play an important role in the spatial and temporal variability of temperature range over India. 1 Introduction Increase in greenhouse gases, viz., CO 2 , CH 4 , CFCs, N 2 O, etc., and water vapor in the atmosphere are mainly respon- sible for the temperature warming, while aerosols in the atmosphere through their negative radiative forcing are re- sponsible for lowering the land surface temperatures. Aerosols affect the environment by their scattering and absorptive properties. The direct impacts of aerosols lead to heating of the atmosphere through absorption and cooling of the land surface due to scattering (Yu et al. 2002). How- ever, due to the shorter lifetime of aerosols, the net effect of greenhouse gases dominate at longer time and larger spatial domains, manifesting as positive trends in surface tempera- ture. Several studies have reported that the global as well as regional mean surface air temperatures have significantly increased in the last century, and pronounced warming has occurred in the last three decades (Jones and Moberg 2003; IPCC 2007). Hingane et al. (1985) reported that the mean D. R. Kothawale (*) : K. K. Kumar Indian Institute of Tropical meteorology, Pune, India e-mail: [email protected]K. K. Kumar e-mail: [email protected]G. Srinivasan RIMES, Bangkok, Thailand Theor Appl Climatol (2012) 110:263–280 DOI 10.1007/s00704-012-0628-8 # Springer-Verlag 2012
Transcript
ORIGINAL PAPER
Spatial asymmetry of temperature trends over Indiaand possible role of aerosols
D. R. Kothawale & K. Krishna Kumar & G. Srinivasan
Received: 1 October 2010 /Accepted: 7 March 2012 /Published online: 24 March 2012
Abstract Dissimilarities in temperature trends in space andtime over the Indian region have been examined to look forsignatures of aerosols’ influence. Separate temperature timeseries for North and South India were constructed for dry(November–May) and wet (June–October) seasons. Tem-perature trend for the entire period 1901–2007 and differentsubperiods of 1901–1950, 1951–1990, 1971–2007, and1991–2007 have been examined to isolate the aerosol andother greenhouse gas influences on temperatures. Maximum(daytime) temperatures during dry season corresponding toNorth and South India show significant warming trend of0.8 and 1.0 °C per hundred years during the period 1901–2007, while minimum temperature shows nebulous trend of0.2 and 0.3 °C per hundred years over North and SouthIndia, respectively. During the wet season, maximum tem-perature shows nearly half of dry season maximum temper-ature warming trend. However, asymmetry is observed indry season maximum temperature trend during post-industrial period 1951–1990 wherein the North/South Indiashows decreasing/increasing trends, while during the recentperiod 1991–2007 trends are uniformly positive for both theregions. Spatial and temporal asymmetry in observed trendsclearly point to the role of aerosols in lowering temperaturetrends over northern India. Atmospheric aerosols could
cause a negative climate forcing that can modulate theregional surface temperature trends in a significant way.As this forcing acts differentially on day and night temper-atures, trends in diurnal temperature range (DTR) provide adirect assessment of impacts of aerosols on temperaturetrends. Time series of diurnal temperature range for dryand wet seasons have been examined separately for Northand South India. Over North India, the DTR for dry seasonhas increased gradually during the period 1901–1970 andthereafter showed decreasing trend, while trends in temper-ature range over Southern India were almost opposite inphase with North India. The aerosol and greenhouse gasesseem to play an important role in the spatial and temporalvariability of temperature range over India.
1 Introduction
Increase in greenhouse gases, viz., CO2, CH4, CFCs, N2O,etc., and water vapor in the atmosphere are mainly respon-sible for the temperature warming, while aerosols in theatmosphere through their negative radiative forcing are re-sponsible for lowering the land surface temperatures.Aerosols affect the environment by their scattering andabsorptive properties. The direct impacts of aerosols leadto heating of the atmosphere through absorption and coolingof the land surface due to scattering (Yu et al. 2002). How-ever, due to the shorter lifetime of aerosols, the net effect ofgreenhouse gases dominate at longer time and larger spatialdomains, manifesting as positive trends in surface tempera-ture. Several studies have reported that the global as well asregional mean surface air temperatures have significantlyincreased in the last century, and pronounced warming hasoccurred in the last three decades (Jones and Moberg 2003;IPCC 2007). Hingane et al. (1985) reported that the mean
D. R. Kothawale (*) :K. K. KumarIndian Institute of Tropical meteorology,Pune, Indiae-mail: [email protected]
annual temperature has increased by about 0.4 °C/100 yearsin India during the period 1901–1982. Srivastava et al.(1992) have studied decadal trends in the climate over Indiaand reported widespread cooling over northern India andwarming over southern India, during the period 1901–1986.Rupa Kumar et al. (1994) pointed out that the increase inannual mean temperatures over India during 1901–1987 wasalmost solely contributed by the increase in maximum tem-peratures (0.6 °C/100 years) with the minimum tempera-tures remaining practically trendless. On filtering out theglobal effects of greenhouse gases and natural variability,Krishnan and Ramanathan (2002) found that all-India sur-face air temperature during the drier part of the year(January–May) cooled by as much as 0.3 °C since 1971.Subsequent analysis by Kothawale and Rupa Kumar (2005)have pointed out that this is rather a perceived cooling andshowed that both all-India annual maximum and minimumtemperatures have significantly increased during recentthree decades (1971–2003). Dash and Hunt (2007) reportedthat during 1901–2003, the maximum temperature of post-monsoon + winter season (October to February) has signif-icantly increased by about 0.75 °C/100 years over bothNorth and South India. Recently, Kothawale et al. (2010)reported that all-India mean, maximum, and minimum tem-peratures have significantly increased by 0.51, 0.71, and0.27 °C per 100 years, respectively, during the period1901–2007, and accelerated warming was observed during1971–2007, mainly due to last decade 1998–2007.
Since then, a few studies have examined the trend in solarradiation reaching the earth surface at selected stations wellspread over the Indian region. Rao et al. (2004) examinedthe effect of urbanization on the meteorological parameters,viz., incoming solar radiation, bright hours of sunshine,relative humidity, rainfall, wind speed, and total cloudamounts at selected urban cities and found that these param-eters have a decreasing tendency during the period 1950–2000. Menon et al. (2002) reported that man made aerosolsmay contribute to climate change in China and India be-cause both absorbing black carbon aerosols and reflectiveaerosols, such as sulfates, reduce the amount of sunlight,reaching the ground and thus should tend to cause localcooling. Recently, Padma Kumari et al. (2007) reported thatthe monthly mean solar radiation at 12 Indian stations underall sky conditions has decreased over the period 1981–2004.Although the solar radiation reaching the earth’s surfaceshowed a decreasing tendency, all-India mean annual max-imum and minimum temperatures show an increasing trend,possibly as a result of increasing greenhouse forcing. Thedecline in solar radiation reaching the earth’s surface ismainly because of atmospheric aerosols.
The aerosol optical depth over northern parts of India isfound to be higher than over southern parts of India due tothe proximity of the region to the source of natural aerosols
from the deserts and also due to higher growth rate ofpopulation, urbanization, and industrialization (Ramanathanand Ramana 2005; Tripathi et al. 2006; Sarkar et al.2006). During the pre-monsoon (March, April, andMay) inflow, dust aerosols are transported from theNorthwestern deserts of India and Pakistan and ArabianPeninsula to the Himalayan–Gangetic region (Middleton1986; Prospero et al. 2002). Recently, Roy (2008)reported that the spatial distribution of aerosol opticaldepth over Indian subcontinent shows considerable spa-tial clustering of higher averages over the entire Gangeticbasin during both summer and winter seasons. Hence, inorder to isolate the influence of aerosols on temperaturewarming in different latitudinal belts, we have examinedtrends in temperature for North India (spatial aggregateof temperatures over the region north of 20° N) andSouth India (south of 20° N) separately during differentperiods of the observed record.
2 Data and analysis
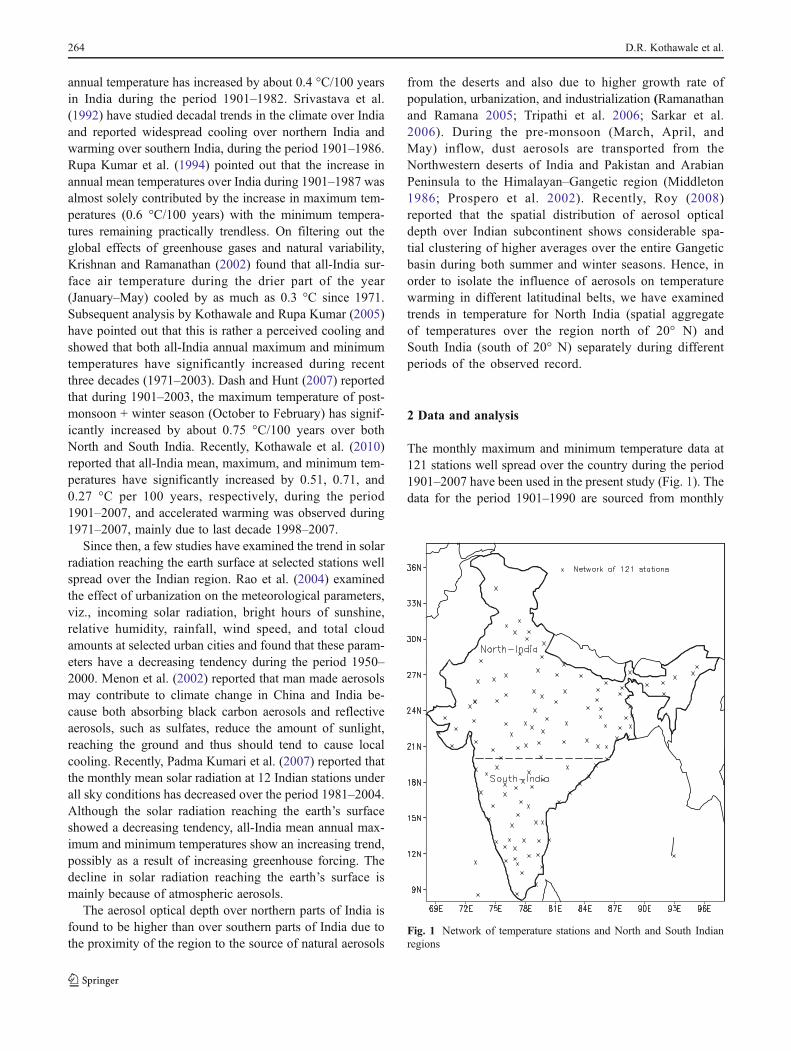
The monthly maximum and minimum temperature data at121 stations well spread over the country during the period1901–2007 have been used in the present study (Fig. 1). Thedata for the period 1901–1990 are sourced from monthly
Fig. 1 Network of temperature stations and North and South Indianregions
264 D.R. Kothawale et al.
weather reports of the India Meteorological Department(IMD) Pune, and data for the period 1991–2007 have beencomputed from daily data from Indian daily WeatherReports published by IMD. An adequate care has been takenregarding the homogeneity of the data, and the outliers inthe data are identified as: when station’s monthly tempera-ture values are greater/lesser than long term mean ± threetimes standard deviation of corresponding month (RupaKumar et al. 1994). The identified outliers have been setas missing, and such missing data amount to <5 % of thetotal number of data points. The missing values then havebeen estimated from the data at neighboring stations byregression techniques.
To prepare spatially well-representative means of temper-atures for the regions North and South India, the gridded(0.5° latitude×0.5° longitude) maximum and minimum tem-perature data, interpolated from 121 stations, during theperiod 1901–2007 have been used (Kothawale and RupaKumar 2005). Regional monthly temperature series arecomputed by averaging the data of constituent grid pointsof the respective regions. Similarly, tropospheric tempera-ture time series of dry and wet seasons have beenprepared for North and South India for the period1971–2007. The temperature time series of North Indiais an average of data from four stations located in theIndo-Gangetic plains, north of 20° N (Jodhpur, Delhi,Lucknow, and Calcutta), and South India (south of 20° N) isan average of data from five stations (Bombay, Hyderabad,Vishakhapatanam, Chennai, and Trivandrum), which arelocated in Peninsular India. To examine aerosol varia-tions over North and South India, aerosol index (AI)monthly series are prepared for the period 1979–2005.Aerosol index data for the period 1979–1992 was obtainedfrom TOMS instrument of resolution 1°×1.25° ( latitude ×longitude), Nimbus-7. The data for the period 1993–1996 arenot available; the data for the period 1997–2005 wereobtained from Earth Probe Satellite (ftp://toms.gsfc.nasa.gov/pub/eptoms/data/aerosol/).
Temperature series for the dry season (previous yearNovember + December + current year January + February +March + April + May) and wet season (June + July +August + September + October) have been constructed.North and south India temperature regions are delineatedbased on aerosol concentration (Fig. 1). Very high level ofaerosol optical depth is observed over the whole of Ganges-river basin, which covers a major part of North India and therest is considered as South India (Reddy and Venkataraman2002a,b).
The regional annual and seasonal temperature series havebeen examined for long-term variations for different peri-ods. The statistical significance of trend is assessed usingthe F ratio, after taking into account the autocorrelation, ifany, present in the series (Wigley and Jones 1981).
3 Results and discussion
In order to assess the trends in surface air temperature overthe Indian region in both daytime (maximum) and nighttime(minimum) and to examine the possible role of aerosols andgreenhouse gases, the trends have been analyzed for the dryand wet seasons for the periods 1901–2007, 1901–1950,1951–1990, 1951–2007, 1971–2007, and 1991–2007. Dur-ing the rainy months of the southwest monsoon season(JJAS), suspended particles and aerosols are removed fromthe atmosphere by washout and scavenging processes, andhence, the temperature trends during wet season are largelydriven by the interannual and multidecadal monsoon vari-ability and greenhouse gas forcing. On the other hand, thedry season from November to May is rain free over most ofIndia (excepting over extreme south east Peninsula), thetemperature trends are largely driven by the presence ofaerosols and greenhouse gases. The focus of this study isto bring out the possible impact of aerosols on the temper-ature trends.
3.1 Monthly aerosol variation over North and South India
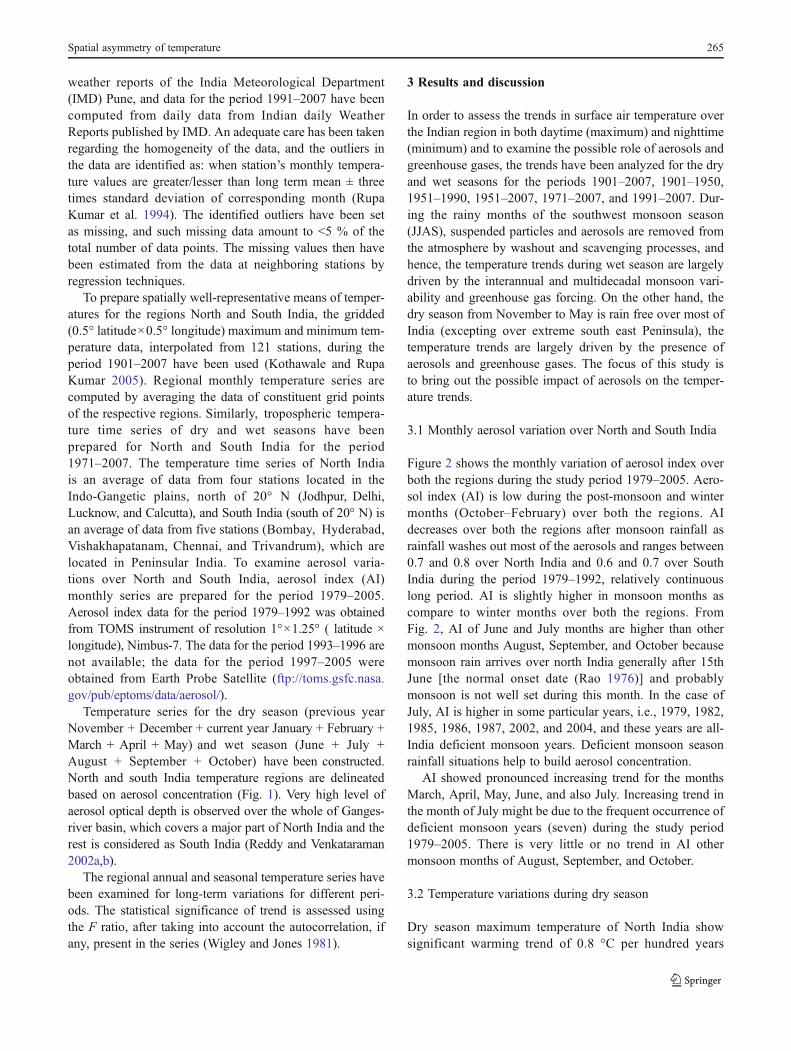
Figure 2 shows the monthly variation of aerosol index overboth the regions during the study period 1979–2005. Aero-sol index (AI) is low during the post-monsoon and wintermonths (October–February) over both the regions. AIdecreases over both the regions after monsoon rainfall asrainfall washes out most of the aerosols and ranges between0.7 and 0.8 over North India and 0.6 and 0.7 over SouthIndia during the period 1979–1992, relatively continuouslong period. AI is slightly higher in monsoon months ascompare to winter months over both the regions. FromFig. 2, AI of June and July months are higher than othermonsoon months August, September, and October becausemonsoon rain arrives over north India generally after 15thJune [the normal onset date (Rao 1976)] and probablymonsoon is not well set during this month. In the case ofJuly, AI is higher in some particular years, i.e., 1979, 1982,1985, 1986, 1987, 2002, and 2004, and these years are all-India deficient monsoon years. Deficient monsoon seasonrainfall situations help to build aerosol concentration.
AI showed pronounced increasing trend for the monthsMarch, April, May, June, and also July. Increasing trend inthe month of July might be due to the frequent occurrence ofdeficient monsoon years (seven) during the study period1979–2005. There is very little or no trend in AI othermonsoon months of August, September, and October.
3.2 Temperature variations during dry season
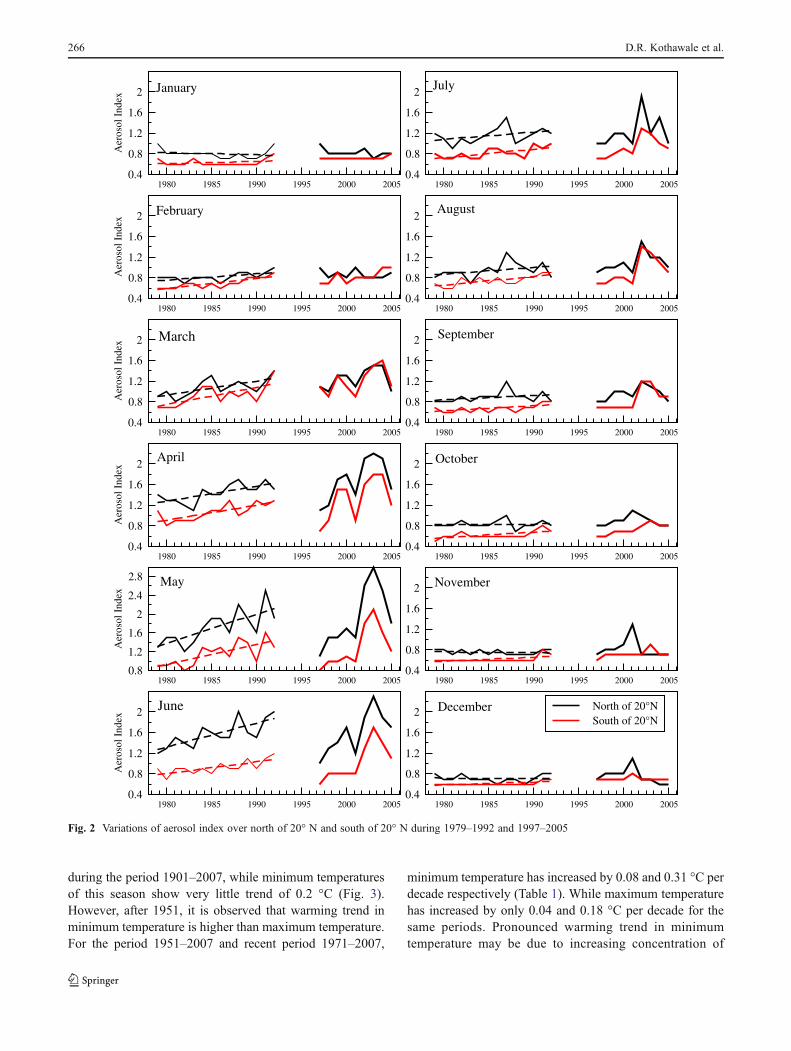
Dry season maximum temperature of North India showsignificant warming trend of 0.8 °C per hundred years
during the period 1901–2007, while minimum temperaturesof this season show very little trend of 0.2 °C (Fig. 3).However, after 1951, it is observed that warming trend inminimum temperature is higher than maximum temperature.For the period 1951–2007 and recent period 1971–2007,
minimum temperature has increased by 0.08 and 0.31 °C perdecade respectively (Table 1). While maximum temperaturehas increased by only 0.04 and 0.18 °C per decade for thesame periods. Pronounced warming trend in minimumtemperature may be due to increasing concentration of
1980 1985 1990 1995 2000 20050.4
0.8
1.2
1.6
2
Aer
osol
Ind
ex
1980 1985 1990 1995 2000 20050.4
0.8
1.2
1.6
2
1980 1985 1990 1995 2000 20050.4
0.8
1.2
1.6
2
Aer
osol
Ind
ex
1980 1985 1990 1995 2000 20050.4
0.8
1.2
1.6
2
1980 1985 1990 1995 2000 20050.4
0.8
1.2
1.6
2
Aer
osol
Ind
ex
1980 1985 1990 1995 2000 20050.4
0.8
1.2
1.6
2
1980 1985 1990 1995 2000 20050.4
0.8
1.2
1.6
2
Aer
osol
Ind
ex
1980 1985 1990 1995 2000 20050.4
0.8
1.2
1.6
2
1980 1985 1990 1995 2000 20050.8
1.2
1.6
2
2.4
2.8
Aer
osol
Ind
ex
1980 1985 1990 1995 2000 20050.4
0.8
1.2
1.6
2
1980 1985 1990 1995 2000 20050.4
0.8
1.2
1.6
2
Aer
osol
Ind
ex
1980 1985 1990 1995 2000 20050.4
0.8
1.2
1.6
2 North of 20°NSouth of 20°N
January
February
March
April
May
June
July
August
September
October
November
December
Fig. 2 Variations of aerosol index over north of 20° N and south of 20° N during 1979–1992 and 1997–2005
Trend for 1901-2007Mean temperatureTrend for 1951-1990Trend for 1991-2007
North of 20°N maximum temperature
South of 20°N maximum temperature
North of 20°N minimum temperature
South of 20°N minimum temperature
Trend = 0.8°C/100yrs** (1901-2007)
Trend = 1.0°C/100yrs** (1901-2007)
Trend = 0.2°C/100yrs (1901-2007)
Trend = 0.3°C/100yrs (1901-2007)
Trend = 0.27°C/10yrs (1991-2007)
Trend = 0.31°C/10yrs** (1991-2007)
Trend = 0.65°C/10yrs** (1991-2007)
Trend = 0.08°C/10yrs (1991-2007)
Trend = -0.1°C/10yrs (1951-1990)
Trend = 0.14°C/10yrs* (1951-1990)
Trend = -0.08°C/10yrs (1951-1990)
Trend = 0.05°C/10yrs (1951-1990)
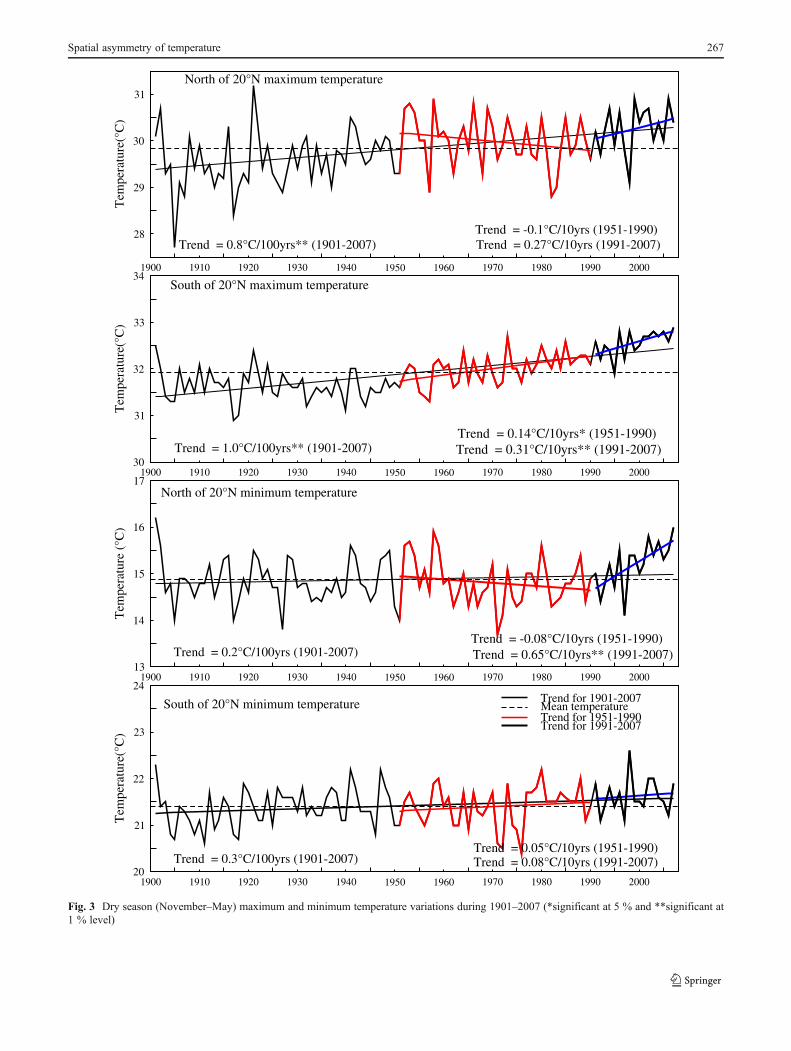
Fig. 3 Dry season (November–May) maximum and minimum temperature variations during 1901–2007 (*significant at 5 % and **significant at1 % level)
Spatial asymmetry of temperature 267
greenhouse gases during this period. In case of South India,maximum as well as minimum temperatures show signifi-cant warming trend of 1.0 and 0.3 °C per hundred year,respectively, for the period 1901–2007 (Fig. 3). The magni-tude of warming trend of both maximum and minimumtemperature is comparatively higher than the respectivetemperature trends of North India. The trends have alsobeen examined for subregions of North India, i.e., Westernpart of North India (20° N to 32° N and 68° E to 77° E),which falls mainly in the desert region of India and Pakistan(Gujart, Punjab, and Harayan) and second region largelycovering Gangetic valley (20° N to 28° N and 78° E to90° E), which is one of the highly polluted regions in theworld (Ramanathan and Ramana 2005). Dry and wet seasonmaximum temperature of both the subregions showed almostsame trends as noted for entire North India for all the subper-iods. However, dry season minimum temperature of Westernpart of North India showed higher trends for all the subperiodsthan North India (Table 1). It may be due to increasingconcentration of aerosols (such as with increased presence ofdust) as well as increase in greenhouse gas concentration,which increase nighttime (minimum) temperature.
North and South India temperature series are also markedby considerable decadal variability within the entire period,and it may be due to relative contribution of atmosphericaerosols, greenhouse gases, and urbanization in the regionaltemperature trends in different periods. Hence, decadal
variability in the series is examined in terms of trend anal-ysis for different periods (1901–1950, 1951–1990, 1951–2007, 1971–2007, 1991–2007, and entire period 1901–2007). The period 1951 onwards is considered as postin-dustrial era, as there has been conspicuous increase in thenumber of industries, and from 1991 onwards, the green-house gas emissions in the atmosphere have sharply in-creased (IPCC 2007). During the period 1901–1950,considered as preindustrial period, maximum as well asminimum temperatures of both North and South India re-main trendless (Table 1). The period 1951 onwards, post-industrial era, where aerosols and greenhouse gases arecontinuously increasing in the atmosphere, and they havecompeting effects on climate, higher aerosol loading iscausing substantial decrease in solar radiation and resultedinto lowering of land surface temperatures. Kothawale andRupa Kumar (2005) reported that the accelerated warming isobserved during the period 1971–2003 compared to theperiod 1901–2003. Hence, in the present study, the period1971–2007 is considered to study the changes in temper-atures during the recent period. The prominent feature thatemerges from the time series of maximum temperatureduring 1901–2007 as shown in Fig. 3 is that the dry seasonmaximum temperature of North India shows a decreasingtrend over the period 1951–1990, the aerosols effect moreprominent than greenhouse forcing. On the other hand, thetime series of South India maximum temperature showed a
Table 1 Trend (°C/10 year) in dry and wet season maximum and minimum temperatures during different sub-periods for the regions north of 20° N, south of 20° N, and sub regions of north of 20° N
Maximum temperature sub-region of north of 20° N
North of 20° N South of 20° N Gangetic plain Western part North India
*Significant at 5 % level; **significant at 1 % level (for period 1901–2007, trend expressed per 100 years and for rest of the period trend expressedper 10 years)
268 D.R. Kothawale et al.
monotonous increasing trend. The trends after 1991 aremuch steeper for North and South India compared to anyother period in the past (Fig. 3, Table 1). The substantialincrease in greenhouse gases after 1990 may be restrictingthe aerosol-related temperature cooling and producing a neteffect of temperature warming.
3.3 Temperature variations during wet season
Figure 4 shows temperature variations in the wet seasonduring the period 1901–2007. The maximum temperatureof both North and South India showed significant warmingtrends of 0.52 and 0.58 °C per hundred years during 1901–2007. Temperature trends for different subperiods are almostthe same to the trend observed for the entire period, except-ing that the maximum temperature during the period 1901–1950 in both the regions showed decreasing trend (Table 1).It may be noted that during a period 1951–1990 (postindustrial era), maximum temperature of both the regionsshowed increasing trend; however for the same period, thedry season maximum temperature of North India showeddecreasing trend perhaps due to higher aerosols loading overthat region. The increasing trend in maximum temperatureof wet season during 1951–1990 may be due to lack ofaerosols effect on surface temperature, as aerosol loadingrelatively minor during this season under the washout andscavenging influence. The minimum temperature showed de-creasing trend over these regions during the above mentionedperiod (Fig. 4). However, in the period 1991–2007, minimumtemperature showed increasing trend over both the regionswith pronounced increasing trends observed over North India.
3.4 Trends in diurnal temperature range
Figure 5 shows the diurnal temperature range (maximum–minimum temperature) during dry and wet seasons overNorth and South India in the period 1901–2007. Diurnaltemperature range (DTR) showed a gradual increase overNorth India during the period 1901–1970, and it shows adecreasing trend after that period. While over South India,the DTR showed a decreasing trend up to 1940s, and there-after, it started increasing. The increase in DTR after 1991 ismuch steeper. During this period, the rate of increase inmaximum temperature was much higher than minimumtemperature. Maximum temperature has increased by0.31 °C per decade, while minimum temperature increasedby only 0.08 °C per decade (Table 1, Fig. 3). It appears thatthe greenhouse effect is more prominent than the aerosolseffect over South India. Prasad et al. (2004) reported thatSouthern India experiences low aerosol loading except insome parts of Maharashtra state (near Mumbai). In the caseof North India, the DTR increased up to the period 1970,due to significant increasing trend (1.2 °C/10 years) in
maximum temperature and no trend in minimum tempera-ture. From 1970 onwards, temperature range decreasedslowly up to the recent year 2007. During this period,minimum temperature has increased (0.31 °C/10 years)faster than the maximum temperature (trend, 0.18 °C/10 years, Table 1), resulting in a narrowing of temperaturerange. Aerosols over this region have been reported to besharply increasing since 1970 (Prasad et al. 2004; Porch etal. 2007; Zhang and Reid 2010), which possibly leads to adecreased daytime temperature and the DTR as a conse-quences (Panikar et al. 2008).
Wet season DTR variability on decades to multidecadesscales over both the regions is mainly driven by the mon-soon rainfall. There is an anticorrelation between DTR andmonsoon rainfall. The time series of DTR over North andSouth India are negatively correlated with their respectivemonsoon rainfall time series, and the correlation coefficientsare −0.40 and −0.52, respectively, for the period 1901–2007, which are significant above 0.1 % level. DTR of boththe regions are found to be in same phase except during theperiod 1980–2007 (Fig. 5), where DTR of North Indiashowed a decreasing trend, while the DTR of South Indiashowed no perceptable trend. The decreasing trend in DTR ofNorth India may be due to the aerosols present in this region.The availability of aerosol during this period over North Indiamay be due to frequent occurrence of deficient monsoon yearsduring this period (Kothawale and Kulkarni 2011).
Changes in DTR can happen due to multiple causes, suchas aerosols, water vapor, greenhouse gases, cloud cover andland use changes, and urbanization. The aerosols have astrong influence on DTR. Atmospheric aerosols influencethe climate directly by scattering and absorption of incom-ing solar radiation, leading to surface cooling during day.
3.5 Spatial patterns of dry and wet seasons maximumtemperature trends
In the previous section, we have discussed the trends in thespatially aggregated means pertaining to North and SouthIndia. However, they do not indicate which regions in thecountry show significant positive/negative trends in differentseasons and in different periods of interest. In view of this, wepresent here a detailed analysis of spatial trends of maximumand minimum temperatures for dry and wet seasons during1901–2007, 1901–1950, 1951–1990, and 1991–2007. In ad-dition to these, the spatial patterns of dry and wet season DTRtrends have been examined for the recent period 1971–2007,and its subperiods 1971–1990 and 1991–2007 in which aero-sol concentration has increased substantially (Fig. 12).
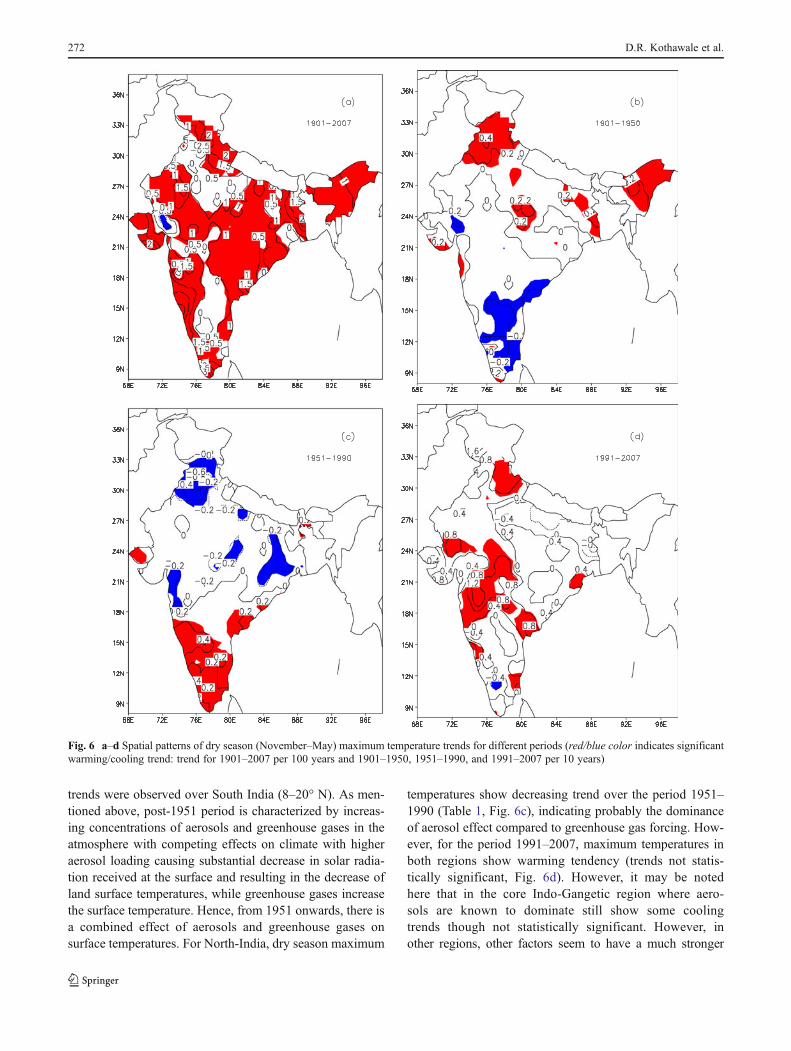
The significant warming trend of dry season maximumtemperatures for the period 1901–2007 is spatially wellspread over the entire country with very few areas showingcooling trends (Fig. 6a). While examining the spatial
Fig. 5 Variation of diurnal temperature range (DTR; maximum–minimum temperature) during the period 1901–2007
Spatial asymmetry of temperature 271
trends were observed over South India (8–20° N). As men-tioned above, post-1951 period is characterized by increas-ing concentrations of aerosols and greenhouse gases in theatmosphere with competing effects on climate with higheraerosol loading causing substantial decrease in solar radia-tion received at the surface and resulting in the decrease ofland surface temperatures, while greenhouse gases increasethe surface temperature. Hence, from 1951 onwards, there isa combined effect of aerosols and greenhouse gases onsurface temperatures. For North-India, dry season maximum
temperatures show decreasing trend over the period 1951–1990 (Table 1, Fig. 6c), indicating probably the dominanceof aerosol effect compared to greenhouse gas forcing. How-ever, for the period 1991–2007, maximum temperatures inboth regions show warming tendency (trends not statis-tically significant, Fig. 6d). However, it may be notedhere that in the core Indo-Gangetic region where aero-sols are known to dominate still show some coolingtrends though not statistically significant. However, inother regions, other factors seem to have a much stronger
Fig. 6 a–d Spatial patterns of dry season (November–May) maximum temperature trends for different periods (red/blue color indicates significantwarming/cooling trend: trend for 1901–2007 per 100 years and 1901–1950, 1951–1990, and 1991–2007 per 10 years)
272 D.R. Kothawale et al.
influence than aerosols. The substantial increase in green-house gases and possibly the changing character of aerosolsfrom predominantly radiating to absorbing (Ming et al. 2008)after 1990 may be restricting the cooling trends and resultingin a net warming trend.
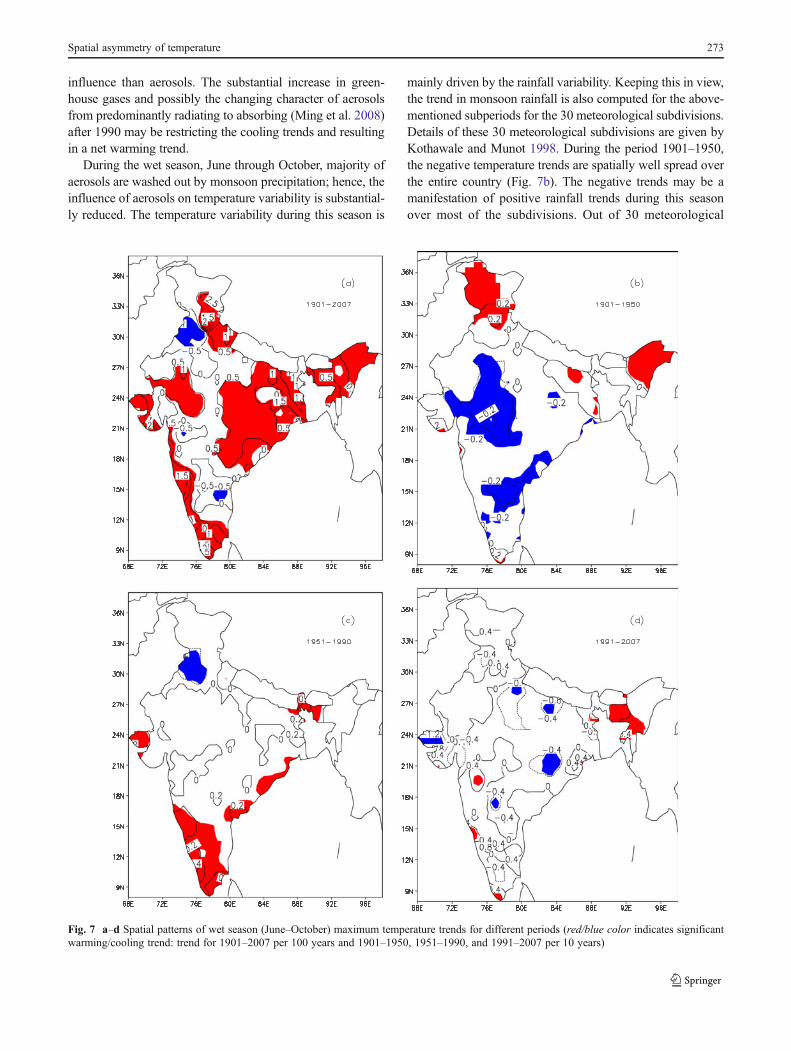
During the wet season, June through October, majority ofaerosols are washed out by monsoon precipitation; hence, theinfluence of aerosols on temperature variability is substantial-ly reduced. The temperature variability during this season is
mainly driven by the rainfall variability. Keeping this in view,the trend in monsoon rainfall is also computed for the above-mentioned subperiods for the 30 meteorological subdivisions.Details of these 30 meteorological subdivisions are given byKothawale and Munot 1998. During the period 1901–1950,the negative temperature trends are spatially well spread overthe entire country (Fig. 7b). The negative trends may be amanifestation of positive rainfall trends during this seasonover most of the subdivisions. Out of 30 meteorological
Fig. 7 a–d Spatial patterns of wet season (June–October) maximum temperature trends for different periods (red/blue color indicates significantwarming/cooling trend: trend for 1901–2007 per 100 years and 1901–1950, 1951–1990, and 1991–2007 per 10 years)
Spatial asymmetry of temperature 273
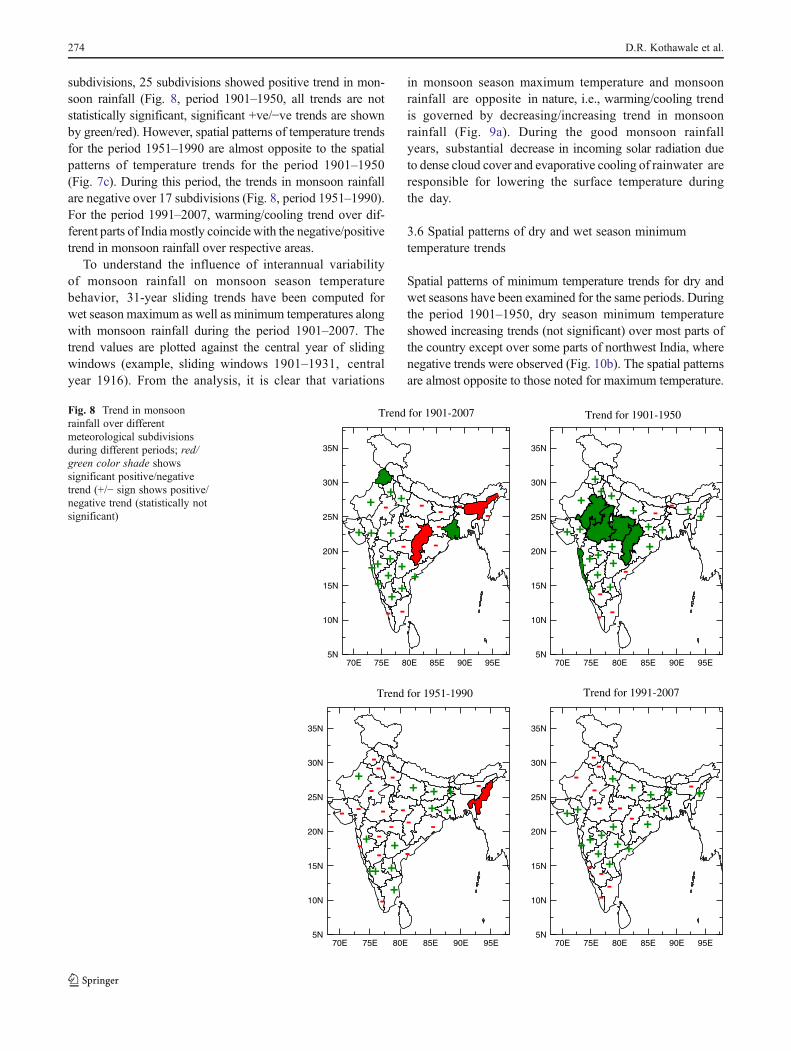
subdivisions, 25 subdivisions showed positive trend in mon-soon rainfall (Fig. 8, period 1901–1950, all trends are notstatistically significant, significant +ve/−ve trends are shownby green/red). However, spatial patterns of temperature trendsfor the period 1951–1990 are almost opposite to the spatialpatterns of temperature trends for the period 1901–1950(Fig. 7c). During this period, the trends in monsoon rainfallare negative over 17 subdivisions (Fig. 8, period 1951–1990).For the period 1991–2007, warming/cooling trend over dif-ferent parts of India mostly coincide with the negative/positivetrend in monsoon rainfall over respective areas.
To understand the influence of interannual variabilityof monsoon rainfall on monsoon season temperaturebehavior, 31-year sliding trends have been computed forwet season maximum as well as minimum temperatures alongwith monsoon rainfall during the period 1901–2007. Thetrend values are plotted against the central year of slidingwindows (example, sliding windows 1901–1931, centralyear 1916). From the analysis, it is clear that variations
in monsoon season maximum temperature and monsoonrainfall are opposite in nature, i.e., warming/cooling trendis governed by decreasing/increasing trend in monsoonrainfall (Fig. 9a). During the good monsoon rainfallyears, substantial decrease in incoming solar radiation dueto dense cloud cover and evaporative cooling of rainwater areresponsible for lowering the surface temperature duringthe day.
3.6 Spatial patterns of dry and wet season minimumtemperature trends
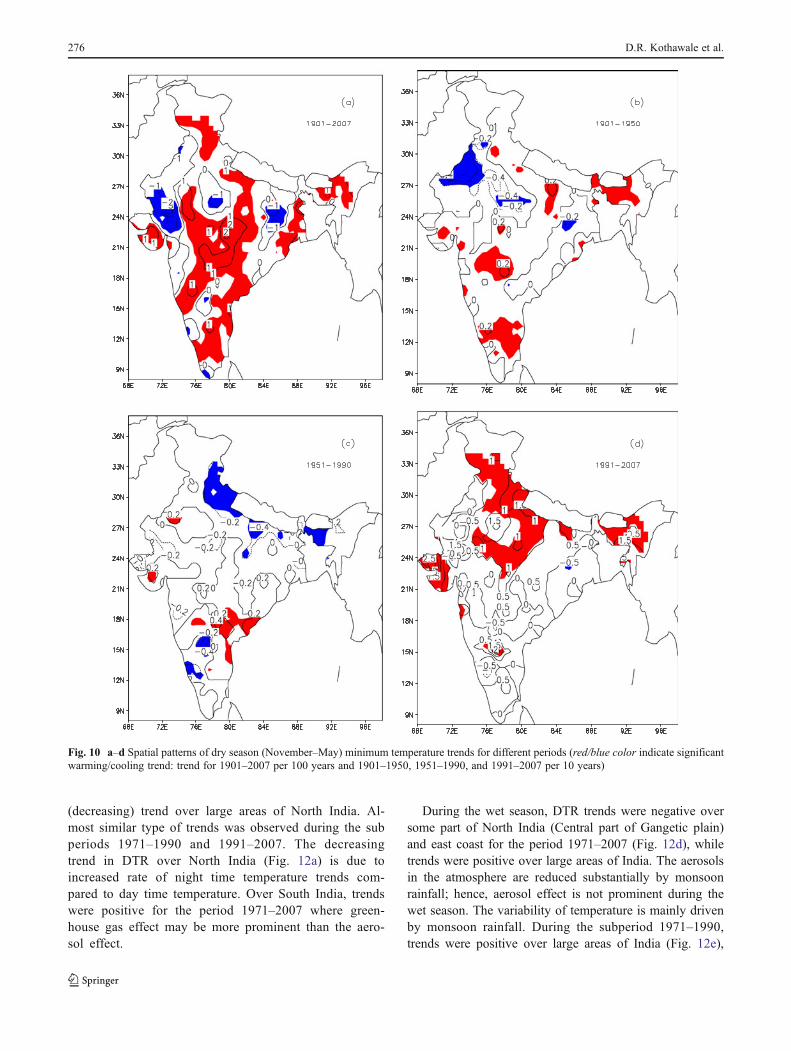
Spatial patterns of minimum temperature trends for dry andwet seasons have been examined for the same periods. Duringthe period 1901–1950, dry season minimum temperatureshowed increasing trends (not significant) over most parts ofthe country except over some parts of northwest India, wherenegative trends were observed (Fig. 10b). The spatial patternsare almost opposite to those noted for maximum temperature.
70E 75E 80E 85E 90E 95E5N
10N
15N
20N
25N
30N
35N
++
+ +-
+-+
+++
+
+
++ +++
+++ + +
-+
+
-
++-
Trend for 1901-2007
+++
-
Trend for 1901-1950
Trend for 1951-1990 Trend for 1991-2007
70E 75E 80E 85E 90E 95E5N
10N
15N
20N
25N
30N
35N
+
+
-+++
++++
++
--
--- -++
++ + + -
+++
--+-
-
70E 75E 80E 85E 90E 95E5N
10N
15N
20N
25N
30N
35N
++ +
++ +
+++
+++
+++
- - - --
--
--
--
70E 75E 80E 85E 90E 95E5N
10N
15N
20N
25N
30N
35N
+--+
+-+++
--
-
-- ---
-+-
- -
-+
+
++
-+
-
Fig. 8 Trend in monsoonrainfall over differentmeteorological subdivisionsduring different periods; red/green color shade showssignificant positive/negativetrend (+/− sign shows positive/negative trend (statistically notsignificant)
274 D.R. Kothawale et al.
For example, decreasing trends in maximum temperature areobserved over Peninsular India, while increasing trends areobserved over same area for the minimum temperature. Dur-ing the period 1951–1990, most parts of the country exhibitcooling trends, especially a large area of North India(Fig. 10c), while negative trends in maximum temperatureare only confined to north of 20° N. After 1990, minimumtemperature showed an increase over large areas of the coun-try with pronounced trends over North India (Fig. 10d).
Spatial patterns of wet season minimum temperaturehave also been examined for the same subperiods. Thetrends are positive for the period 1901–1950 except innorthwest part of India where trends are negative(Fig. 11b). For the period 1951–1990, the trends are nega-tive over almost the entire country (Fig. 11c). These trendsare opposite to the trends observed for maximum temper-atures in the respective periods. The minimum temperatureshowed increasing trend over large area of the countryduring the recent period 1991–2007 (Fig. 11d). The associ-ation between rainfall and temperature variability has alsobeen studied for the entire period 1901–2007 by examiningthe 31-year sliding trends. The temperature and rainfallsliding trends go hand in hand up to the period 1980 (centralyear); however, after 1980, the rainfall showed decreasing
trend and temperature showed the increasing trend (Fig. 9b).During good monsoon rainfall period, the total amount ofdense cloud cover and substantial amount of water vaporhelp to increase nighttime temperature and vice versa duringweak monsoon years (Fig. 9b). Decoupling between mini-mum temperature and rainfall after 1980 possibly indicatesthe predominance of greenhouse gases forcing.
DTR and rainfall variability have also been examined(Fig. 9c). The precipitation effects on maximum andminimum temperatures can be better understood consid-ering DTR compared to maximum and minimum tem-perature separately. The analysis reveals that temperaturerange and monsoon rainfall are in opposite phase duringthe entire data period. The aerosol indirect effects suchas changes in cloud properties as well as greenhousegases can lead to a long-wave surface warming at nightand daytime cooling from aerosol–solar radiation interactionresulting in the decrease of DTR.
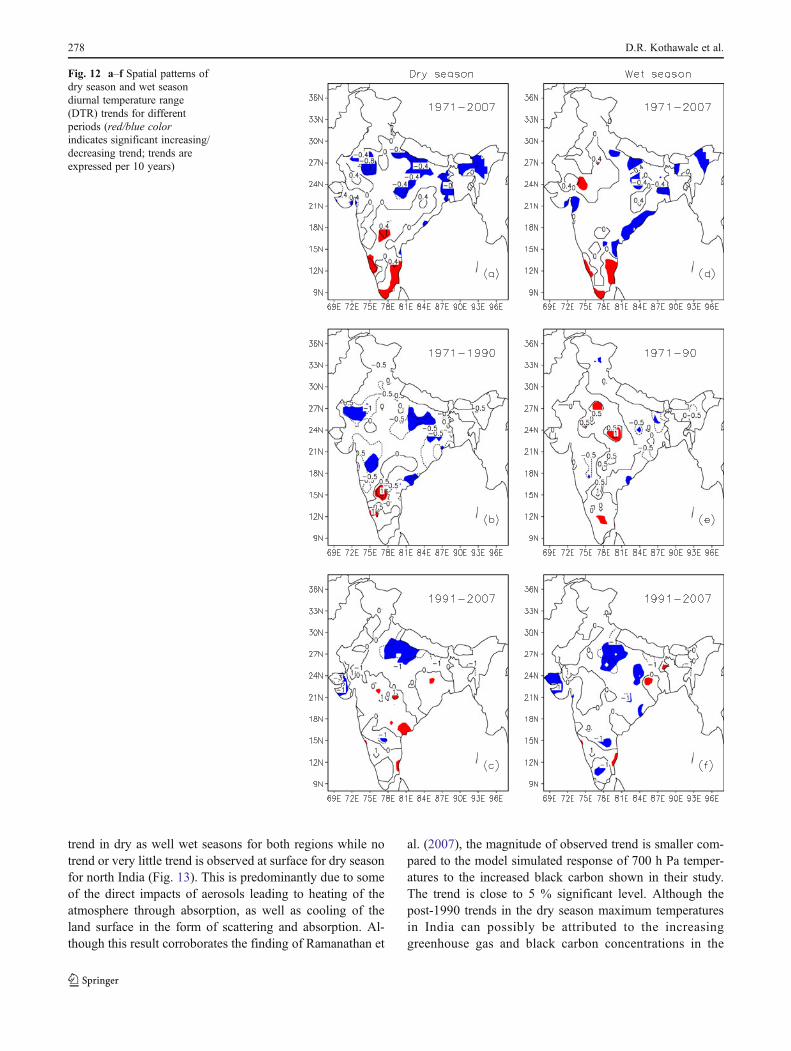
3.7 Spatial patterns of dry and wet season DTR trends
Spatial variation of dry and wet season DTR trends havebeen examined for the recent warming period 1971–2007(Fig. 12). Dry season temperature range showed a negative
Fig. 9 a–c Thirty-one yearsliding trend in monsoon rain-fall and wet season maximum,minimum temperature, anddiurnal temperature range(DTR)
Spatial asymmetry of temperature 275
(decreasing) trend over large areas of North India. Al-most similar type of trends was observed during the subperiods 1971–1990 and 1991–2007. The decreasingtrend in DTR over North India (Fig. 12a) is due toincreased rate of night time temperature trends com-pared to day time temperature. Over South India, trendswere positive for the period 1971–2007 where green-house gas effect may be more prominent than the aero-sol effect.
During the wet season, DTR trends were negative oversome part of North India (Central part of Gangetic plain)and east coast for the period 1971–2007 (Fig. 12d), whiletrends were positive over large areas of India. The aerosolsin the atmosphere are reduced substantially by monsoonrainfall; hence, aerosol effect is not prominent during thewet season. The variability of temperature is mainly drivenby monsoon rainfall. During the subperiod 1971–1990,trends were positive over large areas of India (Fig. 12e),
Fig. 10 a–d Spatial patterns of dry season (November–May) minimum temperature trends for different periods (red/blue color indicate significantwarming/cooling trend: trend for 1901–2007 per 100 years and 1901–1950, 1951–1990, and 1991–2007 per 10 years)
276 D.R. Kothawale et al.
while trends were negative at some small pockets during theperiod 1991–2007 (Fig. 12f).
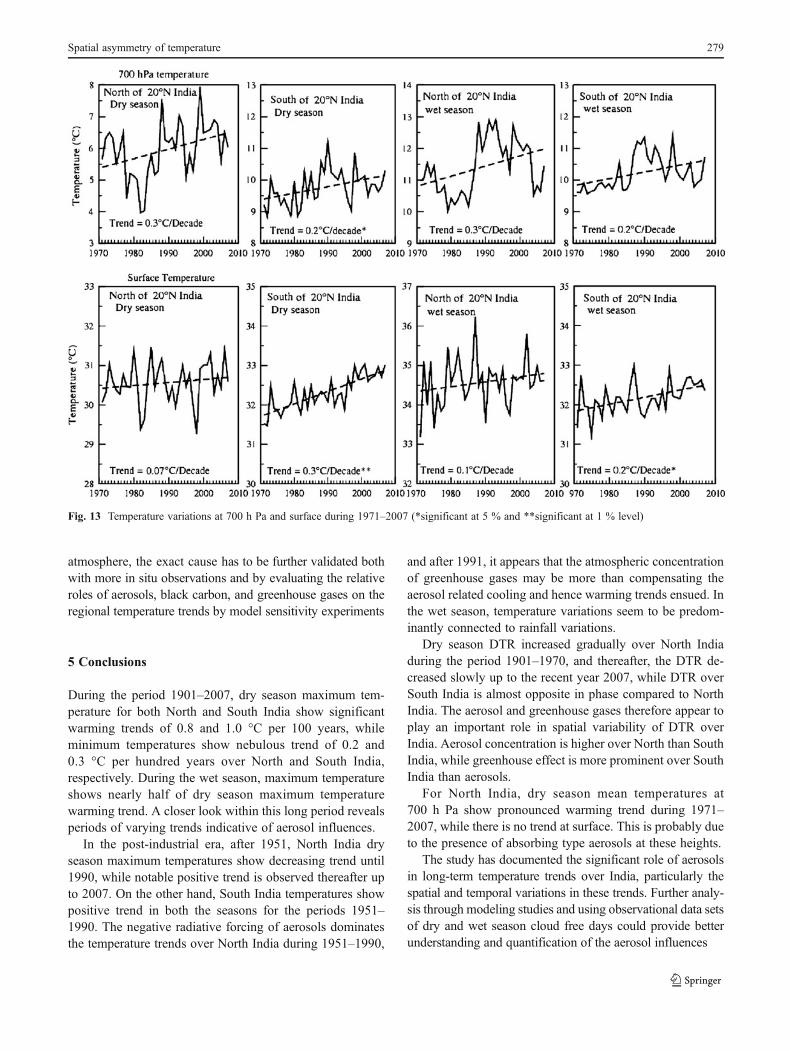
4 Tropospheric temperature trend in dry and wetseasons
Some recent studies (Ramanathan et al. 2007; Ming et al.2008) indicate increasing atmospheric black carbon over the
Indian region after 1990s resulting in the warming of ambi-ent temperatures at 700 h Pa level as shown by modelexperiments. This has prompted us to examine the trendsin the mean temperature at different upper air levels, viz.,850, 700, 500, 200, and 150 h Pa during 1971–2007. Trendsare, however, shown here for 700 h Pa level only. Tropo-spheric temperature time series of dry and wet seasons havebeen prepared for north of 20° N and south of 20° N.Temperature time series at 700 h Pa levels showed warming
Fig. 11 a–d Spatial patterns of wet season (June–October) minimum temperature trends for different periods (red/blue color indicate significantwarming/cooling trend: trend for 1901– 2007 per 100 years and 1901–1950, 1951–1990, and 1991–2007 per 10 years)
Spatial asymmetry of temperature 277
trend in dry as well wet seasons for both regions while notrend or very little trend is observed at surface for dry seasonfor north India (Fig. 13). This is predominantly due to someof the direct impacts of aerosols leading to heating of theatmosphere through absorption, as well as cooling of theland surface in the form of scattering and absorption. Al-though this result corroborates the finding of Ramanathan et
al. (2007), the magnitude of observed trend is smaller com-pared to the model simulated response of 700 h Pa temper-atures to the increased black carbon shown in their study.The trend is close to 5 % significant level. Although thepost-1990 trends in the dry season maximum temperaturesin India can possibly be attributed to the increasinggreenhouse gas and black carbon concentrations in the
Fig. 12 a–f Spatial patterns ofdry season and wet seasondiurnal temperature range(DTR) trends for differentperiods (red/blue colorindicates significant increasing/decreasing trend; trends areexpressed per 10 years)
278 D.R. Kothawale et al.
atmosphere, the exact cause has to be further validated bothwith more in situ observations and by evaluating the relativeroles of aerosols, black carbon, and greenhouse gases on theregional temperature trends by model sensitivity experiments
5 Conclusions
During the period 1901–2007, dry season maximum tem-perature for both North and South India show significantwarming trends of 0.8 and 1.0 °C per 100 years, whileminimum temperatures show nebulous trend of 0.2 and0.3 °C per hundred years over North and South India,respectively. During the wet season, maximum temperatureshows nearly half of dry season maximum temperaturewarming trend. A closer look within this long period revealsperiods of varying trends indicative of aerosol influences.
In the post-industrial era, after 1951, North India dryseason maximum temperatures show decreasing trend until1990, while notable positive trend is observed thereafter upto 2007. On the other hand, South India temperatures showpositive trend in both the seasons for the periods 1951–1990. The negative radiative forcing of aerosols dominatesthe temperature trends over North India during 1951–1990,
and after 1991, it appears that the atmospheric concentrationof greenhouse gases may be more than compensating theaerosol related cooling and hence warming trends ensued. Inthe wet season, temperature variations seem to be predom-inantly connected to rainfall variations.
Dry season DTR increased gradually over North Indiaduring the period 1901–1970, and thereafter, the DTR de-creased slowly up to the recent year 2007, while DTR overSouth India is almost opposite in phase compared to NorthIndia. The aerosol and greenhouse gases therefore appear toplay an important role in spatial variability of DTR overIndia. Aerosol concentration is higher over North than SouthIndia, while greenhouse effect is more prominent over SouthIndia than aerosols.
For North India, dry season mean temperatures at700 h Pa show pronounced warming trend during 1971–2007, while there is no trend at surface. This is probably dueto the presence of absorbing type aerosols at these heights.
The study has documented the significant role of aerosolsin long-term temperature trends over India, particularly thespatial and temporal variations in these trends. Further analy-sis through modeling studies and using observational data setsof dry and wet season cloud free days could provide betterunderstanding and quantification of the aerosol influences
Fig. 13 Temperature variations at 700 h Pa and surface during 1971–2007 (*significant at 5 % and **significant at 1 % level)
Spatial asymmetry of temperature 279
Acknowledgments The authors are thankful to Director Prof. B. N.Goswami, Indian Institute of Tropical Meteorology (IITM) Pune forproviding the necessary facilities for this study. The authors are alsograteful to National Data Center of India Meteorological Departmentfor providing the surface and upper air temperature data.
References
Dash SK, Hunt JCR (2007) Variability of climate change in India. CurrSci 93(6):25
Hingane LS, Rupa Kumar K, Ramana Murthy Bh V (1985) Long termtrends of surface air temperature in India. Int Jr Climatol 5:521–528
IPCC (2007) Climate change (2007): the scientific basis. Contributionof Working Group-I to the Fourth Assessment Report of Inter-governmental Panel on Climate Change (IPCC). Cambridge Uni-versity Press, Cambridge
Jones PD, Moberg A (2003) Hemispheric and large-scale surface airtemperature variations: an extensive revision and update to 2001.J Climate 16:206–223
Kothawale DR, Kulkarni JR (2011) Indian monsoon rainfall variabilityin warming scenario over Indian continent. Extended_ abstract_O-CHAMP 2012
Kothawale DR, Munot AA (1998) Probabilities of excess and deficientsouthwest monsoon rainfall over different meteorological sub-divisions of India. Proc Ind Acad Sci (E & P Sci) 107:107–119
Kothawale DR, Rupa Kumar K (2005) On the recent changes insurface temperature trends over India. Geophys Res Lett 32:L18714. doi:10.1029/2005GL023528
Kothawale DR, Munot AA, Krishna Kumar K (2010) Surface air tem-perature variability over India during 1901–2007, and its associationwith ENSO. Clim Res 42:89–104. doi:10.3354/cr00857
Krishnan R, Ramanathan V (2002) Evidence of surface cooling fromabsorbing aerosols. Geophys Res Lett 29:54-1–54-4
Menon S, Hansen J, Nazarenko L, Luo Y (2002) Climate effect ofblack carbon aerosols in China and India. Science 297:2250–2253
Middleton NJ (1986) A geography of dust storms in southwest Asia.Int J Climatol 6:183–196
Ming J, Cachier H, Xiao C, Qin D, Kang S, Hou S, Xu J (2008) Blackcarbon record based on a shallow Himalayan ice core and itsclimate implications. Atmos Chem Phys 8:1343–1352
Padma kumari B, Londhe AL, Daniel S, Jadhav DB (2007) Observa-tional evidence of solar dimming: offsetting surface warming overIndia. Geophys Res Lett 34:L21810. doi:10.1029/2007GL031133
Panikar AS, Pandithurai G, Safai PD, Kewat S (2008) Observation ofenhanced aerosol long wave radiative forcing over an urbanenvironment. Geophys Res Lett 35:L04817. doi:10.1029/2007GL032879
Porch W, Chylek P, Dubey M, Massie M (2007) trends in aerosoloptical depth for cities in India. Atmos Environ 4:7524–7532
Prasad AK, Singh RP, Singh A ( 2004) Variability of aerosol opticaldepth over Indian subcontinent usingMODIS data. Jr Indian SocietyRemote Sens 32(4):313–316
Prospero JM, Ginoux P, Torres O, Nicholson SE, Gill TE (2002)Environmental characterization of global sources of atmosphericsoil dust identified with the Nimbus 7 Total Ozone MappingSpectrometer (TOMS) absorbing aerosol product. Rev Geophys40(1):1002. doi:10.1029/2000RG000095
Ramanathan V, Ramana MV (2005) Persistent, widespread, andstrongly absorbing haze over the Himalayan foothills and theIndo-Ganges basins. Pure Appl Geophys 162:1609–1626
Ramanathan V, Ramana MV, Robert G, Kim D, Cooigan C, Chung C,Winker D (2007) Warming trends in Asia amplified by browncloud solar absorption. Nature 448(2):575–578. doi:nature 06019/nature06019
Rao PGS, Jaswal AK, Kumar MS (2004) Effects of urbanization onmeteorological parameters. Mausam 55(3):429–440
Reddy MS, Venkataraman C (2002a) Inventory of aerosol and sulfurdioxide emissions from India: I. Fossil fuel combustion. AtmosEnviron 36:699–712
Reddy MS, Venkataraman C (2002b) Inventory of aerosol and sulfurdioxide emissions from India: II. Biomass combustion, fossil fuelcombustion. Atmos Environ 36:677–697
Roy SS (2008) Impact of aerosol optical depth on seasonal temper-atures in India: a spatio-temporal analysis. Int J Remote Sens 29(3):727–740
Rupa Kumar, Krishna Kumar K, Pant GB (1994) Diurnal asymmetryof surface temperature trends over India. Geophys Res Lett21:677–680
Sarkar SR, Chokngamwong G, Cervone RP, Singh KM (2006) Vari-ability of aerosol optical depth and aerosol forcing over India.Adv Space Res 37(12):2153–2159
Srivastava HN, Dewan BN, Dikshit SK, Prakash Rao GS, Singh SS, RaoKR (1992) Decadal trends in climate over India. Mausam 43:7–20
Tripathi SN, Tare V, Chinnam N, Srivastava AK, Dey S, Agarwal A,Kishore S, Lal RB, Manar M, Kanwade VP, Chauhan SS, SharmaM, Redd RR, Rama GK, Narasimhulu K, Siva Sankara Reddy L,Gupta S, Lal S (2006) Measurements of atmospheric parametersduring Indian Space Research Organization Geosphere BiosphereProgramme Land Campaign II at a typical location in the Gangabasin: 1, Physical and optical properties. J Geophys Res 111:D23209.doi:10.1029/2006JD007278
Wigley TML, Jones PD (1981) Detecting CO2 induced climaticchange. Nature 292:205–208
Yu H, Liu SC, Dickinson RE (2002) Radiative effects of aerosols onthe evolution of the atmospheric boundary layer. J Geophys Res107(D12):4142
Zhang J, Reid JS (2010) A decadal regional and global trend analysisof the aerosol optical depth using a data assimilation grade over-water MODIS and Level 2 MISR aerosol product. Atmos ChemPhys 10:10949–10963