Spatial Database and GIS for CBMS, Experience from Palawan, Philippines 21/10/03
1
665000
665000
670000
670000
675000
675000
680000
680000
685000
685000
690000
690000
695000
695000
1060
000 1060000
1065
000 1065000
1070
000 1070000
1075
000 1075000
1080
000 1080000
1085
000 1085000
Spatial database (NRDB) and GIS applications for Community Based Monitoring Systems (CBMS)
Experience from Palawan, Philippines
Dirk Heinrichs Environmental Engineer, Urban and Regional Planner Erich-Weinert Str. 21 10439 Berlin Germany e-mail: [email protected] October 2003
Spatial Database and GIS for CBMS, Experience from Palawan, Philippines 21/10/03
2
Spatial database (NRDB) and GIS applications for Community Based Monitoring Systems (CBMS):
Experience from Palawan, Philippines
Introduction Community based Monitoring (CBMS) activities in the province of Palawan, Philippines,
started in 1999 as an initiative of Provincial Government with the support of MIMAP
Philippines. Parallel to CBMS data collection (using household questionnaires) and
processing, the Provincial Planning and Development Office developed computer based
applications to organize data management, integration, validation and spatial analysis. In
cooperation with Engr. Dirk Heinrichs, who worked with the Planning Office of the Province
between 1999 and 2003 under the Integrated Expert Program of GTZ/CIM Germany,
Provincial Government set up a spatial database and a Geographic Information System (GIS)
unit and gradually started to share these resources with municipal governments, NGOs and
Private Sector agencies.
This paper gives an account of the experience made so far. It presents the processes and
steps that the planners in Palawan adopted and their strategies to make the spatial database
and GIS of use to CBMS in the Province. It discusses the comparative strengths and
limitations of both tools and provides spatial analysis examples. At the end, the paper shares
some lessons that could be of use to those planning to adopt similar approaches.
Spatial database (NRDB) Palawan
The spatial database, called Natural Resources
Database (NRDB) was developed by Mr. Richard
Alexander, originally for the Provincial Government of
Bohol as an expandable database for monitoring of
environmental concerns. As well as holding numbers
and text it can also story spatial data as polygons,
polylines and coordinates. Output can be derived as
maps, reports and different types of graphs. The
database is hierarchical and can be structured according to administrative structure in a
country. This means that collection of household data such as health conditions or income
can be aggregated into village, municipality or province statistics.
Spatial Database and GIS for CBMS, Experience from Palawan, Philippines 21/10/03
3
Database development process in Palawan When the NRDB software was adopted in May 2001, the Municipal and Provincial Planning
and Development Offices (MPDO and PPDO) had just completed their first CBMS survey.
The result, data sets with roughly 350 variables for about 80,000 households in around 350
communities was available partly in computerized spreadsheets (MS Excel). In other
instances, community (barangay) and municipal profiles had been tabulated manually. Yet in
other cases, processing was not yet finished.
The Provincial Planning Office took the lead responsibility to integrate all this data into a
NRDB database file, called NRDB Palawan. This process, which took about 6 months,
consisted of several steps.
Staff developed a CBMS master table (MSExcel format) to encode or copy the already
encoded data from the survey. The master table contains several datasheets for eight
different CBMS sectors (health, education, income and livelihood etc.) and three
administrative levels (barangay, municipality and province).
Spatial Database and GIS for CBMS, Experience from Palawan, Philippines 21/10/03
4
Parallel to data processing, the NRDB database structure was developed. This involved
coding and importing of administrative units (names of barangays and municipalities) and the
creation of sectors (for example economic development), features (for example Income and
livelihood) and attributes (for example average household income).
Because NRDB is a spatial database, it
requires some geographic data as well.
The GIS unit of the Provincial Government
digitized the boundaries of the
administrative units from cadastral maps,
as well as some facilities (road
infrastructure, schools, health centers and
the location of municipal and barangay
administrative buildings).
After these preparations, provincial planning staff imported spatial data from the GIS and
sector data from CBMS to the prepared database structure of NRDB Palawan. The database
was further complemented with population data from the National Statistics Office.
Since then, the structure of NRDB Palawan has been expanded to environmental concerns.
Spatial features such as protected areas and land uses were added.
Sub-village (called ‘purok’) and household levels were added to the administrative hierarchy
and data from the recent CBMS survey (2002/3) were loaded to the database.
#Y
MabiniManlag
New Ibajay
Bebeladan
Villa Paz
Sandoval
Aberawan
Villa Libertad
Corong Corong
Lagen Is.
MasaganaBuena Suerte
MaligayaImorigue Is.
Dibuluan Is.
Malabacao Is.
Pinagbuyutan Is.
Depeldet Is.
Comocotuan Is.
MabiniManlag
New Ibajay
Bebeladan
Villa Paz
Sandoval
Aberawan
Villa Libertad
Corong Corong
Lagen Is.
MasaganaBuena Suerte
MaligayaImorigue Is.
Dibuluan Is.
Malabacao Is.
Pinagbuyutan Is.
Depeldet Is.
Comocotuan Is.
755000
755000
760000
760000
765000
765000
770000
770000
775000
775000
780000
780000
1220
000 1220000
1225
000 1225000
1230
000 1230000
1235
000 1235000
1240
000 1240000
Barangay Boundary Countour River Municipal Boundaries Coastline Proposed Provl Roads
National Highway Provincial Road Municipal Road Fedder Road Pilot Road Airport Private Road Trail
#Y Municipal Point
2 0 2 4 6 Kilometers
S
N
EW
PALAWAN ROAD NETWORK
Construction ofSANDOVAL-MABINI
8.4 kms
Spatial Database and GIS for CBMS, Experience from Palawan, Philippines 21/10/03
5
Utilization
Initially, NRDB Palawan was used to identify and visualize development status and
disparities across municipalities in the province. By spatially presenting CBMS data, NRDB
showed that the conditions of households vary significantly between locations and sectors.
Local chief executives, government officials and other involved agencies learned that different
and sometimes very specific development priorities and interventions are required in different
municipalities and barangays.
By showing the differences in household access for 17 key development indicators provided a
basis for sector analysis. This involved matching CBMS data with service data, such as the
distribution of facilities and interventions at the barangay and municipal level.
With the CBMS survey conducted a second time,
NRDB Palawan now provides data to monitor human development trends. It identifies whether,
for example school participation rates or malnutrition
prevalence in a particular location is increasing or
decreasing.
Because of its spatial qualities, NRDB Palawan
is also used for municipal comprehensive land use planning (structure or town planning).
This aspect reflects the strength of CBMS that
satisfies most of the socio-economic
requirements of land use plan preparation in
the Philippines
665000
665000
670000
670000
675000
675000
680000
680000
685000
685000
690000
690000
695000
695000
1060
000 1060000
1065
000 1065000
1070
000 1070000
1075
000 1075000
1080
000 1080000
1085
000 1085000
Spatial Database and GIS for CBMS, Experience from Palawan, Philippines 21/10/03
6
.
Strategies to sustain NRDB Palawan and promote CBMS data use
Although NRDB provides easy access to CBMS and various other data, rationalizes data
management and is a user friendly application, planning staff in Palawan found out that its
existence alone was not sufficient to ensure utilization and wider adoption in the province. To
promote this, several strategies were adopted.
The Provincial Planning Office took an active role
in disseminating and sharing NRDB its data.
Staff developed a database tutorial, installed the
system in municipal planning offices and shared it
with interested NGOs and sector agencies.
NRDB users in Palawan started to network and further enhance / expand the data structure
and utilization. The number and type of partner agencies providing and using data has been
continuously increasing.
A strong concern and still the biggest challenge has been the use of NRDB to integrate
CBMS into the various formal and informal planning and decision making processes.
Spatial Database and GIS for CBMS, Experience from Palawan, Philippines 21/10/03
7
NRDB provides maps to inform Local Development Councils, where representatives from
government, non-government and the private sector come together to discuss development
priorities and allocate resources for development programs. Other channels, where data is
shared, are presentations to local chief executives and local legislative bodies.
Geographic Information System (GIS) application and CBMS
About GIS in Palawan
Provincial Government set up a Geographic
Information System (GIS) at the end of year 2000.
The initiative was supported by the Integrated Expert
Program of the German Center for International
Migration and Development (CIM). Its initial purpose
was to assist Provincial Government in the
preparation of its spatial development, in particular
the physical framework plan.
According to textbook definitions, GIS is a system for
capturing, storing, checking, integrating,
manipulating, analyzing and displaying data which
are spatially referenced to the earth. By this
definition, a GIS has some similarities with a spatial
database such as NRDB. Like NRDB a GIS
stores polygons, polylines and coordinates
and displays data spatially on maps. The
operation of a GIS software and NRDB
follow similar routines and functions, for
Þ
Þ
ÞÞ
Þ
!2
!2
!2
!2!2
!2
!2
%U
%U
%U
%U
%U
%U
%U
%U
%U
%U
%U
%U
%U
%U
%U
%U
%U
%U
%U
Source:Provincial Physical Framework Plan (PPFP), Provincial Government of Palawan.
Reforestation and Mangrove Projects mapped from Land Use Inves tment Program(PPFP, p.173) No Data in municipalities of Cagayancillo and Kalayaan
Proposed Land UsePROVINCIAL PHYSICAL FRAMEWORK PLAN
[Environmentally Critical Area Network (ECAN)]Core zoneRestricted use buffer zoneControlled use buffer zoneWithin ForestlandWithin A&D LandMangrove forest
ENVIRONMENTALLY CONSTRAINED AREAS
Irrigated LandsIrrigable & Efficient Diversified CroplandsAgro-Industrial LandsExpansion AreasEcologically Fragile Lands
L E G E N D:
!2 Mangrove Rehabilitation
Þ Reforestation in denuded upland areas.
(NPAA/NAAD Highly Restricted Agricultural Land)
PROTECTION LAND
N
EW
S
KilometersScale 1:2,250,000
50 0 50
scale 1:800,000
5 0 5 10 Km.
%U
%U%U
900000
900000
950000
950000
1200
000 1200000
1250
000 1250000
500000
500000
600000
600000
700000
700000
800000
800000
9000
00
900000
1000
000 1000000
1100
000 1100000
1200
000 1200000
1300
000 1300000
1400
000 1400000
Spatial Database and GIS for CBMS, Experience from Palawan, Philippines 21/10/03
8
example in symbolizing data, scaling of maps and others. Also, NRDB and the GIS software
used in Palawan can easily ‘communicate’ with each other through import and export of
spatial data layers, called shape files.
There are also some fundamental differences. A GIS contains sophisticated and highly
accurate processes for data capture. In GIS applications, data is assembled and arranged for
an individual project file so there is no common store for all available data as in the case of a
spatial database. In addition to vector data (polygons), a GIS handles raster (grid) formats,
which provides extensive analytical options.
The capacity for complex spatial analysis involving
statistical tests, modeling
and simulation is possibly
the largest difference
between a GIS and a spatial
database. While there are
basically no limits, GIS
analysis of CBMS data in
Palawan concentrates on
some standard methods. This is to keep the analytical process and the result understandable
and transparent for involved people.
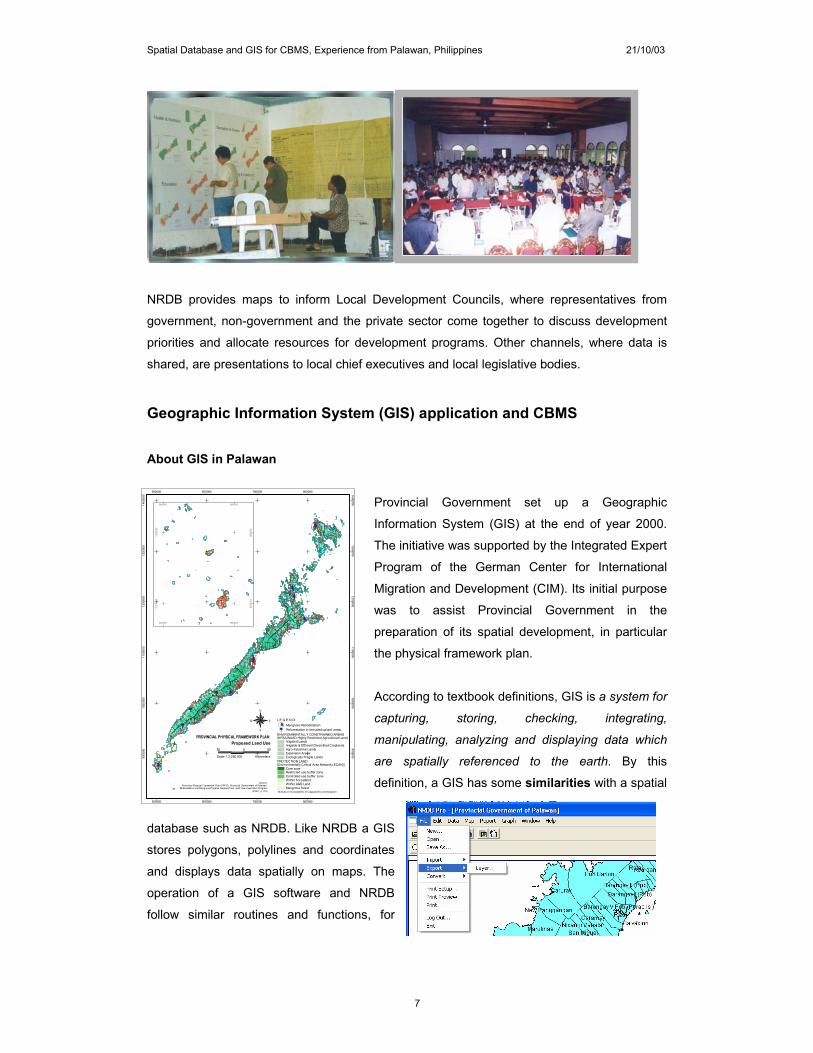
Example: Mapping locations with high poverty density
The following example presents data from a complete enumeration on HH income (indicating
poverty incidence) in the Municipality of Narra, Palawan for the year 2002.
The map has been
generated with NRDB. It
gives a distribution of
poverty incidence at the
Barangay (village) level. The
dark green color represents
Barangays with a relatively
high proportion of
households with income
greater than the Poverty
Spatial Database and GIS for CBMS, Experience from Palawan, Philippines 21/10/03
9
incidence (above the municipal average of 38.77%). The dark red color, on the other hand,
represents locations where the proportion of households with income above the poverty line is
low by comparison and where poverty incidence is high (below the provincial average of
21.49%). The map highlights that the urban Barangay ‘Poblacion Narra’ has the lowest
proportional poverty incidence, but is directly surrounded by three barangays where the
incidence is extremely high by comparison.
GIS analysis, using
Arc View GIS,
provides results that
are quite different.
The map below
shows the density of
poor households
(unit per sqkm). The
colors in the map
represent the
locations of poverty
not by
administrative unit
but by its actual
location. The darker the color, the higher is the absolute poverty density. Spatial interpretation
in this map derives its data from the count of poor households at the Purok level, the next
lower settlement level of the Barangay. The analysis assumes that the households within the
almost 100 Purok are clustered within about 2km of the physical Purok center. Interestingly, it
shows that the highest density of poor households (above 120 per sqkm) is found in
Poblacion Narra, the Barangay with the lowest
poverty incidence and its neighboring village
Panacan, where the incidence (expressed as
percentage) is also lower than in most other
Barangays in Narra. This result is less surprising,
when taking into consideration that both
Barangays have the highest absolute number of
households and among the highest density of
settlements (Purok sites).
Spatial Database and GIS for CBMS, Experience from Palawan, Philippines 21/10/03
10
Example: Identifying distance to Primary and elementary schools
Spatial analysis helps to identify settlement locations, in this case again the Purok in the
Municipality of Narra, and their distance to facilities, such as schools hospital etc. In this way,
well served or underserved settlements can be visualized.
The example above shows the
location of primary/elementary
schools (blue dots). The
concentric rings represent a
distance unit of 1.5 km. For
example, the area marked by
a yellow ring is between 3 and
4.5 km away from the nearest
school. Analysis provides an
easy way to isolate
settlements that are within this
distance or even further away from the nearest school. In some instances, the school in the
neighboring Barangay is much closer that that located within the village.
Example: Identifying service gaps and finding locations for additional facilities
Showing distance of settlements from the schools in Narra is a simple and straightforward
means to identify which individual settlement are beyond a certain accessibility level, let’s say
3 km. But what, if in case of scarce resources, a more strategic interpretation is required that
asks: where do we have to locate a new school that has the highest impact on bringing
settlements closer to school?
In this case, the problem may be approached the other way around, based on the idea is to
map out different density levels of settlements and then correlate these with the location of
school facilities. The highest impact
of a new school building would be in
a location of highest settlement
density where currently no school is
present.
The map shows the settlement
density from 0 -0.1 per sqkm to 1 per
sqkm. The red polygons show
Spatial Database and GIS for CBMS, Experience from Palawan, Philippines 21/10/03
11
location with a high density of settlements per area unit.
An overlay with the spatial
representation of school distance
data helps to identify those areas
which have high settlement
density and fall within or outside
certain distance levels
Spatial Database and GIS for CBMS, Experience from Palawan, Philippines 21/10/03
12
Lessons Both tools, NRDB and GIS, have proven highly supportive to CBMS implementation in
Palawan. NRDB provides an effective means for storing and accessing CBMS information.
The GIS adds spatially relevant information to CBMS and provides analytical options.
Looking at CBMS ‘spatially’ with NRDB and GIS has substantially encouraged the use of
CBMS by the various stakeholders. More than this, this attractiveness has generated
additional resources towards maintenance and development of the CBMS database.
However, experience in Palawan shows that while setting up a spatial data base for CBMS
can be done quickly and easily, building it further takes time. Particularly keeping NRDB
updated, accurate and generating spatial data has turned out a tedious process.
Since the NRDB in Palawan is shared with a number of agencies, accuracy and credibility of data are crucial. Barangay officials, for example, will reject the system and its data if the
administrative boundaries drawn by the NRDB map do not conform to their own records.
Similarly, a municipal mayor will not subscribe to if CBMS data stored in the NRDB appears
unrealistic in his or her view.
Finally, the use of GIS sometimes encourages too complex and technical interpretation of
CBMS results by ‘experts’ in the planning office. This may run counter to the participatory
principles of CBMS. And it bears the risk that local communities will be confronted with
feedback on their development situation which they find difficult to comprehend and learn
from. Therefore, the use of GIS for CBMS data interpretation needs to consider the potential
conflict of bringing together local and expert information systems.
The use of NRDB and GIS for CBMS in Palawan can be seen as part of the attempt to
convert data, described as the unrefined and undifferentiated facts collected by CBMS
surveys, into information, which is understood as refined and organized data. Such
information then needs to be turned into knowledge as the internalized information.
Spatial Database and GIS for CBMS, Experience from Palawan, Philippines 21/10/03
13
Thus, it is only one step to, for example, to find out that the coastal fishing communities in a
given municipality are poorer than their farming neighbors further uphill and to identify the
likely causes. Another and equally challenging work is to communicate such information. The
more a development community at the village, communal and provincial level has internalized
this knowledge, the more likely it will reach a consensus on what to do about it, and the more
likely it is that development activities and interventions will effectively address those issues
identified by CBMS. Both NRDB and GIS can promote this goal. But they are by no means
sufficient. And their application has to be adapted to the local conditions and to the ways and
principles along which CBMS is implemented in a particular case.
Data
Information
Knowledge