14 TH European Colloquium on Theoretical and Quantitative Geography | September 9-13, 2005 | Tomar, Portugal SPATIAL MODELLING OF METROPOLIZATION IN PORTUGAL Exploratory Analysis of Spatial Metropolitan Patterns Patrícia ABRANTES, Fernando BAÇÃO, Victor LOBO and José António TENEDÓRIO In this paper we analyze the spatial development of metropolization in continental Portugal by proposing a methodology for the classification of metropolitan dynamics. The aim is to identify municipalities that form “natural” metropolitan groups and municipalities that form non-“natural” groups (i.e. geographical areas of metropolitan “transition”). We use two exploratory spatial data analysis methods of classification. The first is the clustering analysis; the second is the Self Organizing Map (SOM) and geo-relevant variants, such as the Geo-SOM. These tools constitute an answer to the need of detecting metropolitan spatial patterns and a guide in the interpretation of spatial metropolitan forms. The resulting typologies, analyzed with the territorial map proposed by the legal framework as well as with others classifications for the Portuguese Urban System, will allow us an integrating vision of metropolization, and thus propose ways to accommodate the process within the more general tasks of territorial planning. KEYWORDS Metropolization, cluster analysis, SOM, Geo-SOM, typology, spatial patterns 1- INTRODUCTION Seen as the spatial equivalent of globalization of world economies, the metropolization is a complex process of interaction of different scales and rhythms of development. There is still no consensus to its scientific definition. Most authors relate it to economical aspects considering it as the spatial result of the globalization of the world economy [4,8], as the whole of the dynamic processes that transform a city into a metropolis [12] or as the movement of concentration of economical power in a limited number of world cities [7]. However, a recent research trend considers, that the process is not limited to economical and functional aspects, and that other important dimensions cannot be set aside, namely good government and sustainable development [12]. Despite the absence of unique and consensual definitions, some particular aspects of the process can be identified, such as: • The increasing number of services and the development of the respective sector (i.e. economies of agglomeration favor the concentration of executives, international companies among other advantages). • The distortion of the urban hierarchy and the reinforcement of the higher levels of the urban net (i.e., the metropolis is the hub for acquisition and distribution of innovation/information from a network of fluxes/relations that operates on a fewer number of cities). • The inner spatial rearrangement of cities (i.e., the fragmentation of the metropolis by opposition to co-ordination and planning of metropolitan territory). The process of metropolization is spatially developing itself in Portugal due to the transformation of the demographic, social-cultural and political-economical structures. However, the question is poorly studied, namely with regard to the concepts and the process in terms of spatial functioning/structuring. The existing studies are scarce and refer mainly to the organization of the Portuguese Urban System (P.U.S), management and government of the metropolitan areas of Lisbon and Porto and their integration in a European context. 1
Transcript
14TH European Colloquium on Theoretical and Quantitative Geography | September 9-13, 2005 | Tomar, Portugal
SPATIAL MODELLING OF METROPOLIZATION IN PORTUGAL Exploratory Analysis of Spatial Metropolitan Patterns
Patrícia ABRANTES, Fernando BAÇÃO, Victor LOBO and José António TENEDÓRIO
In this paper we analyze the spatial development of metropolization in continental Portugal by proposing a methodology for the classification of metropolitan dynamics. The aim is to identify municipalities that form “natural” metropolitan groups and municipalities that form non-“natural” groups (i.e. geographical areas of metropolitan “transition”). We use two exploratory spatial data analysis methods of classification. The first is the clustering analysis; the second is the Self Organizing Map (SOM) and geo-relevant variants, such as the Geo-SOM. These tools constitute an answer to the need of detecting metropolitan spatial patterns and a guide in the interpretation of spatial metropolitan forms. The resulting typologies, analyzed with the territorial map proposed by the legal framework as well as with others classifications for the Portuguese Urban System, will allow us an integrating vision of metropolization, and thus propose ways to accommodate the process within the more general tasks of territorial planning.
Seen as the spatial equivalent of globalization of world economies, the metropolization is a complex process of interaction of different scales and rhythms of development.
There is still no consensus to its scientific definition. Most authors relate it to economical aspects considering it as the spatial result of the globalization of the world economy [4,8], as the whole of the dynamic processes that transform a city into a metropolis [12] or as the movement of concentration of economical power in a limited number of world cities [7]. However, a recent research trend considers, that the process is not limited to economical and functional aspects, and that other important dimensions cannot be set aside, namely good government and sustainable development [12].
Despite the absence of unique and consensual definitions, some particular aspects of the process can be identified, such as:
• The increasing number of services and the development of the respective sector (i.e. economies of agglomeration favor the concentration of executives, international companies among other advantages).
• The distortion of the urban hierarchy and the reinforcement of the higher levels of the urban net (i.e., the metropolis is the hub for acquisition and distribution of innovation/information from a network of fluxes/relations that operates on a fewer number of cities).
• The inner spatial rearrangement of cities (i.e., the fragmentation of the metropolis by opposition to co-ordination and planning of metropolitan territory).
The process of metropolization is spatially developing itself in Portugal due to the transformation of the demographic, social-cultural and political-economical structures. However, the question is poorly studied, namely with regard to the concepts and the process in terms of spatial functioning/structuring. The existing studies are scarce and refer mainly to the organization of the Portuguese Urban System (P.U.S), management and government of the metropolitan areas of Lisbon and Porto and their integration in a European context.
1
14TH European Colloquium on Theoretical and Quantitative Geography | September 9-13, 2005 | Tomar, Portugal
Three notions and periods mark its development:
1. Between the end of the 60s and the 70s, when the process starts to emerge with a strong impulse from Lisbon (through its role as capital city) and Porto. The notion of bipolarization of the Portuguese Urban System (P.U.S.) emerges during this period.
2. The end of the 70s and the 80s, with the development of a wide littoral area between Setúbal and Viana do Castelo and the loss of population in the inner country. The concept of “Littoralisation” of the country emerges.
3. The 90s, marked by a re-organization of the P.U.S. at the level of medium size towns of the interior as well as new littoral urban areas that potentially can compete with Lisbon and Porto.
It is later that the process is accompanied from a legal point; in 1991 with the law that approves for the first time in Portugal the constitution of the Metropolitan Areas of Lisbon and Porto and, about ten years later, in 2003 with approval of laws that give more legal powers to the urban areas, proposing to municipalities their grouping through the constitution of great metropolitan areas (GAM), urban communities (ComUrb) and inter-municipal communities according to criteria based on population ceilings and territorial continuity.
In face of the development of a new political context according to which the creation of metropolitan areas is based on inaccurate scientific basis we consider of utmost interest a conceptual and spatial approach that will allow us to understand the process of metropolization in Portugal in terms of functioning and spatial structure.
At present, we can see an urban diffusion and a social-economical fragmentation of space. By its own dynamics, the territory of metropolis is widening and it is rather difficult to define limits. Metropolization develops itself on a functional space of interactions and fluxes that is spread far beyond the administrative limits of the metropolis (metropolitan areas) where usually the “planner” intervenes. The question of space (functional) and territory (administrative) of the metropolis becomes an important challenge in the understanding of the process and its articulation with urban and territorial planning policies [16]. Thus, we are interested in the analysis and interpretation of relational fluxes of the metropolis, in the spatial forms that are developed, in the different scales that are overlaid (intra-metropolitan/regional/national-international) and in the adequate adaptation of public policies of planning in face of this reality.
Attempting an answer to our questions we focus on the analysis of the development of metropolization in Portugal in the last decade, by proposing a methodology for classifying metropolitan dynamics. We consider the municipal level (concelho) and use census data from I.N.E. (National Statistical Institute) and other available information.
Departing from the information acquired through bibliographic sources on this theme, we propose a conceptual data model (CDM) [1] that allows us to analyze the spatial behavior of metropolization in terms of dynamics of functioning and spatial structuring.
This exploratory analysis was previously contextualized by a comparative analysis of various studies about the national urban system [1]. These studies constitute a starting point for the identification of patterns since they consider urban groupings based on the recent dynamic of the P.U.S (population, economics and social aspects).
More and more, due to development of technology, it is possible to co-relate various tools available in different sciences. To analyze the metropolitan dynamics and hence to propose a metropolitan typology we are faced with different classification tools. The grouping of information in classes is essential in spatial analysis mainly in presence of multidimensional statistical data. Patterns can be analyzed separately or together with the aim of extracting new knowledge.
The proposal for classifying the municipalities integrates three tools: the GIS, one of the most common techniques of classification, the k-means clustering, the Kohonen’s Self Organizing Map (or SOM) and t its variant, the Geo-SOM [3].
On a first stage we analyze data through techniques widely and commonly used, namely in the field of statistical analysis, performing various classification tests by using K-means Cluster Analysis.
2
14TH European Colloquium on Theoretical and Quantitative Geography | September 9-13, 2005 | Tomar, Portugal
Other techniques have revealed themselves rather pertinent in the classification of spatial patterns, such as the methods from artificial neuronal networks through self-organizing maps and its variant Geo-SOM. We propose the use of these tools in the classification of metropolitan dynamics introducing a more integrated and broad exploratory analysis of question.
2. EXPLORATORY ANALYSIS OF SPATIAL METROPOLITAN PATTERNS
2.1. The Conceptual Data Model
In the initial stage of research, the construction of a CDM [1] assists us in identifying the essential objects for which we need to acquire information, hence in the formalizing of the information that we consider important for our problem [18]. It is the stage of structuring and logical and schematic organization of the information to be used. The bottom line is that we possess a wide scope of data that we need to organize. The CDM allows us such organization in a logic entity (objects), attributes (characteristics of the entities), and relation (interaction between entities).
In the construction of the CDM we considered two essential aspects: what we understand as metropolization and the implied criteria. We identified 4 major points as criteria for the analysis of metropolization:
1. Dynamic: the temporal vector is essential, since metropolization is a process that develops in time; 2. Distance: the logic of networks and fast accessibility (centrality) is closely related to metropolization; 3. Density: metropolization is both urban concentration and dispersion; 4. Scale: metropolization is a process that develops on different interactive scales.
Based on the above we defined 6 dimensions representative of metropolization: population, economy, urban organization, society and culture, networks and territorial organization. To each dimension there is a set of key indicators. The indicators are chosen after a bibliographical analysis on the problem and various discussions, considering, however, that there is no “perfect” example explaining the process in its full length.
2.2. Methods of Classification of Metropolitan Patterns
2.2.1 Multivariate Statistical Analysis: the clustering techniques
Since the advent of quantitative geography in the early 70’s clustering tools are commonly used and adapted for spatial analysis. They seem to have demonstrated efficiency when relating vast amounts of data by reducing and grouping them.
Clustering analysis aims at finding significant structures between spatial objects (in this case the municipalities), by proceeding to the classification of the objects according to their similarities. The basic idea is to classify individuals in homogeneous groups through the transformation of statistical proximity between data patterns in Euclidian distances. Individuals with small distances between them are grouped within a same class. As the distance from the individual to the centre of the Cluster increases, this individual is grouped in another class [17]. Cluster analysis minimizes intra-class distances and maximizes inter-class distances.
Clustering techniques are divided into two principal categories: hierarchical clustering and partition techniques.
Hierarchical clustering techniques assume no pre-defined number of clusters and present detailed sub-clusters of data, so that the user may select the level of specificity desired. This technique is based on a matrix of distances to group individuals. The grouping is established through a criterion that defines proximity between objects and is done, initially, over the total number of individuals under analysis (one group for each data pattern), grouping them successively until a single group is formed. The extraction of similar groups is commonly done by analyzing the resulting dendrogram [13].
Partition techniques, of which k-means is the most popular consists in pre-selecting a certain number centroids, or means, and then finding the positions of data patterns in these centers of the clusters, so that dispersion - i.e. the sum of square distances between the data patterns and the centroids - is minimized.
3
14TH European Colloquium on Theoretical and Quantitative Geography | September 9-13, 2005 | Tomar, Portugal
It presents the advantage of grouping individuals in a different class from the starting one, as it is iterative, which isn’t the case in hierarchical methods that are less flexible. K-means clustering presents two major disadvantages. One is that it requires pre-selecting the number of classes. In most of the cases it is not obvious at the beginning how many clusters exist. In this case it is common to resolve the problem by first exploring hierarchical techniques to estimate the number of clusters. Second, is that since we determine a pre-number of centroids, il doesn’t gives the guarantee that the final solution will be a global optimum. In our example we verify that K-means clusters more correctly data that are very different from the average, such as Lisbon, Porto, and others. For instance it may be not good to treat fuzziness problems.
However, for these particular techniques, we observed that K-means clustering was more efficient and flexible in the treatment of ours datasets.
2.2.2. The Self-Organizing Map
The term “Self-Organizing Map” can be applied to a number of different approaches. Here we shall use it as a synonym of Kohonen’s Self Organizing Map, or SOM for short. These maps are also referred to as “Kohonen Neural Networks” [5], “Self Organizing Feature Maps-SOFM”, “Topology preserving feature maps” [10], or some variant of these names. Kohonen describes SOM as a visualization and analysis tool for high dimensional data, but they have been used for clustering [21], dimensionality reduction, classification, sampling, vector quantization, and data-mining [9].
The basic idea of a SOM is to map the data patterns onto a n-dimensional grid of units also called neurons. That grid forms what is known as the output space, as opposed to the input space: the original space where the data patterns are. This mapping tries to preserve topological relations, i.e., patterns that are close in the input space will be mapped to units that are close in the output space.
The output space will usually be 2-dimensional, and in most implementations a rectangular grid of units is used. In order to provide even distances between the units in the output space, hexagonal grids are sometimes used [10]. Single-dimensional SOMs are also common (e.g. for solving the traveling salesman problem), and some authors have used 3-dimensional SOM’s [8,19]. Using higher dimensional SOMs, although posing no theoretical difficulties is rare, since it is not possible to easily visualize the output space.
Each unit, being an input layer unit, has as many weights or coefficients as the input patterns, and can be regarded as a vector in the same space as the patterns. When training or using a SOM with a given input pattern, we calculate the distance between that pattern and every unit in the network. We then select the unit that is closest as the winning unit, and say that the pattern is mapped onto that unit. If the SOM has been trained successfully, then patterns that are close in the input space will be mapped to neurons that are close (or the same) in the output space. Thus, SOM is “topology preserving” in the sense that (as far as possible) neighborhoods are preserved through the mapping process.
Before training, the units may be initialized randomly. Usually the training consists on two parts. During the first part of training, the units are “spread out”, and pulled towards the general area (in the input space) where they will stay. This is usually called the unfolding phase of training [9]. After this phase, the general shape of the network in the input space is defined, and we can then proceed to the fine tuning phase, where we will match the units as close as possible to the input patterns, thus decreasing the quantization error.
The basic SOM learning algorithm may be generically described as follows:
4
14TH European Colloquium on Theoretical and Quantitative Geography | September 9-13, 2005 | Tomar, Portugal
Let wij be the weight vector associated with unit positioned at column i row j xk be the vector associated with training pattern k dij be the distance between weight vector wij and a given pattern. h be a neighborhood function described below. α be the learning rate also described below. For each input pattern:
1) Calculate the distance between the pattern and all units of the SOM (dij
= || x - w ||) k ij
(this is called the calculation phase) 2) Select the nearest unit as winner wwinner ( wij : dij = min( dmn) ).
(this is what is usually called the voting phase) 3) Update each unit of the SOM according to the update function wij = wij + α h(wwinner,wij) || xk – wij ||
(this is what is usually called the updating phase) 4) Repeat the steps 1) to 3), and update the learning parameters, until a
certain stopping criterion is met.
The learning rate α, sometimes referred to as η, must converge to 0 so as to guarantee convergence and stability for the SOM [9]. The decrease from the initial value of this parameter to 0 is usually done linearly, but any function may be used.
The neighborhood function, sometimes referred to as Λ or Nc, assumes values in [0-1], and is a function of the position of two units (a winner unit - BMU, and another unit), and radius. It is large for units that are close in the output space, and small (or 0) for units far away. Usually, it is a function that has a maximum at the center, monotonically decreases up to a radius r (sometimes called the neighborhood radius) and is zero from there onwards. For the sake of simplicity, this radius is sometimes omitted as an explicit parameter. The two most common neighborhood functions are the bell-shaped (Gaussian-like) and the square (or bubble), in both cases, we force r → 0 during training to guarantee convergence and stability. The update of both, the learning rate and the neighborhood radius, parameters may be done after each training pattern is processed or after the whole training set is processed.
There are several devices and techniques to visualize and explore the results of a SOM. Probably, the most well-known output analysis tool is the U-Matrix [20]. The U-Matrix constitutes a representation of a SOM in which distances, in the input space, between neighboring units are represented, usually by a color code. If distances between neighboring units are small, then these units represent a cluster of patterns with similar characteristics. If the units are far apart, then they are located in a zone of the input space that has few patterns, and can be seen as a separation between clusters. Distances can either be depicted as grey shades, or color ramps. Typically, when using grey scales small distances between units are shown in white or light grey and big distances in black or dark grey. In color ramps proximity is usually represented by deep blue and large distances with dark red.
2.2.3. The Geo-SOM
The Geo-SOM was first proposed in 2004 [3] and constitutes a variant of the original SOM algorithm, which can be seen as an effort to produce a geo-relevant clustering method. In general, the clustering methods used by geographers do not use location in the clustering process or treat it as any other variable. Typically, if we are interested in producing a classification based on all countries of the world, we will cluster in the same group the countries that present similar values for the study variables even if they are located in different continents. From our perspective this constitutes an unsuitable way of dealing with geographic classification, as geographers and geographic research should be mainly interested in location and its effects. The basic idea underlying the Geo-SOM is to bring location to the centre of the clustering process, forcing “things” which are distant to be grouped in different clusters, even if they present similarities in terms of the other variables. The assumption is that the geographer is mainly interested in study the similarities of “things” in its geographical context rather then dismissing it as irrelevant.
The fundamental difference between the SOM and the Geo-SOM resides on the fact that the Geo-SOM changes the matching mechanism of the basic algorithm. As we have seen, the traditional algorithm comprises two basic steps: the matching phase and the updating phase. During the matching phase the algorithm calculates the distances between each unit wij and an individual pattern xi presented to the network, searching for the closest unit. Once the closest unit is found this unit will move a certain
5
14TH European Colloquium on Theoretical and Quantitative Geography | September 9-13, 2005 | Tomar, Portugal
distance (defined by the learning rate) in order to improve its representation of xi. This is known as the updating phase. During the updating phase not only the wining unit is updated but also its neighbors in the output space.
In the Geo-SOM the matching phase is divided into two different sub-phases: the geo-matching (1st matching) and the attribute matching (2nd matching), which includes the geographic variables. This way in the 1st matching only the geographic context of the attribute vector is used and all units are compared. In the 2nd matching phase the entire vector is used in order to find the Best Matching Unit (BMU) but only the sub-set defined in the 1st matching phase are considered. During the 1st matching phase the specific neighborhood where the 2nd matching phase is going to happen is defined (which is here defined as the geographic tolerance). This way the 2nd matching phase is conditioned by the geographic tolerance.
The geographic tolerance where the final BMU is searched can be controlled by a parameter t, defined in the output space, and called spatial gating function. If we choose t=0, then the BMU will necessarily be the unit geographically closer (the 1st and 2nd matching are the same). If we allow t to increase to the size of the map then the geographical coordinates will be ignored, corresponding to the original SOM. For t between 0 and the size of the map a number of different compromises will be obtained.
When t=0, the final locations in the input space of the units will be a quasi-proportional representation of the geographical locations of the training patterns, and thus the units will have local averages of the training vectors. The same final result may be obtained by training a standard SOM with only the geographical locations, and then using each unit as an averaging filter of the non-geographic features. The exact transfer function (or kernel function) of these filters depends on the training parameters of the SOM, and is not relevant for this discussion. As t (the spatial gating function) increases, the unit locations will no longer be quasi-proportional to the locations of the training patterns, and the averaging functions of the units will become more and more skewed, eventually ceasing to be useful as models.
Formally, the Geo-SOM may be generically described by the following algorithm:
Let X be the set of n training patterns x , x1 set of components xgeo
2,..xn, each of these having a i and another set xngi.
W be a p×q grid of units wij where i and j are their coordinates on that grid, and each of these units having a set of components wgeoij and another set wngij. α be the learning rate, assuming values in ]0,1[, initialized to a given initial learning rate r be the radius of the neighborhood function h(wij,wmn,r), initialized to a given initial radius t be the radius of the geographical BMU that is to be searched 1) Repeat 2) For m=1 to n 3) For all wij∈W, 4) Calculate dij = ||xgeom - wgeoij|| 5) Select the unit that minimizes dij as the geo-winner wwinnergeo 6) Select a set Wwinner of wij such that the distance in the grid between wwinnergeo and wij is smaller or equal to t. 7) For all wij∈Wwinner, 8) calculate dij = ||xm - wij|| 9) Select the unit that minimizes dij as the winner wwinner10) Update each unit wij∈W: wij = wij + α h(wwinner,wij,r) ||xm – wij|| 11) Decrease the value of α and r 12) Until α�reaches 0
The Geo-SOM has the potential to organize the SOM output space according to the geographic proximities of the input patterns. This way, areas of the geographic map with similar characteristics will warrant a smaller number of units than the areas of the map where characteristics differ a lot. For a more thorough explanation of the algorithm and its relevant properties see (Bação, Lobo et al. 2004) and [2].
6
14TH European Colloquium on Theoretical and Quantitative Geography | September 9-13, 2005 | Tomar, Portugal
3. ANALYSIS AND DISCUSSION OF RESULTS
The exploration of different methods of classification is important to guarantee not only a cross validation of the information, but also a better interpretation of the complexity of the studied process.
When classifying the data we want it to take into consideration the main characteristics of metropolization. We are interested in areas that show an evolution of metropolitan employment, commuting trips between different municipalities, density and urban dispersion (population and housing), increase of urban soil occupation, evolution on spatial structures and urban forms.
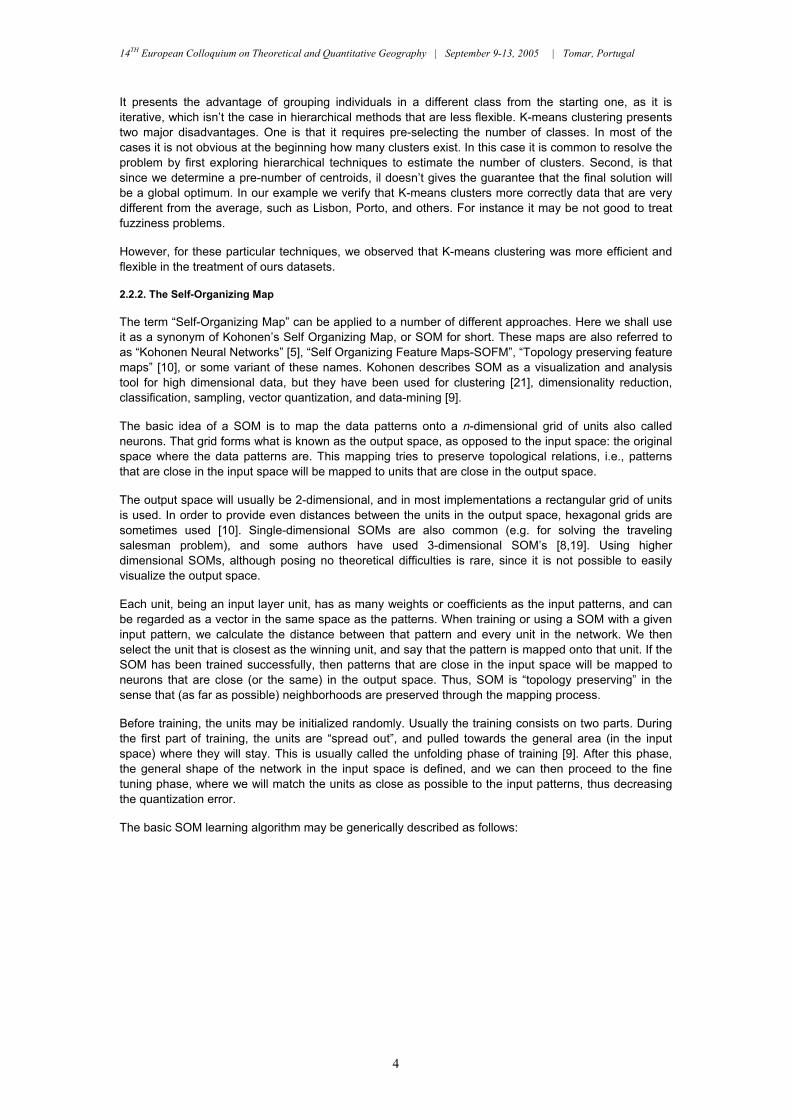
After performing various tests we propose for K-means a classification in nine classes of municipalities. As we mentioned, for K-means algorithm we need to pre-determine the number of classes, while in SOM the choice of the number of classes is made after examination of the results in the output space.
An analysis through K-means clustering allows us to quickly identify which indicators contribute the most for the distinction between classes by analyzing the higher Cluster mean square. The indicators that are at the origin of the major differences are density (employment, population, businesses and housing), soil occupation (urban and artificial), and education/training.
By analyzing the Distances Between Clusters we verify which classes are statistically closer. K-means places Lisbon and Porto in isolated classes (contrary to SOM), being the ones showing a bigger distance when compared to the remaining classes. We verify however, that Lisbon is very different from any other class and that Porto is closer to class number three (Lisbon neighboring municipalities).
Inside each class there are municipalities that show a big distance to the centre of that class, indicating a possible fuzziness as to its integration in that class. Among those with a bigger distance from the respective centroids we have: in cluster 3, Oeiras, in cluster 4, Sintra and São João da Madeira, in cluster 5, Vagos, Coimbra, Faro and Palmela, in cluster 6, Sever do Vouga, Loures, Alcanena and Mesão Frio, in cluster 7, Alvito, Mourão, Vendas Novas and Albufeira and in cluster 8, Resende, Barrancos and Miranda do Douro.
7
14TH European Colloquium on Theoretical and Quantitative Geography | September 9-13, 2005 | Tomar, Portugal
Map 1 - Clustering through K-means
One of the disadvantages of K-means is that it is more prone to produce classes that show bigger differences and that it is less clear in showing differences in areas that are not far from the average. Thus the transition areas (those that according to our data and to several studies present strong dynamics) are most of the time within a same class. To assess these fuzzy aspects we either do a new K-means clustering for that specific class or we use other methods. We suggest the use of SOM.
Contrary to K-means where we have to pre-determine a number of classes, in SOM each unit (neuron) is related to a municipality or a set of municipalities statistically and/or geographically close. However, it implies a subjective classification process, mainly when we use a rather big network (450 neurons). With SOM, the user must have a deep knowledge of the process being studied to be able to better classify patterns.
There are three ways that support the user in the process of classifying the units:
1. Analysis of the color patterns of the U-Matrix; 2. Analysis of the proximity of neurons and of the indicators distribution in the map (component plane) 3. Quantization error. This is a measure of distance between input patterns and the unit to which it is
mapped in the attribute space.
8
14TH European Colloquium on Theoretical and Quantitative Geography | September 9-13, 2005 | Tomar, Portugal
Fig. 1 - Distribution of the indicators in the SOM U-matrix (left); distribution of neurons and of its quantization errors,
with proposed clusters pointed out by red lines (right) Classification trough SOM introduces a bigger differentiation inside classes then by using K-means. But, in general the results obtained with K-means and SOM are close, mainly due to the fact that both have very similar training procedures. By using both methods we obtain a more integrated and coherent typology. Through SOM we have a more clear perspective of the particularities in each group, and it seems more flexible for treating fuzzy areas.
The classification obtained by geo-coding the clusters to the geographic map (ArcView GIS) is divided in 10 groups of municipalities, and we propose for each group the typology described below:
9
14TH European Colloquium on Theoretical and Quantitative Geography | September 9-13, 2005 | Tomar, Portugal
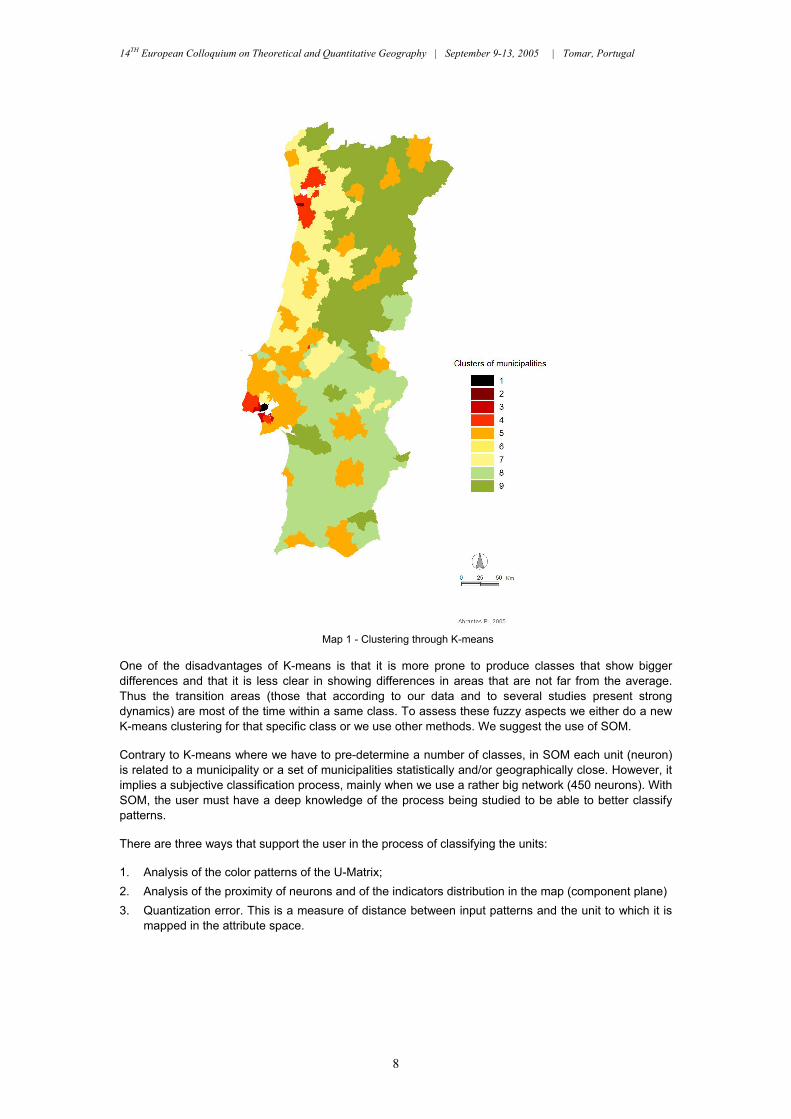
Map 2 -Typology of metropolitan dynamics
1. Metropolis centres of Lisbon and of Porto
K-means separates both municipalities contrary to SOM, mainly because Lisbon presents a larger variation of indicators, although their behavior is similar. Lisbon and Porto are characterized by a negative population growth and by an evolution of family structure (mono-parental families and families without a core). The employment registers a slow-down although it is very specialized in metropolitan functions and foreign executives. The levels of higher education, R&D and international trade (exports) are the most important of the country. Both areas have maximum accessibilities (roads, ports and airports) and present a well structured urban network. Commuting trips are complex, with strong inter-municipal relations.
10
14TH European Colloquium on Theoretical and Quantitative Geography | September 9-13, 2005 | Tomar, Portugal
2. Suburbanized metropolitan area These areas represent the contiguous municipalities of Lisbon and Porto. They are characterized by a stabilized population growth and by a higher evolution of mono-parental families and families without a core when compared to Lisbon and Porto. They register an evolution of employment density namely metropolitan employment with functional specialization (communications, enterprise services and commerce), and a high level of instruction/training and R&D (especially in Lisbon municipalities). Housing is very dense and registers a slow down of construction in last decade. The accessibility is high and the urban network is dense and well structured. Commuting trips between different centres have grown in last decade.
3. Suburbanized metropolitan area in consolidation Rather similar to class two, it is however differentiated by the increase of metropolitan employment (industry, transport, logistics and communications, commerce and services) and also by the increase of urban pressure (increase housing construction and of urban soil). Braga is an example inside this group.
4. Potential metropolis centre In this typology we integrate Aveiro, Viseu, Coimbra and Faro because they have registered an important growth in last decade so that we can consider them as candidates to achieve a metropolitan level. In reality, they have registered an increase of urban population, an evolution on family structure and an augmentation of housing (with decrease of vacant and seasonal housing) as well as an expansion of urban soil occupation and accessibility conditions. The employment has also registered an increase with a high level of creation of metropolitan orientated companies in sectors such as industry, banks, real estate and services and an evolution of educational levels (positive evolution of number of universities) and R&D.
5. Area of Metropolization Within this area particularities are visible; however seems de phenomenon is the same we opted for the integration of the sub-clusters region of Porto, Lisbon and Algarve. These areas are characterized by high levels of accessibility, by an increase of urban population, by a mutating familiar structure, by a growth of housing and urban pressure (possible urban soil). The employment registers an augmentation, especially of metropolitan functions namely wholesale, financial activities and services. We verify an incidence of foreign capital especially at north of the country and in the south due to the touristy activity and a positive commercial balance.
6. Area of urban dynamic These areas are defined by several authors as structuring the development of the Portuguese Urban System (PUS). We divided these areas in two sub-clusters; in orange, the areas that have an important regional role; in brown the areas of local importance. They are characterized by an average population growth, by an expanding urban population, by a mutating classical familiar structure and by a positive variation of education and instruction levels. They register an evolution of accessibilities but the urban network is still poorly structured and dense especially in the interior of the country. These municipalities register a growing of housing construction in last decade but the evolution of urban soil and possibly urban soil is Insignificant. Forest and agricultural occupation soil is still very important. The employment is low concentrated but registers an increasing with some metropolitan specialization.
7. Periurbanization area In general these areas are relatively accessible and present structured urban network; they present a growth of urban population and a low density of housing with evolution of single family housing. They register a positive variation of seasonal housing mainly at north of the country with strong growth of real estate, as well as health and leisure equipments. The growth of employment is moderate with weak metropolitan specialization and the area present average level of education/training
8. Area with weak urban dynamics These areas register a decrease of population, ageing population and reduced urban population and education/training levels. They are characterized by poor accessibilities and by an urban network poorly structured, although they register a positive evolution of accessibilities resulting from the opening of new roads. They register a low density of housing but a positive variation of seasonal housing and a positive evolution of the construction of single family housing and health and leisure equipments. They also register an evolution of metropolitan employment especially in tourist sector, in services and in culture, with some evolution in foreign capital.
9. Area without urban dynamics These areas are very similar to class 8; however they registered a weak growth of housing during the 90s and a high degree of retraction of employed population with low density of employment without
11
14TH European Colloquium on Theoretical and Quantitative Geography | September 9-13, 2005 | Tomar, Portugal
metropolitan specialization. There is some creation of companies, especially in the tourist sector. An in the typology above these areas register a positive evolution of health and leisure equipments, but still with low population coverage.
Once the typology is defined, we concentrate in the delimitation of areas of metropolization and urban dynamic for the chosen centres and in the analysis of its spatial and functional structures. Geo-SOM introduces the geographical component by agglutinating municipalities that are geographically closer. It is pertinent to find spatial limits, to recognize regularities and differences inside the classes and to analyze spatial structures inside the proposed areas. Note that we refer to functional and spatial forms; administrative structure will be analyzed opportunely.
Fig. 2 – U-Matrices for SOM (left) and Geo-SOM 0(center) with highlighted units linked with Portugal municipalities
map in which will be delimitated the potential urban-metropolitan areas (right)
The methodology followed is interactive, exploring an environment that interconnects virtual space (U-Matrix for SOM and Geo-SOM) with the geographic map; this way the selection of a unit on the U-Matrix automatically highlights the municipalities that area classified in that specific unit (Fig.2). We extract classes 1 to 6 obtained in SOM and - by analyzing the U-Matrices (colors patterns), the groups of units, its topological relations and its quantization errors - we defined spatial limits for our proposed areas.
For better explanation an example of the delimitation of the potential metropolitan area of Braga is shown in fig.3. We see that Braga as an important centre (high quantization error), a second important centre, and three units in a same level (very homogeneous). More distant in a different color pattern we find two units that make the transition with the West (Viana do Castelo) and the South-west (Porto).
12
14TH European Colloquium on Theoretical and Quantitative Geography | September 9-13, 2005 | Tomar, Portugal
Fig.3 – Example of delimitation of the potential metropolitan area of Braga with Geo-SOM_0
Although we based our work on Geo-SOM 0 we also use Geo-SOM 2 and smaller U-Mat for better interpretation of data; Geo-SOM 2 extends the areas grouping similar municipalities not immediately contiguous while smaller U-Mats force units (i.e. the municipalities) to be more aggregated. However, by using smaller maps we decrease the capacity of interpretation of the relation unit-input data and we lose information. Bigger maps are better for analyze data structures. In map 3 we delimitate the areas for each chosen centre and we define its spatial structures.
Map 3 - Metropolitan Structures
13
14TH European Colloquium on Theoretical and Quantitative Geography | September 9-13, 2005 | Tomar, Portugal
In this map we delimitate the areas for each chosen centre and we define its main urban forms. We note that the littoral has more complex in terms of spatial structures and urban relations and that the complexity of space increases to the north-west and especially in the region of Porto. The spatial forms are characterized below:
1. Consolidated metropolitan areas:
1.1. Consolidated Metropolitan area of Lisbon Lisbon is characterized by its main centre and by contiguous municipalities that constitute an extension of the city. The area of metropolization of Lisbon is relatively homogeneous. We verify that the role of Setubal- considered by many authors as a sub-centre of Lisbon-, is decreasing, and that Palmela registers a major importance due to the growth of enterprise structure and metropolitan employment. In the area of metropolization there are important centres like Vila Franca de Xira, Arruda dos Vinhos and Alcochete characterized by an augmentation of housing, metropolitan employment and urban soil occupation. In this area we set limits to the well structured sub-system Peniche-Caldas da Rainha that we can consider as an area of transition between Lisbon and the area of influence of Leiria.
1.2. Consolidated Metropolitan area of Porto In this area the metropolitan system is rather complex. In the proximities there are central areas such as Aveiro and Braga that compete with Porto. Due to the difficulty of setting limits to for Porto’s area of metropolization we propose transition and corridor areas integrated in its area of metropolization. Porto is characterized by a central area, by a metropolization area well consolidated with emphasis to Maia e S. J. da Madeira, by one metropolitan corridor (Porto-Braga) and by three transition areas (transition area of Porto-Aveiro; transition area of Porto-Viana do Castelo, transition area of Porto-Vale do Sousa); these four areas make the link with Aveiro and Braga and in a inferior level with Viana do Castelo and Vila Real.
2. Potential metropolitan areas
2.1. Area of metropolization of Braga Although we may consider Braga as a polycentric area of Porto due to its physical and functional proximity, we set limits considering it as a metropolization area itself. The growth of metropolitan employment and university education in the last decade are rather important and contribute to the consolidation of this area of metropolization, thus indicating a strong growth of housing and use of urban soil. Braga presents a hierarchical structure with a city center, a second important center (Guimarães) and a homogeneous metropolization area well structured.
2.2. Area of metropolization of Aveiro This area is very similar to Braga. In general it has registered an increase of metropolitan employment and housing. Aveiro is more important at educational and R&D levels than Braga. Spatially, it has two rather homogeneous areas: Albergaria-a-Velha, Ílhavo, Murtosa and Estarreja that form the core of Aveiro and Oliveira do Bairro and Águeda less dense, older, indicating a growth of metropolitan employment and urban pressure. Sever do Vouga and Vagos go the opposite way: the first with a negative evolution and the other with a strong evolution.
2.3. Area of metropolization Viseu Metropolitan area of Viseu is quite homogeneous, with a city centre well defined, and a set of municipalities depending on this centre. In general, urban sprawl is not important, although contiguous municipalities register an increase of housing and urban soil occupation, namely Mortágua and Nelas. In Viseu, metropolitan employment, international trade, foreign capital and university education have registered an increase in the last decade.
2.4. Area of metropolization of Faro Faro is an important city in southern Portugal with a complex and important region of influence, characterized by axes of urban development in the littoral and by depressed areas in the interior. The region doesn’t have important centres and urban hierarchies so we divided it in two areas: an Eastern area centered in Faro, denser in terms of population, higher education and metropolitan employment; and western urban net depending on three cities Lagos-Portimão-Lagoa, characterized by older population, a strong housing expansion and also an increase in metropolitan functions.
2.5. Area of metropolization of Coimbra Coimbra has a large area of metropolization, hierarchical, with a consolidated city centre and a contiguous sub-centre (Condeixa-a-Nova). It is divided in two main areas: the littoral, characterized by a
14
14TH European Colloquium on Theoretical and Quantitative Geography | September 9-13, 2005 | Tomar, Portugal
homogeneous rural structure dispersed and not integrated; the interior with a homogeneous structure but much more interdependent with Coimbra.
3. Areas of urban dynamic (structuring areas of the PUS)
3.1. Area of influence of Bragança-Mirandela-Chaves These centres are situated in poor rural areas of interior with low accessibilities and a sparse urban network. If we consider the variables under analysis, we verify that these municipalities are quite homogeneous and can be analyzed as a whole. However and due the physical distance between those areas we analyze them separately as sub-centers. Bragança is capital of the region and maintain important relations with Mirandela. Chaves is physically farer, thus the importance for the bordering isolated municipalities.
3.2. Area of influence of Vila Real Vila Real is strategically located in a transition area between the littoral and the interior of Portugal. Spatially it presents an urban net in development: the city of Vila Real itself has a with a major importance that structures an important urban net (Vila Real-Régua-Lamego) with relevant commuting trips; and a west area of influence also considered of transition between Porto and Vila Real; more populated and with bigger growth of metropolitan employment.
3.3. Area of influence of Viana do Castelo We consider that Viana do Castelo is not important enough to be considered at the metropolitan level, even though it has an important role in the liaison between northern Portugal and Spain. Internally it is rather homogeneous with a more developed central urban area and with rural areas very dependent on the centre.
3.4. Area of influence of Èvora This area presents a hierarchical structure with a centre characterized by specialized employment, higher education, and increase of urban population, a sub-centre (Viana do Alentejo) that registers an evolution in the number of enterprises created and commuting trips and finally municipalities very dependent on the centre.
3.5. Area of influence of Beja In terms of its main characteristics this area is very close to Évora. In fact it is very difficult to
find the limits (in GeoSOM_0) between them because the contiguous municipalities (Viana do Alentejo and Alvito) present similar characteristics. Spatially it presents both a hierarchical and a net structure with the main role distributed by two centres (Beja and Ferreira do Alentejo). The first more focused on the development of education, health and culture and the other with a strong economic and employment evolution. The other municipalities are very homogeneous and depending on the centre.
3.6. Area de influence of Portalegre-Elvas In this area we verify a complex urban net with municipalities competing with each other. Castelo de Vide and Marvão present the major differences due to the increase of seasonal housing, foreign capital, R&D and tourist activity. In the other municipalities we register a increase of specialized employment in industry, commerce and enterprises services, an increase in the numbers of created businesses and an evolution of commuting trips in the triangle Vila Viçosa-Borba-Estremoz and in Elvas-Campo Maior.
3.7. Area of Influence of Leiria This area is characterized by an increase of population and metropolitan employment, namely in specialized industry and enterprise services. We verify that the area starts to grow in terms of housing and urban soil. Spatially, Leiria presents similar forms to Viseu, with an important centre and homogenous areas that depend of this centre. Despite the homogeneous, attention is drawn to Pombal, maybe because of being an area of transition in Coimbra and Leiria.
3.8. Area of influence of Sines-Santiago do Cacém Sines and Santiago do Cacém are a complex area difficult to define due to the functional relations with some municipalities of the Lisbon area, namely Sesimbra and Setúbal. However the physical distance is an obstacle to the integration of these municipalities on a boarder area. The re-structuring and the role of the port of Sines, as well as the tourism are the main motivators of development in this area of undefined limits.
3.9. Urban net Castelo Branco-Covilhã-Guarda This is an area of interior surrounded by rural municipalities, but more accessible and with an urban network more developed than the area of influence of Bragança-Mirandela-Chaves. We consider that these three areas form an urban net in which Guarda and Castelo Branco have a greater importance
15
14TH European Colloquium on Theoretical and Quantitative Geography | September 9-13, 2005 | Tomar, Portugal
that the other areas, namely in terms of metropolitan employment, health and culture and higher education, this last one specially in Castelo Branco.
3.10. Urban net of Entroncamento-Tomar-Torres Novas These areas show a strong evolution in the last decade in terms of businesses creation, increase of metropolitan employment and urban population and sustain the development of a small involving area. Structurally we verify both a net and hierarchical systems with two contiguous main centres, Entroncamento e Vila Nova da Barquinha; Torres Novas constitutes a sub-centre, and finally Tomar and Abrantes in a 3rd level.
CONCLUSIONS AND FURTHER DEVELOPMENTS
The methodology and the analysis presented here have proved to be very useful in the identification and interpretation of the metropolitan dynamics.
We started from a purely statistical analysis of the relations between indicators (K-means) and continue to an analysis that integrates space component trough SOM and specially trough Geo-SOM. Through K-means and SOM we defined a typology of metropolitan dynamics for continental Portugal while Geo-SOM helped us delimitating the principal metropolitan or potential metropolitan spaces. Additionally, we identified and analyzed its specifics structures and urban forms finding information that was concealed in previous analysis due to the size and complexity of the dataset. Clearly, the choice of indicators (merely statistics) may be questioned, as well as the subjective process of extracting clusters through SOM and Geo-SOM; however it was very useful in providing access to important knowledge about the recent reorganization of the P.U.S. and helping understanding the complexity of metropolization process.
Classification problems are not new in geography and in spatial analysis, what is new is the use of classification tools that integrated a geographical, auto-organized and fuzzy approach which provide access to new knowledge and improve the perspective given by more traditional statistical methods. The idea of developing a connection between attribute space and geographical space provides interesting results by processing attribute patterns with subsequent visualization and interpretation of spatial context.
This analysis is developed in a broader framework which includes the process of metropolization in Portugal, its legal framework, and the territorial planning. By comparing our resulting typology with the administrative limits of metropolitan areas such as the ones proposed by recent laws we aim at verifying if they reveal adequate [15]. At this present time we think that functional limits are more adapted to the reality and must be considered. Metropolization introduces a new way of thinking in urban geography due to the complexity of the process and the need of scale articulation. The articulation of administrative limits with functional space and with territorial planning constitute a major challenge for us, namely in proposing ways to accommodate the dynamics of metropolization within the more general tasks of territory of planning and implementation of urban policies.
REFERENCES
1. Abrantes, P., Análise quantitativa da metropolização em Portugal, I Journeys of e-GEO, Lisbon, October 28-29, 2004
2. Bação, F., Lobo, V., and Painho, M., The Self-Organizing Map, Geo-SOM, and relevant variants for GeoSciences, Computers & Geosciences, vol. 31, Elsevier, 2005, pp. 155-163
3. Bação, F., Lobo, V., and Painho, M., Geo-Self-Organizing Map (Geo-SOM) for building and exploring homogeneous regions, Computer & Science, vol. 3234, Berlin, 2004, pp. 22-37.
4. Claval, P., Métropolisation et globalisation, in Géographie et cultures, nr. 48, Paris, 2003, pp. 5-23
5. Fu, L., Neural Networks in Computer Intelligence, Singapore, McGraw Hill, 1994
16
14TH European Colloquium on Theoretical and Quantitative Geography | September 9-13, 2005 | Tomar, Portugal
6. Gaspar, J., Cidades Medias e cidades intermédias. Novas funções territoriais e novas formas urbanas em Portugal, in Ciudades intermedias, urbanisacíon y sostenabilidad, Lleida, Ed. Milénio, 2000, pp. 125-140
7. Haeringer, P., (Ed). L'économie invertie: Mégapolisation, pauvreté majoritaire et nouvelle économie urbaine, Série 2001 Plus, Synthèses et recherches, Paris: Ministère de l'Equipement: Centre de Prospective et de veille scientifique, 2000
8. Kiviluoto, K., Comparing 2D and 3D self-organizing maps in financial data visualization, Methodologies for the Conception, Design and Application of Soft Computing, Proceedings of the 5th International Conference on Soft Computing and Information/Intelligent Systems, Iizuka, Fukuoka, Japan, World Scientific, 1998
10. Kohonen, T., Hynninen, J, Kangas J. and Laaksonen, J., SOM_PAK, The Self-Organizing Map Program Package, SOM Programming Team of the Helsinki University of Technology, Laboratory of Computer and Information Science, 1995
12. Lacour, C. and Puissant, S., La métropolisation: Croissance, Diversité, Fractures, Paris, Anthropos, 1999
13. Maroco, J., Análise Estatística com utilização do SPSS, Lisboa, Sílabo, 2003
14. Marques, T. S., Portugal na Transição do século, retratos e dinâmicas territoriais, Porto, ed. Afrontamento, 2004.
15. Miranda, V., Ramos, R., Comparação entre metodologias para a definição de zonas urbanas homogéneas mediante uma aplicação ao noroeste de Portugal, V Congresso da Geografia Portuguesa, Universidade do Minho, Guimarães, 14-16 October, 2004
16. Portas, Nuno, et al, Políticas Urbanas, Tendências e Oportunidades, Lisboa, Fundação Calouste Gulbenkian, 2003
17. Reis, E., Estatística Multivariada Aplicada, Lisboa, Sílabo, 2001
18. Sanders, L. (coor.) Modèles en analyse spatiale, Paris, Hermès-Lavoisier, 2001
19. Takatsuka, M., An Application of the Self-Organizing Map and Interactive 3-D Visualization to Geospacial Data, GeoComputation'01 (6th International Conference on GeoComputation), Brisbane, Australia, 2001
20. Ultsch, A. and Siemon, H. P., Kohonen´s Self-Organizing Neural Networks for Exploratory Data Analysis, International Neural Network Conference, Paris, 1990
21. Vesanto, J. and E. Alhoniemi, Clustering of the Self-Organizing Map, IEEE Transactions on Neural Networks, Nr. 11, 3, 2000, pp. 586-600
Patricia Abrantes is PhD. student in the University of Paris IV and in the New University of Lisbon (Faculty of Social and Human Sciences), receiving an individual grant from the Portuguese Foundation for Science and Technology (Fundação para a Ciência e a Tecnologia). She holds a Masters degree in
17
14TH European Colloquium on Theoretical and Quantitative Geography | September 9-13, 2005 | Tomar, Portugal
Planning, Urbanism and Space Dynamics from the University of Paris I and Paris IV and a degree in Geography and Regional Planning from the Faculty of Social and Human Sciences of the New University of Lisbon. She is currently researcher in the e-Geo - Centre for Studies in Geography and Regional Planning at the New University of Lisbon. Her main interests are in urban policies, metropolitan planning, spatial analysis and geo-statistics.
Fernando Bação is professor at the Institute of Statistics and Information Management (ISEGI-UNL) and UNIGIS Portugal, teaches Geographic Information Science (GIS) and Knowledge Discovery related courses. He holds a PhD. from the New University of Lisbon in Information Management and has published mostly on topics related with the application of Knowledge Discovery Tools within the GIS field. He’s currently the director of the undergraduate program at ISEGI-UNL. For more information please visit http://www.isegi.unl.pt/ensino/docentes/fbacao/index.html.
Victor José de Almeida e Sousa Lobo is an Associate Professor at the Portuguese Naval Academy, and an invited Professor at the Institute of Statistics and Information Management of the New University of Lisbon (ISEGI-UNL). He has a PhD and MSc in Computer Science Engineering by the Faculty of Science and Technology of the New University of Lisbon, and an Engineering Degree in Electrical Engineering by the Technical University of Lisbon. His main interests are in Neural Networks, Self-Organization, Pattern Recognition, Clustering, and more recently in Knowledge Discovery Tools within the GIS field. For more information, please visit http://www.isegi.unl.pt/ensino/docentes/vlobo.
José António Tenedório was born in Caminha in 1961. He studied in Caminha, Viana do Castelo, Porto, Lisbon, Toulouse and Paris. He holds a degree in Geography and Regional Planning from the Faculty of Social and Human Sciences of the New University of Lisbon. He obtained a Postgraduate Certificate in Remote Sensing from the Faculty of Sciences of the University of Paris VI - Pierre et Marie Curie, and his PhD in Urbanism, specializing in Remote Sensing at the Paris Institute of Urbanism at the University of Paris XII. He is a tenured Assistant Professor in the Department of Geography and Regional Planning (DGPR) of the Faculty of Social and Human Sciences (FCSH) of the New University of Lisbon, and Head of the e-Geo Centre for Studies in Geography and Regional Planning at the New University of Lisbon - an R&D unit which receives funding for periods of several years from the Portuguese Foundation for Science and Technology.