Spatial modes of phase-sensitive parametric image amplifiers with circular and elliptical
Gaussian pumps
Muthiah Annamalai,1 Nikolai Stelmakh,
1 Michael Vasilyev,
1,* and Prem Kumar
2
1Department of Electrical Engineering, University of Texas at Arlington, Arlington, Texas 76019, USA 2Center for Photonic Communication and Computing, EECS Department, Northwestern University, 2145 Sheridan
Abstract: We develop a method for finding the number and shapes of the independently squeezed or amplified modes of a spatially-broadband, travelling-wave, frequency- and polarization-degenerate optical parametric amplifier in the general case of an elliptical Gaussian pump. The obtained results show that for tightly focused pump only one mode is squeezed, and this mode has a Gaussian TEM00 shape. For larger pump spot sizes that support multiple modes, the shapes of the most-amplified modes are close to Hermite- or Laguerre-Gaussian profiles. These results can be used to generate matched local oscillators for detecting high amounts of squeezing and to design parametric image amplifiers that introduce minimal distortion.
OCIS codes: (270.6570) Squeezed states; (190.4970) Parametric oscillators and amplifiers.
References and links
1. C. M. Caves, “Quantum limits on noise in linear amplifiers,” Phys. Rev. D Part. Fields 26(8), 1817–1839 (1982). 2. D. Levandovsky, M. Vasilyev, and P. Kumar, “Amplitude squeezing of light by means of a phase-sensitive fiber
parametric amplifier,” Opt. Lett. 24(14), 984–986 (1999). 3. D. Levandovsky, M. Vasilyev, and P. Kumar, “Near-noiseless amplification of light by a phase-sensitive fibre
amplifier,” PRAMANA–J. Phys. 56(2-3), 281–285 (2001). 4. W. Imajuku, A. Takada, and Y. Yamabayashi, “Low-noise amplification under the 3 dB noise figure in high-gain
phase-sensitive fibre amplifier,” Electron. Lett. 35(22), 1954–1955 (1999). 5. P. L. Voss, K. G. Köprülü, and P. Kumar, “Raman-noise-induced quantum limits for χ(3) nondegenerate phase-
sensitive amplification and quadrature squeezing,” J. Opt. Soc. Am. B 23(4), 598–610 (2006). 6. Z. Tong, A. Bogris, C. Lundström, C. J. McKinstrie, M. Vasilyev, M. Karlsson, and P. A. Andrekson, “Modeling
and measurement of the noise figure of a cascaded non-degenerate phase-sensitive parametric amplifier,” Opt. Express 18(14), 14820–14835 (2010).
7. M. I. Kolobov and L. A. Lugiato, “Noiseless amplification of optical images,” Phys. Rev. A 52(6), 4930–4940 (1995).
8. M. Kolobov, “The spatial behavior of nonclassical light,” Rev. Mod. Phys. 71(5), 1539–1589 (1999). 9. K. Wang, G. Yang, A. Gatti, and L. Lugiato, “Controlling the signal-to-noise ratio in optical parametric image
amplification,” J. Opt. B Quantum Semiclassical Opt. 5(4), S535–S544 (2003). 10. S.-K. Choi, M. Vasilyev, and P. Kumar, “Noiseless optical amplification of images,” Phys. Rev. Lett. 83, 1938–
1941 (1999) [erratum: Phys. Rev. Lett. 84, 1361–1361 (2000)]. 11. A. Mosset, F. Devaux, and E. Lantz, “Spatially noiseless optical amplification of images,” Phys. Rev. Lett.
94(22), 223603 (2005). 12. E. Lantz and F. Devaux, “Parametric amplification of images: from time gating to noiseless amplification,” IEEE
J. Sel. Top. Quantum Electron. 14(3), 635–647 (2008). 13. L. Lopez, N. Treps, B. Chalopin, C. Fabre, and A. Maître, “Quantum processing of images by continuous wave
optical parametric amplification,” Phys. Rev. Lett. 100(1), 013604 (2008). 14. P. Kumar, V. Grigoryan, and M. Vasilyev, “Noise-free amplification: towards quantum laser radar,” the 14th
Coherent Laser Radar Conference, Snowmass, CO, July 2007. http://space.hsv.usra.edu/CLRC/presentations/Kumar.ppt
15. Z. Dutton, J. H. Shapiro, and S. Guha, “LADAR resolution improvement using receivers enhanced with squeezed-vacuum injection and phase-sensitive amplification,” J. Opt. Soc. Am. B 27(6), A63–A72 (2010).
16. O.-K. Lim, G. Alon, Z. Dutton, S. Guha, M. Vasilyev, and P. Kumar, “Optical resolution enhancement with phase-sensitive preamplification,” in Conference on Lasers and Electro-Optics, OSA Technical Digest (CD) (Optical Society of America, 2010), paper CTuPP7.
17. M. Vasilyev, N. Stelmakh, and P. Kumar, “Phase-sensitive image amplification with elliptical Gaussian pump,”
#155158 - $15.00 USD Received 22 Sep 2011; revised 23 Nov 2011; accepted 28 Nov 2011; published 14 Dec 2011(C) 2011 OSA 19 December 2011 / Vol. 19, No. 27 / OPTICS EXPRESS 26710
Opt. Express 17(14), 11415–11425 (2009). 18. M. Vasilyev, N. Stelmakh, and P. Kumar, “Estimation of the spatial bandwidth of an optical parametric amplifier
with plane-wave pump,” J. Mod. Opt. 56(18-19), 2029–2033 (2009). 19. A. La Porta and R. E. Slusher, “Squeezing limits at high parametric gains,” Phys. Rev. A 44(3), 2013–2022
(1991). 20. S.-K. Choi, R.-D. Li, C. Kim, and P. Kumar, “Traveling-wave optical parametric amplifier: investigation of its
phase-sensitive and phase-insensitive gain response,” J. Opt. Soc. Am. B 14(7), 1564–1575 (1997). 21. C. Kim and P. Kumar, “Quadrature-squeezed light detection using a self-generated matched local oscillator,”
Phys. Rev. Lett. 73(12), 1605–1608 (1994). 22. R.-D. Li, S.-K. Choi, C. Kim, and P. Kumar, “Generation of sub-Poissonian pulses of light,” Phys. Rev. A 51(5),
R3429–R3432 (1995). 23. K. G. Köprülü and O. Aytür, “Analysis of Gaussian-beam degenerate optical parametric amplifiers for the
generation of quadrature-squeezed states,” Phys. Rev. A 60(5), 4122–4134 (1999). 24. K. G. Köprülü and O. Aytür, “Analysis of the generation of amplitude-squeezed light with Gaussian-beam
degenerate optical parametric amplifiers,” J. Opt. Soc. Am. B 18(6), 846–854 (2001). 25. C. Schwob, P. F. Cohadon, C. Fabre, M. A. M. Marte, H. Ritsch, A. Gatti, and L. Lugiato, “Transverse effects
and mode couplings in OPOs,” Appl. Phys. B 66(6), 685–699 (1998). 26. M. Annamalai, N. Stelmakh, M. Vasilyev, and P. Kumar, “Spatial modes of phase-sensitive image amplifier with
elliptical Gaussian pump,” in Laser Science, OSA Technical Digest (CD) (Optical Society of America, 2010), paper LTuB5.
27. M. Vasilyev, M. Annamalai, N. Stelmakh, and P. Kumar, “Quantum properties of a spatially-broadband traveling-wave phase-sensitive optical parametric amplifier,” J. Mod. Opt. 57(19), 1908–1915 (2010).
28. Please note that the definition of deff in our prior work (Refs. 17, 18, and 27) is different from that in the present paper. The prior-work deff denotes the quantity that is more commonly known as the effective χ(2) and equals 2deff in the present paper’s notations. As a result, the nonlinear paraxial wave equation in Refs. 17, 18, and 27 does not have the factor of 2 in front of deff. One fallout of this unfortunate choice of notation in our prior work is that Ref. 17 assumes effective χ(2) = 8.7 pm/V for PPKTP crystal, which is about half of the actual value of that crystal’s nonlinearity, and the resulting pump powers listed in Refs. 17 and 26 are four times larger than those required for the same gain in a real PPKTP crystal. The present paper’s definitions rectify the previous inconsistencies.
29. E. Lantz and F. Devaux, “Numerical simulation of spatial fluctuations in parametric image amplification,” Eur. Phys. J. D 17(1), 93–98 (2001).
30. H. P. Yuen, “Two-photon coherent states of the radiation field,” Phys. Rev. A 13(6), 2226–2243 (1976). 31. H. P. Yuen, “Multimode two-photon coherent states and unitary representation of the symplectic group,” Nucl.
Phys. B 6, 309–313 (1989). 32. D. Levandovsky, “Quantum noise suppression using optical fibers,” Ph.D. thesis, Northwestern University, 1999. 33. L. Lopez, S. Gigan, N. Treps, A. Maître, C. Fabre, and A. Gatti, “Multimode squeezing properties of a confocal
optical parametric oscillator: Beyond the thin-crystal approximation,” Phys. Rev. A 72(1), 013806 (2005). 34. M. Annamalai, M. Vasilyev, N. Stelmakh, and P. Kumar, “Compact Representation of Spatial Modes of Phase-
Sensitive Image Amplifier,” in Conference on Lasers and Electro-Optics, OSA Technical Digest (CD) (Optical Society of America, 2011), paper JThB77.
35. W. Wasilewski, A. I. Lvovsky, K. Banaszek, and C. Radzewicz, “Pulsed squeezed light: Simultaneous squeezing of multiple modes,” Phys. Rev. A 73(6), 063819 (2006).
36. J. H. Shapiro and A. Shakeel, “Optimizing homodyne detection of quadrature-noise squeezing by local-oscillator selection,” J. Opt. Soc. Am. B 14(2), 232–249 (1997).
37. C. J. McKinstrie, “Unitary and singular value decompositions of parametric processes in fibers,” Opt. Commun. 282(4), 583–593 (2009).
38. G. Patera, N. Treps, C. Fabre, and G. J. de Valcárcel, “Quantum theory of synchronously pumped type I optical parametric oscillators: characterization of the squeezed supermodes,” Eur. Phys. J. D 56(1), 123–140 (2010).
39. A. Ekert and P. L. Knight, “Entangled quantum systems and the Schmidt decomposition,” Am. J. Phys. 63(5), 415–423 (1995).
40. C. K. Law, I. A. Walmsley, and J. H. Eberly, “Continuous frequency entanglement: effective finite hilbert space and entropy control,” Phys. Rev. Lett. 84(23), 5304–5307 (2000).
41. C. K. Law and J. H. Eberly, “Analysis and interpretation of high transverse entanglement in optical parametric down conversion,” Phys. Rev. Lett. 92(12), 127903 (2004).
1. Introduction
Phase-sensitive optical parametric amplifiers (PSAs), unlike any other optical amplifiers, can increase the magnitude of the signal without adding any noise [1]. This property, coupled with the wide temporal bandwidth of fiber-based parametric amplifiers, has lead to their use as nearly noiseless inline amplifiers for optical communication systems [2–6]. Similarly, the broad spatial bandwidth of the parametric amplifiers enables their use as noiseless amplifiers of faint optical images, as was theoretically proposed in [7–9] and experimentally demonstrated in [10–13]. The signal-to-noise ratio improvement provided by such image amplifiers can in turn lead to resolution improvement in the detection of faint images [14–16].
#155158 - $15.00 USD Received 22 Sep 2011; revised 23 Nov 2011; accepted 28 Nov 2011; published 14 Dec 2011(C) 2011 OSA 19 December 2011 / Vol. 19, No. 27 / OPTICS EXPRESS 26711
The same devices can also be used for the generation of spatially-broadband squeezed vacuum for quantum information processing applications. The design of practical parametric image amplifiers, however, represents a big challenge. Indeed, the traveling-wave nature of gain in these devices requires the use of a tightly focused pump beam (typically, the fundamental Gaussian TEM00 mode) of very high power (~1 kW per pixel of resolution) [17]. The resulting spatially-varying PSA gain, together with the limited spatial bandwidth of the PSA [determined from phase-matching conditions to be ~(kp/L)
1/2, where kp is the pump
propagation constant and L is the nonlinear crystal’s length] [7, 12, 18], couples and mixes up in both space and spatial-frequency domains the modes representing the information content of the image [17]. These spatial mode-mixing effects, known as gain-induced diffraction [19, 20], also make it difficult to detect the lowest-noise mode of a traveling-wave squeezer [21, 22], because the properly mode-matched homodyne detector requires exact knowledge of this mode’s spatial profile. The coupling between the various spatial modes of the signal was previously studied either in a travelling-wave PSA in which only the radially symmetric signal modes were considered [23, 24], or in a cavity-based sub-threshold optical-parametric oscillator [25], all pumped by a circular Gaussian beam. In this paper, we extend the mode-coupling analysis to the travelling-wave PSA with a more general elliptical Gaussian TEM00 pump and then develop a procedure to find, for the first time to our knowledge, the orthogonal set of independently squeezed (or amplified) eigenmodes of such a PSA. We presented the preliminary results of this approach in a recent conference paper [26].
The rest of this paper is organized as follows: Section 2 describes the theoretical model of mode coupling in the PSA and the procedure for finding the PSA’s eigenmodes, Section 3 describes the details of our computational approach, Section 4 reports and discusses the results, and Section 5 summarizes our work.
2. Theory of 2-D spatially-multimode PSA
2.1 Hermite-Gaussian mode representation
Our work builds upon the Laguerre-Gaussian (LG) expansion of the parametric amplifier equations, originally developed for cavities [25] and later extended to 1-D (radially symmetrical) traveling-wave PSAs [23]. We generalize this approach by replacing the LG expansion with a Hermite-Gaussian (HG) expansion to describe arbitrary 2-D images and a general elliptical Gaussian pump beam with potentially unequal 1/e intensity radii a0px and a0py in x- and y-dimensions, respectively. By expanding the PSA input over signal TEMmn HG modes having the same Rayleigh ranges zRx = kpa0px
2 and zRy = kpa0py
2 as the pump, we reduce
the PSA propagation to a system of coupled ordinary differential equations for the HG-mode amplitudes Amn = Xmn + iYmn. After integrating this system of equations, we can obtain the PSA’s Green’s function and all the quantum correlators needed for finding the independently squeezed or amplified modes [27].
We start by considering the nonlinear paraxial wave equation of a degenerate optical parametric amplifier in the undepleted pump approximation [17, 27, 28]
( )2 *2( , )
( , ) ( , ) ( , ) exp .2
s effs
s p s
s s
i dE z iE z E z E z i kz
z k n cρ
ωρρ ρ ρ
∂= ∇ + ∆
∂
�
� � �
(1)
We are looking for the solutions in the form ( )
( , ) ( , ) c.c.i ii k z t
i ie r t E z e
ωρ −= +��
, where
( , )i
E zρ�
is a slowly-varying field envelope, ρ�
is a transverse vector with coordinates (x,y),
the intensity is given by 2
0( , ) 2 | ( , ) |
i i iI z n c E zρ ε ρ=� �
with index i taking value of either s or p,
denoting the signal or pump field, respectively, and ωp = 2ωs. We expand the signal and pump beams over the HG basis with potentially unequal 1/e intensity radii in x- and y-dimensions:
#155158 - $15.00 USD Received 22 Sep 2011; revised 23 Nov 2011; accepted 28 Nov 2011; published 14 Dec 2011(C) 2011 OSA 19 December 2011 / Vol. 19, No. 27 / OPTICS EXPRESS 26712
0
0 0 0 0
0
0 0
, 0
( , ) ( , , , ) ( , , , ) ,2
( )( , ) ( , , 2 , ) ( , , 2 , ) ,
2
pi p p
p x p y p
p
p pmn
s m x s n y s
m n s
PE z e g x z a k g y z a k
n c
A zE z g x z a k g y z a k
n c
θρε
ρε
=
=∑
�
�
(2)
where the one-dimensional HG modes gm are defined as (β = x or y)
2 2
2( ) 2 ( ) 2 ( )
01/2
[ / ( )]( , , , )
2 ! ( )
iki z a z R zm
mm
H a zg z a k e e e
m a z
β βθβ
βπ
−
= (3)
with the orthogonality condition
*
0 0( , , , ) ( , , , ) ,
m m mmg z a k g z a k dβ β β δ
∞
′ ′−∞=∫ (4)
and the Rayleigh range zR, 1/e intensity radius a(z), Gouy phase shift θ(z), and beam’s radius of curvature R(z), respectively, given by
2
0
2
0
1
2
,
( ) 1 ( / ) ,
1( ) tan ,
2
( ) [1 ( / ) ].
R
R
R
R
z ka
a z a z z
zz m
z
R z z z z
θ −
=
= +
= − +
= +
(5)
The x- and y-radii for the signal expansion basis are chosen to be 21/2
times greater than those of the pump, which ensures that the signal and the pump have the same wavefront curvature and the same Rayleigh ranges zRx = kpa0px
2 and zRy = kpa0py
2. The beam waists for
both the pump and the signal HG basis occur at z = 0. After substituting the HG expansions of the signal and the pump [Eq. (2)] into Eq. (1) and
projecting the results onto the signal’s HG basis, we arrive at the following coupled-mode equations for the signal’s HG mode amplitudes Amn(z):
*
,
( )( / ) ( / ) ( ) ,pi i kzmn
mm Rx nn Ry m n
m n
A zie e B z z B z z A z
z
θ κ ∆′ ′ ′ ′
′ ′
∂=
∂ ∑ (6)
where
2 2
eff 0
2 3
0 0 0
2,s
p p
s p x y
d P
n n c a a
ωκ
ε π= (7)
∆k is the wavevector mismatch, P0 is the pump power and θp is the initial pump phase. The
overlap integral Bmm′ of the pump and two signal modes with indices m and m′ has a closed-form expression
1( 1/ 2) tan 2
2 14
( 1) ( 1)!!
( ),1 2 ! !( )
0 ( ),
m m
i m m
m m
mm
e m m
for even m mm mB
for odd m m
ξ
ξξ
−′−
′+ +
′+ +
′
′− + −
′ +′+=
′+
(8)
#155158 - $15.00 USD Received 22 Sep 2011; revised 23 Nov 2011; accepted 28 Nov 2011; published 14 Dec 2011(C) 2011 OSA 19 December 2011 / Vol. 19, No. 27 / OPTICS EXPRESS 26713
where the double factorial (m + m′ – 1)!! = 1 for m + m′ = 0. Let us list several important
properties of the coupling matrix Bmm′′′′ comprising coefficients Bmm′. First of all,
1( 1/2) tan
24
( ) (0) ,1
i m m
mm mm
eB B
ξ
ξξ
−′+ +
′ ′=+
(9)
i.e., propagation away from the center of the crystal reduces the magnitude of Bmm′ and introduces a phase shift due to the Gouy phase mismatch between the pump and the two
signal modes. Second, the magnitude of Bmm′(0) for large indices m and m′ can be approximated as
2( )
4 ( )
| (0) | ,( )
m m
m m
mm
eB
m mπ
′−−
′+
′ ≈′+
(10)
i.e., for a fixed (m + m′), it exhibits a fast Gaussian decay as a function of (m – m′), whereas
the decay along the main diagonal m = m′ is very slow and proportional to (m + m′)–1/2, as
illustrated in Fig. 1. Hence, the fast decay of Bmm′ versus (m – m′) serves as the selection rule favoring coupling between the signal modes with close indices. On the other hand, the slow
decay versus (m + m′) means that the maximum range of the amplified signal modes is determined not by the magnitude of the coupling coefficient, but by its Gouy phase mismatch
[numerator in Eq. (9)] that leads to fast oscillations at large (m + m′), which limits the PSA gain. The signal evolution in the PSA in Eq. (6) is governed by the outer product of matrices
Bmm′′′′ and B
nn′′′′, yielding a 4th-rank tensor in which only 25% of the elements are not zero.
0 10 20 30 40-30
-25
-20
-15
-10
-5
0
10lo
g 10[ |B
mm
′(0)|
]
(m+m′) or (m-m′)
m=m′m+m′=100
m+m′=80
m+m′=50
m+m′=20
Fig. 1. Magnitude (absolute value) of the coefficients of the coupling matrix Bmm′′′′(0) either as a
function of (m + m′) in the direction of main diagonal m = m′ (red) or as a function of (m – m′) in the direction orthogonal to the main diagonal for m + m ′ = 20 (blue), 50 (green), 80 (purple), and 100 (black). Filled circles correspond to the exact Eq. (8) and solid curves to the approximate Eq. (10).
#155158 - $15.00 USD Received 22 Sep 2011; revised 23 Nov 2011; accepted 28 Nov 2011; published 14 Dec 2011(C) 2011 OSA 19 December 2011 / Vol. 19, No. 27 / OPTICS EXPRESS 26714
2.2 Laguerre-Gaussian mode representation
In the case of a circular Gaussian pump beam with a0px = a0py = a0p, it is more convenient to
use the LG expansion [25]:
0
00 0
0
0
, 0
( , ) ( , , , , ) ,2
( )( , ) ( , , , 2 , ) ,
2
pi p
p p
p
pl p
s pl s
p l s
PE z e f r z a k
n c
A zE z f r z a k
n c
θρ ϕε
ρ ϕε
=
=∑
�
�
(11)
where the LG modes fpl of radial index p and azimuthal index l have the form
2 2
2
| |2
| | ( ) 2 ( ) 2 ( )
0 2 2
!( , , , , ) ,
( )( | |)! ( ) ( )
l r rik
l il i z a z R z
pl p
p r rf r z a k L e e e e
a zp l a z a z
θ
π
−ϕ
ϕ = + (12)
r, φ are the polar coordinates,
( )
2
0
2
0
1
2
,
( ) 1 ( / ) ,
( ) 2 | | 1 tan ,
( ) [1 ( / ) ],
R
R
R
R
z ka
a z a z z
zz p l
z
R z z z z
θ −
=
= +
= − + +
= +
(13)
and the orthogonality condition is
2
*
0 00 0
( , , , , ) ( , , , , ) d d .pl p l pp ll
f r z a k f r z a k r rπ
δ δ∞
′ ′ ′ ′ϕ ϕ ϕ =∫ ∫ (14)
The fundamental LG mode LG00 coincides with the fundamental circular HG mode TEM00:
00 0 0 0 0 0
( , , , , ) ( , , , ) ( , , , ).f r z a k g x z a k g y z a kϕ = × (15)
The coupled-mode equations in the LG representation take the form of
| | *
,
( )( / ) ( ) ,pipl i kz l
pp R p l
p
A zie e z z A z
z
θ κ ∆′ ′ −
′
∂= Λ
∂ ∑ (16)
where
2 2
eff 0
2 3 2
0 0
2,
( )
s
p
s p
d P
n n c a
ωκ
ε π= (17)
the overlap integral of the pump mode LG00, with the signal modes LGpl and LGp′l′ is given by
12 ( | | 1/2) tan
| |
| | 12
( | |)!( ) ,
2 ! !( | |)!( | |)!1
i p p ll
pp p p l
e p p l
p p p l p l
ξ
ξξ
−′+ + +
′ ′+ + +
′+ +Λ =
′ ′+ ++ (18)
and the coupling coefficients between the modes LGpl and LGp′l′ are zero for l ≠ –l′. The latter selection rule means that the circular symmetry of the pump reduces the rank of the coupling tensor in the PSA propagation equation from 4 to 3. Apart from this simplification, other properties of the coupling coefficients in Eq. (16) are similar to those in the HG case. Namely, these coefficients can be expressed as
#155158 - $15.00 USD Received 22 Sep 2011; revised 23 Nov 2011; accepted 28 Nov 2011; published 14 Dec 2011(C) 2011 OSA 19 December 2011 / Vol. 19, No. 27 / OPTICS EXPRESS 26715
12 ( | | 1/2) tan
| | | |
2( ) (0) ,
1
i p p ll l
pp pp
e ξ
ξξ
−′+ + +
′ ′Λ = Λ+
(19)
and for large value of (p + p′ + |l|) they have an asymptotic dependence
2 2( )
2( | |)| | (0) ,
2 ( | |)
p p l
p p ll
pp
e
p p lπ
′− +−
′+ +
′Λ ≈′+ +
(20)
which imposes fast Gaussian decay when indices deviate from p = p′ and l = 0 condition, as well as a slow p
–1/2 decay when they satisfy this condition. We also note that, as a
consequence of Eq. (15), the first diagonal element of the coupling tensor is the same in both
LG and HG representations: 0 2
00 00(0) (0) 1/2.BΛ = =
2.3 PSA Green’s functions and eigenmodes
In what follows, we will use index notation corresponding to the HG representation; results for the LG representation can be obtained in a similar manner. We will assume that the pump beam waist is located exactly at the center of a nonlinear crystal of length L, i.e., the crystal input is at z = –L/2 and crystal output is at z = L/2. Following our approach to solving the PSA equation and finding its eigenmodes, presented in [27], we re-write the complex signal mode amplitudes Amn = Xmn + iYmn in a matrix-vector form
( )
( ) ,( )
mn
mn
mn
zz
z
=
XA
Y (21)
where mn
X and mn
Y are real-valued matrices. Then, we can express the solution as
( / 2) ( / 2, / 2) ( / 2) ,mn mnm n m n
L L L L′ ′ ′ ′= − −A G A (22)
where the tensor mnm n′ ′G is the PSA Green’s function in HG representation, relating the mode
amplitudes at the input of the crystal to those at the output. Unlike the numerically
challenging evaluation of the PSA Green’s function in xy-representation [29], mnm n′ ′G can be
easily computed by exciting a finite number of input HG modes ( / 2)m n
L′ ′ −A , one at a time,
and recording the output mode pattern ( / 2)mn
LA in each case. Once the Green’s function is
known, the amount of squeezing can be found using the Rayleigh quotient
( / 2) .mn mnm n m n m n m n
mn mn
Lλ ′′ ′′ ′ ′ ′′ ′′ ′ ′=T T
T
A G G A
A A (23)
From the symplectic property of the tensor mnm n′ ′G [27, 30–32] it follows that the output
can be decomposed into a set of independently squeezed modes (a Karhunen-Loève expansion) determined from the eigenvalue equation
( / 2) ,mnm n m n m n m n mn
Lλ′′ ′′ ′ ′ ′′ ′′ ′ ′ =TG G A A (24)
where λ is the gain (same as squeezing factor) of the eigenmode mn
λA . Symplecticity of the
tensor mnm n′ ′G ensures that for each eigenmode
mn
λA with eigenvalue λ, there is an eigenmode
1/
mn
λA with eigenvalue 1/λ that is obtained by –90° phase shift of mn
λA (i.e., by substituting
mnY for
mnX , and
mn−X for
mnY ):
#155158 - $15.00 USD Received 22 Sep 2011; revised 23 Nov 2011; accepted 28 Nov 2011; published 14 Dec 2011(C) 2011 OSA 19 December 2011 / Vol. 19, No. 27 / OPTICS EXPRESS 26716
1/
, .mn mn
mn mn
mn mn
λ λ = = −
X YA A
Y X (25)
Equation (24) allows one to find the independently squeezed / amplified modes at the PSA output (at z = L/2). In order to obtain their shapes at the PSA input (at z = –L/2), one can invoke the reciprocity argument [23], which stems from the equivalence between z-reversal and conjugation of the coupling coefficients in Eq. (6) (for this, it is helpful to assume θp = –π/2 as the initial phase reference). The reciprocity principle states that the squeezing factor detected by a particular spatial profile of the local oscillator is the same as the classical PSA gain seen by the input signal whose profile is conjugate to that of the local oscillator. When applied to the local-oscillator shape that matches one of the PSA eigenmodes (and for the PSA eigenmode the gain and squeezing factors are the same), this principle means that the eigenmode profile at the PSA input is the conjugate of the eigenmode profile at the PSA output.
3. Computational considerations
We numerically integrate Eq. (6) with 4th
-rank coupling tensor Bmm′′′′Bnn′′′′ by the 4
th-order
Runge-Kutta method (RK-4). The two critical parameters of the computation are the maximum HG order mmax, at which the tensor is truncated, and the step size ∆z over the propagation distance z.
To estimate the truncation order mmax for each dimension, we recall that it is determined by the Gouy phase mismatch [the numerator in Eq. (9)]. When the mismatch reaches π, the coupling coefficient changes sign, i.e., switches from amplification to de-amplification. If this reversal occurs within the crystal, it means that the mode is outside of the crystal’s spatial
bandwidth and can be ignored. Thus, at m = m′ = mmax the mismatch should reach π at the end of the crystal:
( )1 max
max(2 1/ 2) tan / 2 ,R
R
m Lm L z
zπ−+ ≈ = (26)
which results in the truncation-order condition
2
0
max
( ).
p
pRk az
mL L
ππ= = (27)
The same condition can be obtained by noting that the spatial-frequency bandwidth of the
mmax-order HG function, which is approximately max 0
/ pm a , should be equal to the spatial
bandwidth of the crystal (πkp/L)1/2
[17]. For a PPKTP crystal with L = 2 cm, ns ≈np ≈1.78, free-space λp = 780 nm, and a0
p = 100 µm, Eq. (27) yields mmax = 22.5, which we have
confirmed by observing the sufficient decay of the Green’s function versus (m + m′) at this index value. To provide additional accuracy margin, we use mmax = 32 for these PSA parameters. For a circular pump spot size, the x- and y-dimensions require 32 modes each.
As the pump waist increases, Eq. (27) demands significant increase in the number of considered modes in both the x- and y-dimensions, proportional to the square of the corresponding waist radii:
2
2 2
max max 0 02( ) .
Rx Ry px y p p
x y
z z km n a a
LL
ππ
= =
(28)
Thus, for a0p = 200 µm we need to use mmax = 128, i.e., mmax that is 4 times greater than
that for a0p = 100 µm. Thus, for a 200-µm circular pump waist, Eq. (24) requires
diagonalization of a tensor consisting of 2×2×(128×128)×(128×128) = 230
elements (only quarter of which are non-zero), leading to multi-gigabyte memory requirements for the computer. This unfortunately fast scaling with pump waist size takes place because our choice
#155158 - $15.00 USD Received 22 Sep 2011; revised 23 Nov 2011; accepted 28 Nov 2011; published 14 Dec 2011(C) 2011 OSA 19 December 2011 / Vol. 19, No. 27 / OPTICS EXPRESS 26717
of the HG expansion basis for the signal is not optimal. More specifically, in order to eliminate the beam curvature from the overlap integral, the signal waist of the expansion basis has been chosen to be 2
1/2 times greater than the pump’s, whereas all the interesting dynamics
takes place on a smaller transverse scale that varies between the inverse spatial bandwidth of the crystal on the low end and the pump waist size on the high end. The number of independently amplified (or squeezed) PSA modes can be estimated by the product of the pump beam area and the square of the crystal’s spatial bandwidth [17, 33]:
0 0mod ,Rx Ryp p p
x y
z zkNumber of PSA es a a
L L
ππ= = (29)
which is square root of the number of modes required for computation by Eq. (28). Significant potential computational memory savings [reduction of m
xmaxn
ymax down to the value given by
Eq. (29)] can be achieved by using a different HG expansion basis for the signal, that with a beam waist in the vicinity of the geometric average of the pump waist and the inverse spatial bandwidth of the crystal [34], as was previously discussed in the context of temporal modes [35]. These savings, however, are achieved at the expense of a considerably more demanding computation of the coupling coefficients at every z-step, and have not been attempted in the present work.
The estimation of the step size ∆z can be done by demanding both the coefficients Bmm′ and the solution to not change much over one step. The fastest variation in the coupling coefficients comes from the Gouy phase mismatch for the maximum order mmax, and we
require this phase to change over one step by no more than π/150 ≈0.02 rad:
max max(2 1/ 2) 2 ,150
R R
z zm m
z z
π∆ ∆+ ≈ ≤ (30)
which leads to the step size that is independent of the pump waist radius:
max
.300 300
Rz Lz
m
π∆ ≤ = (31)
The second requirement on variation of the solution over one step can be met by requiring the magnitude of the most amplified eigenmode to change by no more than 2% (0.086 dB) over one step, which means that the step size given by Eq. (31) meets this requirement up to
the gain of ≈300 × 0.086 dB = 25.8 dB for the most amplified mode.
4. Results and discussion
Using the approach discussed in Sections 2.1 and 2.3, we have numerically generated the Green’s functions of Eq. (6) in the HG representation and obtained the PSA eigenmodes for various pump powers P0 and spot sizes a0px × a0py for a PPKTP crystal of length L = 2 cm, deff
= 8.7 pm/V, ns ≈np ≈1.78, and signal wavelength of 1560 nm. For pump spot sizes of 100×100 µm
2 and smaller (100×50, 100×25, and 25×25 µm
2) we have used 32×32 HG functions (i.e.,
mxmax = n
ymax = 32) as the signal expansion basis. For pump waists larger than 100 µm, we
have increased the truncation order according to Eq. (28); e.g., for 400×100 µm2 pump spot
size we have used 512×32 expansion basis. For 100×100 µm2 pump spot size, the Rayleigh
range equals zR = kp(a0p)
2 ≈143 mm, i.e., it is ~7 times longer than the crystal.
In the first set of results, whose eigenvalue spectra are shown in Fig. 2, we have chosen the pump powers such that the gains (which are also the same as the squeezing factors) of the most amplified (fundamental) eigenmode for each spot size are approximately the same and equal to 15 (or 11.8 dB). These powers are shown in Fig. 3(b) and also listed in the legends of Figs. 4, 5. From Fig. 2 one can see that the number of modes amplified by the PSA grows with the pump spot size. For circular pump waists, some eigenvalues are degenerate, whereas
#155158 - $15.00 USD Received 22 Sep 2011; revised 23 Nov 2011; accepted 28 Nov 2011; published 14 Dec 2011(C) 2011 OSA 19 December 2011 / Vol. 19, No. 27 / OPTICS EXPRESS 26718
for elliptical waists the degeneracy is lifted. The smallest pump spot size (25×25 µm2) seems
to support the amplification of only the fundamental mode. In the second set of results, whose eigenvalue spectra are shown in Fig. 3(a), we have
adjusted the pump powers so that the peak intensity of the pump for all spot sizes is the same as that in the 100×100 µm
2 case of the first set of results, i.e., the pump power is scaled
proportionally to the beam area. The spectra shown in Fig. 3(a) indicate that, under the constant intensity condition, the gain of the fundamental eigenmode decreases with decreasing spot size. This point is further illustrated in Fig. 3(b) (red), which shows the gain, at constant pump intensity, as a function of the spot size a0px × a0py. In the same Fig. 3(b), we also plot the pump powers (blue) needed to achieve the fundamental-mode gain of ~15, as in the first set of data. The fact that this dependence is not linear indicates that higher intensity is required to achieve the same gain for the fundamental eigenmode when the tightly focused
pump size starts to approach the inverse spatial bandwidth of the crystal (L/πkp)1/2
≈21 µm.
0123456789
10111213141516
0 5 10 15Eigenmode index
Ga
in o
r sq
ue
ezin
g (
line
ar
sca
le)
i 800x50400x100200x200100x100100x50100x2525x25
a)
0
1
2
3
4
5
6
7
8
9
10
11
12
0 20 40 60 80 100Eigenmode index
PS
A g
ain
or
sq
ue
ezin
g (
dB
) i 800x50
400x100
200x200
100x100
25x25
b)
Fig. 2. Eigenvalue (gain and squeezing) spectra for the first 16 (a) and the first 101 (b) PSA modes. The vertical scale is linear in (a) and logarithmic in (b). The legend indicates the pump spot sizes. The horizontal dashed black line in (a) marks the –3-dB level from the gain of the fundamental eigenmode #0. The pump powers are chosen in each case to achieve approximately the same gain of ~15 for mode #0.
0
2
4
6
8
10
12
14
16
0 5 10 15 20 25
Eigenmode index
Gain
or
squeezin
g (
linear
scale
)
100x100
100x50
100x25
25x25
a)
0
3
6
9
12
15
18
0 2500 5000 7500 10000
Beam area / π (µm2)
Ga
in a
t I
0=
4x10
6 W
/cm
2
0.00
0.25
0.50
0.75
1.00
1.25
1.50
Po
we
r P
0 f
or
GP
SA=
15
(kW
)
Gain
Power
b)
Fig. 3. (a) Eigenvalue spectra for the second data set, where the pump powers are chosen to provide the same peak intensity as that in the 100 × 100 µm2 case. (b) Blue circles: pump power needed for the PSA gain of ~15 for mode #0 in Fig. 2(a), as a function of the pump spot size a0px × a0py. Red triangles: PSA gain of mode #0 for the four spot sizes in (a). Blue dashed line: linear power dependence (guide for the reader’s eyes).
All the remaining Figs. 4–9 present results from the first set of data (i.e., where the pump powers are adjusted to produce the same gain of ~15 for the fundamental eigenmode). Figures 4 and 5 show the (x,y) representation of the first few computed eigenmodes (i.e., the spatial profiles of their intensity), whereas Figs. 6–9 show the HG representation of these eigenmodes (i.e., |Amn|
2). The inset in Fig. 4 also shows the number of modes with gains
#155158 - $15.00 USD Received 22 Sep 2011; revised 23 Nov 2011; accepted 28 Nov 2011; published 14 Dec 2011(C) 2011 OSA 19 December 2011 / Vol. 19, No. 27 / OPTICS EXPRESS 26719
within 3 dB of the gain of the fundamental eigenmode [i.e., the number of modes above the dashed black line in Fig. 2(a)] as a function of the pump power, exhibiting roughly linear dependence with the inverse slope of ~690 W / mode, which can be considered as the power efficiency of the PSA under consideration. The large required pump power justifies the use of the undepleted pump approximation in Eq. (1) for input signal powers up to ~1 W (i.e., as long as the amplified signal is much weaker than the pump).
25×25 µm2, P0=0.29 kW
100×25 µm2, P0=0.6 kW
#2#0 #1 #3
#2
#0
#1
#3
#4
#5
100×50 µm2
P0=0.78 kW
#2
#0
#1
#3
#4
#5
#6
#7
#8
0 1
100×100 µm2, P0=1.25 kW
#0
#1
#2
#3
#4
#5
#6
#7
#8
#9
#10
#11
#13
#14
#12
#0
#1
#2
#3
#4
#5
#6
#7
#8
#9
#10
#11
#12
#13
#14
200×200 µm2, P0=4.06 kW
0
1
2
3
4
5
6
7
8
9
10
0 1 2 3 4 5
Power (kW)
# o
f am
plif
ied m
odes a
t -3
dB
200 µm
Fig. 4. xy-profiles of the few most prominent eigenmodes of the PSA for five different pump spot sizes. The distance scale is shown below the profile of mode #0 for the 200 × 200 µm2 case. The inset graph shows the number of well-amplified PSA modes [those with gains above the –3-dB line in Fig. 2(a)] versus the pump power.
From Figs. 4–9, one can make two main observations: 1) the fundamental eigenmode always exhibits a TEM00-like single-lobe (x,y) shape, even though its HG representation consists of a superposition of many modes (except in the 25×25 µm
2 case, for which almost
no HG modes other than the TEM00 are present); 2) although at small pump spot sizes the higher-order eigenmodes have complicated (x,y) shapes, at spot sizes of 100×100 µm
2 and
larger the eigenmodes’ amplitude and phase profiles, at least qualitatively, resemble those of the HG modes TEMmn (for elliptical pump waists) or the LG modes (for circular pump waists). We discuss these two observations separately below.
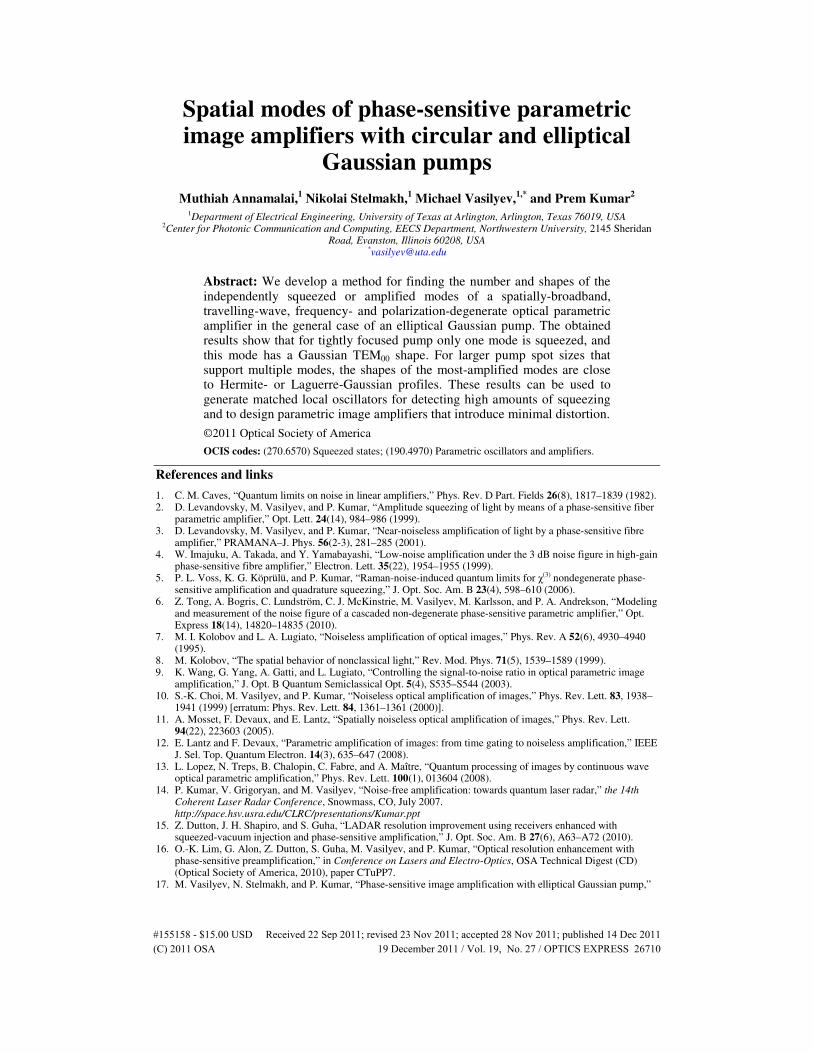
The first observation is further illustrated in Fig. 6, which shows the PSA’s fundamental eigenmode #0 in the HG representation for various pump spot sizes. The overlap of this mode with the TEM00 mode of our HG basis is 97% for the 25×25 µm
2, 61% for the 100×25 µm
2,
50% for the 100×50 µm2, 35% for the 100×100 µm
2, 16.2% for the 800×50 µm
2, 16.1% for
the 400×100 µm2, and 15.7% for the 200×200 µm
2 pump spot sizes. Thus, even though the
eigenmode #0 is a single-lobe in all 7 cases, it requires a significant number of HG modes for its representation in all cases except the 25×25 µm
2 pump spot size. Higher-order eigenmodes
involve superpositions of even greater numbers of HG modes, as shown in Figs. 7–9. The second observation leads us to the conclusion that, for PSAs with pump spot sizes
large enough to support amplification of many eigenmodes, it should be possible to represent
#155158 - $15.00 USD Received 22 Sep 2011; revised 23 Nov 2011; accepted 28 Nov 2011; published 14 Dec 2011(C) 2011 OSA 19 December 2011 / Vol. 19, No. 27 / OPTICS EXPRESS 26720
each eigenmode by a superposition of just a few HG modes. The fact that our HG basis requires a great number of modes for representing the PSA eigenmodes simply indicates that it is not the optimal basis, as we have discussed in Section 3 after Eq. (28). We have recently obtained some preliminary results on finding the optimum (compact) basis for representation of the PSA modes [34], and the complete study of that will be the subject of a separate publication.
400×100 µm2, P0=4.3 kW
#0
#1
#2
#5
#6
#7
#8
#12
#13
#14
#9
#10
#11
#15
#16
#3
#4
#0
#1
#2
#3
#4
#5
#6
#7
#8
#9
#10
#11
#12
#13
#14
800×50 µm2, P0=5.4 kW
400 µm
Fig. 5. xy-profiles of the few most prominent eigenmodes of the PSA for the two largest elliptic pump spot sizes considered (800 × 50 and 400 × 100 µm2). The distance scale is shown above the profile of mode #0 for the 800 × 50 µm2 case and is the same as that in Fig. 4.
Let us also point out that for the 25×25 µm2 pump spot size, only the fundamental PSA
eigenmode #0 sees any significant gain, and this mode has 97% overlap with the TEM00 HG mode. This indicates that, in spite of gain-induced diffraction [20], for tightly focused pumps
or long crystals (zR / L ≈0.45 in this case) the crystal’s limited spatial bandwidth forces the PSA to produce squeezed vacuum in a single, well-defined fundamental Gaussian mode. This fact greatly simplifies mode matching of the local oscillator for subsequent homodyne detection and opens the possibilities for generation and observation of significant squeezing factors in such a regime of the PSA operation.
#155158 - $15.00 USD Received 22 Sep 2011; revised 23 Nov 2011; accepted 28 Nov 2011; published 14 Dec 2011(C) 2011 OSA 19 December 2011 / Vol. 19, No. 27 / OPTICS EXPRESS 26721
Fig. 6. Mode #0 in the HG representation (i.e., |Amn|2 for mode #0) for various pump spot sizes.
The gain for the PSA mode #0 is ~15 in all cases. The corresponding xy-profiles are shown in Fig. 4 (for all graphs in the top row and the first graph in the bottom row of the present Figure)
and in Fig. 5 (for the last two graphs in the bottom row of the present Figure).
05
1015
20
05
1015
0.00
0.05
0.10
0.15
0.20
0.25
0.30
0.35|A
mn|2
mn
05
1015
20
05
1015
0.00
0.01
0.02
0.03
0.04
0.05
0.06
0.07
0.08
0.09
|Am
n|2
mn
05
1015
20
05
1015
0.00
0.05
0.10
0.15
0.20
0.25
0.30
0.35
0.40
|Am
n|2
mn
05
1015
20
05
1015
0.00
0.01
0.02
0.03
0.04
0.05
0.06
0.07
0.08
0.09
|Am
n|2
mn
05
10
15
05
1015
0.00
0.05
0.10
0.15
0.20
0.25
0.30
0.35
0.40
|Am
n|2
mn
05
10
15
05
1015
0.00
0.02
0.04
0.06
0.08
0.10
0.12
|Am
n|2
mn
05
10
15
05
1015
0.00
0.02
0.04
0.06
0.08
0.10
0.12
0.14
0.16
0.18
|Am
n|2
mn
05
10
15
05
1015
0.00
0.05
0.10
0.15
0.20
0.25
0.30
0.35
0.40
|Am
n|2
mn#0 #1 #3 #5
#6 #8 #10 #12
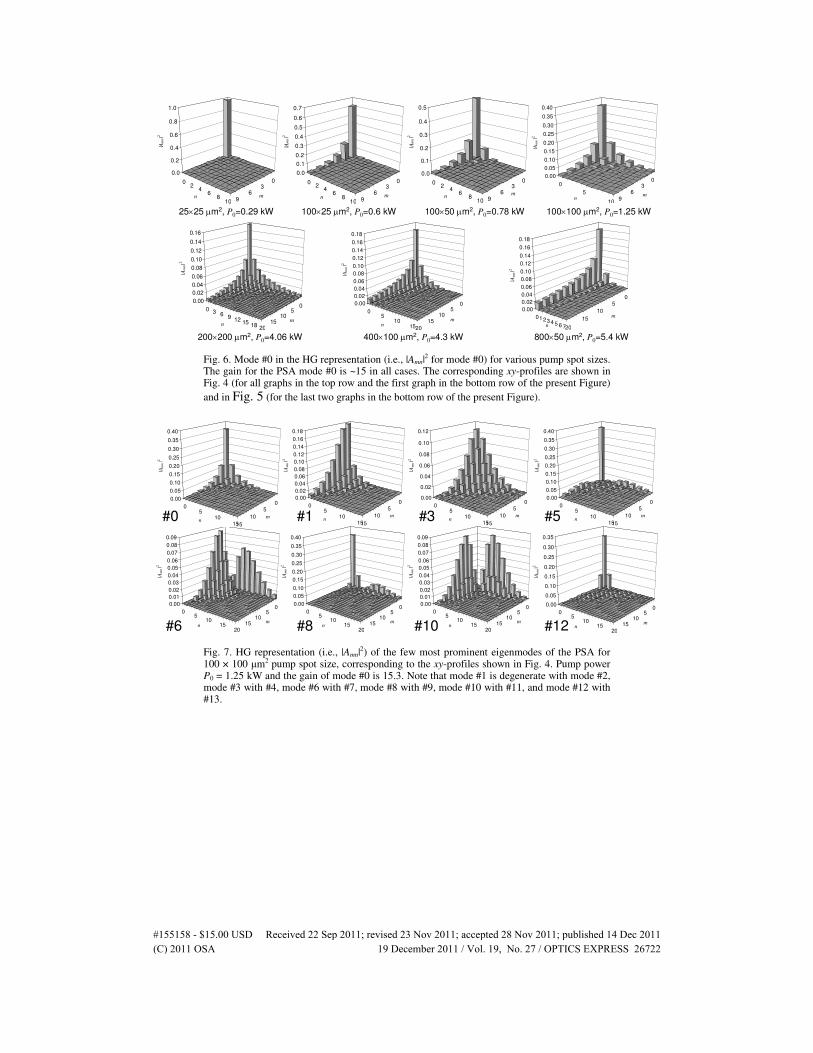
Fig. 7. HG representation (i.e., |Amn|2) of the few most prominent eigenmodes of the PSA for
100 × 100 µm2 pump spot size, corresponding to the xy-profiles shown in Fig. 4. Pump power P0 = 1.25 kW and the gain of mode #0 is 15.3. Note that mode #1 is degenerate with mode #2, mode #3 with #4, mode #6 with #7, mode #8 with #9, mode #10 with #11, and mode #12 with #13.
#155158 - $15.00 USD Received 22 Sep 2011; revised 23 Nov 2011; accepted 28 Nov 2011; published 14 Dec 2011(C) 2011 OSA 19 December 2011 / Vol. 19, No. 27 / OPTICS EXPRESS 26722
010
2030
40
010
2030
0.00
0.01
0.02
0.03
0.04
|Am
n|2
mn
010
2030
40
010
2030
0.000
0.002
0.004
0.006
0.008
0.010
0.012
|Am
n|2
mn
010
2030
40
010
2030
0.00
0.02
0.04
0.06
0.08
0.10
|Am
n|2
mn
010
2030
40
010
2030
0.000
0.005
0.010
0.015
0.020
|Am
n|2
mn
05
1015
20
0 3 6 9 12 1518
0.00
0.05
0.10
0.15
0.20
0.25
|Am
n|2
mn
010
20
30
010
20
0.000
0.002
0.004
0.006
0.008
0.010
0.012
0.014
|Am
n|2
mn
05
1015
20
0 3 6 9 12 1518
0.00
0.01
0.02
0.03
0.04
0.05
|Am
n|2
mn
05
1015
20
0 3 6 912 15
18
0.00
0.02
0.04
0.06
0.08
0.10
0.12
0.14
0.16
|Am
n|2
mn#0 #1 #3 #5
#6 #8 #10 #12
Fig. 8. HG representation (i.e., |Amn|2) of the few most prominent eigenmodes of the PSA for
200 × 200 µm2 pump spot size, corresponding to the xy-profiles shown in Fig. 4. Pump power P0 = 4.06 kW and the gain of mode #0 is 15.1. Note that mode #1 is degenerate with mode #2, mode #3 with #4, mode #6 with #7, mode #8 with #9, mode #10 with #11, and mode #12 with #13.
Fig. 9. HG representation (i.e., |Amn|2) of mode #14 for the four largest pump spot sizes studied.
Pump power for each spot size is chosen such that the gain for mode #0 is ~15. The corresponding xy-profiles are shown in Fig. 4 (for the left two graphs) and in Fig. 5 (for the right two graphs).
5. Conclusion
To summarize, we have developed and demonstrated an approach to rigorous calculation of the independently squeezed (or amplified) modes of the spatially-broadband PSA. While an order of magnitude estimate of the number of PSA modes is (pump waist × spatial bandwidth)
2, our rigorous method determines the exact number and the shapes of the PSA
modes supported by the pump beam of a given spot size. This method is the spatial version of the quantum Karhunen-Loève expansion [36] previously used in the temporal domain to study squeezing during quantum soliton propagation [32] and in four-wave-mixing processes [37] in optical fiber. The generated eigenmodes are the spatial analogs of the temporal “supermodes” found in optical parametric oscillators [38]. The PSA eigenmodes are also closely related to the Schmidt modes of spontaneous parametric down conversion [39], previously discussed in both temporal [40] and spatial [41] contexts: at very low PSA gains, the PSA modes correspond to frequency-degenerate transverse Schmidt modes.
The obtained results indicate that the PSA has two important regimes: a) when the pump is tightly focused (zR / L < 1), the limited spatial bandwidth forces the PSA to produce squeezing in a single, well-defined TEM00 Gaussian eigenmode; b) for larger pump spot sizes that support many PSA eigenmodes, the shapes of the most-amplified PSA modes are close to the first few Hermite-Gaussian (for elliptical pump waists) or Laguerre-Gaussian (for circular pump waists) modes. The exact amount of this resemblance (mode overlap) will be the subject of a separate study.
#155158 - $15.00 USD Received 22 Sep 2011; revised 23 Nov 2011; accepted 28 Nov 2011; published 14 Dec 2011(C) 2011 OSA 19 December 2011 / Vol. 19, No. 27 / OPTICS EXPRESS 26723
The mode-calculation procedure and the obtained eigenmode shapes are important for both squeezing (finding the maximally squeezed modes as well as maximizing the number of highly-squeezed modes) and noiseless-amplifier (boosting a faint image before detection) applications of the PSA. For the squeezing application, the mode shape gives the profile of the optimum matched local oscillator needed to measure the high-degree of quadrature noise suppression in a travelling-wave PSA. For the image-amplifier application, the optimum performance will be reached when the image modes are mapped onto the PSA eigenmodes, so that they can be amplified without cross-coupling to each other.
This material is based upon work funded by DARPA’s Quantum Sensor Program under AFRL Contract No. FA8750-09-C-0194. Any opinions, findings, conclusions or recommendations expressed in this material are those of the authors and do not necessarily reflect the views of DARPA or the U.S. Air Force.
#155158 - $15.00 USD Received 22 Sep 2011; revised 23 Nov 2011; accepted 28 Nov 2011; published 14 Dec 2011(C) 2011 OSA 19 December 2011 / Vol. 19, No. 27 / OPTICS EXPRESS 26724