Earth Sciences 2017; 6(2): 15-29 http://www.sciencepublishinggroup.com/j/earth doi: 10.11648/j.earth.20170602.12 ISSN: 2328-5974 (Print); ISSN: 2328-5982 (Online) Spatial –Temporal Analysis of Drought in Iran Using SPI During a Long - Term Period Sohaila Javanmard 1 , Mandana Emamhadi 1 , Javad BodaghJamali 2 , Ali Didehvarasl 1 1 Atmospheric Science and Meteorological Research Center (ASMERC), Tehran, I. R. of Iran 2 Environmental Engineering Faculty, University of Environment, Karaj, Iran Email address: [email protected] (S. Javanmard) To cite this article: Sohaila Javanmard, Mandana Emamhadi, Javad BodaghJamali, Ali Didehvarasl. Spatial –Temporal Analysis of Drought in Iran Using SPI During a Long - Term Period. Earth Sciences. Vol. 6, No. 2, 2017, pp. 15-29. doi: 10.11648/j.earth.20170602.12 Received: August 31, 2015; Accepted: September 21, 2015; Published: April 11, 2017 Abstract: This investigation represents temporal and spatial analysis of drought events over Iran for a 42 - year period (1963 - 2005). At first, the severity of drought occurrences over Iran has been identified using SPI (Standardized Precipitation Index) at various time scales (i.e., 3, 9, and 12 - month) for 50 synoptic stations. Then the spatial distribution of annual and seasonal drought severity using SPI - 12 months and SPI - 3 months respectively have been derived. Seasonal drought has been determined for spring, autumn, and winter using SPI - 3 months for May, Nov and Feb respectively. Maps of annual and seasonal drought showed occurrence of drought in most parts of Iran mostly in following years, 1985, 1990, 1998, 1999, 2000, and 2001. Based on the frequency of each drought severity category at different time scales (SPI - 3, 9, and 12 months), time series of number of stations experienced drought were derived. They showed that mild drought has been occurred continuously in about 85% - 95% of stations from 1998 through 2001 using SPI - 9 months and SPI - 12 months. But SPI - 3 months showed mostly 99% of stations were affected by drought continuously from 1998 through 2002. Finally, spatial distribution of each drought severity categories for different time - scales were derived. Keywords: Iran, Drought Monitoring, SPI, Spatial, Temporal, Analysis 1. Introduction Iran is located in the arid belt of the world so its climate is mostly arid or semi - arid, and very wet along the Caspian coast (Fig. 1). On the northern edge of the country (the Caspian coastal plain) temperatures nearly fall below freezing and remain humid for the rest of the year, summer temperatures rarely exceed 29˚C, and annual precipitation ranges from 400 to1300 mm. The Zagros Mountains basin experiences lower temperatures, sever winter, daily sub - freezing average temperatures, heavy snowfall, and the annual mean precipitation ranges from 200 to 400 mm in west of Iran. The eastern and central basins are arid and precipitation ranges from 50 to 200 mm and average summer temperatures exceed 38˚C. The coastal plains of the Persian Gulf and Oman Sea in the southern Iran have mild winters, and very humid and hot summers, the annual precipitation ranges from 50 mm in eastern part to 300 mm in west along the shore. It seems that the temporal and spatial distribution of precipitation in Iran is volatile, as 90% of total precipitation occurs in cold and humid seasons in northern and western parts of the country and only 10% occurs in warm and dry seasons in central, southern and eastern parts. About 52% of precipitation occurs in 25% of the country area (Fig. 2). Figure 1. Climatic classification of Iran using modified Domartan method.
Transcript
Earth Sciences 2017; 6(2): 15-29
http://www.sciencepublishinggroup.com/j/earth
doi: 10.11648/j.earth.20170602.12
ISSN: 2328-5974 (Print); ISSN: 2328-5982 (Online)
Spatial –Temporal Analysis of Drought in Iran Using SPI During a Long - Term Period
Sohaila Javanmard1, Mandana Emamhadi
1, Javad BodaghJamali
2, Ali Didehvarasl
1
1Atmospheric Science and Meteorological Research Center (ASMERC), Tehran, I. R. of Iran 2Environmental Engineering Faculty, University of Environment, Karaj, Iran
To cite this article: Sohaila Javanmard, Mandana Emamhadi, Javad BodaghJamali, Ali Didehvarasl. Spatial –Temporal Analysis of Drought in Iran Using SPI
During a Long - Term Period. Earth Sciences. Vol. 6, No. 2, 2017, pp. 15-29. doi: 10.11648/j.earth.20170602.12
Received: August 31, 2015; Accepted: September 21, 2015; Published: April 11, 2017
Abstract: This investigation represents temporal and spatial analysis of drought events over Iran for a 42 - year period (1963 -
2005). At first, the severity of drought occurrences over Iran has been identified using SPI (Standardized Precipitation Index) at
various time scales (i.e., 3, 9, and 12 - month) for 50 synoptic stations. Then the spatial distribution of annual and seasonal
drought severity using SPI - 12 months and SPI - 3 months respectively have been derived. Seasonal drought has been
determined for spring, autumn, and winter using SPI - 3 months for May, Nov and Feb respectively. Maps of annual and seasonal
drought showed occurrence of drought in most parts of Iran mostly in following years, 1985, 1990, 1998, 1999, 2000, and 2001.
Based on the frequency of each drought severity category at different time scales (SPI - 3, 9, and 12 months), time series of
number of stations experienced drought were derived. They showed that mild drought has been occurred continuously in about
85% - 95% of stations from 1998 through 2001 using SPI - 9 months and SPI - 12 months. But SPI - 3 months showed mostly
99% of stations were affected by drought continuously from 1998 through 2002. Finally, spatial distribution of each drought
severity categories for different time - scales were derived.
Figure 4. Long - term precipitation anomalies in 6 selected stations in different climate of Iran (a).Chahbahar, (b)Yazd, (c) Abadan, (d) Mashhad, (e) Tabriz, (f)
Babolsar.
Earth Sciences 2017; 6(2): 15-29 20
Table 3. Analysis of precipitation anomaly in some selected stations in different climate of Iran.
Station Climate Extremely dry years Last dry spell Considerable notes
Chahbahar (southeast) Extremely dry Most of years 1989~2005 1972, 1982, 1997 (Very wet years)
Mashhad station has experienced very dry condition in the
following years, 1951, 1966, 1970, 1975, 1984, 1990, 1994,
2000, 2001, and persistence of dry spell from 1999 through
2002.
Figure 4 (e) shows the precipitation anomaly in Tabriz
station. It shows very dry condition in the following years
1961, 1971, 1975, 1983, 1989, 1990, 1995 and persistence of
dry period from 1995 through 2005 except for 2002.
The anomaly of precipitation in Babolsar station has been
shown in figure 4 (f). It shows very dry condition in the
following years including 1952, 1961, 1966, 1970, 1985,
1991, 1998, 1999, 2001, 2005 and very wet condition from
2002 through 2004.
The above analysis has showed that in different climate of
Iran, the highest frequency of very severe drought has been
occurred in hyper - dry climate as well as wet climate of Iran
which is about 10 years among the period of study (Table 3).
Figure 5. Annual monitoring of drought using SPI 12 - month in Iran from 1985 to 2004.
21 Sohaila Javanmard et al.: Spatial –Temporal Analysis of Drought in Iran Using SPI During a Long - Term Period
Table 4. Analysis of annual monitoring of drought using SPI 12 - months.
Years Drought Wetness
Sever Moderate Sever Moderate
1985
Center (Ghom, Esfehan, Kavir),
Shahrud, Tabas, Iranshahr, Jask,
Abadan
Most of region Northwest
1986 Center Most of region
1987
South (Fars, South of Esfehan and
Yazd), Northwest of Kerman,
East, Zabol
Center, East, Southeast,
Southwest North, Northwest, Southeast
1988 Most of region except Center (Bam),
South (Zahedan)
1989 Northwest, NorthEast, East,
Center, Southwest (partly)
West, Southwest (partly), Northeast
(Shahrud, semnan, Babolsar), Southeast,
South (partly), East (Birjand)
1990 Extended from Northeast to
Southwest
Northwest, Center, Northeast,
East, South Southeast
1991 From East extended to center,
Southwest (Ahvaz, Abadan) Most of region
1992 Southwest (partly) Most of region
1993
Dispersed in some parts of
Southeast (Jask, Chabahar,
Zahedan)
Northwest Most of region
1994
Northeast, Centeral, South
(Omman Sea and Persian
Gulf)
Northwest, West North (along Caspian sea), Southwest,
Northeast, East, Southeast
1995
Northwest, most region of
Southern Caspian Sea coast, West,
Southwest which extended to
North center, West, most region of
Southern part of Caspian Sea
South part East,
1996 Northeast and Northwest
(dispersed in limited area) Most of region
1997 North Southeast and Southwest Most of region
1998
Northwest, West, some parts
of Center and South, some
dispersed with small area in
North and Southeast
Most of region
1999 Northwest, Southeast, South Most of region
2000 Chabahar, Jask Most of region Southern part of Caspian Sea
2001 Northeast, East, South which from
North to South intensified Most of region
2002 East, Southeast, South,
Central South, Southwest
2003 Southeast, South, Southwest North, Center which is extended to South
2004 Southeast Extended to from East South
like a narrow band
from Center to South wetness
intensified Most of region
Table 5. Temporal analysis of dry and wet years during long term period based on SPI 12 - month over Iran.
Moderate dry years Moderate wet years
1985 1986
1987 1988
1990 (sever) 1991 - 1993
1994 1996 - 1998
1995 (sever) 2003 - 2004
2001 (sever)
2000 - 2002
2004 (partly)
3.2. Annual Moniatoring of Drought Using SPI - 12 Months
In this section, the monthly precipitation data series of 50
synoptic stations during long term period (1985 - 2004) have
been gathered from data base centre of IRIMO. Then the
severity of drought occurrences over the above mentioned
stations have been identified using SPI at varying time scales
(i.e., 3, 9, and 12 - month). The annual monitoring of drought
using SPI 12 - month from 1985 to 2005 has been derived as
shown in figure 5. Spatial distribution of annual drought using
SPI - 12 months showed that drought has been extended in
most regions of country in the following years including 1990,
Earth Sciences 2017; 6(2): 15-29 22
1994, 2000, 2001. Summary of geographical distribution of
drought with different severity over Iran has been shown in
Table. 4. Since desirable results could not be achieved only by
temporal analysis of drought, in this section we consider some
selected years in which the most parts of the country have
been extremely influenced by drought or wet conditions.
Temporal analysis of dry and wet years during long term
period based on SPI 12 - month has been indicated in Table 5.
Spatial distribution of annual drought also shows that in early
21th
century drought condition has been dominant in most
parts of country from 2000 through 2002, but drought
condition has been shifted to wet condition in 2003. Some
parts of Iran experiences dry condition while the other parts
have been influenced by wet conditions in 2004.
3.3. Seasonal Monitoring of Drought Using SPI - 3 Month
The seasonal (spring, autumn and winter) monitoring of
drought has also been derived using SPI - 3 months for May,
Nov., and Feb. respectively. Figures 6 through 8 show maps of
spatial distribution of drought using SPI - 3 month for spring
(May), autumn (Nov.), and winter (Feb.) respectively for the
years when drought has been extended in most regions of the
country in 1990s. They demonstrated that the most regions of
country have experienced drought in spring of 1990, 2000,
2001, in autumn of 1998, 2001, 2003, and in winter of 1998,
1999, and, 2000. The summary of temporal analysis of
occurred drought with different severities based on SPI - 3
month for 3 seasons including spring, autumn, and winter
during long term period has been indicated in Table 6.
Figure 6. Seasonal drought monitoring using SPI 3 - month in Iran for autumn from 1985 to 2004.
23 Sohaila Javanmard et al.: Spatial –Temporal Analysis of Drought in Iran Using SPI During a Long - Term Period
Figure 7. Seasonal drought monitoring using SPI 3 - month in Iran for winter from 1985 to 2004.
Table 6. Summary of temporal analysis of occurred drought with different severities based on SPI - 3 months for 3 seasons, including spring, autumn, and winter
during long term period.
Drought severity
SPI - 3 months Severe Drought Mild drought wet Very wet
Spring
1985 1990 1987 1986
2000 2001 1993 - 95 1991, 1992
2004 (partly) 1997 - 99 1996
2002, 2003
2004 (partly)
Autumn
1990 1985 1987 1986
1992 1988 1994 1989
1995 1993 1998 1999
2003 1998 2000 2002
2001
Winter
1993 1985 1992 1986, 1987
1996 1988 1997 1989
1998, 1999 2004 1991
2000 2001
Earth Sciences 2017; 6(2): 15-29 24
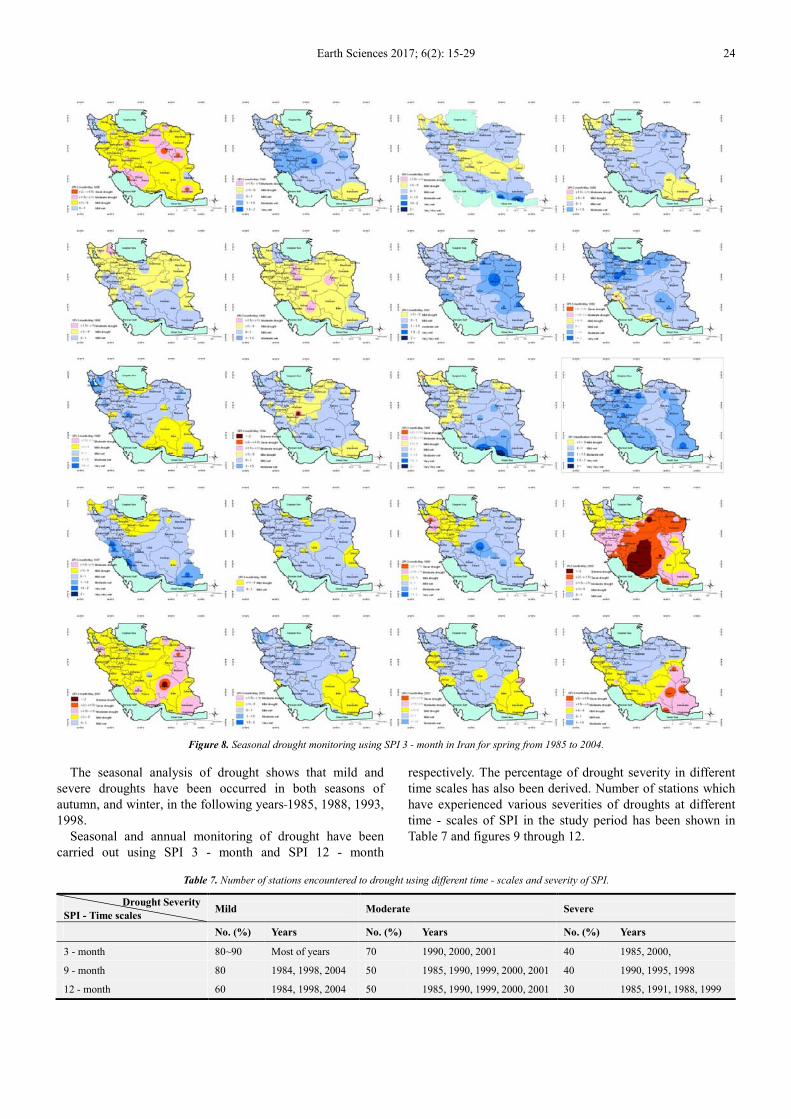
Figure 8. Seasonal drought monitoring using SPI 3 - month in Iran for spring from 1985 to 2004.
The seasonal analysis of drought shows that mild and
severe droughts have been occurred in both seasons of
autumn, and winter, in the following years 1985, 1988, 1993,
1998.
Seasonal and annual monitoring of drought have been
carried out using SPI 3 - month and SPI 12 - month
respectively. The percentage of drought severity in different
time scales has also been derived. Number of stations which
have experienced various severities of droughts at different
time - scales of SPI in the study period has been shown in
Table 7 and figures 9 through 12.
Table 7. Number of stations encountered to drought using different time - scales and severity of SPI.
Drought Severity
SPI - Time scales Mild Moderate Severe
No. (%) Years No. (%) Years No. (%) Years
3 - month 80~90 Most of years 70 1990, 2000, 2001 40 1985, 2000,
25 Sohaila Javanmard et al.: Spatial –Temporal Analysis of Drought in Iran Using SPI During a Long - Term Period
Figure 9. Number of stations experienced mild drought at SPI 3, 9, and 12 - month.
Figure 10. Number of stations experienced moderate drought at SPI 3, 9, and 12 - month.
Figure 11. Number of stations experienced severe drought at SPI 3, 9, and 12 - month.
Figure 12. Number of stations experienced very severe drought at SPI 3, 9, and 12 - month.
Mild Drought
We initially examined occurrences of mild droughts and
found that they tend to occur in nearly 2/3 of Iran`s whole area
over North - western, north, center and west of the country at
3 - month time scale. The percent of occurrence during long
term period is about 6 - 9% in most part of Iran. While the
Eastern and South - Eastern parts are characterized with the
lowest frequencies about 3 - 6% at the same temporal scale
(Figure 13). As the time scale increases to 9 - month; the
maximum occurrence of mild drought has been shifted to
Earth Sciences 2017; 6(2): 15-29 26
south - eastern and south - western of the country with 9 -
12%. Its average frequency occurrence has been extended to
the half of the country and the frequency of minimum drought
has been occurred in North - eastern and Northern of the
country with 6%. Occurrence of the 12 - month time scale of
SPI is nearly the same as 9 - month time scale but the
maximum frequency of spatial occurrence of drought has
been extended toward southern part of the country including
south - eastern, south - western, and southern regions about 9 -
11% (Table 8).
Figure 13. Mild Drought Occurrences at SPI 3, 9, and 12 - month time scale.
Figure 14. Moderate Drought Occurrences at SPI 3, 9, and 12 - month time scales.
Moderate Drought
Figure 14 shows that the frequency of occurrence of
moderate drought with 3 - month time - scale of SPI is about
30% - 35% in most area of the country but it is higher about
40% - 48% in north west and partly west. On the other hand, the
9 - month time scale of SPI also shows that frequency of
27 Sohaila Javanmard et al.: Spatial –Temporal Analysis of Drought in Iran Using SPI During a Long - Term Period
drought occurrence is about 28% - 33% and it is little higher
about 33% - 38% in northwest. Moreover, the 12 - month time -
scale also shows the occurrence of drought is about 29% - 36%
in the whole country but it is about 22% - 29% in southeast and
east. It could be concluded that most of country in different
time scales is about in minimum 22% - 33%, and in maximum
is about 29% - 48%. The moderate drought frequency through
the short time - scale has been considered higher, on the other
hand in the long time - scale it is found lower. The frequency of
drought occurrence is almost with the same value in most of the
country through different time - scales (Table 8).
Severe Drought
Figure 15 shows that the frequency of severe drought
occurrence with 3 - month time - scale is about 2.5% - 4.5%,
in nearly half of Iran except for southeastern part with 0.5% -
1.5%. The severe drought occurrence is about 2 - 4% in
majority of country which could be concluded that it doesn't
change at longer time - scales. The 9 - month and 12 - month
time - scales show the same manner, the severe drought has
been occurred in most of country about 2 - 4% (Table 8).
Figure 15. Severe Drought Occurrences at SPI 3, 9, and 12 - month time scales.
Figure 16. Very severe Drought Occurrences at SPI 3, 9, and 12 - month time scales.
Earth Sciences 2017; 6(2): 15-29 28
Very severe Drought
Figure 16 shows that very severe drought occurrences in
majority of country is about 2 - 6% with 3 - month time -
scale. Furthermore, this drought severity is about 4 - 9% with
9 - month, and about 6 - 9% with12 month time - scales. It
could be concluded that the frequency of very severe drought
occurrence is nearly about 5% in most of country in different
time scales (Table 8).
Table 8. Spatial analysis of drought (with different category and different time scale) during long term period (1963 - 2005).
Drought
Severity
SPI Time Scale
Mild Moderate Severe Very severe
Spatial
Extension
Frequency of
Occurrence
(%)
Spatial
Extension
Frequency of
Occurrence
(%)
Spatial
Extension
Frequency of
Occurrence
(%)
Spatial
Extension
Frequency of
Occurrence
(%)
3 - month
2/3 Area 6~9 Majority 30~35 1/2 Area 2.5~4.5
Majority 2~6 Southeast,
East 3~6
Northwest,
West 40~48 Southeast 0.5~1.5
9 - month
1/2 Area 6~9 Majority 28~33
Majority 2~4 Majority 4~9 Southeast,
Southwest 9~12 Northwest 33~38
12 - month
1/2 Area 5~8 Majority 29~36
Majority 2~4 Majority 6~9 Southeast,
Southwest 9~11
Southeast,
East 22~29
4. Conclusion and Discussions
The main aim of this investigation is identification of
temporal and spatial analysis of drought occurrences using
SPI - 3, 9, and 12 - month. At first, we have carried out the
long term precipitation anomalies over Iran. It showed that in
different climate of the country, the highest frequency of very
severe drought has been occurred in very extremely dry
climate as well as wet climate of Iran which is prolonged
about 10 years during the study period (42 years).
Then the severity of drought occurrences over Iran has been
identified using SPI (Standardized Precipitation Index) at
varying time scales (i.e., 3, 9, and 12 - month). The SPI has
been computed using monthly precipitation data of 153
synoptic stations for a long term period (1963 - 2005). The
temporal analysis of SPI 12 - month over Iran has been shown
that in early 20 century drought condition has been dominant
in most parts of country from 2000 to 2002, but the drought
condition has been shifted to wet condition in 2003; Some
parts of Iran experiences dry condition while the other parts
have been influenced by wet conditions in 2004.
The temporal analysis of drought using SPI 3 - month for
May, Nov., and Feb. has showed that mild and sever drought
has been occurred in both autumn and winter seasons, in the
following years, 1985, 1988, 1993, and 1998.
In the next step, drought occurrences in Iran have been
identified based on the frequency of the events which has been
occurred in 153 stations at different time scales (SPI - 3, 9, and
12 - month).
Then the frequencies were mapped to analyze their spatial
distribution using GIS software.
The above analysis has shown that mild drought has been
occurred in about 80 ~90% of stations using SPI 3 - month,
and the results of SPI 3, 9, 12 - month indicate moderate
drought has been occurred in about 50~70% of stations in the
following years, 1985, 1990, 1999, 2000, 2001, and 2005.
However, all time scales of SPI show that about 30~40% of
stations has been affected by sever drought in the following
years, 1985, 1988, 1990, 1991, 1995, 1998, 1999, and very
sever drought has been occurred in about 20~40% stations in
the years including 1984, 1998, 2000, and 2005.
References
[1] Abramowitz M, Stegun IA., 1965, Handbook of mathematical formulas, graphs, and mathematical tables. Dover Publications: New York.
[2] Bazrafshan O., 2007, Management and mapping drought hazard using standard precipitation Index (SPI) (case study: Golestan province), 2nd International Conference on Integrated Natural Disaster management, Tehran, Iran.
[3] Bodagh Jamali, J., S. Javanmard, R. Shirmo hammadi, 2002, Monitoring and mapping of drought condition in Khorasan province using standard precipitation index, Geographical Research, No. 67, 4 - 21.
[4] B. Çaldagi, L. Saylani, H. Torosi, S. Sirasi, and F. Bakano gullari, 2004, Drought analysis in Northwest Turkey, 2004. Agro Environ, Udine, Italy, 20 - 24 October 2004.
[5] Hagygat A., 2005, the SPI monitoring in Fars province, Drought report, I. R. of Iran Meteorological Organization, Tehran, Iran, (in Persian).
[6] Hedayati Dezfuli A., 2005, Analysis of droughts and its trends in Kohkiloe and Boyer Ahmad, Nivar, The Scientific & Technical Journal of IRIMO, No 58, 59, 73 - 94.
[7] Malekifard F., P. Rezazadeh, 2006, North Atlantic Oscillation (NAO) and its effects on temperature and precipitation over Northwest of Iran, I. R. of Iran Meteorological Organization, Tehran, Iran.
[8] Mathieu R. and Y. Richard, 2005, Intensity and spatial extent of droughts in southern Africa, Geophysical Research Letters, Vol. 32, L15702, doi: 10.1029/2005 GL 022436.
[9] McKee, T. B., N. J. Doesken and J. Kleist, 1993, the relationship of drought frequency and duration to time scales. 8th Conference of Applied Climatology, 179 - 184.
29 Sohaila Javanmard et al.: Spatial –Temporal Analysis of Drought in Iran Using SPI During a Long - Term Period
[10] NOAA Satellite and Information Service, 2008, National Climatic Data Center (NCDC), U. S. A., Climate monitoring, SPI.
[11] Raziei, T., Shokoohi, A., Saghafian, B., and Arasteh, P. D., 2002, Drought monitoring using SPI index in Yazd Province, 8th International Conference on understanding future dry land environment changes from past dynamics, Yazd, Iran.
[12] Samadi - neghab. S., 2005, Drought - forecasting by using downscaling method on GCM outputs, Journal of Geography and Rural Development, No. 8, pp: 193 - 212. Tehran, Iran.
[13] Seung - ki Min, Won - tae Kwon, E - hyung Park and Youngeun Choi. 2003, Spatial and temporal comparisons of droughts over Korea with East Asia. Int. J. of Climatology, 23, 223. DOI: 10.1002/joc. 872, Published online in Wiley Inter Science.
[14] Sevinc S., S. Zekai. 2001, Application of the standardized precipitation index (SPI) to the Marmara region, Turkey, Integrated Water Resources Management (Proceedings of a symposium held at Davis, California, April 2000), IAHS Pub, No. 272, pp. 291–296.
[15] URL 1, Drought assessment and mitigation in Southwest Asia: http//www. iwmi. cgiar. org.
[16] URL 2, National Drought Mitigation Center (NDMC), 2005, What is Drought: Drought Indices. http: //drought. unl. edu/whatis/indices. htm#swsi
[17] URL 3, National Drought Mitigation Center (NDMC), 2008, Drought monitoring, SPI.
[18] Vicente - Serrano S. M. and J. I. L´opez - Moreno, 2005, Hydrological response to different time scales of climatological drought, An evaluation of the Standardized Precipitation Index in a mountainous Mediterranean basin, Hydrology and Earth System Sciences, 9, 523–533, www. copernicus. org/EGU/hess/hess/9/523/SRef - ID: 1607 - 7938/hess/2005 - 9 - 523, European Geosciences Union.
[19] Zanvettor R., A. Ravelo, 2000, using the SPI to monitor the 1999–2000 drought in northeastern Argentina, Drought network News, A Newsletter of the International Drought Information Center and the National Drought Mitigation Center, Vol 12, No. 3.


![HANGING SCALES/CRANE SCALES - Aviga HFO 159 page 166 1020,-from € Hanging scales/Crane scales Lisa Mayer Product specialist Hanging scales/Crane scales Tel. +49 [0] 7433 9933 - 219](https://static.documents.pub/doc/80x56/5afd22507f8b9a68498c727e/hanging-scalescrane-scales-hfo-159-page-166-1020-from-hanging-scalescrane.jpg)


