Page 1
Spatial Variability of Flame Retardants in Indoor
Dust
Simona Jilková1, Lisa Melymuk1*, Šimon Vojta1, Pernilla
Bohlin-Nizzetto2, Martina Krátká1, Jana Klánová1
1 Research Centre for Toxic Compounds in the Environment (RECETOX)2 Norwegian Institute for Air Research (NILU)
Page 2
Project goals
2
1. Assess sampling techniques in
indoor environments
2. Understand the distribution of
SVOCs in indoor environments
What sampling techniques
(air, dust, surface wipes)
are most effective for
different compound
classes?
How can we achieve a balance
between representativity, ease of
sampling and practicality in large
screening indoor studies?
What is the spatial variability in
compounds within a room?
Are the different indoor matrices
(air, dust, surface films) in
equilibrium or having some
defined relationship?
Can we predict air concentrations
from indirect sampling? E.g., from
concentrations in another target
matrix?
Page 3
Sampling
• Active air sampling
(gas and particle
fractions,
particle-size
specific fractions)
• Passive air sampling
• Surface films/dusts:
windows wipes and
surface wipes
• Dusts: floor dusts
and bed dust
3
Page 4
Dust variability
• Variability between
matrices (exposed vs.
hidden vs. bed) is 20-
65%
• Variability within
matrices is ~90-100%
4
IMPLICATION:
• Individual dust samples show localized effects and may
not be representative of average room conditions
• Homogenized dust samples are more representative.
05
1015202530
BDE28
BDE47
BDE66
BDE100
BDE99
BDE85
BDE154
BDE153
BDE183
BDE209
Conc. (n
g/g
)
Bed Bed
Exposed floor Exposed floor
Hidden floor Hidden floor
Page 5
Predicting air concentrations from dust
• Weschler and Nazaroff, 2010 method
for predicting dust concentrations from air
Predicted air conc. =
(dust conc. x dust density)/(OM fraction x KOA)
5
Page 6
Air concentrations predicted from dust
6
y = 0.32xR² = 0.99
(0.75)
0
0.005
0.01
0.015
0.02
0.025
0 0.05 0.1
Pre
dic
ted a
ir c
onc.
(pg
/m3)
Measured air conc. (pg/m3)
OCPs
y = 1.6xR² = 0.87
0
0.02
0.04
0.06
0.08
0.1
0 0.05 0.1
Pre
dic
ted a
ir c
onc.
(pg
/m3)
Measured air conc. (pg/m3)
PCBs
y = 0.078xR² = 0.62
0
0.1
0.2
0.3
0.4
0 2 4 6
Pre
dic
ted
air
conc.
(pg
/m3)
Measured air conc. (pg/m3)
PBDEs
0
2
4
6
8
10
0 50 100
Pre
dic
ted a
ir c
onc.
(pg/m
3)
Measured air conc. (pg/m3)
NFRs
Page 7
Background and objectives
• Dust samples are frequently used indoors to (a) evaluate
presence and concentrations of flame retardants (FRs),
(b) identify sources, and/or (c) estimate human exposure
• A wide range of techniques are used to sample dust
(collection area, collection method, type of dust...) that
may not be comparable or representative.
• GOAL: assess the utility of dust for source
identification, for evaluating overall indoor
levels, and/or human exposure, and identify
what practices in dust collection are best suited
for different study goals.
7
Page 8
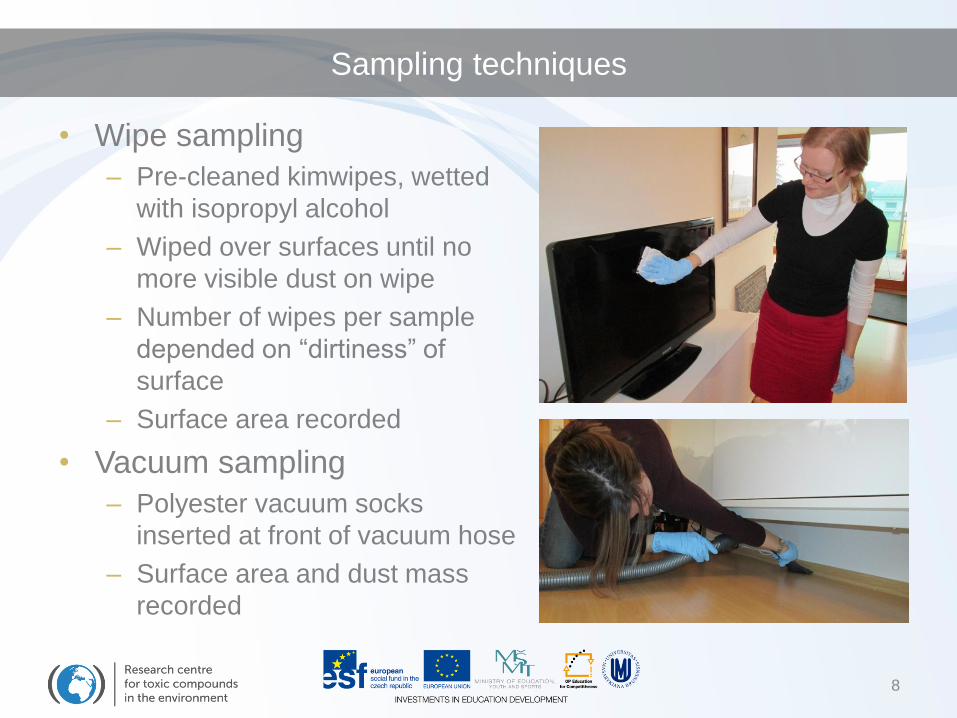
Sampling techniques
• Wipe sampling
– Pre-cleaned kimwipes, wetted
with isopropyl alcohol
– Wiped over surfaces until no
more visible dust on wipe
– Number of wipes per sample
depended on “dirtiness” of
surface
– Surface area recorded
• Vacuum sampling
– Polyester vacuum socks
inserted at front of vacuum hose
– Surface area and dust mass
recorded
8
Page 9
Study locations
• 3 rooms
– 1 residential (open concept
living room/dining room/
kitchen)
– 1 seminar room (classroom
with ~60 person capacity)
– 1 computer room (teaching
computer room with ~60
person capacity)
9
Page 10
Room layouts
Flat
Seminar
room
Computer
room
10
Page 11
Target compounds
19 halogenated FRs
• TBP-AE
• TBP-BAE
• TBP-DBPE
• TBX
• PBEB
• PBT
• HBB
• DBHCTD
• EH-TBB
• BEH-TEBP
• BTBPE
• syn-, anti-DDC-CO
• DDC-CO-MA
• DBDPE
• α-, β-,γ-, δ-DBE-DBCH
• α-, β-TBCO
• PBBZ
• TBCT
• PBBA
10 PBDE congeners
• BDE 28
• BDE 47
• BDE 66
• BDE 85
• BDE 99
• BDE 100
• BDE 153
• BDE 154
• BDE 183
• BDE 209
17 organophosphate FRs
• TIBP
• TNBP
• TCEP
• TCIPP
• DBPP
• BDPP
• TDCIPP
• TPHP
• EHDPP
• TBOEP
• CDP
• TEHP
• o-, m-, p-TMPP
• TIPPP
• TDMPP
• TDBPP
• TBPP
11
(Abbreviations from
Bergman et al. 2012)
Page 12
0%
10%
20%
30%
40%
50%
60%
70%
80%
90%
100%PBBATBCTPBBZb-TBCOa-TBCOg,d-DBE-DBCHb-DBE-DBCHa-DBE-DBCHDBDPEBEH-TEBPa-DDC-COs-DDC-COBTBPEEH-TBBDBHCTDHBBTBP-DBPEPBTPBEBDDC-CO-MATBXTBP-BAETBP-AE
HFRs - detection
Not detected:
TBX, DDC-CO-MA,
α- and β-TBCO,
TBCT, PBBA
Low levels:
TBP-AE, TBP-BAE,
PBEB, PBT, TBP-
DBPE, DBHCTD
Consistent detection, high levels:
α-, β-, γ- and δ-DBE-DBCH, DBDPE,
BEH-TEBP, syn- and anti-DDC-CO,
BTBPE, EH-TBB, HBB, PBBZ
12
Flat, wipes Flat,
dust
Sem
inar
rm,
dust
Sem
inar
rm,
wip
e
Com
p.
rm,
dust Computer rm,
wipes
Page 13
OPFRs - detection
0%
10%
20%
30%
40%
50%
60%
70%
80%
90%
100% TBPP
TDBPP
TDMPP
TIPPP
p-TMPP
m-TMPP
o-TMPP
TEHP
CDP
TBOEP
EHDPP
TPHP
TDCIPP
BDPP
DBPP
TCIPP
TCEP
TNBP
TIBP
All OPFRs
detected in flat, 14
of 19 detected in
seminar and
computer rooms
Low levels (always <5% of
ΣOPFRs): TIBP, TCEP, DBPP,
BDPP, TDCIPP, EHDPP,
TEHP, o-TMPP, p-TMPP, p-
TMPP, TIPPP, TDMPP,
TDBPP, TBPP
Consistent detection, high
levels:
TNBP, TPHP, TBOEP, CDP, and
especially TCIPP (avg. 70% of
ΣOPFRs)
13
Flat, wipes Flat,
dust
Sem
inar
rm,
wip
e
Com
p.
rm,
dust Computer rm,
wipes
Sem
inar
rm,
dust
Page 14
Summary of overall concentrations – floor dust
• What flame retardants are in average floor dust?
0
5000
10000
15000
20000
25000
30000
35000
40000
Flat Seminar room Computerroom
Av
g.
flo
or
du
st
co
nc.
(ng
/g)
OPFRs
HFRs
PBDEs
“Signal” of FRs dominated by OPFRs
0
5000
10000
15000
20000
25000
30000
35000
40000
Flat Seminarroom
Computerroom
Av
g.
flo
or
du
st
co
nc.
(ng
/g)
Other PBDEs
Other HFRs
Other OPFRs
DBDPE
TDCIPP
DDC-CO
TNBP
TCEP
BEH-TEBP
TPHP
EHDPP
BDE 209
CDP
TCIPP
TBOEP
Compounds with avg. >50 ng/g
14
Page 15
Summary of overall concentrations – surface wipes
• What flame retardants are on average surfaces?
0
1000
2000
3000
4000
5000
6000
Flat Seminarroom
Computerroom
Av
g.
wip
e c
on
c.
(ng
/m2)
OPFRs
HFRs
PBDEs
0
1000
2000
3000
4000
5000
6000
Flat Seminar room Computer room
Av
g.
wip
e c
on
c.
(ng
/m2)
Other PBDEs
Other HFRs
Other OPFRs
TBOEP
ΣTMPP
ΣDBE-DBCH
TPHP
BDE 209
TNBP
BEH-TEBP
CDP
TCIPP
•“Signal” of FRs dominated by OPFRs
• Higher conc. in flat due to choice of
surfaces – locations that are not often
cleaned therefore have large dust mass per
unit area
Compounds with avg. >10 ng/m2
15
Page 16
IN MORE DETAIL...
• PBDEs - link to sources in flat
• NFR source identification
• OPFR source identification
• Concentrations by mass vs. area
• Implications for sampling technique, future
work
16
Page 17
PBDEs – floor dust – by mass
Ranging over 3 orders of magnitude
Σ10PBDEs: 3.55 – 1382 ng/g
10PBDEs in floor dust
Flat
Sem
inar
room
Com
pute
r roo
m
0
500
1000
1500
Con
c.
(ng
/g)
9PBDEs in floor dust
Flat
Sem
inar
room
Com
pute
r roo
m
0
10
20
30
40
Co
nc.
(ng
/g)
BDE-209 - floor dust
Flat
Sem
inar
room
Com
pute
r roo
m
0
500
1000
1500
Co
nc.
(ng
/g)
Concentrations, spatial
differences driven by BDE-209
17
Page 18
Floor dust - PBDE Congener Distributions
Relatively consistent congener
profiles in seminar room and
computer room, >95% BDE-209
More variability
in all congeners,
and particularly
in BDE-209
•BDE-209
ranged from
78-98% of
ΣPBDEs
0%
10%
20%
30%
40%
50%
60%
70%
80%
90%
100%
Seminar room Computerroom
Flat
BDE 183
BDE 153
BDE 154
BDE 85
BDE 99
BDE 100
BDE 66
BDE 47
BDE 28
Fraction BDE-209
18
Page 19
BDE-209 distribution – relationship to sources
• BDE-209 source in electronics?
y = -0.05x + 1.03R² = 0.72
0.5
0.6
0.7
0.8
0.9
1
0 1 2 3 4 5
Fra
cti
on
of
BD
E-2
09
Distance from TV unit (m)
Contribution of BDE-209 to
Σ10PBDEs in floor dust decreases
with distance from TV unit
- Suggests electronics as source?
y = 0.01x + 0.61R² = 0.02
0
0.2
0.4
0.6
0.8
1
0 2 4 6
Fra
cti
on
of
BD
E-2
09
Distance from TV unit (m)
No such distribution observed in wipe samples
More variation in contribution of BDE-209
(87-97% in floor dust but 26-87% in wipes)
- Differences in sources to dust and surfaces?
- More or less mixing in one matrix than another?
19
Floor dust
Surface wipes
Page 20
Computer room vs. seminar room – BDE-209
• Same building materials, different room equipment
• Differences due to computers?
010203040506070
Seminarroom
Computerroom
Seminarroom
Computerroom
Floor dust Surfaces
BD
E-2
09
co
nc.
(ng
/m2)
0200400600800
10001200
Seminar room Computerroom
Floor dustBD
E-2
09
co
nc. (n
g/g
)
• Or just because the computer room is more dusty?
0
20
40
60
Du
st lo
ad
ing
(m
g/m
2)
Dust surfaceloading
Avg. per room
20
Page 21
Computer room vs. seminar room – other FRs
• If we see differences by mass and area, suggests
electronics as source...
0
0.5
1
1.5
2
Seminarroom
Computerroom
Seminarroom
Computerroom
Floor dust Surfaces
Conc.
(ng/m
2)
TIPPP
0
2
4
6
8
10
12
14
Seminarroom
Computerroom
Seminarroom
Computerroom
Floor dust Surfaces
Conc.
(ng/m
2)
TDCIPP
0
0.5
1
1.5
2
2.5
3
3.5
Seminarroom
Computerroom
Seminarroom
Computerroom
Floor dust Surfaces
Conc.
(ng/m
2)
TEHP
• But, in floor dust by mass, none of these compounds have a statistically
significant difference between seminar room and computer room
21
Page 22
Computer room vs. seminar room – other FRs
0
500
1000
1500
2000
2500
3000
3500
4000
Seminarroom
Computerroom
Seminarroom
Computerroom
Floor dust Surfaces
Conc.
(pg/m
2)
HBB
HBB is only FR with significant difference
between seminar room and computer
room.
Suggests electronics as source to
computer room.
No other FRs have a significant difference
in concentrations between computer room
and seminar room.
0
50
100
150
200
Seminar room avg. Computer room avg.
Conc.
(ng/g
)
HBBWhat hinders our ability to identify
differences?
• Complex influences on observed
concentrations: source differences, but
also differences in dust loading, room
use
22
Page 23
PBDEs – floor dust – area vs. mass
By mass: ranging over 3 orders of
magnitude
Σ10PBDEs: 3.55 – 1382 ng/g
By area: ranging over 4 orders of
magnitude
Σ10PBDEs: 0.04 – 82.1 ng/m2
10PBDEs in floor dust
Flat
Sem
inar
room
Com
pute
r roo
m
0
20
40
60
80
100
Co
nc.
(ng
/m2)
10PBDEs in floor dust
Flat
Sem
inar
room
Com
pute
r roo
m
0
500
1000
1500
Con
c.
(ng/g
)
- Potential source-related differences apparent in ng/g, but not by ng/m2
- Confounding factor of variable dust surface loading obscures source
differences
23
Σ10PBDEs in floor dust – ng/g Σ10PBDEs in floor dust – ng/m2
Page 24
Spatial variability in flat
24
Concentration
[ng/m2]
<0.1
0.1-0.5
0.5-1
1-5
5-10
10-50
50-100
100-500
ΣPBDEs
Concentration
[ng/m2]
0.5-1
1-5
5-10
10-50
50-100
100-500
500-1000
ΣNFRs
Page 25
Spatial variability in lecture rooms
25
Concentration
[ng/m2]
1-5
5-10
10-50
50-100
ΣNFRs in
computer
room
ΣNFRs in
seminar room
Concentration
[ng/m2]
0.05-0.1
0.1-0.5
0.5-1
1-5
5-10
10-50
Page 26
Implications for sampling – example – HFRs in floor dust
26
Averages
0
100
200
300
400
500
600
700
800
Seminar room avg Computer avg Flat avg
Conc.
(ng/g
)
PBBZ DBE-DBCH
DBDPE BEH-TEBP
DDC-CO BTBPE
EH-TBB DBHCTD
HBB TBP-DBPE
PBT TBP-BAE
TBP-AE
0
200
400
600
800
1000
1200
1400
1600
Seminar rm -low
Seminar rm -high
Computer rm -low
Computer rm -high
Flat - low Flat - high
Conc.
(ng/g
)
Highest and lowest conc.• Up to 1400x difference in
concentrations of HFRs within a given
room
• Typically individual HFRs range 6x
within 1 room
• Comparable to the range observed
between rooms
Page 27
27
0
200
400
600
800
1000
1200
1400
1600
Seminar rm -low
Seminar rm -high
Computer rm- low
Computer rm- high
Flat - low Flat - high
Conc.
(ng/g
)
PBBZ
DBE-DBCH
DBDPE
BEH-TEBP
DDC-CO
BTBPE
EH-TBB
DBHCTD
HBB
TBP-DBPE
PBT
TBP-BAE
TBP-AE
Page 28
Key challenges
• Different concentrations and compound profiles
are obtained from different areas in a room and
sample types – what is representative?
• When using surface wipe sampling on horizontal
surfaces, how to include influence of dust
loading per surface?
• What metric is most important for exposure –
ng/m2 or ng/g? – e.g., for child dust ingestion
28
Page 29
Acknowledgements
• Sampling assistance: Roman Prokeš
• Financial support from Czech Ministry of Education
(LM2011028 and LO1214), the European Social Fund
and state budget of the Czech Republic (projects
"Employment of Best Young Scientists for International
Cooperation Empowerment” CZ.1.07/2.3.00/30.0037 and
"Employment of Newly Graduated Doctors of Science for
Scientific Excellence" CZ.1.07/2.3.00/30.009).
29
Page 30
30
Lisa Melymuk
Research Centre for Toxic Compounds in the Environment
Masaryk University, Brno, Czech Republic
[email protected]
Page 31
Full compound list - HFRs
• TBP-AE – allyl 2,4,6-tribromophenyl ether (ATE)
• TBP-BAE - 2-bromoallyl-2,4,6-tribromophenyl ether (BATE)
• TBP-DBPE - 2,3-dibromopropyl-2,4,6-tribromophenyl ether (DPTE)
• TBX - 2,3,5,6-tetrabromo-p-xylene (pTBX)
• PBEB – pentabromoethylbenzene
• PBT - pentabromotoluene
• HBB – hexabromobenzene (HBBZ)
• DBHCTD - hexachlorocyclopentenyl-dibromocyclooctane (HCDBCO)
• EH-TBB - 2-ethylhexyl-2,3,4,5-tetrabromobenzoate
• BEH-TEBP - bis(2-ethlyhexyl)tetrabromophthalate (BEHTBP)
• BTBPE - 1,2-bis(2,4,6-tribromophenoxy)ethane
• syn-, anti-DDC-CO - Dechlorane Plus (DP)
• DDC-CO-MA – Dechlorane Plus mono adduct (DPMA)
• DBDPE – decabromodiphenylethane
• α-, β-,γ-, δ-DBE-DBCH – tetrabromoethylcyclohexane (TBECH)
• α-, β-TBCO - 1,2,5,6-tetrabromocyclooctane
• PBBZ - 1,2,3,4,5-pentabromobenzene
• TBCT - 3,4,5,6-tetrabromo-2-chlorotoluene
• PBBA - pentabromobenzyl acrylate
31
Page 32
Full compound list - OPFRs
• TIBP - tri-iso-butyl-phosphate
• TNBP - tri-n-butylphosphate
• TCEP - tris (2-chloroethyl) phosphate
• TCIPP - tris (1-chloro-2-propyl) phosphate (TCPP)
• DBPP - dibutylphenylphosphate
• BDPP - butyldiphenylphosphate
• TDCIPP - tris (1,3-dichloro-2-propyl) phosphate (TDCPP)
• TPHP - tri-phenyl phosphate
• EHDPP - 2-ethylhexyl diphenyl phosphate (2EHDPP)
• TBOEP - tris(2-butoxyethyl) phosphate (TBEP)
• CDP - cresyl diphenyl phosphate
• TEHP - tris(2-ethylhexyl)phosphate
• o-, m-, p-TMPP – tritolyl phosphate (ToTP, TmTP, TpTP)
• TIPPP - tris(2-isopropylphenyl)phosphate
• TDMPP - tris(3,5-dimethylphenyl)phosphate
• TDBPP - tris(2,3-dibromopropyl)phosphate
• TBPP - tris(4-tert-butylphenyl) phosphate (TpTBPP)
32
Page 33
Full analytical methods
• Prior to extraction, all samples were spiked with known amounts of recovery standards [8 13C12-
BDEs, 13C18-triphenyl phosphate, 13C-DBDPE, 13C-HBB, 13C-BTBPE, 13C-aDP, 13C-sDP, 13C-
PBBZ]. Kimwipes were extracted with 250 ml of dichloromethane using automated warm Soxhlet
extraction (Büchi B-811, Switzerland). Extracts were then concentrated to cca 2 ml and divided
into aliquotes. For analysis of PBDEs and other FRs, 70 % of the extract was cleaned-up using 5
g of H2SO4-modified silica column and eluted with 20 ml of dichloromethane. For analysis of
OPFRs, 30 % of the extract underwent non-destructive clean-up on non-modified activated silica
(5 g) column, topped with 1-2 cm of Na2SO4 and eluted with 20 ml of dichloromethane:acetone 3:7
(v:v). Both eluents were concentrated under gentle stream of N2 to final volume (50 µl for
destructive part and 1 ml for non-destructive part) and spiked with internal standard (13C12-BDE-
77).
• PBDEs and other FRs were analyzed on GC/HRMS consisting of Agilent 7890A GC coupled to
Autospec Premier MS (Waters, Micromass, UK), equipped with 15 m x 0.25 mm x 0.10 µm Rtx-
1614 (Restek, USA) capillary column. The MS was operated in EI+ SIM mode at the resolution
>10000. For BDE-209, the resolution was set to >5000. One µl of sample was injected in splitless
mode, using He as a carrier gas with initial constant flow of 1 ml/min, which changed to 1.4 ml/min
after 14th minute (PBDEs). For PBDEs inlet, GC/MS interface and ion source temperatures were
280, 280°C and 250 °C respectively. GC temperature programme was as follows: 80 °C (1 min
hold), then 20 °C/min to 250 °C, 1.5 °C/min 260 °C (2 min hold) and finally 25 °C/min to 320 °C
(4.5 min hold). For other FRs, inlet temperature was 250 °C and oven temperature programme
was: 80 °C (1 min hold), then 30 °C/min to 140 °C, 4°C/min to 175 °C, 8 °C/min to 270 and finally
15 °C/min to 325 °C (5 min hold).
33
Page 34
FRs in electronics – wipes from electronic surfaces
BDE-209?
• What fraction of conc. in wipes is reflecting components in electronics and what
from air/other dust in room?
BEH-TEBP, DBE-DBCH,
HBB, BTBPE?TCIPP, CDP?
0
2
4
6
8
10
12
14
16
Conc.
(ng/u
nit)
TBP-AE TBP-BAE TBP-DBPE
PBEB PBT HBB
DBHCTD EH-TBB BEH-TEBP
BTBPE ΣDDC-CO DBDPE
ΣDBE-DBCH PBBZ
0
2
4
6
8
10
12
Conc.
(ng/u
nit)
BDE 28 BDE 47 BDE 66
BDE 85 BDE 99 BDE 100
BDE 153 BDE 154 BDE 183
BDE 209
0
100
200
300
400
500
600
700
800
Conc.
(ng/u
nit)
TIBP TNBP TCEP TCIPP DBPP
BDPP TDCIPP TPHP EHDPP TBOEP
CDP TEHP ΣTMPP TIPPP TDMPP
TDBPP TBPP
34
Page 35
HFRs in floor dust
35
Page 36
OPFRs in floor dust
36
Page 37
BFRs in floor dust – by area
37
Page 38
HFRs in wipes
38
Conc. in flat dominate due to dusty surfaces.
Page 39
HFRs in wipes – excluding surfaces with long dust accumulation
39
Page 40
OPFRs in wipes
All surfaces:
Excluding those with long dust accumulation:
40