Oriental Geographer Vol. 58, No. 2, 2014 (Published in December 2017) SPATIOTEMPORAL VARIABILITY OF RAINFALL IN BANGLADESH: USING THIESSEN POLYGON AND SPLINE INTERPOLATION Md. Sofi Ullah * Anamik Ani Khan ** Md. Amran Hossain *** Abstract: The aim of the study is to analyze the rainfall variability of Bangladesh. Previous research gap has supported to develop the rationale and conceptual framework of the study. Sixty years (1953 to 2012) rainfall data were collected from Bangladesh Meteorological Department and then arranged in the tabular format to analyze rainfall variability using ArcGIS. Rainfall variability has been shown by using Thiessen polygon and Spline interpolation. Ten years interval has been used to shown climatic maps. Total 12 variability maps (6 from Thiessen polygon and 6 from Spline interpolation) have been analyzed. Data shows that north-western zone of Rajshahi division of Bangladesh is dry region due to the occurrence of low rainfall but north-eastern zone of Sylhet division, Bhola district and Coxs-Bazar district are facing high rainfall. The differences of rainfall pattern at spatial context in both Thiessen polygon and Spline interpolation have also been represented in this study. The annual rainfall pattern is irregular, where the increasing or decreasing trends are unique and the rainfall variability is high in Bangladesh. Keywords: GIS, Rainfall, Spline Interpolation, Thiessen Polygon, Zonal Statistics, Bangladesh INTRODUCTION Bangladesh is a small country in South Asia where the tropic of cancer line has just passed through middle portion of the country. The geographic location of Bangladesh has strong influence on climate and leads equatorial monsoon climate (Rashid, 1991; Islam, 2009). This climatic factor is indicating rainfall intensity in rainy season and * Md. Sofi Ullah, Associate Professor, Department of Geography and Environment, University of Dhaka, Dhaka 1000, Bangladesh ** Anamik Ani Khan, Officer-GIS, Helen Keller International, Dhaka 1212, Bangladesh *** Md. Amran Hossain, Cartographer, Department of Geography and Environment, University of Dhaka, Dhaka 1000, Bangladesh
Transcript
Oriental Geographer Vol. 58, No. 2, 2014 (Published in December 2017)
SPATIOTEMPORAL VARIABILITY OF RAINFALL IN BANGLADESH: USING THIESSEN POLYGON AND
SPLINE INTERPOLATION
Md. Sofi Ullah* Anamik Ani Khan**
Md. Amran Hossain***
Abstract: The aim of the study is to analyze the rainfall variability of Bangladesh. Previous research gap has supported to develop the rationale and conceptual framework of the study. Sixty years (1953 to 2012) rainfall data were collected from Bangladesh Meteorological Department and then arranged in the tabular format to analyze rainfall variability using ArcGIS. Rainfall variability has been shown by using Thiessen polygon and Spline interpolation. Ten years interval has been used to shown climatic maps. Total 12 variability maps (6 from Thiessen polygon and 6 from Spline interpolation) have been analyzed. Data shows that north-western zone of Rajshahi division of Bangladesh is dry region due to the occurrence of low rainfall but north-eastern zone of Sylhet division, Bhola district and Coxs-Bazar district are facing high rainfall. The differences of rainfall pattern at spatial context in both Thiessen polygon and Spline interpolation have also been represented in this study. The annual rainfall pattern is irregular, where the increasing or decreasing trends are unique and the rainfall variability is high in Bangladesh.
Bangladesh is a small country in South Asia where the tropic of cancer line has just passed through middle portion of the country. The geographic location of Bangladesh has strong influence on climate and leads equatorial monsoon climate (Rashid, 1991; Islam, 2009). This climatic factor is indicating rainfall intensity in rainy season and
*Md. Sofi Ullah, Associate Professor, Department of Geography and Environment, University
of Dhaka, Dhaka 1000, Bangladesh ** Anamik Ani Khan, Officer-GIS, Helen Keller International, Dhaka 1212, Bangladesh ***Md. Amran Hossain, Cartographer, Department of Geography and Environment, University
of Dhaka, Dhaka 1000, Bangladesh
92 ORIENTAL GEOGRAPHER
dry winter. The climate of Bangladesh is also influenced by the presence of Himalayan Mountain range (IPCC, 2007). Wind moves two opposite directions in different seasons. There are six seasons found in Bangladesh but this area is identified as hot and humid climatic region (BBS, 2005a). Wind can flow from south to north in summer and rainy season but winter experiences totally opposite movement of wind from north to south (Rashid, 1991). Summer monsoons air contains vast water vapor from Bay of Bengal that leads much rainfall in rainy season (Wang and Ho, 2002; BBS, 2005a). The winter climate is very attractive in Bangladesh, for the cause of its geographical location. The Himalayan Mountain surrounded Bangladesh from its northern part which causes interruption of cold air circulation in Bangladesh. Bangladesh has faced approximately 250 to 350 cm rainfall within a year (Islam, 2009). According to the scientists this amount of rainfall is adequate and it helps to grow plants and crops in this country. In consequence of it, Bangladesh has achieved self-sufficiency in agricultural economy and agricultural production (BBS, 2005b). Moreover, about 80 percent of the people of Bangladesh have directly or indirectly linked with agriculture (Rashid, 1991; BBS, 2005b). Water is the source of all kinds of life; overall Bangladesh has no water scarcity except Rajshahi district. Adequate water supply in this country has made the country well vegetative in the world (IPCC, 2007). The presence of tropical rainforests and mangrove forests in Bangladesh cause adequate supply of water by rainfall and river flows (Rashid, 1991; BBS, 2005a). Geographic Information System (GIS) and remote sensing are sophisticated tools to analyze all kinds of geographical, environmental and climatic conditions of the earth surface. These tools are considered to analyze spatiotemporal variability of rainfall in Bangladesh.
The rationale of the study indicates to analyze the rainfall variability of Bangladesh using GIS which has portrayed actual scenarios of rainfall that can easily be understood by its readers. The analysis of rainfall variability using GIS were focused in various studies which have been reviewed by the researchers, but these kinds of analysis were very limited or still not enough (BBS, 2005b; BBS, 2005a; IPCC, 2007; Islam, 2009). Bangladesh Meteorological Department (BMD) maintains all kinds of tabular data related with temperature and rainfall for its stations (Meteorological Stations). Most of the previously conducted researchers have focused only on tabular and graphical relationship of rainfall data (Wang and Ho, 2002; BBS, 2005a). The various studies of spatiotemporal rainfall variability in Bangladesh has been conducted by using different statistical and cartographic techniques, but the use of sophisticated tools like GIS and remote sensing are missing, which indicates a research gap here. On the other hand, most of the previously conducted research used only 30 to 40 years meteorological data. Considering 60 years meteorological data in a study can be a milestone, which was a gap in the previous research. The present
SPATIOTEMPORAL VARIABILITY OF RAINFALL IN BANGLADESH: 93
research has tried to consider filling up the gap of the previous research on rainfall variability in Bangladesh by applying GIS tools and techniques appropriately and also temporal aspects. The problem statement indicates to find out proper tools and techniques of GIS to analyze rainfall variability of Bangladesh which is a challenge for the researchers of this study. This research has significance for geographers, environmentalists, national policy makers and so on.
LITERATURE REVIEW
Previous research findings on rainfall variability of Bangladesh and applications of GIS to analyze rainfall and climatic situation in different studies have also been reviewed. Dore (2005) has analyzed global precipitation pattern by applying GIS where multiple methods were applied to represent different decade’s precipitation maps. Dore (2005) has also tried to correlate precipitation variability climate change. IPCC (2007) indicates that the precipitation pattern at different regions of the world is changing due to climate change. IPCC has used an excellent GIS technique to represent the precipitation maps of different regions of the world (IPCC, 2007). Shaw (2012) has stated that water, communities and disasters are inter-linked where major water sources have represented from rainfall and provided valuable information about disasters of Bangladesh. This study was based on qualitative analysis; basically it is a shallow type analysis of rainfall of Bangladesh without applying any GIS or advanced tools. The linkage of water supply through stream flow and rainfall can influence community and society to mitigate local disasters (Shaw, 2012). Tveito and Schoner (2002) have applied spatial interpolation to analyze climatic data; which ensure advanced application of GIS and represented in form of climatic and meteorological presentations. Anuforom (2004) has used Thiessen polygon method to analyze and represent rainfall variability of Nigeria. Daly et al, (2004) have prepared monthly climate maps of USA using advanced GIS and cartographic techniques, which represent applied climatological features of USA. Ayanlade (2009) has analyzed Guinea Savanna seasonal rainfall variability using GIS Spline interpolation method to represent rainfall variability and climate change. Bollen and Van de Sompel (2006) have developed the mapping structure or layout to ensure map title, legend, north line, proper spatial reference or grid and research target based spatial features by using GIS tools and techniques. Sabir et al, (2010) have used Spline interpolation method for estimating the problem peak with time lags. Liu and Rousseau (2011) have shown GIS Spline technique for discrete data representation in map, they also showed the process of creating dynamic information from spatiotemporal data. Liu and Rousseau (2012) have shown the use of Spline interpolation of GIS to represent functional
94 ORIENTAL GEOGRAPHER
fitting of discrete data for climate, regional planning, rainfall and land use management.
Rashid (1991) has stated that Bangladesh lies at hot and humid climatic region which indicates adequate rainfall in this country. He also indicates Bangladesh faces 200 to 300 cm rainfall each year which is sufficient for healthy plant growth and effective for land cultivation (Rashid, 1991). Wang and Ho (2002) have analyzed seasonal variability of rain in Asia where summer monsoon periods are given top priority. The authors also argue that Bangladesh and eastern part of India are facing tropical monsoon climate and faces extreme rainfall (Wang and Ho, 2002). BBS (2005a) has represented rainfall is significant compendium of environment of Bangladesh where total agricultural system depends on rainfall. Seasonal rainfall is the determinant for agricultural production like rice, wheat, crops and other main food grain of Bangladesh (BBS, 2005a). BBS (2005b) has stated that average rainfall from 1995 to 2004 was about 300 cm per year and which is very helpful for agricultural production in Bangladesh. About 300 cm rainfall per year also has a continuous trend in Bangladesh, this trend has sustain in 1998, 1999 and 2000 and helps to grow more agricultural production and mitigate food security in Bangladesh (BBS, 2005b). If this progress can continue in agricultural sector then Bangladesh can be able to overcome the present food crisis within 10 to 15 years in Bangladesh (BBS, 2005b). Islam (2009) has analyzed rainfall and temperature of Bangladesh with the help of tools from GIS. Both temperature and rainfall output has represented at tabular format, and also geographical representation with maps layout and isotherm was presented (Islam, 2009)
METHODOLOGY
ArcGIS Thiessen polygon and Spline interpolation methods were used to analyze spatial variability of rainfall of Bangladesh, as well as quantitative techniques were also applied to analyze temporal pattern of rainfall in Bangladesh. Research methodology is the heart of research that can indicate research conducting way to follow scientific investigation process (Saunders et al, 2009; Clifford et al, 2010). Research philosophies are helping to develop problem statement of the research for demarking that the researchers are going to do (Maxwell et al, 2009; Wilson, 2010; Creswell, 2014). This research follows realism research philosophy for representing real context of rainfall of Bangladesh over 60 years from 1953 to 2012. This research also followed deductive research technique because many researchers have conducted research on rainfall analysis of Bangladesh in previous studies with this technique. The research strategy is indicating several methods those are applied by the
SPATIOTEMPORAL VARIABILITY OF RAINFALL IN BANGLADESH: 95
researchers for developing critical analysis (Kothari, 2009; Clifford et al, 2010). Sixty years climatic data has been collected from Bangladesh Meteorological Department (BMD) and secondary data has been collected from different books, journals. Raw data has been arranged in tabular format. The tabulated rainfall data have spatial reference with 35 meteorological stations, therefore, rainfall surface were interpolated in ArcGIS for generating zonal statistics of Bangladesh. Finally, district wise (64 districts) zonal statistics of rainfall has been created for Bangladesh. Thus, rainfall variability maps were produced for the periods of ten years average in Thiessen polygon and Spline interpolation methods. The methodological output of both Thiessen polygon and Spline interpolation are given in the figure 1 for the period of 1953 to 1962 as an example.
Source: BMD, 2013
1. (a) Thiessen polygon output
Source: BMD, 2013
1. (b) Spline interpolation output
Figure 1: The methodological view of Thiessen polygon and Spline interpolation output of 1953 to 1962 rainfall map of Bangladesh
Figure 1 represents the basic analysis techniques of Thiessen polygon and Spline interpolation method. In the Thiessen polygon method total 6 rainfall variability maps were developed and another 6 rainfall maps were developed in Spline interpolation
96 ORIENTAL GEOGRAPHER
method to shows rainfall spatiotemporal variability in Bangladesh as a ten year interval. In this research, 6 linear graphs based on 10 years average rainfall from the Thiessen polygon and another 6 linear graphs from Spline interpolation have been developed and analyzed.
RESULTS AND DISCUSSION
Spatial Variability of Rainfall
The study has analyzed total 60 years rainfall data of Bangladesh by using Thiessen polygon and Spline interpolation methods to represent rainfall variability maps of Bangladesh. Each map contains 10 years rainfall variability that is indicating temporal variability of rainfall of Bangladesh at spatial context. The findings and analysis of these rainfall maps (1953 to 2012) are given below:
Source: BMD, 2013
2. (a) Thiessen polygon output
Source: BMD, 2013
2. (b) Spline interpolation output
Figure 2: Annual Average Rainfall of Bangladesh from the years of 1953 to 1962
Figure 2 indicates rainfall variability of Bangladesh from 1953 to 1962 where lowest rainfall has recorded 42 cm and highest rainfall has recorded as 463 cm. The rainfall is very low at Rajshahi and Chapai-Nawabganj districts, which is increasing towards
SPATIOTEMPORAL VARIABILITY OF RAINFALL IN BANGLADESH: 97
eastward. The middle portion of Bangladesh has faces 280 to 330 cm rainfall that lies at Dhaka and Tangail district by Spline interpolation output map. Therefore, the Thiessen polygon output map represents 280 to 330 cm rainfall from middle portion of country along with north-middle and north-eastern region that have difference from Thiessen polygon output map. The rainfall is remaining constant all middle and north portion of Bangladesh but little decrease has found at eastern part of Sylhet. Rainfall is remaining within 280 to 430 cm at north-eastern zone of the country where the distance of rainfall shades is very low and this occurs due to the presence of hills. The coastal areas are facing 180 to 463 cm rainfall with low variability and lowest portion of rainfall found at Mangrove forest area.
Source: BMD, 2013
3. (a) Thiessen polygon output
Source: BMD, 2013
3. (b) Spline interpolation output
Figure 3: Annual Average Rainfall of Bangladesh from the years of 1963 to 1972
Figure 3 indicates rainfall variability of Bangladesh from 1963 to 1972 where lowest rainfall has recorded 119 cm and highest recorded as 613 cm. Approximately 95 percent area of Rajshahi Division, few areas of Rangpur Division and Khulna Division’s 90 percent area has covered by 119 to 175 cm rainfall at this decade. Thiessen polygon map represents 119 to 175 cm rainfall only Chapai-Nawabganj, Rajshahi, Meherpur, Kushtia, Rajbari, Satkhira and Khulna. Therefore, Spline map
98 ORIENTAL GEOGRAPHER
represents 18 districts totally and approximately 8 districts partially. Spline map represent 340 to 395 cm rainfall in some areas of Taingail district and rest Tangail district faces 285 to 340 cm rainfall. The Thiessen polygon map represents Dhaka, Manikganj, Tangail, Gazipur, Pabna, Sirajbanj and Mymensingh under 340 to 395 cm rainfall shade. Only few part of Khulna Division faces 175 to 230 cm rainfall and this influence extends to lower Mangrove forest area, Chapai-Nawabganj district, most of the places of Rangpur Division and approximately 50 percent area of Sylhet Division. Spline output map represents Sylhet, Moulvibazar and Hobiganj districts are facing rainfall from 230 to 505 cm with low extension due to the impact of north-eastern hills. Therefore, Thiessen polygon output map represents Sylhet, Moulvibazar, Sunamganj, Habiganj and Netrokona districts under 340 to 395 cm rainfall shade that is different from Spline analysis. South coast zone of Barisal Division, Chittagong, Feni, Coxs-Bazar districts are facing rainfall from 230 to 613 cm where Bhola district is facing 580 to 613 cm rainfall. The spatial variability of rainfall at Barisal Division’s coastal area and Chittagong Division’s coastal area is very low for increasing rainfall.
Source: BMD, 2013
4. (a) Thiessen polygon output
Source: BMD, 2013
4. (b) Spline interpolationoutput
Figure 4: Annual Average Rainfall of Bangladesh from the years of 1973 to 1982
The rainfall at coastal zones is rising towards Bay of Bengal at this decade where Mangrove forest area faces only 175 to 285 cm rainfall.
SPATIOTEMPORAL VARIABILITY OF RAINFALL IN BANGLADESH: 99
Figure 4 indicates rainfall variability of Bangladesh from 1973 to 1982 where lowest rainfall has recorded 98 cm and highest recorded as 501 cm. The pattern of rainfall from last 20 years has changed a lot at western half of Rajshahi Division and northern area of Khulna Division. It has covered with 98 to 175 cm rainfall and seen at Sylhet Division’s western part, Dhaka Division’s north-western part and transitional zone of Chittagong and Coxs-Bazar districts by Spline interpolation. Total 14 districts fully and 19 districts partially covered 98 cm to 175 cm rainfal in Spline interpolation map of Bangladesh. Therefore, the scenario is quite different in Thiessen polygon map where large area of Dhaka and another 6 districts of north-western part of Dhaka are covered by 285 to 340 cm rainfall. Sylhet Division and Netrokona district are facing 340 to 385 cm rainfall in Thiessen polygon map that is different from Spline interpolation map. Approximately whole Bangladesh covered with 175 to 285 cm rainfall where Bhola’s coastal zone faces 285 to 340 cm rainfall. The scenario of eastern half of Sylhet Division remains unchanged and low variability where rainfall lies from 285 to 501 cm.
Source: BMD, 2013
5. (a) Thiessen polygon output
Source: BMD, 2013
5. (b) Spline interpolation output
Figure 5: Annual Average Rainfall of Bangladesh from the years of 1983 to 1992
Figure 5 indicates rainfall variability of Bangladesh from 1983 to 1992 where lowest rainfall has recorded 103 cm and highest recorded as 516 cm. This decade indicates
100 ORIENTAL GEOGRAPHER
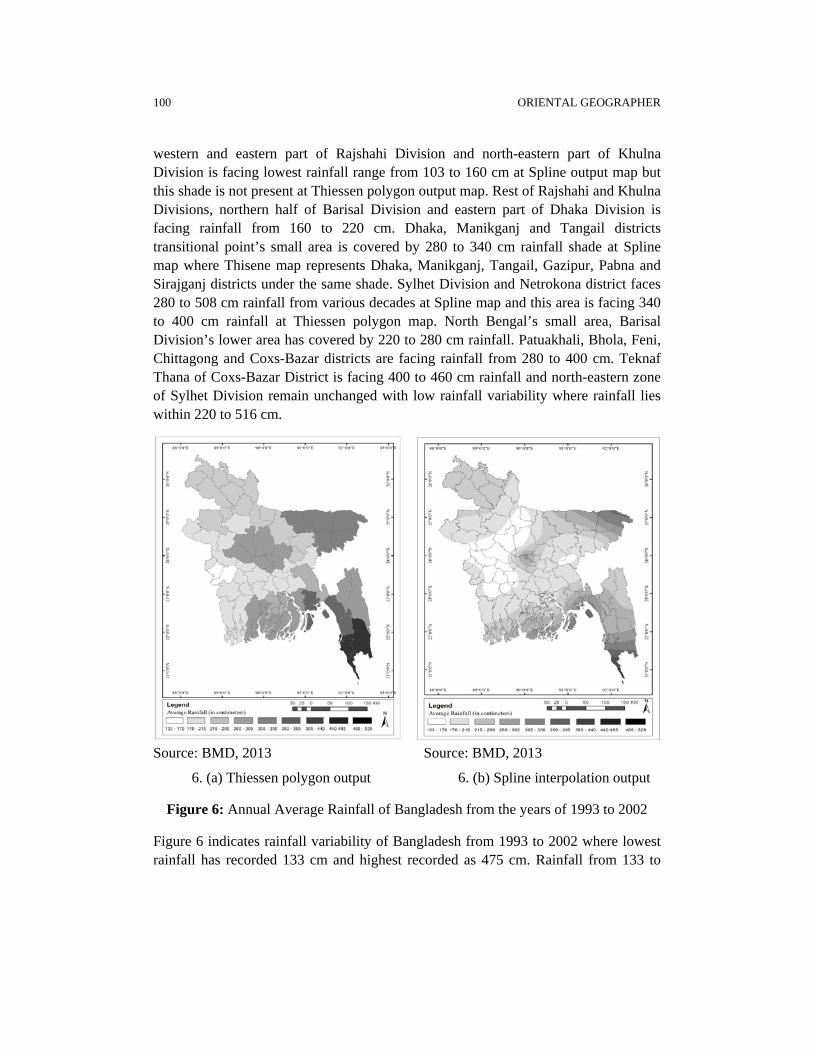
western and eastern part of Rajshahi Division and north-eastern part of Khulna Division is facing lowest rainfall range from 103 to 160 cm at Spline output map but this shade is not present at Thiessen polygon output map. Rest of Rajshahi and Khulna Divisions, northern half of Barisal Division and eastern part of Dhaka Division is facing rainfall from 160 to 220 cm. Dhaka, Manikganj and Tangail districts transitional point’s small area is covered by 280 to 340 cm rainfall shade at Spline map where Thisene map represents Dhaka, Manikganj, Tangail, Gazipur, Pabna and Sirajganj districts under the same shade. Sylhet Division and Netrokona district faces 280 to 508 cm rainfall from various decades at Spline map and this area is facing 340 to 400 cm rainfall at Thiessen polygon map. North Bengal’s small area, Barisal Division’s lower area has covered by 220 to 280 cm rainfall. Patuakhali, Bhola, Feni, Chittagong and Coxs-Bazar districts are facing rainfall from 280 to 400 cm. Teknaf Thana of Coxs-Bazar District is facing 400 to 460 cm rainfall and north-eastern zone of Sylhet Division remain unchanged with low rainfall variability where rainfall lies within 220 to 516 cm.
Source: BMD, 2013
6. (a) Thiessen polygon output
Source: BMD, 2013
6. (b) Spline interpolation output
Figure 6: Annual Average Rainfall of Bangladesh from the years of 1993 to 2002
Figure 6 indicates rainfall variability of Bangladesh from 1993 to 2002 where lowest rainfall has recorded 133 cm and highest recorded as 475 cm. Rainfall from 133 to
SPATIOTEMPORAL VARIABILITY OF RAINFALL IN BANGLADESH: 101
170 cm has found at south-eastern Rajshahi Division, few southern part of Rangpur Division, northern half of Khulna Division, eastern part of Dhaka Division and small southern area of Sylhet Division at Spline output map. Therefore, Thiessen polygon map represents only Chuadanga and Jhenidah districts that symbolize little area by comparing with Spline output map. Approximately same analysis and difference found from 1983 to 1992 decade analyzed maps and 1993 to 2000 decade analyzed maps at Dhaka and its surrounding north-western districts as well as Sylhet Division and Netrokona district. Rainfall from 170 to 215 cm covers north-western area of Rajshahi Division, south-eastern half of Rangpur Division, northern zone of Dhaka Division, south-western zone of Sylhet Division, upper Mangrove forest area and southern half area of Barisal Division. North-western half of Rangpur’ Division, lower Mangrove forest area, middle Sylhet Division, coastal belt of Barisal Division, Rangamati and Khagrachari Districts are covered by 215 to 260 cm rainfall. Rainfall lies at 170 to 440 cm at north-eastern area of Sylhet Division, Bhola and Chittagong District. Bandarban and Cox’s-Bazar districts are facing 440 to 485 cm rainfall shade at Thiessen polygon output map where Spline output map represents 305 to 485 cm rainfall shades that rising at southward. Teknaf is facing highest rainfall of 475 cm and south-eastern corner of this country is facing highest rainfall.
Source: BMD, 2013
7. (a) Thiessen polygon output
Source: BMD, 2013
7. (b) Spline interpolation output
Figure 7: Annual Average Rainfall of Bangladesh from the years of 2003 to 2012
102 ORIENTAL GEOGRAPHER
Figure 7 indicates rainfall variability of Bangladesh from 2003 to 2012 where lowest rainfall has recorded 130 cm and highest recorded as 568 cm. Approximately 80 percent area of Rajshahi Division, 40 percent northern area of Khulna Division and Southern zone of Sylhet Division is facing lowest rainfall of 130 to 180 cm at Spline interpolation output map. Spline output map covered 10 districts full and 14 districts partically at north-western region of Bangladesh under 130 to 180 cm rainfall shade where as Thiessen polygon output map represents only 8 districts at the area under the same shade. Almost total Bangladesh is facing rainfall from 180 to 280 cm and north-eastern zone of Sylhet is facing 280 to 480 cm rainfall. Approximately, same difference of rainfall was found at Dhaka and its surrounding north-western districts as well as Sylhet Division and Netrokona district from 1983 to 1992 periods, 1993 to 2000 periods and 2003 to 2012 periods. The analysis also indicates the characteristics of low spatial variability to increase rainfall. Barguna, Patuakhali, Bhola, Feni, Chittagong and Coxs-Bazar Districts are facing highest rainfall from 330 to 568 cm. South-western zone of Bay of Bengal and Teknaf are facing highest rainfall from 480 to 568 cm and highest rainfall is found at Teknaf. Noakhali and Chittagong are facing 480 to 530 cm rainfall as well as Bandarban and Cox’s-Bazar are facing 530 to 580 cm rainfall where highest rainfall recorded at Saint Martin’s Island as 568 cm at Thiessen polygon Map. Therefore, Spline map represents 330 to 530 cm rainfall shade at Bandarban and Cox’s-Bazar districts that cannot represent the highest 568 cm rainfall and have significance difference from Thiessen polygon map (Table 1).
Table 1: District wise Rainfall of Thiessen Polygon and Spline Interpolation from 1953 to 2012
District 1953-1962 1963-1972 1973-1982 1983-1992 1993-2002 2003-2012
The annual amount of rainfall can analyze through statistical linear graph where the pattern of rainfall and annual fluctuation of rainfall of Bangladesh can be measured through the curve nature. The analysis of different year based rainfall of Bangladesh is representing irregular pattern of rainfall. The graphical representation of rainfall amount of Bangladesh can provide support to GIS based analyzed maps in-depth view. The statistical findings of this study are given below:
Source: BMD, 2013
Figure 8: Annual amount of Rainfall of Bangladesh from 1953 to 1962
Figure 8 indicates that the annual rainfall remain 233.83 cm in 1953 and that can decrease in 1954 with the value of 199.89 cm. It can increase in 1955 with the value of 254.19 cm which indicates abrupt change at rainfall. The annual rainfall pattern remains close in 1955 and 1956 where the rainfall values are staying within 254 to 255 cm. Total 91 cm rainfall decrease in 1957 and it stands on 164.8 cm that leads severe drought at north-western part of the country. Therefore, it can increase in 1958 and 1959 with abrupt condition and the values are 195.13 and 292.02 cm respectively. Moreover, 1959’s condition causes severe flood at low laying floodplain land. Another gradual fall with excessive gap of rainfall also measured from 1959 to 1962
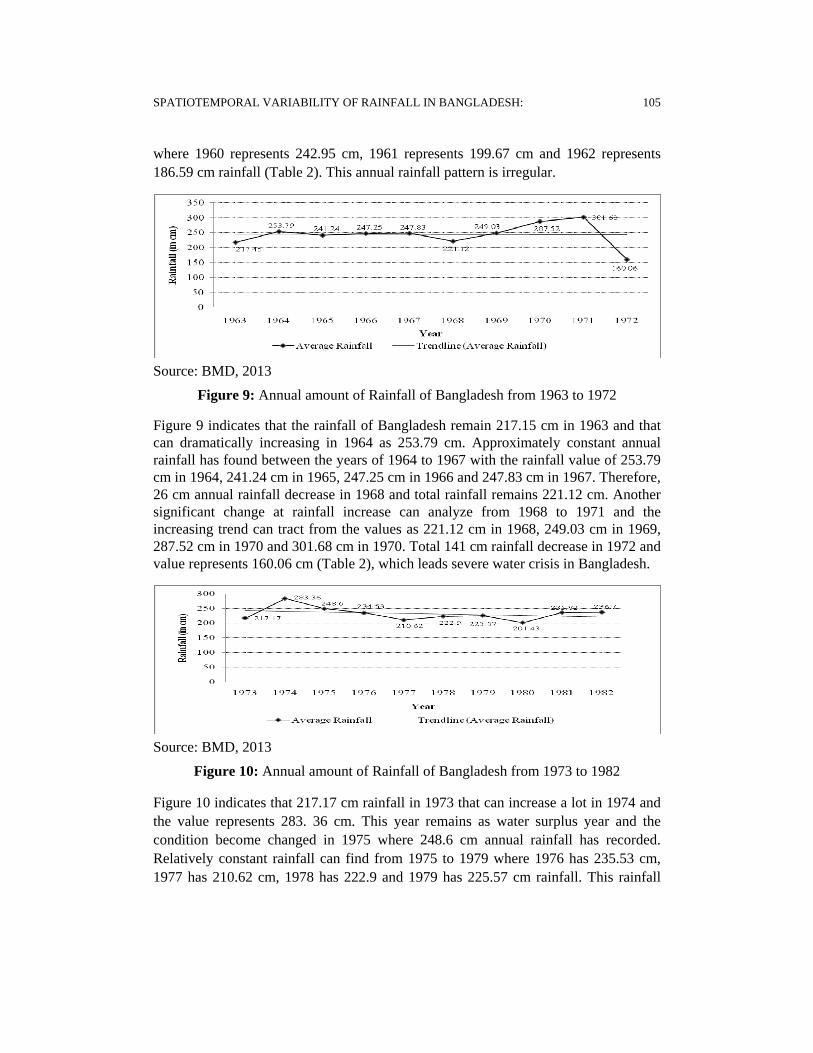
SPATIOTEMPORAL VARIABILITY OF RAINFALL IN BANGLADESH: 105
where 1960 represents 242.95 cm, 1961 represents 199.67 cm and 1962 represents 186.59 cm rainfall (Table 2). This annual rainfall pattern is irregular.
Source: BMD, 2013
Figure 9: Annual amount of Rainfall of Bangladesh from 1963 to 1972
Figure 9 indicates that the rainfall of Bangladesh remain 217.15 cm in 1963 and that can dramatically increasing in 1964 as 253.79 cm. Approximately constant annual rainfall has found between the years of 1964 to 1967 with the rainfall value of 253.79 cm in 1964, 241.24 cm in 1965, 247.25 cm in 1966 and 247.83 cm in 1967. Therefore, 26 cm annual rainfall decrease in 1968 and total rainfall remains 221.12 cm. Another significant change at rainfall increase can analyze from 1968 to 1971 and the increasing trend can tract from the values as 221.12 cm in 1968, 249.03 cm in 1969, 287.52 cm in 1970 and 301.68 cm in 1970. Total 141 cm rainfall decrease in 1972 and value represents 160.06 cm (Table 2), which leads severe water crisis in Bangladesh.
Source: BMD, 2013
Figure 10: Annual amount of Rainfall of Bangladesh from 1973 to 1982
Figure 10 indicates that 217.17 cm rainfall in 1973 that can increase a lot in 1974 and the value represents 283. 36 cm. This year remains as water surplus year and the condition become changed in 1975 where 248.6 cm annual rainfall has recorded. Relatively constant rainfall can find from 1975 to 1979 where 1976 has 235.53 cm, 1977 has 210.62 cm, 1978 has 222.9 and 1979 has 225.57 cm rainfall. This rainfall
106 ORIENTAL GEOGRAPHER
moderately decreased in 1980 and annual rainfall value represents 201.43 cm rainfall. Therefore, the rainfall can increase with abrupt nature in 1981 with the value of 235.82 cm annual rainfall and this trend remains constant for 1982 with the value of 236.7 cm rainfall (Table 2).
Source: BMD, 2013
Figure 11: Annual amount of Rainfall of Bangladesh from 1983 to 1992
Figure 11 represents excessive rainfall in 1983 with 301.4 cm rainfall that leads flood and this scenario can turn as water deficit scenario within next 2 years. Rapid decrease of 82 cm rainfall within 2 years is leading drought severity with 260.5 cm rainfall in 1984 and 219.52 cm rainfall in 1985. The scenario become totally opposite in next two years where 288.36 cm rainfall occur in 1986 and 329.27 cm rainfall occur in 1987, which leads 110 cm rainfall increase between these years. Again abrupt decrease of rainfall has measured where 1988 contains 263.15 cm and 1989 contains 240.6 cm rainfall. This scenario can change again with gradual increase of rainfall in 1990 by 250.19 cm and 276.58 cm in 1991. Therefore, 73 cm annual rainfall decrease in 1992 with value 203.06 cm and the country faces huge water scarcity at summer (Table 2).
Source: BMD, 2013
Figure 12: Annual amount of Rainfall of Bangladesh from 1993 to 2002
SPATIOTEMPORAL VARIABILITY OF RAINFALL IN BANGLADESH: 107
Table 2: Yearly Average Rainfall in Bangladesh from 1953 to 2012 of Thiessen Polygon and Spline Interpolation
Figure 12 indicates 234.88 cm rainfall in 1993, which has sign for good agricultural
activity and low flood severity. It can decrease 63 cm rainfall in a year and represents
171.28 cm rainfall in 1994. Moreover, 93 cm rainfall increase in 1995 and the value
represents 264.32 cm rainfall that can decrease in 1996 with 240.44 cm rainfall. This
scenario is indicating to increase 21 cm rainfall in 1997 with the value of 261.91 cm
rainfall. Total 66 cm rainfall increase in 1998 with the value of 317.79 cm rainfall and
this year is one of the most vulnerable flood years of Bangladesh due to excessive
rainfall. Gradual decrease of rainfall found in 1999 with the value of 298.14 cm but
this situation cannot last long. Therefore, total 60 cm rainfall decrease in 2000 and
provide 238.01 cm rainfall (Table 2), which neither leads flood nor drought. Total 21
cm rainfall decrease in 2001 and the value represent 217.95 cm but abrupt increase of
rainfall found in 2002 with 278.49 cm rainfall and leads flood through excessive
rainwater supply.
Figure 13 indicates 200.7 cm rainfall in 2003 and excessive rainfall has found in 2004 with 305.46 cm rainfall, which leads 105 cm annual rainfall increase. The rainfall of 2005 remains 295.91 cm and it can dramatically decrease in 2006 with 88 cm rainfall and yearly value represents 207.34 cm rainfall. Moreover, total 97 cm rainfall increase in 2007 and representing this year as flood caused year with the value of 304.53 cm rainfall. Total 32 cm rainfall decrease in 2008 that leads 272.46 cm rainfall presence at that year. Total 266.76 cm rainfall found in 2009, where 65 cm rainfall decrease in
108 ORIENTAL GEOGRAPHER
Source: BMD, 2013
Figure 13: Annual amount of Rainfall of Bangladesh from 2003 to 2012
2012 and the value represents 201.1 cm. Total 66 cm rainfall increase in 2011 and leads flood due to the presence of rainfall at 267.07 cm. Total 31 cm rainfall decrease in 2012 with value 236.97 cm and thus can lead the annual rainfall amount is irregular (Table 2).
Source: BMD, 2013
Figure 14: Average amount of Rainfall of Bangladesh from 1953 to 2012
Figure 14 represents the average of rainfall of 10 years can represent by a point and to represent 60 years rainfall variability through 6 points for linear graph analysis. The years of 1953 to 1962 experienced average 217.14 cm rainfall that is very low. The increase of 30 cm rainfall can measure within the years of 1963 to 1972 that can represent abrupt change of rainfall. The rainfall average within the years of 1973 to 1982 can decrease and the value represents 228.79 cm. This context is indicating 28 cm increase of rainfall from 10 years average rainfall data. Therefore, the rainfall of
SPATIOTEMPORAL VARIABILITY OF RAINFALL IN BANGLADESH: 109
1983 to 1992 represents 256.52 cm, 1993 to 2002 represents 253.76 cm and 2003 to 2012 represents 256.91 cm and their difference is low (Table 2). Their annual rainfall amount is representing abrupt change at both increasing and decreasing views within the years of 1983 to 2012 that cannot represent properly by average points of 10 years interval data findings.
CONCLUSION
Bangladesh is facing rainfall variability due to the local, regional and its nighbouring climatic characteristics. North-western zone of Rajshahi Division of Bangladesh is dry because of low rainfall occur almost all the years of study period. North-western part of Khulna Division and south-western part of Rangpur Division are also dry due to low rainfall. North-eastern hilly area of Sylhet Division remains dense vegetative area due to excessive rainfall and this scenario is also same for coastal regions especially Bhola, Chittagong and Coxs-Bazar Districts. Patuakhali and Barguna district’s coastal zone and Tangail’s Bhawal area are facing medium rainfall. The temporal rainfall pattern is also important for understanding climatic condition of Bangladesh. According to the analysis of 60 years rainfall data the average total rainfall has increased in Bangladesh. But the pattern is not uniform, therefore some region is facing drought and on the other hand some region facing excessive flood. This irregular pattern of rainfall can help national policy makers to develop annual crops calendar and disaster management functions.
REFERENCES
Anuforom, A. C. (2004). Rainfall variability and its impact on yield of millet and yam in
Nigeria, paper presented at the 30th International Post Graduate Course at the WMO
Regional Training Center, Bet-Dagan.
Ayanlade, A. (2009). Seasonal rainfall variability in Guinea Savanna part of Nigeria: a GIS
approach, International Journal of Climate Change Strategies and Management, Vol. 1
Issue: 3, pp. 282-296.
Bangladesh Bureau of Statistics (BBS). (2005a). Compendium of Environment Statistics of
Bangladesh. Dhaka, Bangladesh, Government of the People’s Republic of Bangladesh.
Bangladesh Bureau of Statistics (BBS). (2005b). Year Book of Agricultural Statistics of
Bangladesh, 2004. Planning Division, Ministry of Planning. Government of the
People’s Republic of Bangladesh, Dhaka, Bangladesh.
110 ORIENTAL GEOGRAPHER
Bangladesh Meteorological Department (BMD). (2013). Temperature and Rainfall Data.
Ministry of Defense, Government of the People’s Republic of Bangladesh, Dhaka,
Bangladesh.
Bollen, J. and Van de Sompel, H. (2006). Mapping the Structure of Science through Usage,
Scientometrics, Vol. 69 No. 2, pp. 227-58.
Clifford, N., French, S. and Valentine, G. (2010). Key Methods in Geography, Sage
Publication.
Creswell, J. W. (2014). Educational Research: Planning, Conducting, and Evaluating
Quantitative and Qualitative Research (5th Edn.), Pearson Education.
Daly, C., Gibson, W. P., Doggett, M., Smith, J. and Taylor, G. (2004). Up-to-date Monthly
Climate Maps for the Conterminous United States, Proceedings of 14th AMS
Conference on Applied Climatology, 84th AMS Annual Meeting Combined Preprints,
January 13-16, American Meteorological Society, Seattle, WA, Paper 5.1.
Dore, M. H. I. (2005). Climate Change and Changes in Global Precipitation Patterns: What Do
We Know?. Environment International, Vol. 31, pp. 1167–1181.
IPCC (Intergovernmental Panel on Climate Change). (2007). The Regional Impacts of Climate
Change: An Assessment of Vulnerability. IPCC Special Report, Bangladesh.
Islam, M. N. (2009). Rainfall and Temperature Scenario for Bangladesh, The Open
Atmospheric Science Journal, Vol. 3, pp. 93-103.
Kothari, C. R. (2009). Research Methodology: Methods and Techniques (2nd Revised Edn.),
New Age International Publishers, Delhi, India.
Kumar, R. (2011). Research Methodology: A Step-by-Step Guide for Beginners (3rd Edn.),
Sage Publication.
Liu, Y. and Rousseau, R. (2012). A Continuous Description of Discrete Data Points in Informetrics: Using Spline Functions, Aslib Proceedings, Vol. 64 Iss: 2, pp. 193 – 200.
Liu, Y. X. and Rousseau, R. (2011). Splines can Recover Dynamic Information Contained in Discrete Data, in Noyons, E., Ngulube, P. and Leta, J. (Eds), Proceedings of the ISSI 2011 Conference, University of Zululand, Durban, pp. 1022-4.
Maxwell, J. A., Creswell, J. W. and Stringer, E. T. (2009). Research Design Bundle: Qualitative, Quantitative, and Mixed Methods Approaches (2nd Edn.), Sage Publication.
Rashid, H. E. (1991). Geography of Bangladesh. University Press Ltd, Dhaka.
Sabir, H., Campbell, D. and Archambault, E. (2010). Spline fitting tool for scientometric Applications: Estimation of Citation Peaks and Publication Time-lags, Eleventh International Conference on Science and Technology Indicators, Book of Abstracts, Leiden, pp. 231-2.
Saunders, M., Lewis, P. and Thornhill, A., (2009). Research Methods for Business Students, (5th Edn), Prentice Hall, Essex.
SPATIOTEMPORAL VARIABILITY OF RAINFALL IN BANGLADESH: 111
Shaw, R. (2012). Water: Water, Communities and Disasters, Chapter 2, Inter-linkages, in Rajib Shaw, Phong Tran (ed.) Environment Disaster Linkages (Community, Environment and Disaster Risk Management, Volume 9), pp. 17-33.
Tveito, O. E. and Schoner, W. (eds) (2002). Applications of Spatial Interpolation of Climatological and Meteorological Elements by the Use of Geographical Information Systems (GIS), KLIMA, Nos. 28/02, Oslo.
Wang, B. and Ho, L. (2002). Rainy Season of the Asian-Pacific Summer Monsoon, Journal of Climate, Vol. 15, pp. 386-98.
Wilson, J. (2010). Essentials of Business Research: A Guide to Doing your Research Project (1st Edn.), Sage Publication.